The Impact of Location-Based Service Factors on Usage Intentions for Technology Acceptance: The Moderating Effect of Innovativeness


1
School of Business Administration, Kyungpook National University, Daegu 41566, Korea
2
School of Business, Hanyang University, Seoul 04763, Korea
*
Author to whom correspondence should be addressed.
Sustainability 2018, 10(6), 1876; https://doi.org/10.3390/su10061876
Submission received: 31 March 2018
/
Revised: 31 May 2018
/
Accepted: 1 June 2018
/
Published: 5 June 2018
(This article belongs to the Section Economic and Business Aspects of Sustainability)
Abstract
:This study presents features of location-based services (LBS) that influence usage intentions in users and the moderating effects of innovativeness for LBS in sustainable mobile-related industries. As LBS attributes, this study identifies location awareness, reputation, trust, and entertainment. This study model is developed based on technology acceptance behavior (TAB) and is applied to LBS users to identify LBS usage intention factors and TAB perspectives. Research measures are identified and examined on 220 LBS users. The study results are discussed to explore significant factors affecting LBS technology acceptance intentions. The results show that LBS users are more likely to adopt LBS with features of location awareness, reputation, trust, and entertainment. In addition, user attitudes toward LBS are found to play a significant positive role, as are user usage intentions. The moderating effects of personal innovativeness on the relationship between reputation, trust, and entertainment and user attitudes toward LBS are found to be insignificant. The implications for theory and practices are discussed.
1. Introduction
Recent advances in mobile related technologies are leading to the next generation of sustainable mobile commerce (m-commerce) applications. Also, environmental problems have emerged as an important issue due to rapid technological development. To resolve these problems, countries and companies around the world are interested in environmental preservation and making environmentally friendly and sustainable technology products and/or services. Location-based services (LBS) play an important role in eco-friendly business activities of the technology industry and continuously strive to gain added value and competitive advantage by developing energy-saving techniques and responding to climate change. The development of m-commerce technologies, such as global positioning systems and mobile data tracking, has not only provided consumers with unprecedented access to network services while on the move, but has also enabled the localization of such services, which include asset tracking, directory and city guides, emergency services, entertainment, navigation, location-sensitive billing and location-based advertising services, risk- and safety-related services, and traffic updates [1]. The number of m-commerce users is increasing rapidly as m-commerce applications provide more and more services, including mobile Internet access, along with excellent multimedia processing performance. In particular, the location-based service (LBS) sector, which is continually developing mobile applications for smartphones, is receiving significant research attention in this m-commerce industry.
Location-based services (LBSs), which are offered through mobile devices based on their geographical location, typically provide information, entertainment, tracking, maps and navigation, safety and emergency response options, social networking, commerce, and advertising. Most studies have focused on the privacy concerns of LBS, especially the effects of privacy concerns on user behavior. However, some authors have examined commitment and behavioral intentions to use mobile LBS, user intention to disclose personal information, and intention to use LBS along with usage intent within LBS. Some previous studies explore location-related problems such as location-aware service optimization [2], news apps [3], service center location planning [4], and typhoon hazard location information services [5]. However, little empirical research uses the technology acceptance model (TAM) to examine user attitudes toward LBS and usage intentions [6,7,8,9,10].
The purpose of this study is to explore the LBS attributes that affect LBS usage intentions in users by way of the TAM. Based on four LBS attributes (location awareness, reputation, trust, and entertainment), TAM is theoretically justified as influencing users’ attitudes. Indeed, the research TAM was developed and empirically examined for this reason. The model uses responses about consumers’ intention to use LBS services and products. The specific goals of this study are three-fold. The first goal is to confirm the importance of LBS attributes including location awareness, reputation, trust, and entertainment. Second, to investigate the relationships among these attributes, user attitudes, and usage intentions. Finally, to view LBS as innovative, and therefore, to investigate the moderating role of personal innovativeness in the relationship between these LBS attributes and user attitudes toward LBS. Specifically, this study (1) identifies various LBS attributes (location awareness, reputation, trust, and entertainment) for LBS users; (2) investigates relationships among the identified LBS attributes, user attitudes, and usage intentions in LBS users; and (3) examines the moderating role of personal innovativeness in the relationships among the LBS attributes and user attitudes toward LBS.
Recent sustainability focuses on the process of innovation in which the utilization of resources, the way of investments, and the direction of technological development transform both current and future approaches to realize various needs and desires of human beings. Thus, study findings will offer LBS providers significant strategic insights for influencing the TAB of potential users for location-based services in sustainable mobile-related industries and other similar technological development settings.
2. Theoretical Background
2.1. Location-Based Services
Location-based services (LBSs) are software-level services that leverage the location data of users to control features. As the use of smartphones has spread rapidly, LBSs have also grown. Currently the most widely used LBSs are maps, navigation services, or nearby information searches. Also a function of ubiquitous smartphone use, there are several types of smartphone-based advertisement models including message advertising, banner advertising, search advertising, pop-up advertising, mobile coupon advertising, and location-based advertising. Following the viewing of certain advertisements, customers have been shown to buy items such as clothes, shoes, and sporting goods, to initiate movie and concert reservations, to use coupons, and to purchase cosmetics. Previous studies suggest that consumers use LBS not only for navigation, but also for location game play (e.g., geocaching) and social networking (i.e., location-based mobile social networking applications, such as Foursquare).
LBSs include geosocial services, geoadvertising, and geoinformation services. Seventy-four percent of smartphone owners use location-based services. These services are global positioning system (GPS) technologies that enable mapping services on smartphones. Geosocial services can tell you where your friends are meeting. Geoadvertising services can tell you where to find the nearest Italian restaurant to suit your craving, and geoinformation services can tell you the price of the dream house you are seeking. Wikitude.me, Foursquare, and Loopt, together with new offerings from Facebook and Google are examples of LBSs [11].
Raschke et al. [12] focuses on privacy beliefs using the privacy calculus theory—namely, privacy risk and privacy protection beliefs—for LBS. Specifically, that research indicates that concerns around information privacy consist of four sub-constructs including data collection, errors, unauthorized use, and improper access. The research offers a conceptual framework for the impact of concerns about information privacy components on behavioral intentions in users to disclose information. Xu et al. [13] examined the personalization–privacy paradox by using the privacy calculus model. They suggested that the impact of personalization on privacy risk/benefit beliefs varies by type of personalization system, and that personal attributes moderate the parameters and path structure of the privacy calculus model. Zhou [14] investigated the impact of privacy concerns on LBS user adoption. The study found that among the four dimensions of privacy concerns, information collection and secondary use are the main factors affecting perceived risk by users, whereas information errors are the main factor affecting trust in users. Moreover, trust affects perceived risk, and both factors—perceived risk and trust—determine usage intention. Palos-Sanchez [15] used the TAM to highlight the social and environmental benefits of LBS. The study results indicate that users are willing to accept LBS services due to trust in privacy features and the major social and environmental benefits of LBS for users.
2.2. Technology Acceptance
The technology acceptance model (TAM) is a widely accepted theory that aims to facilitate understanding of how users accept and use new technologies. Although the original TAM was specifically designed to explain computer usage and user behavior, the model has since been evolved to explain technology use in various contexts. This model offers a useful theory for technology acceptance, positing that the effects of external variables on users’ intentions are mediated by perceived usefulness and perceived ease of use on the part of potential users about new technologies [16]. Some studies on technology acceptance have evolved to various modified models such as the unified theory of acceptance and use of technology (UTAUT) [17], Almere TAM [18], and the senior technology acceptance model (STAM) [19]. Numerous studies have validated technology acceptance behaviors (TAB) in users for many aspects [20,21]. The adoption of new technology is often associated with positive attitudes toward the offering, usage intention, and user satisfaction. Moreover, user attitudes are presumed to mediate the effects of the perceived attributes of a service, and thus influence user intentions to use or reuse a service. These relationships are widely explored in technology acceptance theories [22].
Recently, various TAB studies have been used in a number of field studies, including studies of factors related to the usage intentions of online consumers [23], the willingness of consumers to use mobile commerce [24], consumer usage intentions in the context of social media [25], consumer usage intentions for mobile devices [26], and user usage intentions regarding personalized business modes [27]. According to TAB, the use of technology is determined by people's behavioral intentions, which are determined by their attitudes toward technology. When TAB is applied to the context of mobile location-based advertising (LBA), it can be assumed that people will have an intention to accept LBA if they take a favorable attitude towards LBA [28].
2.3. Personal Innovativeness
Personal innovativeness is the willingness of an individual to try any new technology. Innovators and early adopters deal with higher levels of uncertainty. Individuals who display high levels of personal innovativeness are more likely to take risks in experimenting with new technology. Personal innovativeness implies an individual’s tendency to accept innovation more quickly than others. Innovative individuals are relatively more important in the marketplace because they purchase new products, take risks, and act as opinion leaders in encouraging the spread of new technologies [29].
The results of practical studies on the acceptance of information systems report that personal innovativeness affects the acceptance of information technology, Internet shopping, mobile radio-frequency identification (RFID) services, and LBS. In verifying whether personal innovativeness has moderating effects on the relative advantages of new tech, on ease of use, and on compatibility, Agarwal and Prasad [30] shows that innovativeness has a moderating effect only on compatibility. Citrin et al. [31] studied the moderating role of customer innovativeness on the adoption of Internet shopping. That research suggests that a domain-specific measure of innovativeness is a moderator between general Internet usage and the adoption of Internet shopping. Jeong et al. [32] investigated perceived need and purchase intentions among users for mobile-RFID services, as well as the moderating role of personal innovativeness. The authors found that personal innovativeness is a moderator in the relationship between perceived need and purchase intention.
This study includes three control variables that may influence user purchase intentions in LBS including user gender, age, and education level. First, prior studies have shown that gender and age have a significant impact on users’ acceptance of technology [33]. Yoon and Occena [34] found that gender and age are significant predictors of trust in consumer-to-consumer e-commerce. Second, the literature suggests that shoppers’ gender and level of education may affect their intentions to purchase items on the Internet [35]. Therefore, gender, age, and education level are added as control variables for usage intentions in LBS.
3. Research Model and Hypotheses
3.1. Research Model
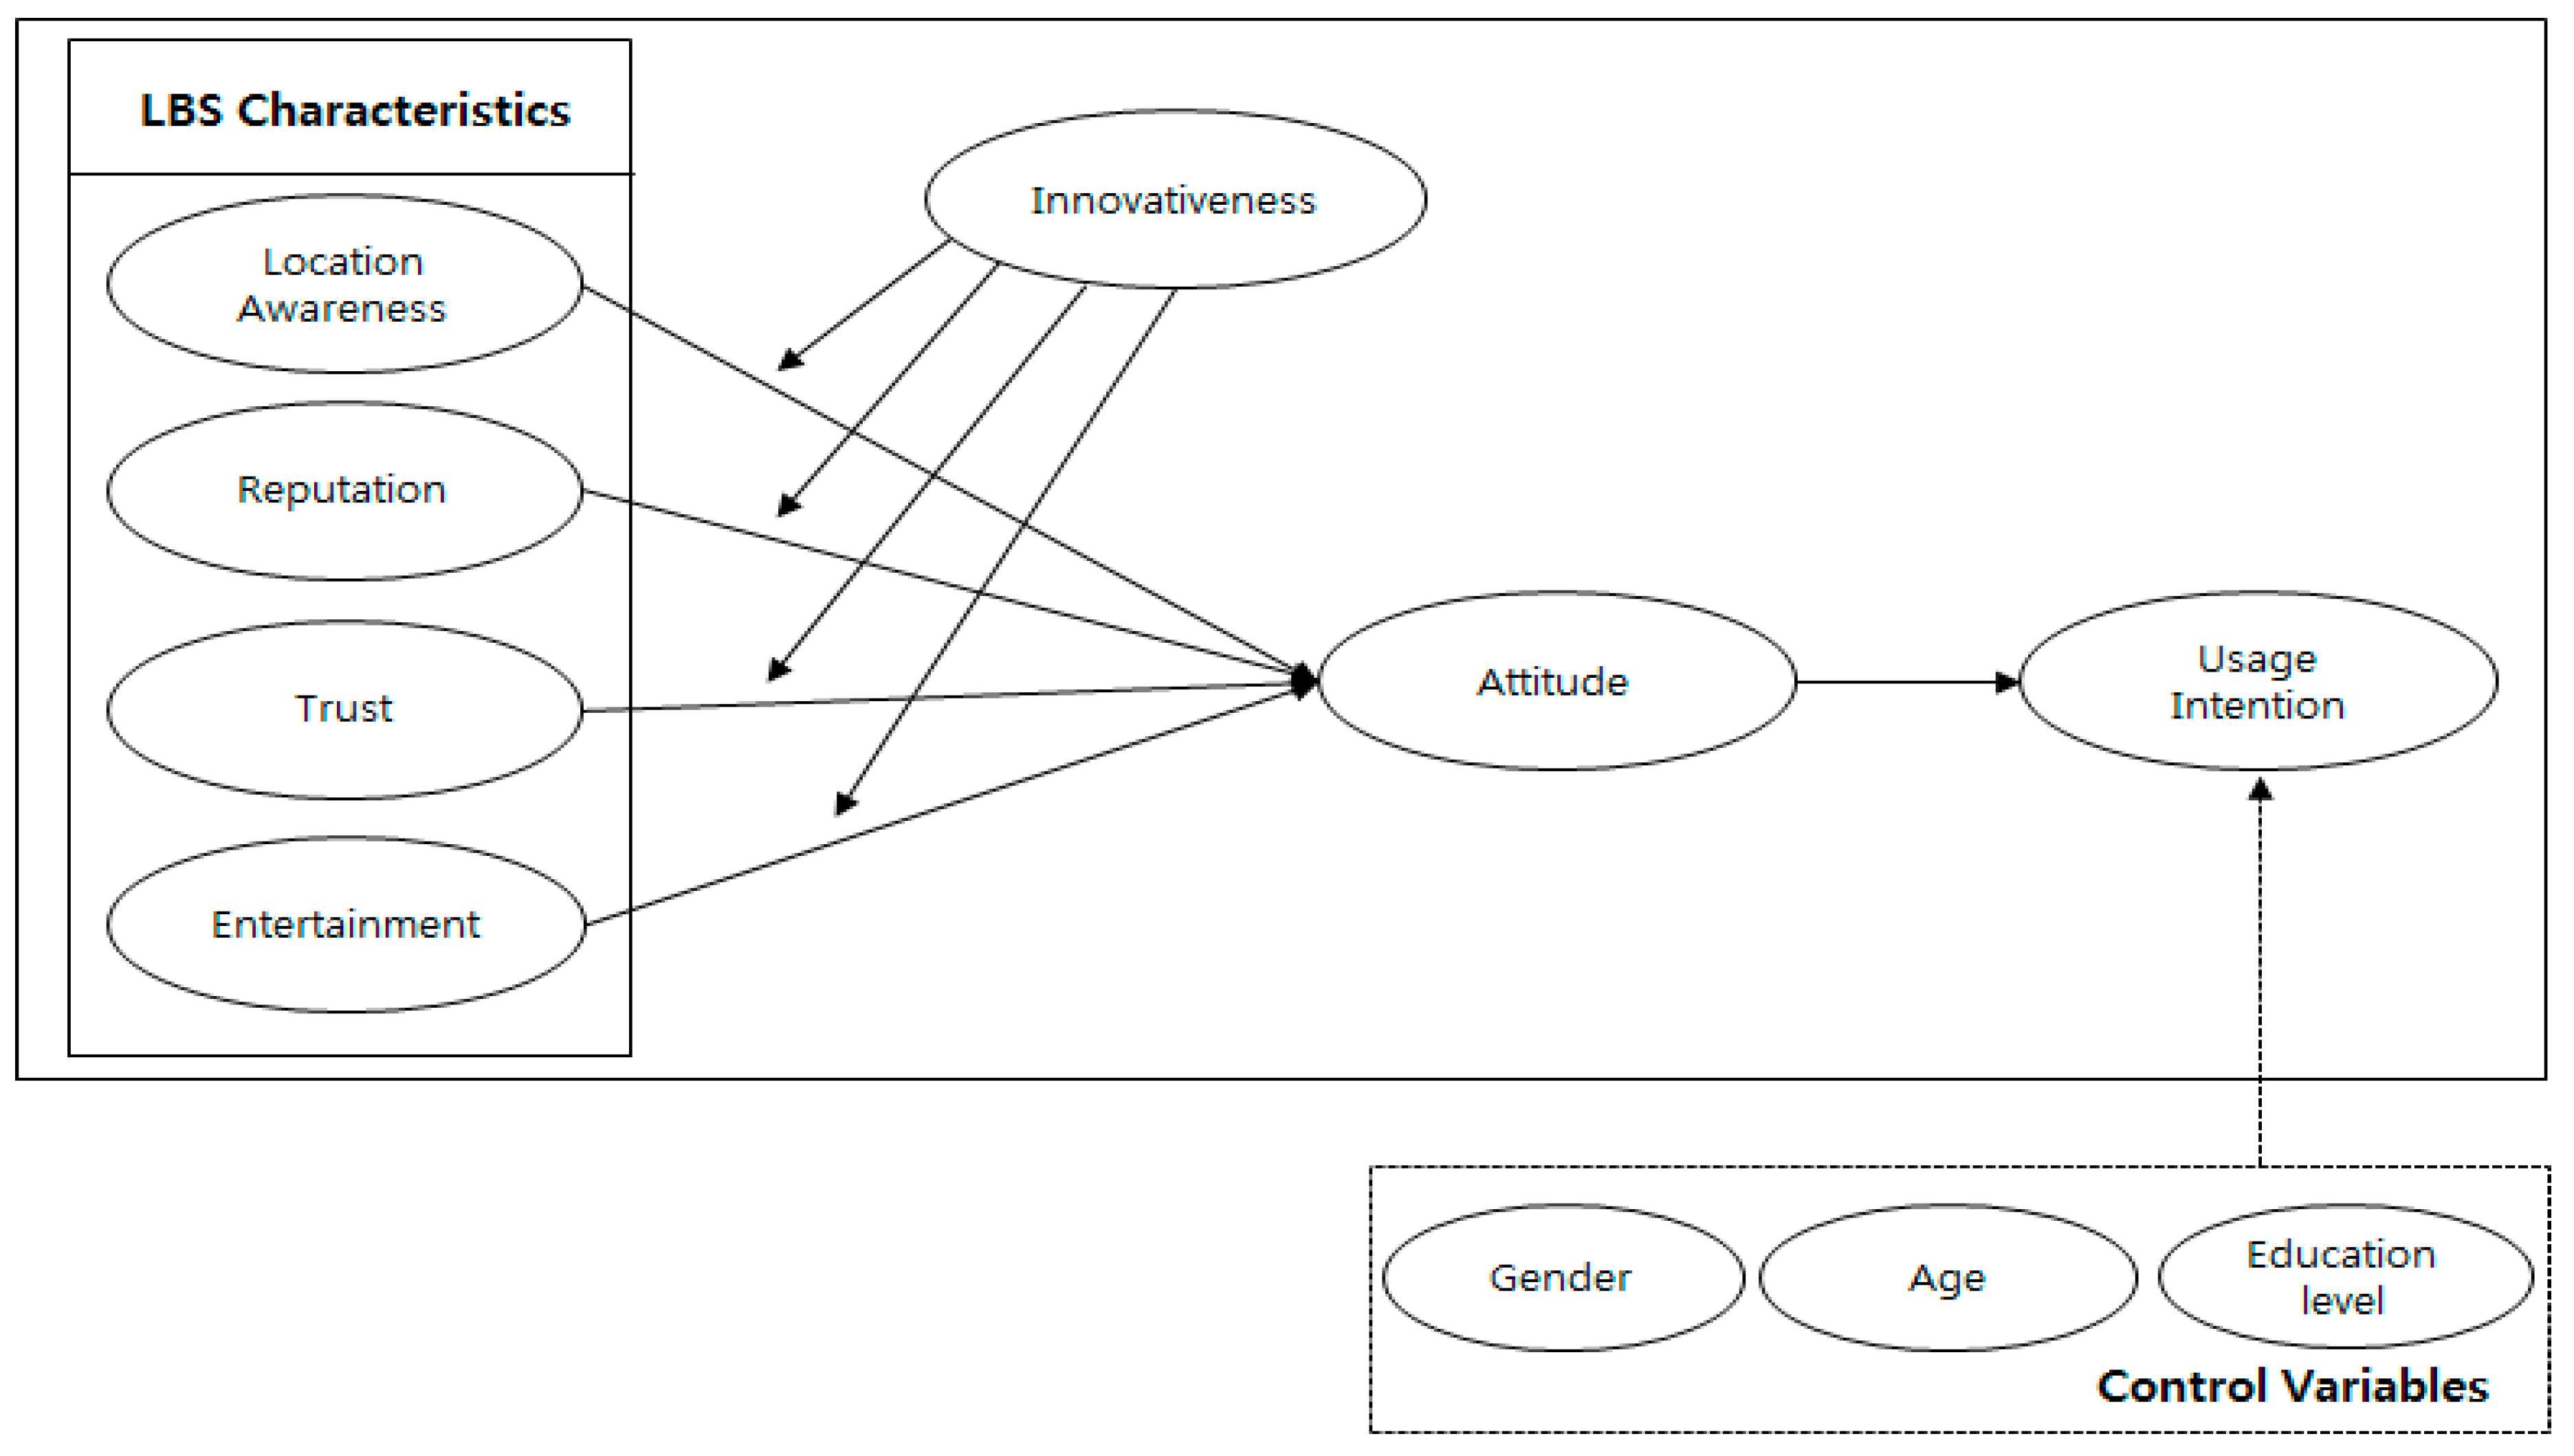
Figure 1 shows a research model design that provides the strategic rationale for including LBS attributes in the analysis of user usage intentions. Based on models such as TAM, Almere TAM, STAM, the present study has linked LBS attributes to an integrated model of technology acceptances behaviors (TAB) and modified technology acceptance and assesses their impact on user usage intentions in the context of LBS. The research model introduces four variables—location awareness, reputation, trust, and entertainment—which are representative LBS attributes. These variables are expected to directly influence user attitudes toward LBS technologies. In addition, the research model further extrapolates user attitudes to verify usage intention in the context of LBS.
3.2. Research Hypotheses
3.2.1. LBS Attributes
Location-based services (LBSs) are mobile application-level services that assimilate an estimate of a mobile device’s location with other information to provide some features to users. Users of such services can access the mobile Internet to obtain information and services at anytime from anywhere. This study identifies location awareness, reputation, trust, and entertainment as LBS attributes.
Telecommunications network operators facilitate location awareness for mobile phones. Positioning and timeliness enable location awareness, which attracts consumers who are willing to provide basic information in exchange for flexible access to customized location-based information anytime and anywhere. In the LBS context, location awareness plays a significant role in increased privacy concerns, but adds value for customers desiring information or services at the right time in the right ways. There are two categories of LBS including location-tracking and location-aware services. Location-tracking services are perceived to be more beneficial and convenient to use than location-aware services, and thereby are considered more efficient [36,37]. Accordingly, the following hypothesis is developed to identify the effects of location awareness on users’ attitudes toward LBS.
H1.
Location awareness is positively associated with attitude.
A positive reputation is defined as the degree to which users believe that a service provider is honest and concerned about its users. Previous studies have found that a firm’s reputation is an intangible value requiring a long-term commitment of resources, effort, and attention to customers on the firm’s part. Creating a positive reputation is particularly important for companies to be successful. Reputation is the degree to which a customer believes that by engaging with a brand/company/service, the customer’s own reputation may be enhanced through knowledge sharing. It has been suggested that reputation positively influences attitudes toward blogs, and that reputation has knowledge sharing motivational factors. Corporate reputation positively influences attitude toward products, and in turn, attitude positively influences user usage intentions [38,39,40]. Thus the following hypothesis is developed to identify the effects of reputation on user attitudes toward LBS.
H2.
Reputation is positively associated with attitude.
Trust has been significantly studied in various academic fields, and it is understood that trust is generally important in the adoption of new technologies such as the web, e-commerce, and LBS. Existing empirical research has revealed that trust is significantly related to consumer attitudes, and that attitudes positively influence usage intention. Customers’ trust in an Internet store positively influences favorable attitudes toward shopping at that store. E-shopping quality, enjoyment, and trust factor into the TAB to facilitate our understanding of customer acceptance of e-shopping. Perceived trust has a positive influence on consumer attitudes toward e-shopping. Trust has a significant effect on customer attitudes toward online purchasing on business-to-consumer websites. Trust building is particularly important for e-service providers, as it improves the attitudes and usage intentions of users. Research to determine the factors of user acceptance of airline business-to-customer e-commerce websites has found that trust has a positive effect on perceived usefulness, perceived ease of use, and usage intention to engage in an e-commerce transaction [41,42].
Trust is a key factor in the mobile environment. This finding is particularly true for service users with LBS and mobile commerce on their smartphones, insofar as users naturally wonder whether LBSs truly represent their interests or those of the service providers. Trust facilitates users to believe that LBS providers will offer favorable outcomes in the future. Trust negatively affects perceived risk and positively affects usage intention in the adoption of LBS. Hence, building trust is particularly important for LBS providers as trust enhances users’ attitudes and usage intentions. In the context of mobile advertising, research suggests that perceived trust improves user attitudes toward advertisements [43]. Thus a related hypothesis is developed to identify the effects of trust on attitudes toward LBS.
H3.
Trust is positively associated with attitude.
Entertainment is the capability to advertise LBS to stimulate enjoyment and build positive customer attitudes by providing a pleasant diversion, enjoyment, or emotional release. Entertaining—or likable—advertising is thought to have a positive impact on user attitudes toward brands. An advertising value model was empirically tested by using online data collected in New York City. The study finds that perceived entertainment directly influences attitudes toward web advertising in focusing on perceived effectiveness of text versus multimedia LBS messaging. The study suggests that entertainment, informativeness, and irritation levels have positive effects on usage and usage intentions in consumers. Entertainment positively influences intention to use. Entertainment and information are enablers of mobile marketing [44,45,46]. Thus a related hypothesis is developed to identify the effects of entertainment on attitudes toward LBS.
H4.
Entertainment is positively associated with attitude.
3.2.2. Attitudes and Usage Intention
According to the TAB, attitudes toward using a service have significant effects on intention to use. The extended technology acceptance studies describe user attitudes, intentions, and behavior toward technologies. In the context of the Internet, attitudes positively influence customers’ online usage intentions. Favorable attitudes toward an Internet store positively influence customer willingness to buy from that store. User attitudes toward products have a significant effect on usage intentions in peer communication on social media [47]. The more positive a user’s attitude toward a mobile phone location-based advertising message, the higher their level of usage intention [48]. Thus a related hypothesis is developed to identify the effects of attitudes on usage intention for LBS.
H5.
Attitudes are positively associated with usage intention.
3.2.3. Moderating Effects of Personal Innovativeness
Personal innovativeness can be considered a moderator of the relationship between LBS attributes and attitudes toward LBS. Personal innovativeness is defined as the willingness of a user to experience new technology. Personal innovativeness serves as a key moderator of technology acceptance behavior.
As a moderator of the antecedent of perceptions about new tech, an individual with higher levels of personal innovativeness is expected to have more positive intentions to use new IT. Personal innovativeness has a moderating effect on the acceptance of e-commerce. The moderating effects of personal innovativeness on the relationship between privacy concerns and behavioral intentions have been investigated, and research has found that these moderating effects are insignificant [45]. Therefore, the following hypotheses are developed to examine the moderating effects of personal innovativeness on the relationship between LBS attributes (location awareness, reputation, trust, and entertainment) and user attitudes toward LBS.
H6.
Higher levels of personal innovativeness can strengthen the relationship between location awareness and attitudes toward LBS.
H7.
Higher levels of personal innovativeness can weaken the relationship between the reputation of an LBS firm and attitudes toward LBS.
H8.
Higher levels of personal innovativeness can strengthen the relationship between trust and attitudes toward LBS.
H9.
Higher levels of personal innovativeness can weaken the relationship between entertainment and attitudes toward LBS.
4. Research Method
4.1. Sampling Procedures
To assess the research model presented in Figure 1, the target population for the study was LBS users in South Korea. Because the number of these users has rapidly increased in recent years, the sample represents a large and diverse population, thereby increasing the validity of results. A survey form was developed based on the constructs for the study model. Respondents were asked to indicate LBS performance based on their usage experience. The survey included items for location awareness by asking respondents to indicate the degree of information/services provided to LBS users, reputation (respondents were asked to indicate the degree of perceived honesty among LBS providers), trust (respondents’ degree of faith in LBS), entertainment (customer feelings around using LBS), attitudes (the degree to which users think positively about LBS), usage intentions, and personal innovativeness (users’ degree of willingness to try LBS). The questionnaire was developed using a seven-point Likert scale (from 1 = strongly disagree to 7 = strongly agree). The research instrument has multiple items that are measured and includes typical demographic information about respondents. Review panels were selected and the initial questionnaire was reviewed and pre-tested at meetings with pre-selected experts. Following the pre-test, the survey form was revised to improve clarity. Then, the survey for this empirical study was administered to individual respondents.
Data collection was initiated to individuals living in Daegu metropolitan and its vicinity areas in South Korea. Researchers contacted users and explained LBS. Users who have experienced LBS were asked to fill out the questionnaire. Most survey studies face a difficult task to administer the questionnaires to the right person. Multidimensional survey methods using a convenient and judgement sampling procedure were utilized to collect data to examine this empirical study. Convenient and judgement sampling, a type of non-probability sampling, provides a benefit to collect the sample that is close to hand but has inherited bias. However, such bias can be overcome by proper statistical methods. Three hundred questionnaires with a cover letter were distributed via e-mail and/or fax. Two follow-up e-mails made 231 responses (response rate of 77%). Eleven surveys were removed due to invalid responses, including inappropriate marks and missing values. Thus, 220 surveys were considered as valid for use in this study.
For analysis, this study used Smart Partial Least Square (PLS) 2.0 and SPSS 23.0 statistical analysis packages. The goal of existing methods using structural equations is to estimate the relevance of the model. However, independent variables indicated by the R2 value better predict the extent to which the dependent variables change. In the early stages of theory development, research models are appropriate, even when they have not been thoroughly verified [49]. Partial least square (PLS) analysis has thus been used as an appropriate analytical technique in previous studies about usage intentions. Additionally, we used the formula of Carte and Russell [50] for Moderated Multiple Regression (MMR) to determine the moderating effects of personal innovativeness.
Table 1 shows demographic characteristics of respondents. The sample consisted of 131 females (59.5%) and 89 males (40.5%), with 57.7% of respondents ranging from 20 to 30 years of age. Over three-quarters (77.3%) of respondents were college or university graduates, 42.7% were students, 21.3% were office workers, 10.0% were technicians, 5.5% were self-employed, 7.3% were education practitioners, and 13.2% of respondents identified other types of employment. In terms of LBS, 90.9% of respondents used maps and location searches, 68.6% used social network services, and 50.5% used LBS for public transport searches. Approximately half (47.3%) of respondents used LBS for daily activities-based information searches.
4.2. Measures
The measurement items for each construct were adapted from previous literature, but were modified to encompass LBS as the technology to be assessed. The research includes seven constructs, each with multiple items measured by using a Likert’s seven-point scale. Respondents were also asked for details about their gender, age, level of education, occupation, and type of LBS usage. Table 2 summarizes our operational definitions of the constructs and their sources.
5. Data Analysis and Results
5.1. Reliability, Validity, and Common Method Bias Analysis
The initial screening of structural equation modeling shows good univariate normality. The six constructs (location, reputation, trust, entertainment, attitude, intention) are reviewed via factor analysis to reduce the number of independent variables in each constructs. The questionnaire items and factor loadings on the six constructs to measure the content validity and reliability of the instrument are provided in Table 3. A total of 21 independent variables categorized into six constructs and there are no mismatches in factor loadings, indicating that the survey instrument is reasonably well developed in terms of the contents of each construct.
Assessment of the measurement model includes estimation of internal consistency for reliability and tests of convergent and discriminant validity for construct validity. To examine internal consistency, Cronbach’s alpha was utilized. The suggested minimum threshold value for Cronbach’s alpha in an exploratory study is 0.7 [51,52].
Table 3 indicates that Cronbach’s alpha values ranged from 0.841 to 0.921, exceeding the minimum threshold. Composite reliability should be greater than the threshold of 0.7 to be adequate. All the composite reliabilities of the constructs had values higher than 0.7, indicating adequate internal consistency. Harman’s single-factor analysis was performed for an exploratory factor analysis of all our measurement items. Factor analysis using principal component analysis yielded six factors with eigenvalues greater than 1.0, which accounted for 78.07% of the total variance. The first factor captured only 38.30% of the variance in the data.
Additionally, average variance extracted (AVE) was calculated. The AVE values of the constructs were higher than 0.5, the suggested minimum. An AVE value higher than 0.5 shows that more than 50% of the variance of the measurement items can be explained by the constructs. Sampling generalization tests were also examined using Kaiser–Meyer–Olkin (KMO) of sample adequacy and Bartlett’s tests of sphericity to validate the use of factor analysis. The KMO statistic is a value of the proportion of variance among variables that might be common variance, and KMO values between 0.8 and 1 indicate sampling adequacy. The KMO value of 0.860 and Bartlett’s test values with a chi-squared value of 3267.468 (df = 210 and sig. = 0.000) indicate sampling adequacy. A communality (h2) indicates whether an item correlates with all other items. All communalities for a certain variable are over 0.6, related variables are loaded properly on any factor.
Discriminant validity was tested by considering AVE and Pearson’s correlation values. Table 4 shows the correlations among constructs. The table shows the square root of the AVE values on the diagonal (in bold). The square root of the AVE values exceeded 0.707. If the correlation coefficient exceeds its value, then the validity between each component of the concept is secured. The results show that the square root of each variable’s AVE exceeded the correlation value for each variable, demonstrating sufficient discriminant validity. Table 4 also indicates constructs’ mean statistic with standard deviations. This accounted for less than 1.7% of the deviation (e.g., the threshold is less than 3.00), which means that sampling bias may not be a serious issue in this study.
As data was collected from multiple respondents, there was a potential problem of common method variance [53]. To assess the severity of common method bias, we conducted three statistical analyses. A common method factor was added into the PLS model. The indicators of the common method factor comprised all the measurement items [54]. The possibility of common method bias was assessed by including an unmeasured latent method factor (common latent variable) in the structural model with the PLS approach [55]. Table 5 shows the common method bias analysis, with results indicating an average substantively explained variance of indicators value of 0.874, whereas the average method-based variance was 0.000. The ratio of substantive variance was about 87:1. In addition, the method factor loadings were not significant. Given the insignificance of the method variance, the results indicate the absence of a significant amount of common method variance in the data. Therefore, the results suggest that common method bias is not a serious concern.
5.2. Model Results and Implications
To test the proposed research model, Smart PLS 2.0 with bootstrapping was used for both the measurement model and the structural model. The bootstrapping method is a nonparametric procedure testing the statistical significance of various test statistic such path coefficients, redundancy values, R2 values and a goodness of model fit in PLS-SEM.
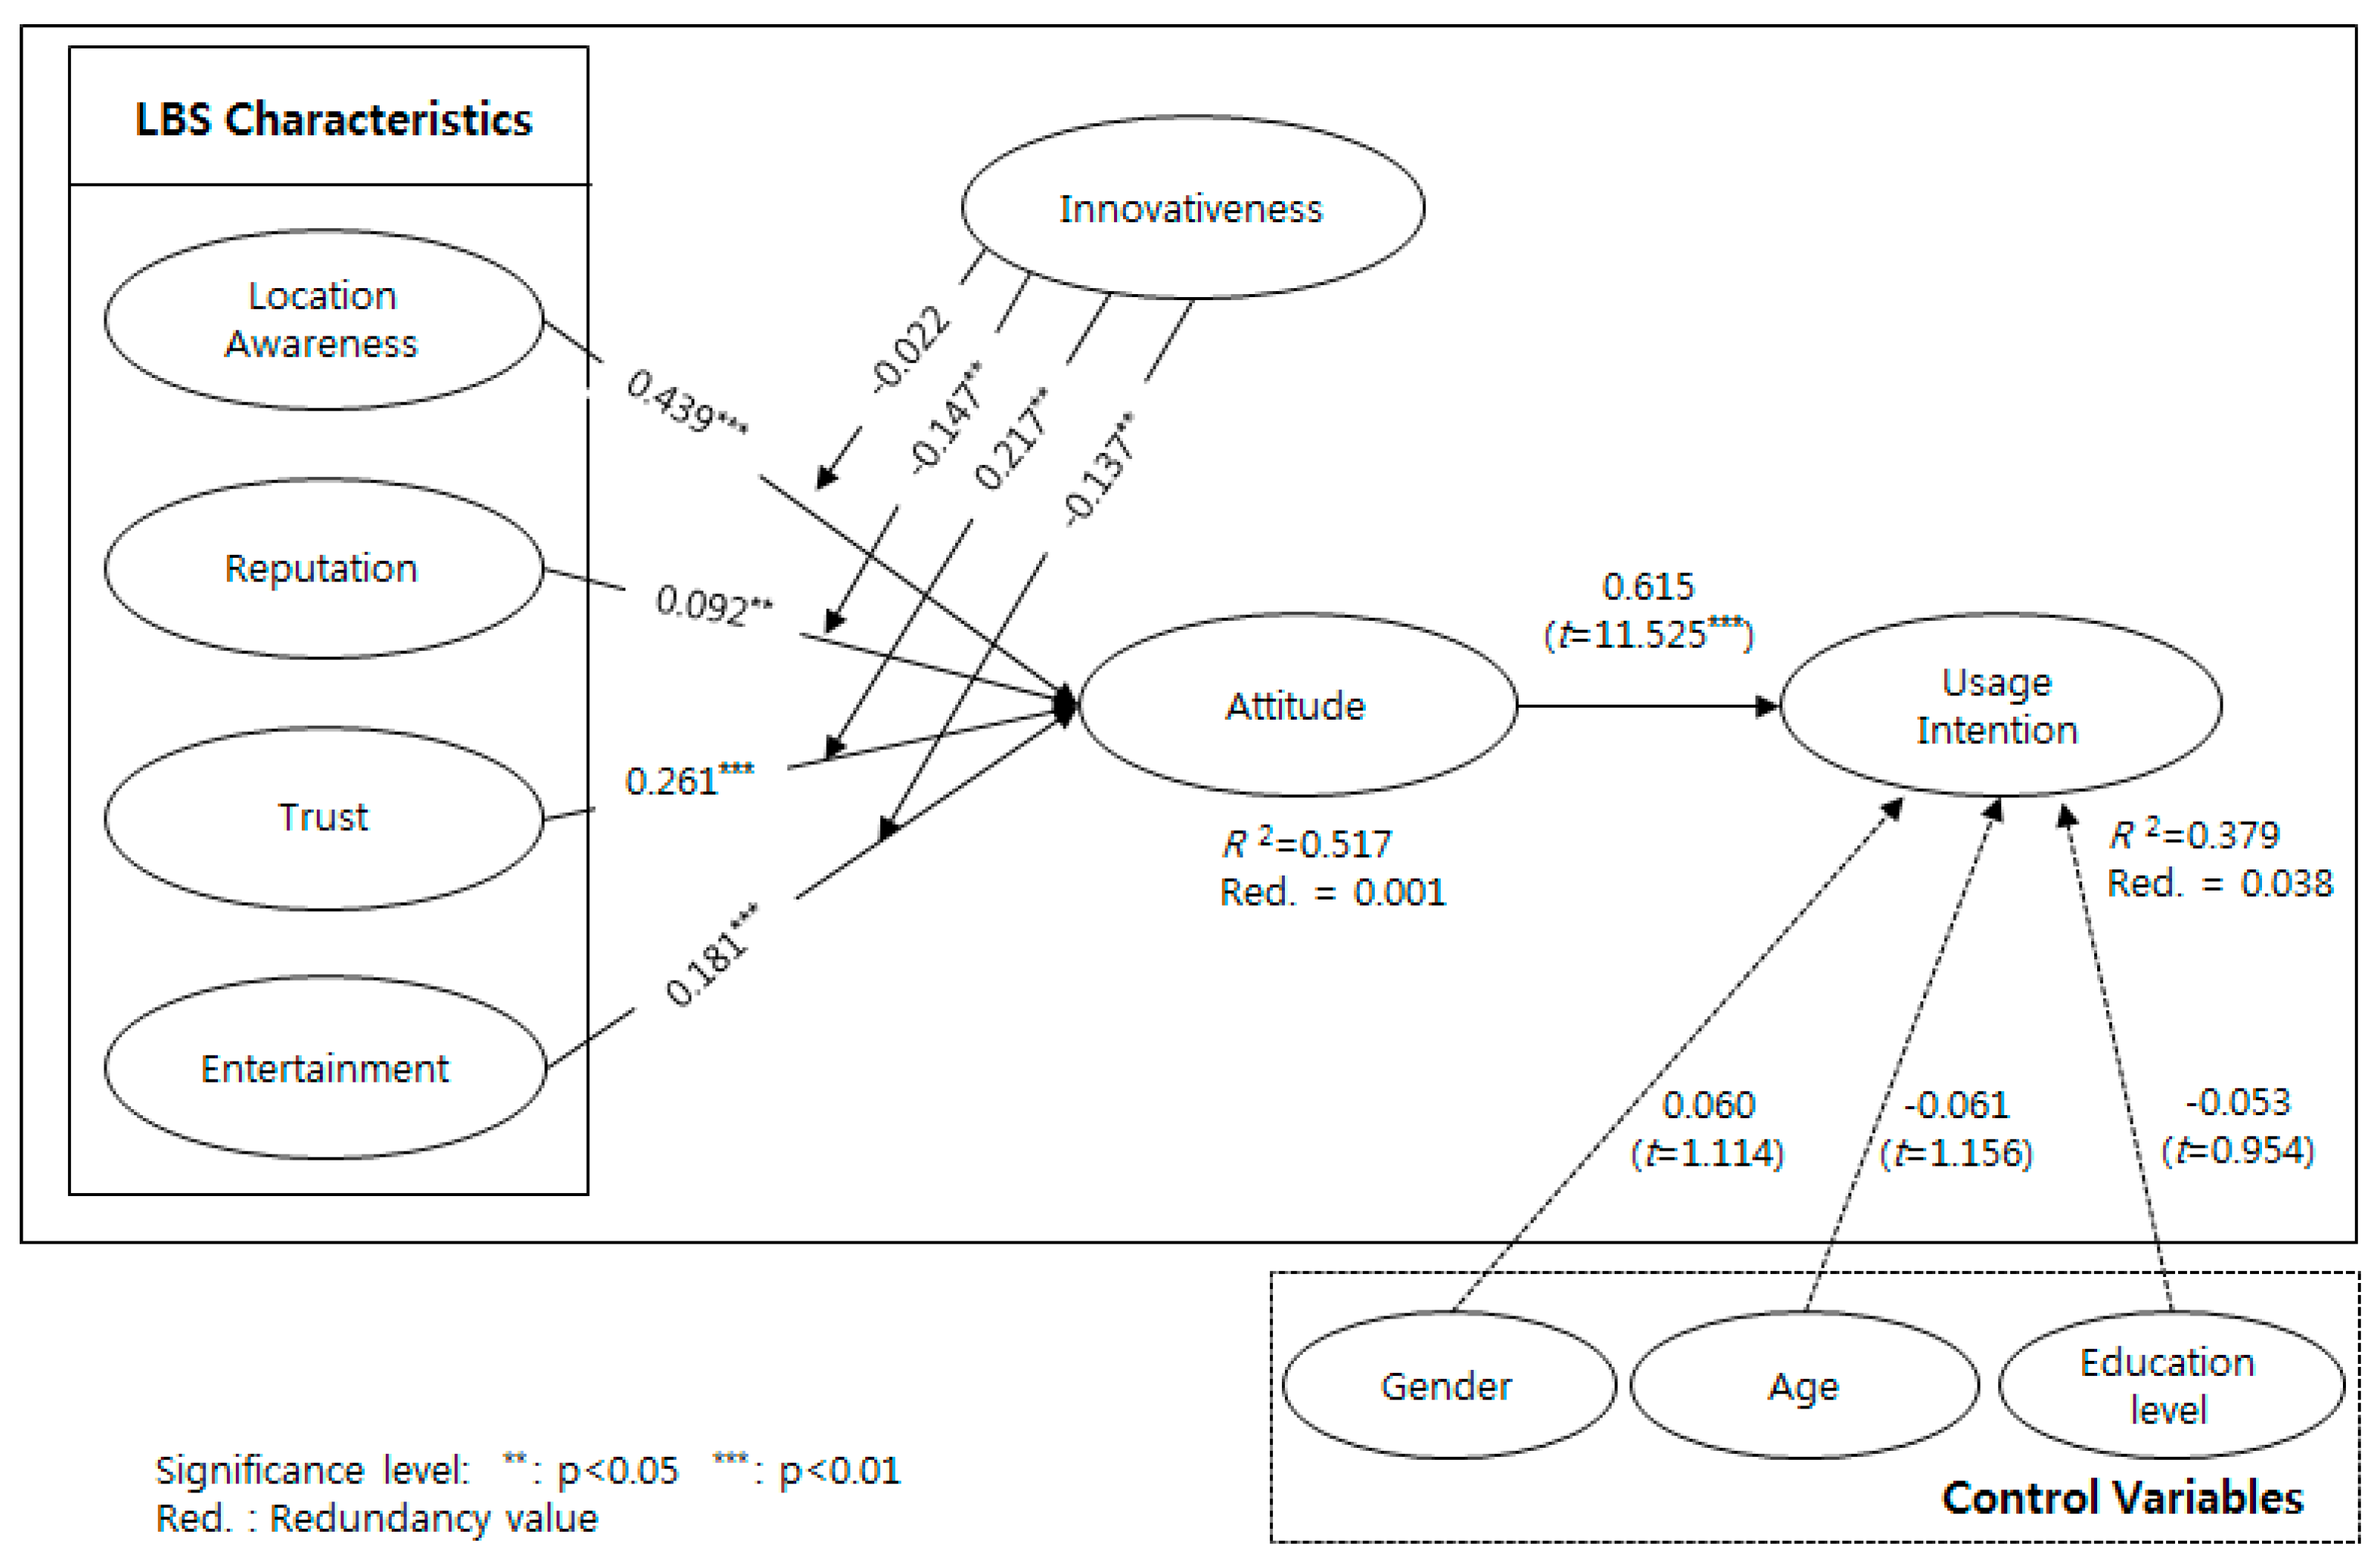
Figure 2 and Figure 3 show the results of the structural equation with the R2 values and the redundancy values. The figure explains the standardized path coefficients as well as their respective significance levels and variance. The fit analysis for the structural model can be evaluated as R2, Redundancy, and Goodness of Fit. The R2 value of the endogenous variables can be evaluated as ‘good’ if R2 is 0.26 or more [56]. The redundancy value is an indicator of the statistical estimator of the structural model and is evaluated as having a good fit when it is positive. The overall fitness is calculated by multiplying the average value of R2 and the average value of communality and then evaluating it as the square root. If the value is 0.36 or more, it is ‘good’ [57]. As a result of the analysis, the R2 values are 0.517 in attitude and 0.379 in usage intention. In terms of the R2 value for each endogenous variable, all variables representing the attributes of LBS explained 51.7% of the variance in user attitudes. In addition, attitudes explained 37.9% of the variance in usage intention. The redundancy value is positive: 0.001 in attitude and 0.038 in usage intention, respectively. Thus, the model has a good fit.
In this study, Table 6 shows the Sobel test that was applied to the structural model to verify the mediating effects of attitude between LBS characteristics (location, reputation, trust, entertainment) and intention. As a result, it was found that the attitude had a mediating effect on the effect of entertainment (t = 2.738, p < 0.01) on the usage intention, while attitude had no mediating effect on the location awareness (t = 1.579), reputation (t = −0.016), and trust (t = 0.317).
Table 7 summarizes the results of the hypotheses testing. First, location awareness, reputation, trust, and entertainment appear to have a positive effect on attitudes. This means that H1 (path coefficient = 0.439, t = 7.268), H2 (path coefficient = 0.092, t = 2.217), H3 (path coefficient = 0.261, t = 3.814), and H4 (path coefficient = 0.181, t = 3.059) are accepted. This means that if the LBS is well-recognized, location awareness, reputation, trust, and entertainment will be high and a positive attitude will be formed in using LBS. Second, attitude appears to have a positive effect on usage intention. Therefore, H5 is accepted (path coefficient = 0.615, t = 11.525). This means that a positive attitude toward LBS has a positive effect on the usage intention to LBS.
Because any change in a control variable would invalidate the correlation of dependent variables to the independent variable, controlling variables of gender, age, and education level on usage intention aims to mitigate the confounding effects of irrelevant variables in the study. Path coefficients and t-values of three control variables indicate that there is no statistical significance, resulting in having no confounding effects in gender (path coefficient = 0.062, t = 1.114), age (path coefficient = −0.601, t = 1.156), and education level of users (path coefficient = −0.053, t = 0.954) on usage intention in users.
In order to verify moderating effect of personal innovativeness in this study, it was used a formula of Carter and Russell (2003)’s Moderated Multiple Regression (MMR). Carter and Russell (2003)’s formula is as follows:
Table 8 shows the results to verify the moderating effects of personal innovativeness. This study used the MMR formula of Carter and Russell [50] to identify the moderating effects of user innovativeness on LBS attributes and user attitudes toward LBS. First, the value of the F-statistic for the moderating effect of personal innovativeness on the relationship between location awareness and attitude toward LBS was 0.353 (p > 0.05). Thus H6 was not supported.
Second, the value of the F-statistic for the proposed moderating effect of personal innovativeness on the relationship between reputation and attitudes toward LBS was 5.155 (p < 0.05), thereby supporting the significant role of personal innovativeness in this relationship (H7 supported).
Third, the value of the F-statistic for the moderating effect of personal innovativeness on the relationship between trust and attitude toward LBS was 16.130 (p < 0.01), thereby supporting the proposed moderating effect and supporting H8.
Finally, the value of the F-statistic for the moderating effect of personal innovativeness on the relationship between entertainment and attitudes toward LBS was 5.194 (p < 0.05). Again, the significant role of personal innovativeness was supported and H9 was supported by these findings.
The testing of moderating effects refers to statistical consideration of interactions. A significant interaction shows that the effect of one variable depends on the level of another variable. More specifically, the moderating effects reflect the extent to which a categorical variable (e.g., high and low innovativeness in users) affects the direction and/or strength of the relationships between dependent (attitude) and independent variables (location awareness, reputation, trust, and entertainment). First, the effect of location awareness is greater for highly innovative users than for users with low innovativeness. Because the interaction is not statistically significant, however, it may not be concluded that location awareness stimuli are more disruptive to highly innovative users than to users with low innovativeness. Nevertheless, even though the value is not significant, the direction and degree confirm a moderating effect among variables. Second, the effect of reputation is greater for highly innovative users than for users with low innovativeness. Because the interaction effect is statistically significant, we are able to conclude that reputation stimuli are more disruptive to highly innovative users than to users with low innovativeness. Thus higher levels of personal innovativeness can weaken the relationship between the reputation of an LBS firm and user attitudes toward LBS.
Third, the effect of trust is greater for highly innovative users than for users with low innovativeness. Because the interaction effect is statistically significant, we are able to conclude that trust stimuli are more disruptive to highly innovative users than to users with low innovativeness. Thus higher levels of personal innovativeness can strengthen the relationship between trust and attitudes toward LBS. Finally, the effect of entertainment is greater for highly innovative users than for users with low innovativeness. Because the interaction effect is statistically significant, we are able to conclude that entertainment stimuli are more disruptive to highly innovative users than to users with low innovativeness. Thus higher levels of personal innovativeness can weaken the relationship between entertainment and attitudes toward LBS.
The main contribution of this study to the existing body of pertinent literature is to examine the moderating effects of personal innovativeness on usage intentions in LBS. This study presents strong evidence to suggest that the impacts of LBS attributes (location awareness, reputation, trust, and entertainment) on the attitudes and usage intentions of LBS users depend largely on the predisposition of users to innovation. Based on the results, more specialized service strategies stand to be implemented according to levels of personal innovation in target consumers. The findings of this study offer theoretical implications. First, our findings provide new insights into the theoretical relationships among LBS attributes, user attitudes, and user usage intentions. In addition, certain LBS attributes (i.e., location awareness, reputation, trust, and entertainment) are shown to have a positive influence on user attitudes toward LBS. Second, the study findings contribute to current theoretical explanations of usage intentions in LBS and the moderating effects of personal innovativeness in users. Moreover, LBS usage intentions in users may be examined by way of TAB models to provide deeper insight into the attitudes, usage intentions, and behaviors of new LBS users.
Further, the study findings provide practical implications for managers of LBS firms. First, the results suggest that LBS usage is growing among Korean users. Therefore, managers with a solid understanding of the factors influencing user attitudes and usage intentions are better positioned to become market leaders in LBS. Indeed, LBS marketers and firms should work to establish a good reputation and large market share to ensure success. Striving to develop technology that takes into account location awareness, trust, and entertainment should be the aim of LBS providers.
In terms of LBS attributes, location awareness was shown to be the most influential among variables affecting user attitudes toward location-based services. Accurate location recognition technology for location-based services can be applied not only to location-based games but also to location-based social networking services (SNSs) and the Internet of Things (IoT). Additionally, it can be used for 911 rescue request services in emergency situations. This study suggests that location-based service providers should work to develop technology to provide accurate user location. The reputation of location-based service providers, together with trust in location-based services on the part of users, has a significant impact on user attitudes toward location-based services. Location-based games and location-based SNSs are important factors for entertainment and fun for users of LBS. Location-based developers should aim to achieve entertainment in developing content for location-based services so that users have fun and enjoy the usage of location-based services. It is expected that location-based services will create added value through location-based games and location-based SNSs.
Second, our study shows that personal innovativeness had moderating effects on the attitudes of LBS users. Specifically, personal innovativeness interacted with reputation, trust, and entertainment to influence users’ intention to use. Overall, the greater the level of LBS users’ innovativeness, the greater the likelihood that the reputations of LBS providers, user trust in LBS, and features of entertainment would lead to better attitudes and usage intentions in users for LBS. In addition, the results show that, in comparison to users with high innovativeness, users with low innovativeness were more likely to research LBS-related information and services when they had a highly positive attitudes toward LBS.
6. Concluding Remarks
The purpose of this research is to explore usage intentions in LBS by utilizing a modified technology acceptance behaviors theories to test how LBS attributes influence LBS usage intentions. This study examined the effects of LBS attributes on service users’ attitudes toward LBS, as well as the effects of attitudes on LBS usage intentions for a sustainable mobile industry.
An empirical study was conducted with data from 220 surveys. The results can be summarized as follows. First, the results provide support for H1, which predicted a positive relationship between location awareness and user attitudes. This finding suggests that LBS providers are aware of the importance of location accuracy to service users and thus endeavor to provide appropriate information to them, thereby leading consumers to use products and services. This result is consistent with the previous findings in which location awareness has been shown to be significantly related to user attitudes. Thus, LBSs can be more potentially beneficial for the next generation users expecting more customized and sustainable development in m-commerce services.
Second, the results provide support for H2, which predicted a positive relationship between the reputation of LBS providers and user attitudes. This finding suggests that mobile users are aware of risks in making mobile usage in the anonymous context of mobile business. Accordingly, LBS users are likely to pay attention to the reputation of LBS providers to avoid various transaction-related risks. In fact, user trust in any given LBS provider may be based on reputation. If LBS providers have sufficient means to prevent personal information leakage and privacy, users may perceive that they will be able to safely use LBSs. This result implies that social change may require a balancing between sustainable development and the technological environment in order to personal privacy and data protection concern.
Third, the results provide support for H3 and H4, which predicted positive relationships among trust, user attitudes, and entertainment. User trust in LBS should be enhanced with entertainment features, in part so that users can maintain consistent interest in ongoing usage. These findings are consistent with the findings of previous studies to identify factors that affect user attitudes, indicating significant relationships among trust, entertainment, and attitudes. Therefore, this study implies that enhancing location awareness, reputation, trust, and entertainment are critical factors that will lead to more positive user attitudes toward LBS. The results indicate that LBS could be sustainably adopted when such services should be based on location awareness, reputation, trust, and entertainment. Finally, personal innovativeness was found to moderate relationships between LBS attributes of reputation, trust, and entertainment and user attitudes toward LBS. However, personal innovativeness was found not to moderate the relationship between location awareness and user attitudes toward LBS. Thus, sustainable development may concern with creating co-values through a systematic understanding of the structure, process and outcome of appropriate technological ecosystems.
Further, the results provide support for H5, which predicted a positive relationship between user attitudes and usage intentions for LBS. This result is consistent with the previous findings of technology acceptance studies in which usage intentions have been found to be significantly related to attitudes. In other words, the attitudes had positive effects on usage intentions [56], and the findings were consistent in studies such as Zhu et al. [23], Pookulangara and Koesler [24], Dai et al. [25], Kumar and Mukherjee [26], Zhao et al. [27], and Limpf and Voorveld [28]. Moreover, LBS usage intentions may be examined from theoretical approaches by way of the TAB to provide deeper insight into the attitudes and behaviors of LBS users. It can be seen that positive attitude formation for LBS positively influences the usage intention.
As with many empirical studies, this study has some limitations. Analysis was limited to the usage attitudes of LBS users affected only by the LBS attributes identified. Future research should consider other potential factors, user attributes, and environmental attributes. The measurement items were obtained and modified from previous research. Therefore, some misspecification of the variables may have occurred. Future research might undertake a more comprehensive investigation. Finally, because this study was conducted in Korea, generalizing these findings to users in other study settings should be done with caution.
Location-based service technology not only provides various services through a location search for individuals, but also realizes smart logistics such as green supply chain management, software for tracking and managing logistics, and transportation network design. It is expected that sustainable growth will be possible. Future research may attempt to benchmark and extend to other countries to further validate the research model for location-based services in mobile-related industries in terms of sustainability. Sustainability has been a subject of greatest interest in economics and business, specifically the scarcity of resources. Therefore, sustainability is considered to be a new paradigm to maintain a balanced relationship between human beings and their environmental, cultural, economic, and social settings through technological innovation. Future studies considering technology acceptance and behavior intention may investigate the green supply chain, the conflict between urgency and entrepreneurship, and corporate social responsibility, among other topics.
Author Contributions
S.H.J. and C.W.L. conducted the study design and development. S.H.J. collected and analyzed data. C.W.L. revised the manuscript. Both advanced the manuscript.
Conflicts of Interest
The authors declare no conflict of interest.
References
- Xu, H.; Teo, H.H.; Tan, B.C.Y.; Agarwal, R. The role of push-pull technology in privacy calculus: The case of location-based services. J. Manag. Inf. Syst. 2009, 26, 135–174. [Google Scholar] [CrossRef]
- Tsai, H.-R.; Chen, T. Enhancing the sustainability of a location-aware service through optimization. Sustainability 2014, 6, 9441–9455. [Google Scholar] [CrossRef]
- Weiss, A.S. Exploring news apps and location-based services on the smartphone. Journal. Mass Commun. Q. 2013, 90, 435–456. [Google Scholar] [CrossRef]
- Du, G.; Sun, C. Location planning problem of service centers for sustainable home healthcare: Evidence from the empirical analysis of Shanghai. Sustainability 2015, 7, 15812–15832. [Google Scholar] [CrossRef]
- Zhang, Y.; Wu, W.; Wang, Q.; Su, F.A. Geo-event-based geospatial information service: A case study of Typhoon hazard. Sustainability 2017, 9, 534. [Google Scholar] [CrossRef]
- Pura, M. Linking perceived value and loyalty in location-based mobile services. Manag. Serv. Qual. Int. J. 2005, 15, 509–538. [Google Scholar] [CrossRef]
- Richard, J.E.; Meuli, P.G. Exploring and modeling digital natives’ intention to use permission-based location-aware mobile advertising. J. Mark. Manag. 2013, 29, 698–719. [Google Scholar] [CrossRef]
- Xu, H.; Gupta, S. The effects of privacy concerns and personal innovativeness on potential and experienced customers’ adoption of location-based services. Electron. Mark. 2009, 19, 137–149. [Google Scholar] [CrossRef]
- Zhao, L.; Lu, Y.; Gupta, S. Disclosure intention of location-related information in location-based social network services. Int. J. Electron. Commer. 2012, 16, 53–89. [Google Scholar] [CrossRef]
- Davis, F.D. Perceived usefulness, perceived ease of use, and user-acceptance of information technology. MIS Q. 1989, 13, 319–340. [Google Scholar] [CrossRef]
- Laudon, K.C.; Laudon, J.P. Management Information Systems: Managing the Digital Firm, 14th ed.; Pearson: Harlow, UK, 2016. [Google Scholar]
- Raschke, R.L.; Krishen, A.S.; Kachroo, P. Understanding the components of information privacy threats for location-based services. J. Inf. Syst. 2014, 28, 227–242. [Google Scholar] [CrossRef]
- Xu, H.; Luo, X.R.; Carroll, J.M.; Rosson, M.B. The personalization privacy paradox: An exploratory study of decision making process for location-aware marketing. Decis. Support Syst. 2011, 51, 42–52. [Google Scholar] [CrossRef]
- Zhou, T. The impact of privacy concern on user adoption of location-based services. Ind. Manag. Data Syst. 2011, 111, 212–226. [Google Scholar] [CrossRef]
- Palos-Sanchez, P.R.; Hernandez-Nogollon, J.M.; Campon-Cerro, A.M. The behavioral response to location based services: An examination of the influence of social and environmental benefits, and privacy. Sustainability 2017, 9, 1988. [Google Scholar] [CrossRef]
- Venkatesh, V.; Morris, M.G. Why don’t men ever stop to ask for directions? Gender, social influence, and their role in technology acceptance and usage behavior. MIS Q. 2000, 24, 115–139. [Google Scholar] [CrossRef]
- Williams, M.D.; Rana, N.P.; Dwivedi, Y.K. The unified theory of acceptance and use of technology (UTAUT): A literature review. JEIM. 2015, 28, 443–488. [Google Scholar] [CrossRef]
- Heerink, M.; Kröse, B.; Evers, V.; Wielinga, B. Assessing acceptance of assistive social agent technology by older adults: The almere model. Int. J. Soc. Robot. 2010, 2, 361–375. [Google Scholar] [CrossRef]
- Chen, K.; Chan, A.H.S. Gerontechnology acceptance by elderly Hong Kong Chinese: A senior technology acceptance model (STAM). Ergonomics 2014, 57, 635–652. [Google Scholar] [CrossRef] [PubMed]
- Gefen, D.; Karahanna, E.; Straub, D.W. Trust and TAM in online shopping: An integrated model. MIS Q. 2003, 27, 51–90. [Google Scholar] [CrossRef]
- Taylor, S.; Todd, P.A. Understanding information technology usage: A test of competing models. Inf. Syst. Res. 1995, 6, 144–176. [Google Scholar] [CrossRef]
- Davis, F.D.; Bagozzi, R.P.; Warshaw, P.R. User acceptance of computer technology: A comparison of two theoretical models. Manag. Sci. 1989, 35, 982–1003. [Google Scholar] [CrossRef]
- Zhu, D.S.; Lee, Z.C.; O’Neal, G.S. Mr. Risk! Please trust me: Trust antecedents that increase online consumer purchase intention. J. Internet Bank. Commer. 2011, 16, 1–23. [Google Scholar]
- Wang, X.; Yu, C.; Wei, Y. Social media peer communication and impacts on purchase intentions: A consumer socialization framework. J. Interact. Mark. 2012, 26, 198–208. [Google Scholar] [CrossRef]
- Dai, H.; Wen, K.; Singh, W.; Lyer, L.S. An integrative framework of mobile commerce consumers’ privacy concerns and willingness to use: An empirical study. Int. J. Electron. Bus. 2012, 10, 79–100. [Google Scholar] [CrossRef]
- Kumar, A.; Mukherjee, A. Shop while you talk: Determinants of purchase intentions through a mobile device. Int. J. Mob. Mark. 2013, 8, 23–37. [Google Scholar]
- Zhao, J.; Fang, S.; Jin, P. Modeling and quantifying user acceptance of personalized business modes based on TAM, trust and attitude. Sustainability 2018, 10, 356. [Google Scholar] [CrossRef]
- Limpf, N.; Voorveld, H.A.M. Mobile location-based advertising: How information privacy concerns influence consumers’ attitude and acceptance. J. Interact. Advert. 2015, 15, 111–123. [Google Scholar] [CrossRef]
- Thatcher, J.B.; Loughry, M.L.; Lim, J.; McKnight, D.H. Internet anxiety: An empirical study of the effects of personality, beliefs, and social support. Inf. Manag. 2007, 44, 353–363. [Google Scholar] [CrossRef]
- Agarwal, R.; Prasad, J. A conceptual and operational definition of personal innovativeness in the domain of information technology. Inf. Syst. Res. 1998, 9, 204–215. [Google Scholar] [CrossRef]
- Citrin, A.V.; Sprott, D.E.; Silverman, S.N.; Stem, D.E.S. Adoption of internet shopping: The role of consumer innovativeness. Ind. Manag. Data Syst. 2000, 100, 294–2000. [Google Scholar] [CrossRef]
- Jeong, N.; Yoo, Y.; Heo, T.Y. Moderating effect of personal innovativeness on mobile-RFID services: Based on Warshaw’s purchase intention model. Technol. Forecast. Soc. Chang. 2009, 76, 154–164. [Google Scholar] [CrossRef]
- Venkatesh, V.; Morris, M.G.; Davis, G.B.; Davis, F.D. User acceptance of information technology: Toward a unified view. MIS Q. 2003, 27, 425–478. [Google Scholar] [CrossRef]
- Yoon, S.H.; Occena, L.G. Influencing factors of trust in consumer-to-consumer electronic commerce with gender and age. Int. J. Inf. Manag. 2015, 35, 352–363. [Google Scholar] [CrossRef]
- Fang, Y.; Qureshi, I.; Sun, H.; McCole, P.; Ramsey, E.; Lim, K.H. Trust, satisfaction, and online repurchase intention: The moderating role of perceived effectiveness of e-commerce institutional mechanisms. MIS Q. 2014, 38, 407–427. [Google Scholar] [CrossRef]
- Junglas, I.A.; Watson, R.T. The u-constructs: Four information drives. Commun. Assoc. Inf. Syst. 2006, 17, 569–592. [Google Scholar]
- Junglas, I.A.; Watson, R.T. Location-based service: Evaluating user perceptions of location-tracking and location-awareness services. Commun. ACM 2008, 51, 65–69. [Google Scholar] [CrossRef]
- Doney, P.M.; Cannon, J.P. An examination of the nature of trust in buyer-seller relationships. J. Mark. 1997, 61, 35–51. [Google Scholar] [CrossRef]
- Kim, S.; Park, H. Effects of various characteristics of social commerce (s-commerce) on consumers’ trust and trust performance. Int. J. Inf. Manag. 2013, 33, 318–332. [Google Scholar] [CrossRef]
- Kang, M.J.; Yang, S.U. Comparing effects of country reputation and the overall corporate reputations of a country on international consumers’ product attitudes and purchase intentions. Corp. Reput. Rev. 2010, 13, 52–62. [Google Scholar] [CrossRef]
- Jarvenpaa, S.L.; Tractinsky, N.; Vitale, M. Consumer trust in an internet store. Inf. Technol. Manag. 2000, 1, 45–71. [Google Scholar] [CrossRef]
- Kim, D.J.; Ferrin, D.L.; Rao, H.R. A trust-based consumer decision-making model in electronic commerce: The role of trust, perceived risk, and their antecedents. Decis. Support Syst. 2008, 44, 544–564. [Google Scholar] [CrossRef]
- Wang, A. The practices of mobile advertising disclosure on consumer trust and attitude. Int. J. Mob. Mark. 2010, 5, 17–29. [Google Scholar]
- Ducoffe, H. Advertising on the web. J. Advert. Res. 1996, 36, 21–35. [Google Scholar]
- Bauer, H.H.; Barnes, S.J.; Reichardt, T. Driving consumer acceptance of mobile marketing: A theoretical framework and empirical study. J. Electron. Commer. Res. 2005, 6, 181–192. [Google Scholar]
- Njite, D.; Parsa, H.G. Structural equation modeling of factors that influence consumer internet purchase intentions of services. J. Serv. Res. 2005, 5, 43–59. [Google Scholar]
- Gazley, A.; Hunt, A.; McLaren, L. The effects of location-based-services on consumer purchase intention at point of Purchase. Eur. J. Mark. 2015, 49, 1686–1708. [Google Scholar] [CrossRef]
- Crespo, A.H.; Bosque, I.R. The effect of innovativeness on the adoption of B2C E-commerce: A model based on the theory of planned behavior. Comput. Hum. Behav. 2008, 24, 2830–2847. [Google Scholar] [CrossRef]
- Teo, H.H.; Wei, K.K.; Benbasat, I. Predicting intention to adopt interorganizational linkage: An institutional perspective. MIS Q. 2003, 27, 19–49. [Google Scholar] [CrossRef]
- Carte, T.A.; Russell, C.J. In pursuit of moderation: Nine common errors and their solutions. MIS Q. 2003, 27, 479–501. [Google Scholar] [CrossRef]
- Nunnally, J.C. Psychometric Theory; McGraw-Hill: New York, NY, USA, 1979. [Google Scholar]
- Jang, S.H.; Kim, R.H.; Lee, C.W. Effect of u-healthcare service quality on usage intention in a healthcare service. Technol. Forecast. Soc. Chang. 2016, 113, 396–403. [Google Scholar] [CrossRef]
- Podsakoff, P.M.; MacKenzie, S.B.; Lee, J.Y. Common method biases in behavioral research: A critical review of the literature and recommended remedies. J. Appl. Psychol. 2003, 88, 879–903. [Google Scholar] [CrossRef] [PubMed]
- Liang, H.; Saraf, N.; Hu, Q.; Xue, Y. Assimilation of enterprise systems: The effect of institutional pressures and the mediating role of top management. MIS Q. 2007, 31, 59–87. [Google Scholar] [CrossRef]
- Chiu, C.M.; Cheng, H.L.; Huang, H.Y.; Chen, C.F. Exploring individuals’ subjective well-being and loyalty towards social network sites from the perspective of network externalities: The Facebook case. Int. J. Inf. Manag. 2013, 33, 539–552. [Google Scholar] [CrossRef]
- Cohen, J.O. Statistical Power Analysis for the Behavioral Sciences, 2nd ed.; Lawrence Erlbaum: Hillsdale, NJ, USA, 1988. [Google Scholar]
- Tenenhaus, M.; Vinzia, V.E.; Chatelinc, Y.M.; Lauro, C. PLS path modeling computational statistics and data analysis. Comput. Stat. Data Anal. 2005, 48, 159–205. [Google Scholar] [CrossRef]
Figure 1.
Research model.

Figure 2.
Structural equation modeling analysis of the research model.

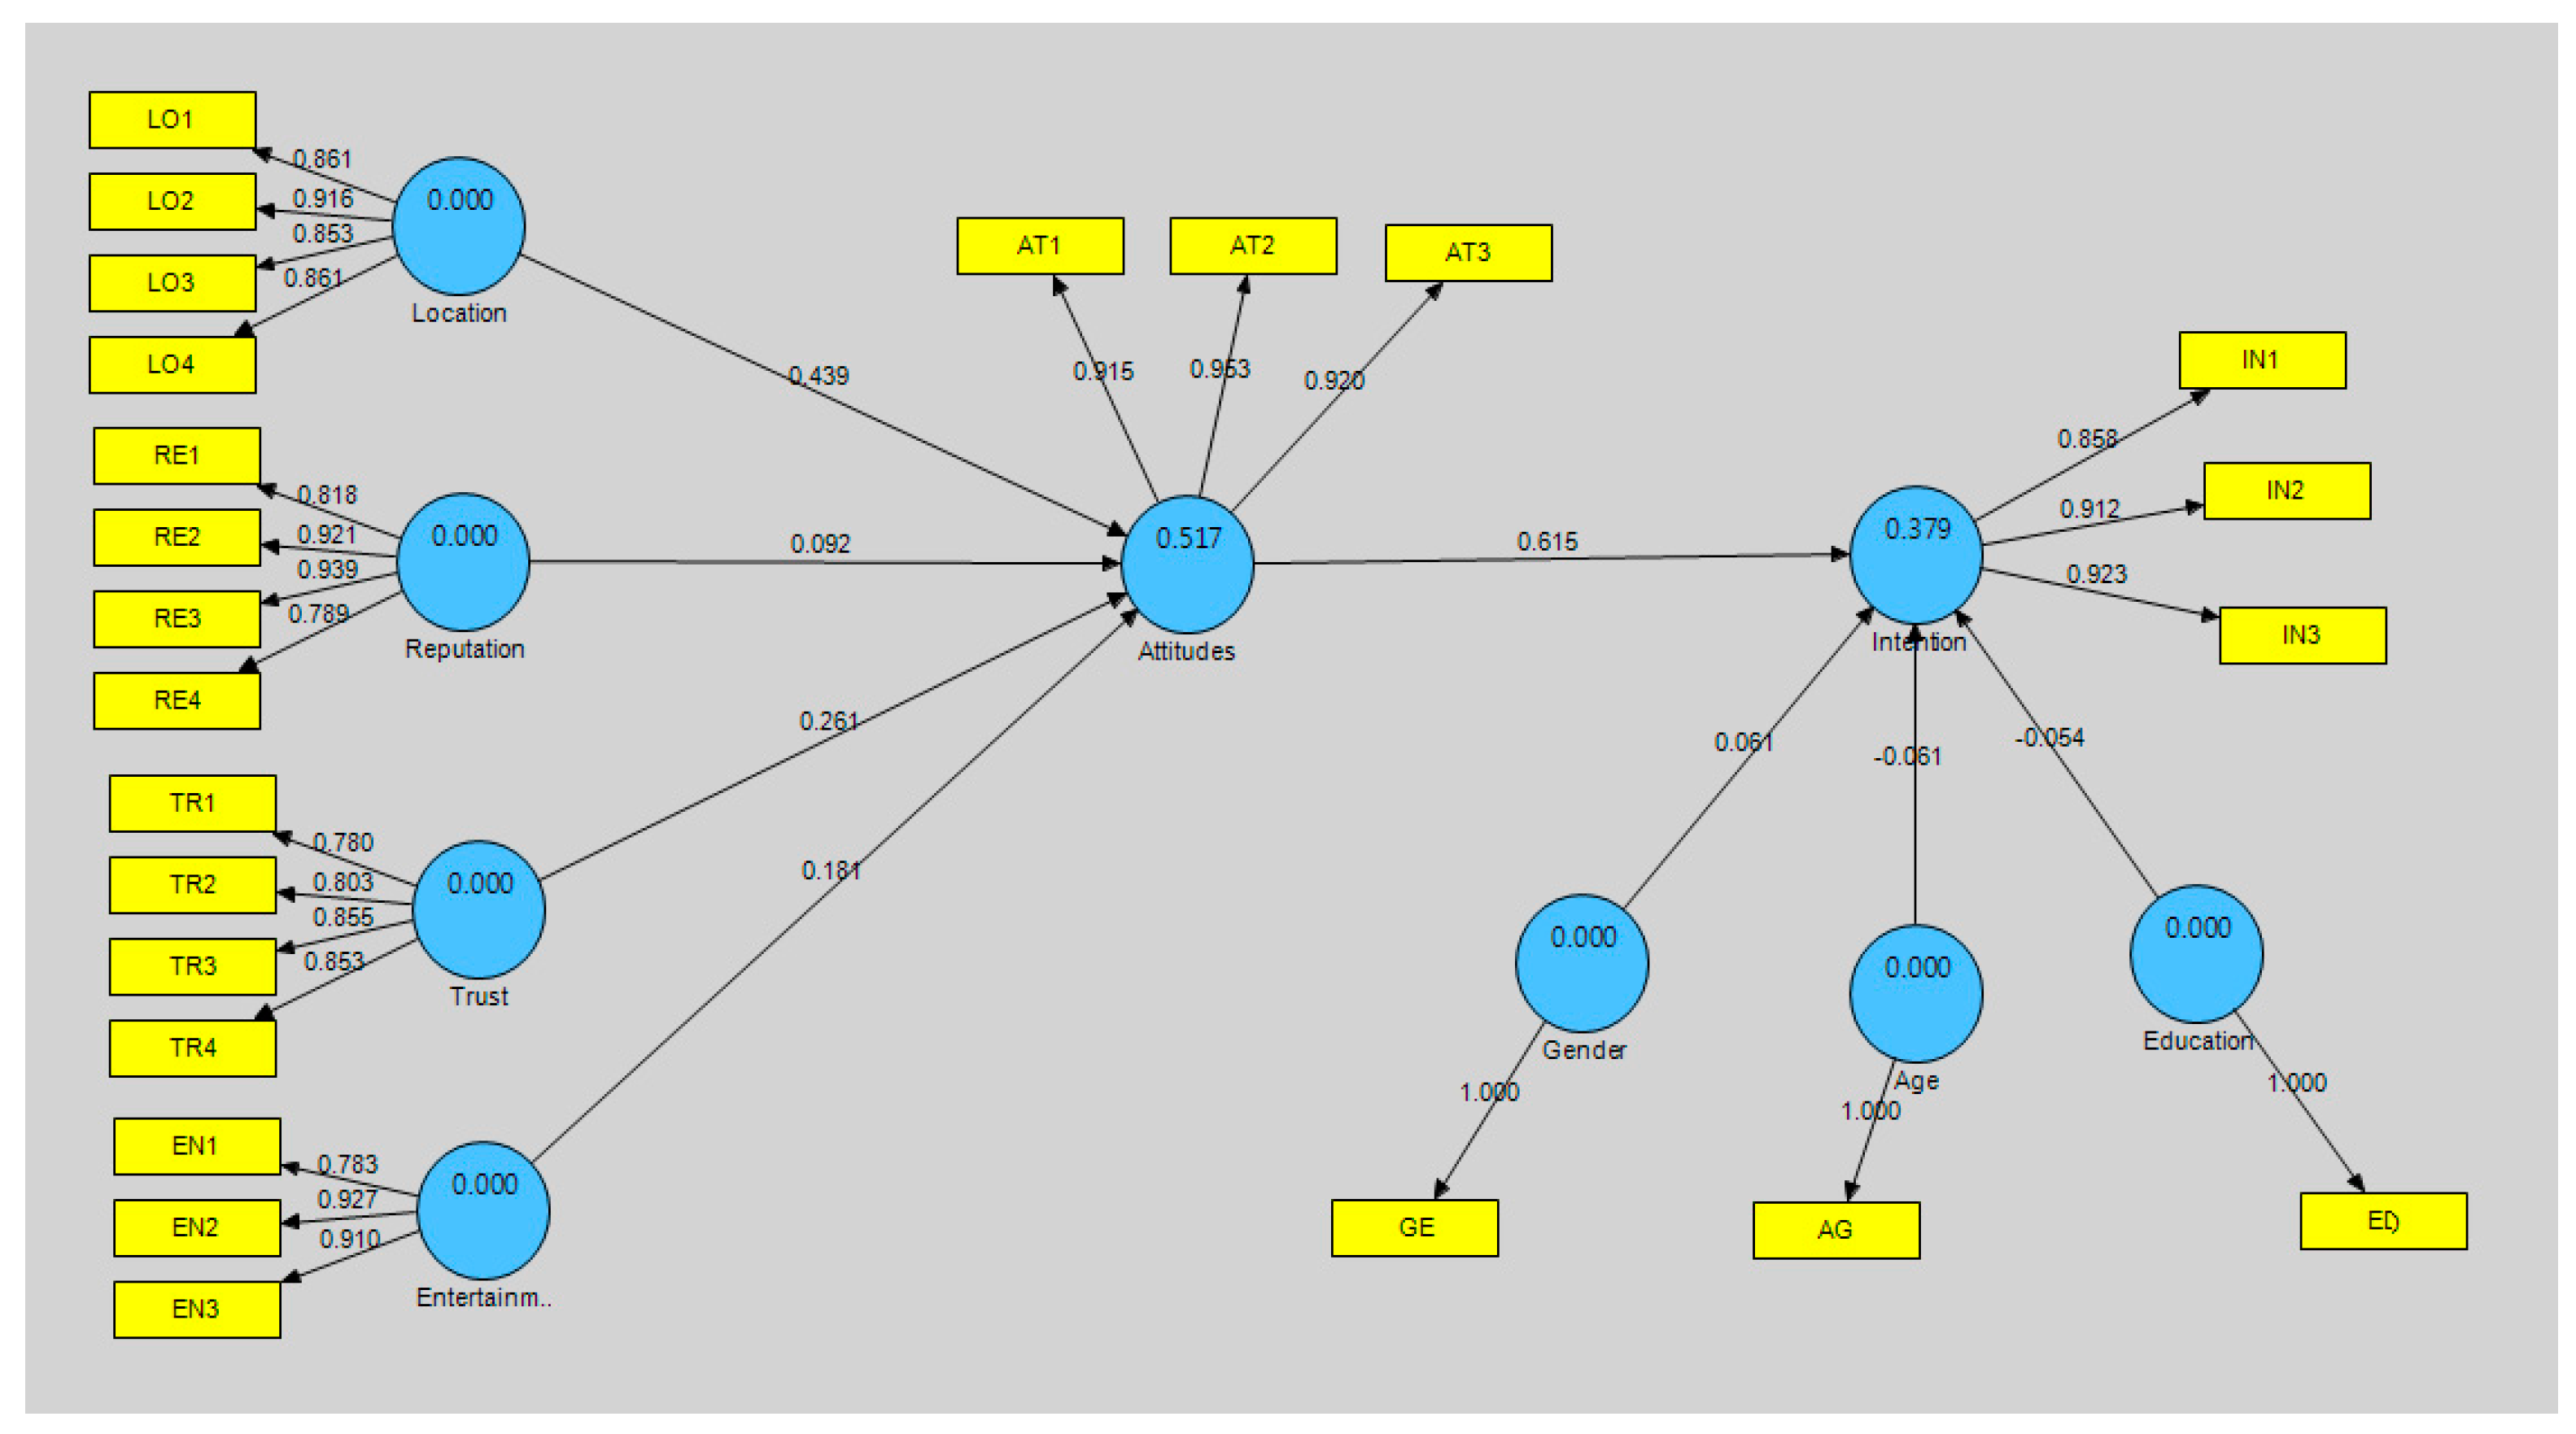
Figure 3.
Detail statistic of each variable in structural equation modeling.

LO: location awareness, RE: reputation, TR: trust, EN: Entertainment, AT: attitude, IN: intention, GE: gender, AG: age, ED: education.

Table 1.
Characteristics of respondents.
| Variables | Items | Frequency | Percentage (%) |
|---|---|---|---|
| Gender | Male | 89 | 40.5 |
| Female | 131 | 59.5 | |
| Total | 220 | 100.0 | |
| Age | ≤20 (years old) | 5 | 2.3 |
| 21–30 | 122 | 55.5 | |
| 31–40 | 58 | 26.4 | |
| 41+ | 35 | 15.9 | |
| Total | 220 | 100.0 | |
| Education level | High school | 32 | 14.5 |
| College/university | 170 | 77.3 | |
| Graduate school or above | 18 | 8.2 | |
| Total | 220 | 100.0 | |
| Occupation | Student | 94 | 42.7 |
| Office worker | 47 | 21.3 | |
| Technician | 22 | 10 | |
| Self-employed | 12 | 5.5 | |
| Education | 16 | 7.3 | |
| Other | 29 | 13.2 | |
| Total | 220 | 100.0 | |
| LBS usage type (Multiple responses) | Maps and location search | 200 | 90.9 |
| Weather search | 47 | 21.4 | |
| Public transport search | 110 | 50 | |
| Social network services | 151 | 68.6 | |
| Information search based on daily activities | 104 | 47.3 | |
| Other | 34 | 15.5 |
Table 2.
Operational definitions of constructs.
| Variables | Measurement Item | Indicators | Related Literature |
|---|---|---|---|
| Location awareness | The degree to which LBS provides information/services to LBS users at the right time in the right place to support users’ immediate needs | 4 | [1,13] |
| Reputation | The degree of honesty and customer concern among LBS providers | 4 | [26,38] |
| Trust | Users’ degree of trust and faith in LBS | 4 | [16,41] |
| Entertainment | The degree of entertainment users feel in using LBS | 3 | [6] |
| Attitude | The degree to which users think positively about LBS | 3 | [9,46] |
| Usage intention | The degree to which users intend to use LBS | 3 | [12,39] |
| Personal innovativeness | Users’ degree of willingness to try LBS | 3 | [7,32] |
Table 3.
Factor analysis results and reliability analysis.
| Factors | Items | Factors | AVE | CR | α | h2 | |||||
|---|---|---|---|---|---|---|---|---|---|---|---|
| 1 | 2 | 3 | 4 | 5 | 6 | ||||||
| Location | LO2 | 0.885 | 0.036 | 0.130 | 0.084 | 0.060 | 0.186 | 0.762 | 0.927 | 0.895 | 0.762 |
| LO3 | 0.881 | 0.058 | 0.107 | 0.122 | 0.154 | 0.045 | |||||
| LO1 | 0.834 | 0.064 | 0.102 | 0.071 | 0.008 | 0.206 | |||||
| LO4 | 0.821 | 0.097 | 0.223 | 0.153 | 0.110 | 0.093 | |||||
| Reputation | RE3 | 0.078 | 0.920 | 0.133 | 0.100 | 0.081 | 0.083 | 0.756 | 0.924 | 0.891 | 0.756 |
| RE2 | 0.006 | 0.883 | 0.162 | 0.154 | 0.100 | 0.079 | |||||
| RE1 | 0.041 | 0.833 | 0.125 | 0.024 | 0.099 | −0.032 | |||||
| RE4 | 0.107 | 0.768 | 0.063 | 0.009 | −0.090 | 0.166 | |||||
| Trust | TR2 | 0.061 | 0.137 | 0.781 | 0.178 | 0.136 | 0.077 | 0.678 | 0.893 | 0.841 | 0.678 |
| TR4 | 0.220 | 0.211 | 0.779 | −0.034 | 0.129 | 0.177 | |||||
| TR3 | 0.104 | 0.202 | 0.776 | 0.149 | 0.117 | 0.176 | |||||
| TR1 | 0.188 | 0.005 | 0.743 | 0.112 | 0.030 | 0.181 | |||||
| Entertainment | IN2 | 0.115 | 0.081 | 0.080 | 0.861 | 0.185 | 0.225 | 0.767 | 0.907 | 0.846 | 0.767 |
| IN3 | 0.132 | 0.042 | 0.195 | 0.843 | 0.200 | 0.225 | |||||
| IN1 | 0.194 | 0.060 | 0.135 | 0.696 | 0.323 | 0.229 | |||||
| Attitude | EN2 | 0.099 | 0.040 | 0.137 | 0.300 | 0.848 | 0.099 | 0.864 | 0.950 | 0.921 | 0.864 |
| EN1 | 0.111 | 0.060 | 0.103 | 0.055 | 0.814 | 0.151 | |||||
| EN3 | 0.082 | 0.079 | 0.144 | 0.398 | 0.754 | 0.149 | |||||
| Intention | AT2 | 0.197 | 0.138 | 0.260 | 0.261 | 0.172 | 0.826 | 0.807 | 0.925 | 0.879 | 0.807 |
| AT3 | 0.185 | 0.137 | 0.238 | 0.224 | 0.180 | 0.817 | |||||
| AT1 | 0.263 | 0.085 | 0.228 | 0.349 | 0.156 | 0.738 | |||||
| Eigenvalues | 3.285 | 3.098 | 2.812 | 2.570 | 2.339 | 2.332 | |||||
| Variance explained (%) | 15.643 | 14.754 | 13.391 | 12.236 | 11.138 | 11.106 | |||||
| Cumulative of variance (%) | 15.643 | 30.397 | 43.788 | 56.024 | 67.162 | 78.268 | |||||
| Kaiser–Meyer–Olkin value | 0.86 | ||||||||||
| Bartlett’s chi-squared | 3267.468 (df = 210, sig. = 0.000) | ||||||||||
AVE: Average variance extracted; CR: Composite reliability; α: Cronbach’s alpha; h2: Communality.
Table 4.
Correlations between constructs.
| Variables | Mean | SD | LO | RE | TR | EN | AT | IN | GE | AG |
|---|---|---|---|---|---|---|---|---|---|---|
| Location (LO) | 3.842 | 1.092 | 0.873 ++ | |||||||
| Reputation (RE) | 3.869 | 1.109 | 0.154 | 0.869 | ||||||
| Trust (TR) | 3.747 | 0.960 | 0.376 | 0.343 | 0.823 | |||||
| Entertainment (EN) | 3.316 | 1.160 | 0.381 | 0.184 | 0.349 | 0.876 | ||||
| Attitudes (AT) | 3.666 | 1.176 | 0.620 | 0.282 | 0.521 | 0.456 | 0.930 | |||
| Intention (IN) | 3.553 | 1.362 | 0.494 | 0.193 | 0.374 | 0.586 | 0.608 | 0.898 | ||
| Gender (GE) | 1.600 | 0.492 | 0.062 | −0.065 | 0.009 | −0.006 | 0.018 | 0.061 | - | |
| Age (AG) | 1.940 | 0.474 | −0.027 | −0.181 | 0.045 | −0.044 | 0.068 | −0.016 | 0.152 | - |
| Education (ED) | 2.559 | 0.783 | 0.088 | −0.055 | −0.055 | −0.173 | 0.074 | −0.013 | 0.031 | 0.121 |
++ Note: The bold scores (diagonal) are square roots of the AVE.
Table 5.
Common method bias analysis.
| Construct | Items | Substantive Factor Loading (R1) | R12 | Method Factor Loading (R2) | R22 |
|---|---|---|---|---|---|
| Location | LO1 | 0.851 *** | 0.724 | 0.038 | 0.001 |
| LO2 | 0.915 *** | 0.838 | −0.044 | 0.001 | |
| LO3 | 0.862 *** | 0.743 | −0.079 | 0.003 | |
| LO4 | 0.863 *** | 0.745 | 0.087 | 0.003 | |
| Reputation | RE1 | 0.841 *** | 0.707 | −0.064 | 0.003 |
| RE2 | 0.914 *** | 0.836 | 0.073 | 0.004 | |
| RE3 | 0.937 *** | 0.878 | −0.006 | 0.000 | |
| RE4 | 0.780 *** | 0.608 | −0.010 | 0.000 | |
| Trust | TR1 | 0.777 *** | 0.603 | 0.048 | 0.001 |
| TR2 | 0.808 *** | 0.653 | −0.033 | 0.001 | |
| TR3 | 0.852 *** | 0.726 | 0.019 | 0.000 | |
| TR4 | 0.855 *** | 0.731 | −0.031 | 0.001 | |
| Entertainment | EN1 | 0.799 ** | 0.638 | −0.064 | 0.002 |
| EN2 | 0.928 ** | 0.862 | −0.038 | 0.001 | |
| EN3 | 0.897 ** | 0.804 | 0.095 | 0.005 | |
| Attitude | AT1 | 0.913 *** | 0.833 | 0.076 | 0.002 |
| AT2 | 0.954 *** | 0.910 | −0.024 | 0.000 | |
| AT3 | 0.922 *** | 0.850 | −0.052 | 0.001 | |
| Intention | IN1 | 0.856 *** | 0.732 | 0.081 | 0.003 |
| IN2 | 0.913 *** | 0.834 | −0.080 | 0.003 | |
| IN3 | 0.924 *** | 0.853 | 0.004 | 0.000 | |
| Average | 0.874 | 0.767 | 0.000 | 0.002 |
** p < 0.05, *** p < 0.01.
Table 6.
Sobel test results.
| Independent (A) | Intervening | Dependent (B) | Coefficient (A) | S.E. (A) | Coefficient (B) | S.E. (B) | Sobel t-Value | Result |
|---|---|---|---|---|---|---|---|---|
| Location | Attitude | Intention | 0.439 | 0.062 | 0.120 | 0.074 | 1.579 | Not supported |
| Reputation | 0.092 | 0.046 | −0.001 | 0.056 | −0.016 | Not supported | ||
| Trust | 0.262 | 0.066 | 0.020 | 0.062 | 0.317 | Not supported | ||
| Entertainment | 0.181 | 0.058 | 0.378 | 0.067 | 2.738 *** | Supported |
*** p < 0.01.
Table 7.
Direct effect results.
| Hypothesis | Path (Independent→Dependent) | Coefficient | S.E. | t-Value | Result |
|---|---|---|---|---|---|
| H1 | Location awareness→Attitude | 0.439 | 0.060 | 7.268 *** | Supported |
| H2 | Reputation→Attitude | 0.092 | 0.041 | 2.217 ** | Supported |
| H3 | Trust→Attitude | 0.261 | 0.068 | 3.814 *** | Supported |
| H4 | Entertainment→Attitude | 0.181 | 0.059 | 3.059 *** | Supported |
| H5 | Attitudes→Usage intention | 0.615 | 0.053 | 11.525 *** | Supported |
| Control Variables | Gender→Usage intention | 0.060 | 0.054 | 1.114 | |
| Age→Usage intention | −0.601 | 0.052 | 1.156 | ||
| Education→Usage intention | −0.053 | 0.056 | 0.954 |
** p < 0.05, *** p < 0.01.
Table 8.
Moderating effect results.
| Channel | R2add | R2mult | △R2 | F Value | Result | |
|---|---|---|---|---|---|---|
| H6 | Location awareness * Innovativeness→Attitudes | 0.389 | 0.390 | 0.001 | 0.353 | Not supported |
| H7 | Reputation * Innovativeness→Attitudes | 0.142 | 0.162 | 0.020 | 5.155 ** | Supported |
| H8 | Trust * Innovativeness→Attitudes | 0.338 | 0.384 | 0.046 | 16.130 *** | Supported |
| H9 | Entertainment * Innovativeness→Attitudes | 0.276 | 0.293 | 0.017 | 5.194 ** | Supported |
** p < 0.05, *** p < 0.01. R2add: main model’s model fit, R2mult: interaction model’s model fit, △R2: R2 difference, df: degree of freedom, N: sample size.
© 2018 by the authors. Licensee MDPI, Basel, Switzerland. This article is an open access article distributed under the terms and conditions of the Creative Commons Attribution (CC BY) license (http://creativecommons.org/licenses/by/4.0/).
Share and Cite
MDPI and ACS Style
Jang, S.H.; Lee, C.W. The Impact of Location-Based Service Factors on Usage Intentions for Technology Acceptance: The Moderating Effect of Innovativeness. Sustainability 2018, 10, 1876. https://doi.org/10.3390/su10061876
AMA Style
Jang SH, Lee CW. The Impact of Location-Based Service Factors on Usage Intentions for Technology Acceptance: The Moderating Effect of Innovativeness. Sustainability. 2018; 10(6):1876. https://doi.org/10.3390/su10061876
Chicago/Turabian StyleJang, Sung Hee, and Chang Won Lee. 2018. "The Impact of Location-Based Service Factors on Usage Intentions for Technology Acceptance: The Moderating Effect of Innovativeness" Sustainability 10, no. 6: 1876. https://doi.org/10.3390/su10061876
Note that from the first issue of 2016, this journal uses article numbers instead of page numbers. See further details here.