Article

Small and Medium Enterprises and the Relation between Social Performance and Financial Performance: Empirical Evidence from Korea

1
Department of Accounting, Dongguk University, Seoul 04620, Korea
2
Department of Tax & Accounting, Soongeui Woman’s College, Seoul 04628, Korea
*
Author to whom correspondence should be addressed.
Sustainability 2018, 10(6), 1816; https://doi.org/10.3390/su10061816
Submission received: 21 April 2018 / Revised: 24 May 2018 / Accepted: 29 May 2018 / Published: 31 May 2018
(This article belongs to the Section Economic and Business Aspects of Sustainability)

Abstract

:
Most studies on the relationship between corporate social performance (CSP) and corporate financial performance (CFP) have focused on large enterprises and archival tests for SMEs have been relatively few. There is a need for SME studies that are comparable to the research on large enterprises. In this study, we tested the CSP-CFP relationship of SMEs in Korea using a massive archival database. Although common theories on corporate social responsibility (CSR) in SMEs describe SMEs as non-strategic performers, we found a strong positive relationship between CSP-CFP for the larger or hi-tech SMEs. Therefore, some SMEs are similar to multinational companies in that they approach CSR effectively. This study makes a contribution to the literature on both CSR and SMEs because it empirically demonstrates the heterogeneity of SMEs and it presents a CSR-SME study that is methodologically comparable to the research on big corporations.

Graphical Abstract

1. Introduction

The effect of corporate social performance (CSP) activities has been widely studied over the past few decades. The majority of researchers agreed that CSP enhances the corporate financial performance (CFP) [1,2,3,4,5,6]. However, most of the studies have been based on theories developed to explain large corporations and data, in which big companies have been over-represented. Because CSP is discussed and measured mainly for large corporations, most empirical studies have ignored the majority of business entities—small and medium enterprises (SMEs). Due to a lack of proper CSR measures and the unavailability of public data, the relatively few CSR-SME studies are mostly case- or survey-based; thus, the methodologies make it difficult to generalize the results of these studies [7,8,9,10,11]. The inconsistency in research design also makes it problematic when comparing SME studies, as well as comparing studies of SMEs and large companies. The purpose of this study is to improve the comparability of the test results from SMEs with those of large corporations by employing the methodology commonly used in CSP-CSP studies, which are based on massive amounts of data.
While stakeholder theory [12] has been widely used to examine large corporations, considering the unique and diverse characteristics of SMEs, a different approach may be more appropriate to analyze SMEs [13,14]. However, as many SME studies have pointed out, the CSR programs of SMEs have received relatively little attention from researchers and stakeholders [13,15,16,17,18,19]. Thompson and Smith [15] suggested four reasons as to why researchers have given less attention to SMEs: SMEs have fewer resources available to perform CSR, they lack accessibility to CSR activities, there is a shortage of research methodology applicable to SMEs, and SMEs lack the visibility to attract researchers’ attention. According to Lepoutre and Heene [19], the diversity of SMEs hinders researchers from developing a unified theory. There have been several ungeneralizable studies that have argued that some SMEs are apt to perform CSR in certain areas, such as their social capital building [13,18,20,21], while other studies have focused on SMEs’ unique characteristics, diverse nature, or motivations and obstacles to performing CSP [14,22,23,24,25]. The diversity of SMEs and lack of accumulation of theoretical or empirical studies may have limited researchers’ interests in SMEs, because their research purpose is normally to find generalized principles.
Nevertheless, according to researchers, including Lepoutre and Heene [19], studying SMEs is important for three reasons. First, SMEs have economic importance. SMEs make up around 97–99% of businesses and provide employment for 50–70% of the labor force in the US, UK, Germany, EU, Asia and other regions [14,17,19,20,26,27]. Therefore, ignoring SMEs means that research findings may not be applicable to organizations in which most of the population works [14,15]. Second, as the speed of change in business environments accelerates, some large corporations are becoming entrepreneurial. Because downsized and decentralized large businesses are basically a collection of SMEs, ignoring SMEs may result in the loss of valuable insight into s businesses of this size [16,19]. Third, the characteristics of some SMEs are different from those of large companies. SMEs tend to be owner-managed, independent, multi-tasking, cash-limited, built on personal relationships, often embedded in local communities, they are frequently family-owned, and informally managed [14,17]. Therefore, we may need a different approach to analyze SMEs.
As many SMEs have unique characteristics, the features and effects of their social contribution may also be different from the large corporations. Their markets are smaller than those of larger companies [14]. Also, the owner-managers of SMEs face less pressure from shareholders [28]. Since their low visibility from the media reduces the effects of their CSR investments [22], SMEs’ have a different approach to the stakeholders in terms of CSR [29] (p. 14). For SMEs, the personal ethics and morals of the owner-manager have more of an influence on their CSR decisions [14], which means that they may be less strategic [30,31]. Because a less strategic approach implies a less efficient alignment between behaviors and target outcomes (e.g., corporate financial success), we expect that the CSP-CFP relationships of SMEs will be less strong than those of large corporations.
A new approach for CSR in SMEs may come from social capital theory [13,18,20,21,32] which suggests that established social capital can work as a competitive advantage. By interpreting the relationship-oriented or community-focused characteristics of SMEs’ CSR as social capital building, even in a SME setting we may be able to find a link in which the CSP and CFP are aligned strategically. The only problem is that the heterogeneity of SMEs makes such an explanation ungeneralizable. It is true for some SMEs that CSP is well aligned to CFP, but for other SMEs the traditional explanation may work better.
In this study, we tested the effect of CSR on SMEs using Korean data. We aimed to duplicate the common framework and methodology employed by countless archival CSP-CFP studies for large corporations. By using similar variables and methodology, we can directly compare our results to the majority of CSR studies. Our two research questions are: “Will the effect of CSR be as good for SMEs as it is for large corporations?”, “Are there any subgroups which show different characteristics from other SMEs in terms of the CSP-CFP relations?”.
Our empirical findings are as follows. First, although we found significant and positive relationships between charitable donations (CD) and the future performance of the organization in the full sample and in the non-SMEs subsample, the relationship in the SMEs sample was not significant. However, when we excluded the smaller companies from our SME sample, a positive relationship appeared. We also discovered that this positive relationship between CSP and CFP for larger SMEs was stronger in the hi-tech industries. Our findings were robust as we employed alternative hi-tech or SME classification criteria. Our empirical findings imply that some SMEs (larger, hi-tech SMEs) strategically engage in CSR in the same way as larger non-SMEs do, while the other group of SMEs (smaller, non-hi-tech SMEs) exhibit the characteristics described in many previous SMEs studies.
Our findings may contribute to the SME studies in that we empirically demonstrated that SMEs are not homogeneous. We also believe that our research has the advantage of comparability because we employed the same methodology as large enterprise-focused studies, which is not common in studies that analyze the CSR in SMEs.

2. Literature Review and Hypothesis Development

Early researchers have found that SMEs are treated differently by both managers and stakeholders in terms of CSR. For example, Chrisman and Fry [28] reported that both the public and small business owners believe that SMEs were likely to fulfil their social responsibilities while they were less satisfied that big businesses met their CSRs. Chrisman and Fry [28] suggested that the public may recognized the limitations of small businesses and did not have as high expectations for them as for big businesses. Van Auken and Ireland [33] argued that small businesses are not required to actively participate in social problems because of their limited social power; their only requirement is to avoid being irresponsible. Longenecker et al.’s [34] survey showed that there was a difference in ethical perceptions between managers of small and large corporations. According to this survey, small business managers were more ethical on finance and marketing issues, but more tolerant to manipulation in expense accounts, tax evasion, collusion, insider trading, and discrimination.
McMahon and Harvey [29] and Lepoutre and Heene [19] also explained the unique consideration and tolerance of SMEs. While the managers of SMEs considered the internal stakeholders, such as employees, customers, suppliers, and local community to whom the managers’ actions were visible, they tended to ignore external issues such as environmental and social issues, or accounting fraud. Due to the SMEs’ relatively small size, the managers, and even the stakeholders did not feel that the SMEs’ actions might have social impacts.
In other words, the reason for the different attitudes is the difference in organizational characteristics. According to Spence [14], SMEs are different to large corporations in many aspects. For example, the owner-manager system is the most common governance structure in SMEs, which reduces the pressure for profit maximization by shareholders. The motivation for CSR is also different. The personal values of the owner-managers are more likely to determine the CSR activities in SMEs than in larger corporations [25]. SMEs tend to be locally-based and community-embedded, which makes them sensitive to managing their reputation. However, because of their resource insufficiency, SMEs are less likely to respond to the strategic and marketing potentials of CSR. SMEs do not tend to develop any formal CSR standards, such as a code of conduct, mission statements, or CSR agreements, which makes it harder for the managers to systematically pursue CSR and for researchers to detect the precise level of CSR employed by SMEs. These characteristics imply that SMEs may pursue their own version of CSR; however, it is different from the version of the big companies in terms of direction, strength and effectiveness, and finally, detectability.
It is difficult for SME owners to achieve the level of reputation achieved by big companies because they have less visibility, and the media may not properly cover the smaller contributions of SMEs [22]. Low visibility in terms of CSR, may be partially due to their informality. Because many SMEs are small, insufficiently funded, and less formally structured, there is less possibility of formalizing CSR by providing CSR reporting [14]; however, less reporting does not always mean that the managers of SMEs act unethically [22]. Because the goal of many SME owners is their long-term survival so they can pass their business to children [35], hence they tend to be sensitive to their immediate stakeholders such as employees, customers, and suppliers [19]. Therefore, at least some SMEs also perform a kind of “sunken” CSR [30] (p. 74).
However, according to Klein and Vorbohle [31], the version of CSP performed by some SMEs is non-strategic (i.e., CSP activities are unrelated to profit-motivated decisions). They suggest that the SMEs’ local community focus defines their CSP as an action of “giving back something to society”, which infers that the CSR is an ethical practice rather than a strategic decision. In the SME environment, competitors are sometimes treated as stakeholders [36]. Even SMEs themselves do not always focus on profit maximization [37]. The unique environment of the SME may lead it to focus on building relationships at a regional level, even assuming a certain loss of profits, rather than developing strategic practices to maximize short-term gains.
Therefore, we might expect that not only big corporations but also SMEs practice their own version of CSR; however, the effect will be weaker for SMEs. The unique nature of SMEs makes the relationship between CSR and competitive advantage unclear [14]. As suggested by previous research, SMEs may have fewer resources, lower visibility, and a non-strategic approach to CSR; hence, we suggest the following proposition as an alternative hypothesis.
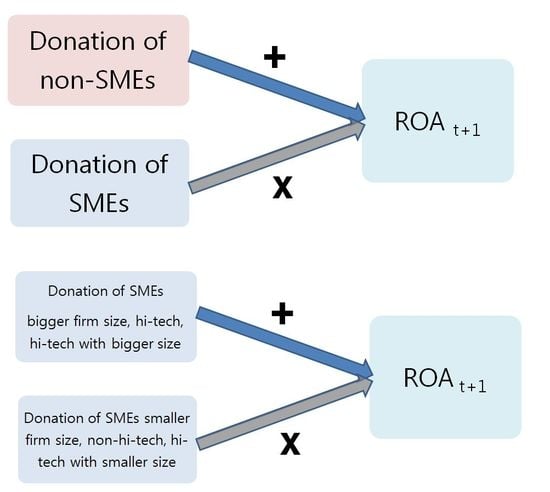
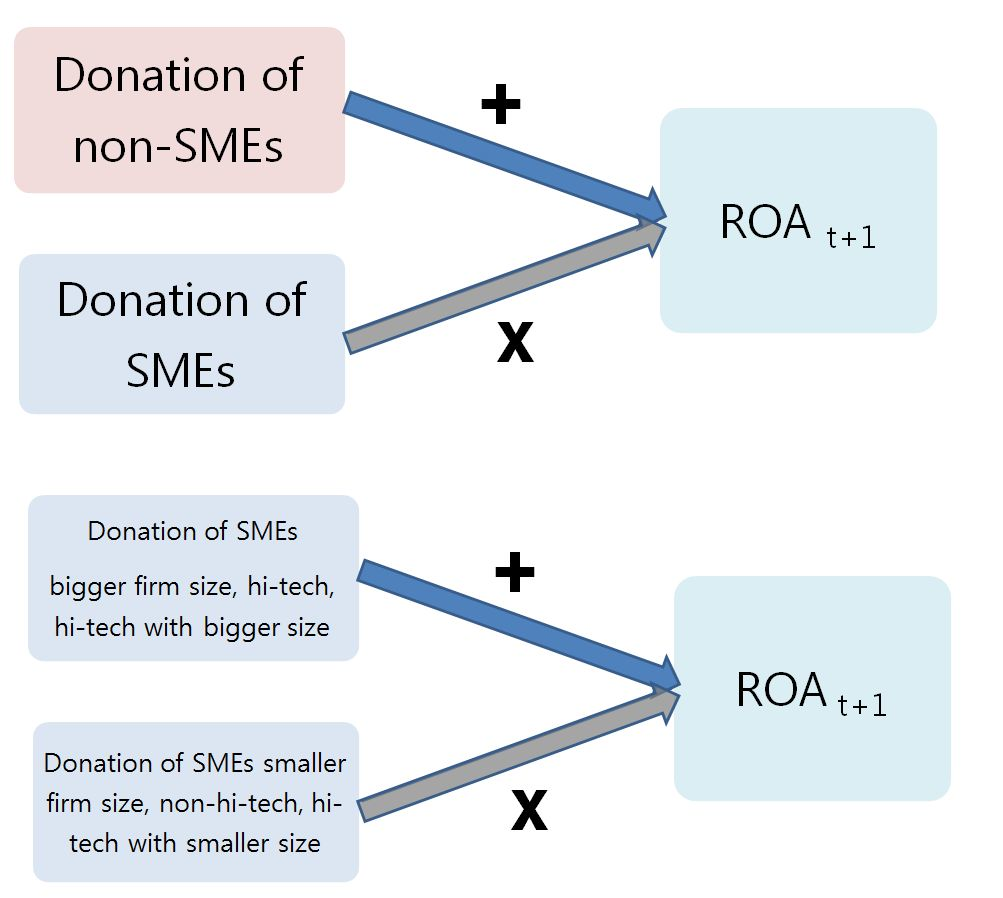
Hypothesis 1.
The relationship between CSP and CFP is weaker for the SME subsample than for the non-SME subsample.
Some researchers have argued that social capital theory can explain why many SMEs strategically achieve their goals [18,21,32]. Social capital is the “connections among individuals’ social networks and the norms or reciprocity and trustworthiness that arise from them” [38] (p. 19). According to Perrini [13] and Russo and Perrini [20], the SMEs’ unique characteristic of local community involvement is equivalent to social capital building. Murillo and Vallentin [21] suggest that SMEs’ CSR and social capital are interrelated and social capital is a good tool to explain SMEs’ silent CSR activities. They also point out that social capital is linked to competitive advantage and financial success because of the network building effects of social capital. That is to say, participating in the social capital network allows SMEs to access information and resources, and in the long run such relationships can lead to the sustainability of SMEs. The successful links between CSR and social capital, and social capital and CFP make it possible to expect a certain positive relationship between CSP and CFP in SMEs.
However, not all SMEs can establish such productive relationships. Considering the diversity in SMEs [14,19,32,39], it may not be correct to define all SMEs in terms of one single characteristic. We cannot say that all SMEs are non-strategic or successfully link social capital to their competitive advantage. Instead, it is fair to say that some SMEs may be in a better condition to link CSP-CFP, while others are not.
Our first consideration is size. According to Moore and Spence [39], SMEs are different depending on their relative size. At a micro-level, the smallest organizations have owner-managers and the owner-managers’ personal ethical attitudes may play an important role [16]. At a meso-level, middle-sized organizations may perform CSR as multinational enterprises (MNEs) do, but the informality and ad hoc approach of SMEs hinders researchers from identifying CSR in SMEs. Also, at a macro-level, Moore and Spence [39] have pointed out that little research has been performed. Aragon et al. [32] concluded that the heterogeneity of CSR programs among SMEs comes not only from the owner-manager’s personal values and economic situation, but also from the different combinations of internal and external stakeholder groups. In particular, smaller businesses tend to have more internal stakeholders [40,41]. The tolerance of SMEs reported by Chrisman and Fry [28] and Van Auken and Ireland [33] was based on SME’s resource scarcity and minimal influence on society, which may be dependent on the size of the company. Although they did not study SMEs, Brammer and Millington [42] and Amato and Amoto [43] empirically showed that bigger firms donate more, which can be interpreted as that size is related to the level of resource availability.
As the governance structure, formality, stakeholders, and resource availability are a function of size, other unique characteristics of SMEs suggested by Spence [14,17], McMahon and Harvey [29], Lepoutre and Heene [19], or Klein and Vorbohle [31] may also be less obvious as the company size increases. In general, bigger SMEs may be more strategic actors who successfully undertake social capital building in the same way as MNEs because of the increased pressure from stakeholders and improved resource availability. We expect that the strength of the CSP-CFP relationship or the effects of social capital as mediators may be stronger in bigger SMEs. Therefore, we propose that the CSP of larger SMEs have stronger effects on CFP.
Hypothesis 2.
The relationship between CSP and CFP is stronger for bigger SMEs.
To SMEs, CSR has a “hidden perspective” because some SMEs are innovative [31]. SMEs include innovative start-ups, some of which will be future market leaders. Some studies have empirically proved that social capital has a positive effect on the startup’s performance [44,45]. According to Gronum et al. [46], networking improves SMEs’ performance through the mediation of innovation. Other case studies have showed that in some industries such as science, IT, biotech, and software, social capital building is related to the SMEs’ key strategies [47,48,49]. Although not an SME study, Jung et al. [50] reported that the CSP-CFP relationship is stronger in information and communication technology (ICT) industries. Therefore, we propose that in hi-tech industries, which have more innovative startups, the relationship between CSP-CFP is stronger.
Hypothesis 3.
The relationship between CSP and CFP is stronger for hi-tech SMEs.

3. Research Design

3.1. Sample and Data

In this study, instead of employing case study or survey methodology, we tested the CSP-CFP relations of SMEs in a large database, so that we can directly compare our test results to many empirical studies on CSP-CFP. Case study or survey methods can suffer from external validity problems due to non-response error, coverage error, or response errors such as social desirability bias and reactive effect [7,8,9,10,11,51]. Research findings may be biased if response rates are low [7], an individual is assumed to represent the organization [8], self-responses are less accurate than independent observations [51], respondents have a tendency to answer in a way that is favored by others [9], or respondents are influenced by the survey questions [10] (pp. 5–6), [11]. Because the methodology we employed uses public company records which are believed to be more objective than poorly selected survey respondents’ subjective perceptions, some of these errors should not appear. As a result, we expect to get a more generalizable result. Moreover, by employing the same methodology used to analyze big corporations, we will be able to directly the behavior of SMEs with that of market giants.
Data was collected from the DataGuide database, which contains all publicly listed companies on the two Korean Stock markets, the Korea Composite Stock Price Index (KOSPI) and the Korea Securities Dealers Automated Quotation (KOSDAQ). Our data covered 2002–2014 for the independent variable and control variables, and 2003–2015 for the dependent variable. After excluding all missing values, we used 11,135 firm-years for the full sample and 4317 firm-years for the SME subsample. For industry classification, we used the 10th Korean Standard Industrial Classification (KSIC10) published by the Government in 2017. Although the KSCI10 has undergone some minor changes since the previous classification (KSCI9), in most cases there were no significant differences for most of the empirical studies. Our hi-tech industry classification followed the classification of Kim and Sohn [52]. They defined hi-tech industries as follows (the numbers in parentheses are KSCI codes): semiconductor manufacturing (261), electronic component manufacturing (262), computer and peripheral equipment manufacturing (263), communication and broadcasting equipment manufacturing (264), video and audio equipment manufacturing (265), medical, precision, optical equipment and watch manufacturing (27), electrical equipment manufacturing (28), broadcasting (60), mail and communication (61), computer programming, system integration and management (62), information service (63), research and development (70), and professional services (71). To check for robustness, we used the classification developed by Kile and Phillips [53] (p. 45, Table 2). They defined hi-tech as computer hardware manufacturing (261, 263), software development (582, 62), medical technology (21, 27, 70111, 70113), communications (264, 61), electronic manufacturing (262), internet and other information technology services (63). We divided their classification into two groups: ICT and pharmaceutical industries. Except for code 21, 27, 70111 and 70113, all other industries are classified as ICT industries.

3.2. Research Model

To measure the CSR of the SMEs, we used charitable donations (CD) for three reasons. First, a common form of SME CSR activity is charitable support and giving [14]. Second, the commonly used CSR indexes (such as KLD in the USA or KEJI in Korea) are mostly for large corporations, for example, only a handful of SMEs are included in the KEJI index. Third, employing CD could minimize the missing data. Only 17.8% of the full sample (26.3% of the SMEs sample) did not report CD.
We chose ROA as the dependent variable. ROA is the most commonly used variable as a proxy for corporate financial performance (CFP) [6]. In CSR studies, endogeneity is one of the most frequently raised issues [54], therefore we used ROAt+1 instead of ROAt to avoid simultaneity bias.
The control variables included are commonly used company characteristics such as size, leverage, operating cash flows, loss dummy, sales growth, R&D expense, advertising expense, age, beta, unqualified audit opinion dummy, big 4 auditor dummy, percentage of foreign investors ownership, largest shareholder ownership percentage, and the market dummy. According to Lu et al. [55], size, industry, leverage, profitability, risk, R&D, age, growth, and ownership are the most widely used control variables in CSP-CFP studies. We selected our control variables based on Lu et al.’s [55] list, except for the auditor-related variables. Our empirical model is as follows:
ROAt+1 = α1 + β1 donationt + β2 sizet + β3 levt + β4 ocft + β5 loss t + β6 growth t + β7 rnd t
+ β8 adv t + β9 age t + β10 beta t + β11 opin t + β12 big t + β13 for t + β14 maj t + β15 kosdaq t + ε
In this model, the subscript t denotes time t. ROAt+1 is the return on assets for the year t + 1. Donationt is the natural log of charitable donations divided by total assets for the year t (see Appendix A for the definitions of other variables). The model tests the relationship between the donations for the current period and next year’s ROA. Hypothesis 1 expects that β1 is smaller and less significant in the SME subsample than in the non-SME subsample. Hypothesis 2 expects that β1 is stronger and more significant in the upper size subset. Hypothesis 3 expects that β1 is stronger and more significant in the hi-tech industry subsample.

4. Empirical Results

Table 1 shows the descriptive statistics for the full sample and the SME subsample. The mean and median values of most variables except rnd, kosdaq, and hi-tech related dummy variables are lower in the SME subsample than in the full sample. Because the number of hi-tech companies in the SMEs is higher than in the full sample, we can assume that hi-tech companies tend to be smaller and younger than non-hi-tech companies.
Table 2 shows the correlation matrix. ROA is positively associated with the donation, size, ocf, age, opin, maj and hi-tech or pharmaceutical industry dummies and negatively associated with lev and loss. Donation is positively associated with ocf, rnd, adv, kosdaq and hi-tech or pharmaceutical industry dummies and negatively associated with size, lev, loss, and age. The columns show that future profitability is related to the current CSP, size, and profitability, and the current CSP is related to the current profitability, R&D, and advertising investment. An interesting result is the different effects of size and age. As a firm becomes bigger and older, its future profitability increases but the level of current CSP decreases. Another interesting finding is that kosdaq, which is equivalent to North America’s NASDAQ, is positively related with donation. The KOSDAQ market contains younger, smaller, more profitable, and a greater portion of hi-tech and pharmaceutical firms, which is consistent with the relationship between donations and the firm characteristics mentioned above.
The Ordinary Least Squares (OLS) regression results are presented in Table 3. Models 1–3 show that the CSP-CFP relationship is significantly positive for the full and non-SME subsample but insignificant for the SME subsample. This confirms Hypothesis 1, which argues that the CSP-CFP relationship of SMEs is weaker than that of non-SMEs. The proposition is based on the assumption that SMEs are less strategic CSR performers due to their unique characteristics. However, Models 4–8 confirm that the characteristics described for SMEs are only true for smaller SMEs. Specifically, for the largest 50% of the SMEs, the magnitude of the coefficient is the same as those of the full sample and non-SME subsample, with significance at the 95% level. For the largest 20% of the SMEs, the relationship is the strongest with significance at the 99% level, which means that some SMEs are more strategic CSR performers than not only the average SME, but also the average non-SME. Models 6–8 show that the CSP-CFP relationship is insignificant for smaller SMEs. Moreover, for the smallest SMEs the relationship is negative. In general, we conclude that the descriptions of SMEs suggested by previous studies are generally applicable to small-sized SMEs. We accept Hypothesis 2, which suggests that the CSR-CFP relationship is stronger for big SMEs.
Table 4 reports the test results for Hypothesis 3, which predicts that the CSP-CFP relationship is stronger for hi-tech SMEs. From Models 1–5, analyses were performed based on Kim and Sohn’s [52] hi-tech subsample. The first three columns show that the CSP-CFP relationship of hi-tech SMEs is positive and statistically significant. All coefficients from Models 1–5 in Table 4 have an equal or greater magnitude than the corresponding coefficients from Models 3–7 in Table 3, which supports Hypothesis 3. The coefficients form Models 2–5 in Table 4 show that the positive relationship is valid only for the big hi-tech companies, which proves Hypothesis 2, even in the hi-tech subsample.
Until now, we employed the hi-tech industry definition of [52]. Although this definition is suitable for testing the Korean data, for the robustness check we used other criteria suggested by Kile and Phillips [53]. We divided hi-tech industries [53] into ICT and pharmaceutical industries. Similar to our main tests, Model 6 and Model 7 of Table 4 support Hypothesis 3. The only difference is that with the new classification, the relationship is significant and the magnitude is strong, even for the smallest ICT-SMEs. Because the test results for the other ICT-SME subsamples are similar to our main test results for the hi-tech models, we did not report the other test results. For the pharmaceutical subsample, we did not report test results because we failed to find any significant results for all of the tests. Kim and Sohn’s [52] classification does not include pharmaceutical products (21) or related R&D companies (70111, 70113); therefore, we may conclude that in Korea, unlike other hi-tech manufacturers and service providers, SMEs involved in pharmaceutical products and related R&D failed to find a competitive advantage through CSR.
Our next robustness check is about the classification of SME. The SME definition we employed is based on Korean laws, which is similar to the EU definition in that both are based on sales volume and total assets thresholds. However, unlike the EU, the Korean standards do not use the number of employees threshold. Moreover, most researchers have classified SMEs based only on the number of employees. Therefore, we re-defined SMEs based on the number of employees, such as “big” for less than 250 employees, “medium” for less than 50 employees, and “small” for less than 10 employees.
The test results under the new SME definition are on Table 5. Model 1 and Model 2 show that there is no difference in terms of their strategic approach, between SMEs and non-SMEs. However, in Model 3 and Model 4 when we categorize SMEs by their number of employees, a positive effect is only observed for the big SMEs, which have more than 50 employees. Moreover, the test result of Model 4 shows a significant negative relationship between CSP and CFP. Models 5–7 show that the CSP of hi-tech firms has stronger effects on CFP, and this positive CSP-CFP relation is only true for big SMEs, even in the hi-tech subsample. Therefore, with a new SME definition we fail to confirm Hypothesis 1, but we found robust results that support Hypotheses 2 and 3.
Table 6 shows the basic statistics for the two SME definitions. SME1 is the definition used in the main tests. SME2 is for the robustness test (Table 5), based on the number of employees. Panel A shows that SME1 covers only 38.77% (4317/11,135) of the total public companies while SME2 contains almost half of them (49.78% = 5543/11,135). Therefore, there is no ex ante guarantees that the two tests based on different standards will show equal results. Panel B shows that in the SME2 subsample, nine out of ten SMEs are classified as big SMEs.

5. Conclusions and Discussion

While CSP-CFP studies on large, conglomerate, or multinational enterprises are prevalent, similar, generalizable research that uses large samples focusing on the CSP-CFP of SMEs is relatively uncommon. One of the reasons is that many SMEs are unincorporated [14] and researchers are not able to collect substantial data for those small businesses. However, the archival study is still possible because accessibility to incorporated small-sized SMEs is no different to large companies.
However, many SME studies are descriptive or case-based studies; others are empirical but mostly determinant-focused. Some researchers have focused on the impacts of CSP, but their methodologies are survey- or interview-based [56,57,58,59,60,61]. Our contribution to the literature is that we used the same method typically employed by studies of the CSP of big corporations, i.e., research based on enormous amounts of archival data, by which the direct comparison between the two different groups is possible.
The empirical tests were consistent with our three hypotheses. First, in support of the theoretical predictions that the effects of CSP-CFP will not be strong in SMEs, the relation was significantly positive only in the non-SME subsample (Models 1–3 in Table 3). Second, in the SME subsample only bigger SMEs showed a significant CSP-CFP relationship, supporting Hypothesis 2 (Models 4–8 in Table 3). Last, as proposed in Hypothesis 3, the relation was stronger in the hi-tech subsample (Models 1–5 in Table 4 compared to Models 3–7 in Table 3). The size effect was also shown in the hi-tech subsample (Models 2–5 in Table 4). In general, bigger SMEs and hi-tech SMEs did not follow the traditional explanation for SMEs since their CSP-CFP relation is the same as large corporations. Test results show that unlike non-SMEs, smaller SMEs failed to find financial benefits from CSR (see Appendix B Figure A1 for a graphical summary). Our results imply that for academic analysis and government policy, it is necessary to consider the heterogeneity of SMEs. Of course, the results found in this report may not be applicable to all other regions because South Korea is one of the most highly manufacture-oriented countries.
The limitations of our research are as follows. First, because we relied on a massive amount of archival accounting data, we did not test the unrecognizable rewards of CSP that are applicable to some SMEs, especially for smaller ones. Panwar et al. [62] pointed out that some SMEs focus on the intangible benefits of CSP, such as reputation within their community, instead of tangible targets related to short-term profit maximization. Second, our model directly linked CSP to the final outcome. However, as Cantele and Zardini [63] have suggested, there may be multiple paths between the two variables. CSP may directly influence not only the final ROA, but also stakeholders’ perceptions, such as customer loyalty, employee commitment, and reputation within the community. These benefits are hard to detect in our data. Third, we did not consider the governance factor. It is unrealistic to assume that all SMEs share one single corporate structure. Depending on its size and the characteristics of the CEO’s personality, each SME may have a different governance structure and as a result the effects of CSP on CFP may be different. Rodríguez-Fernández [64] showed that the size of the board influences performance, hence, an integrated view that connects CSR and governance when we discuss CSP-CFP may be needed [65]. Further research that empirically considers the diversity of governance may be required to fully understand the CSP-CFP relationship in SMEs.
Fourth, although CD has been used as a proxy for CSP in some other studies [66,67,68,69,70], it is clear that our CSR measure does not cover all aspects of CSR. While CSP collectively aims to influence all stakeholders, including employees, suppliers, customers, regulators, activists, media, potential investors, and the community in general, donations generally cover only the Public Relations targets. It is also possible to conclude that CD may not be related to strategic CSR, because the activities of firms that successfully align CD to their core businesses are now identified as Creating Social Value (CSV) [71,72], and not all CSR participants can accomplish CSV. However, we believe that in general, CD is related to the companies’ long-term stakeholder management. First, unlike CSV, a specific CSP action does not need to be related to a specific business model or product innovation in the short term. Second, CD is related to general reputation-building and all stakeholders can be influenced by this process. For example, organizational commitment of a respected company may be different from that of a trouble maker. Third, our assumption is that CD is highly related to CSP because both are influenced by the same management. Empirical studies that used CD instead of a gross CSR measure generally reported consistent findings [67,68,73].
Our research tested the idea that the effect of CD on future performance is different as size and industry are considered. We interpreted the results as that the strategic approach of management creates the difference, but we did not directly test the existence of strategic CSR policies because of data inadequacy. Further research is required to confirm what we did not test. CSR costs classified by Weber [74] include donations, investments, license and patent fees, costs for maintaining CSR-related personnel, and material expenses for CSR projects. Those costs are expected to be reported across many accounts and cannot be easily used to measure CSP, because usually it is difficult to distinguish CSP and non-CSP costs in financial accounts. CD is the rare exception because of the nature of the account. If we consider the benefits of using extensive archival accounting-based data, further research is required to investigate the ways to extract CSP from various financial accounts.

Author Contributions

Three authors contributed to this research. The first author provided the research idea, performed the main literature review and the main data analysis, and wrote this paper. The corresponding author reviewed the entire process, provided literature review, and wrote this paper. The co-author involved in the initial idea development and initial literature review.

Conflicts of Interest

The authors declare no conflict of interest.

Appendix A

Dependent Variable
ROAReturn on Asset.
Independent Variable
donationthe natural log of charitable donations divided by total assets.
Control Variables
sizenatural log of total assets.
levtotal liability divided by total assets.
ocfoperating cash flow divided by total assets.
lossa dummy variable 1 if the company reports loss.
growthsales growth.
rndR&D expenditure divided by total assets.
advadvertising expenditure divided by total assets.
agenatural log of years the company survived.
betathe systemic risk.
opina dummy variable 1 if the company receives an unqualified audit opinion.
biga dummy variable 1 if the company’s auditor is one of the big 4.
fornatural log of foreign investors’ ownership.
majnatural log of the largest shareholder’s ownership.
kosdaqa dummy variable 1 if the company is listed in the KOSDAQ market. (KOSDAQ is a market similar to NASDAQ)
Sample classification variables
hitech_kimhi-tech classification based on [52]
hitech_ictICT industry based on [53]
hitech_phampharmaceutical industry based on [53]
SME1Small and Medium Enterprise based on Korean laws
SME2Small and Medium Enterprise based on the number of employees
SME_bigSmall and Medium Enterprise with the employees less than 250 but over 50
SME_medSmall and Medium Enterprise with the employees less than 50 but over 10
SME_smallSmall and Medium Enterprise with the employees less than 10

Appendix B

Figure A1. A graphical summary.
Sustainability 10 01816 g0a1
These flowcharts summarize the main findings of Table 3 and Table 4. (1) Table 3, column 1–3 shows that only SMEs fail to link donations to future performance. (2) Table 3, columns 4–8 show that if the size of the SME is above the median then positive relationships appear. Table 4, column 1 shows that for hi-tech SMEs the relation is also positive. Table 4, columns 2–5 show that, even for hi-tech SMEs, size is an effective constraint. The different results from sensitivity tests are not presented here. First, the size effect on hi-tech SMEs is dependent on model selection (Table 4, column 6–7). Second, the mean effects of donation-performance are not different between SMEs and non-SMEs when a different SME definition is employed (Table 5, column 1–2). In our paper we did not emphasize the findings from the sensitivity tests. They only confirm the main findings or show the model-dependent nature of the main findings.

References

  1. Griffin, J.J.; Mahon, J.F. The Corporate Social Performance and Corporate Financial Performance Debate: Twenty-Five Years of Incomparable Research. Bus. Soc. 1997, 36, 5–31. [Google Scholar] [CrossRef]
  2. Roman, R.M.; Hayibor, S.; Agle, B.R. The Relationship between Social and Financial Performance: Repainting a Portrait. Bus. Soc. 1999, 38, 109–125. [Google Scholar] [CrossRef]
  3. Margolis, J.D.; Walsh, J.P. Misery Loves Companies: Rethinking Social Initiatives by Business. Adm. Sci. Q. 2003, 48, 268–305. [Google Scholar] [CrossRef]
  4. Orlitzky, M.; Schmidt, F.L.; Rynes, S.L. Corporate Social and Financial Performance: A Meta-Analysis. Organ. Stud. 2003, 24, 403–441. [Google Scholar] [CrossRef]
  5. Allouche, J.; Laroche, P. A meta-analytical investigation of the relationship between corporate social and financial performance. Rev. Gest. Resour. Hum. 2005, 57, 18–41. Available online: https://hal.archives-ouvertes.fr/hal-00923906 (accessed on 1 February 2018).
  6. Boaventura, J.M.G.; Silva, R.S.D.; Bandeira-de-Mello, R. Corporate Financial Performance and Corporate Social Performance: Methodological Development and the Theoretical Contribution of Empirical Studies. Revista Contabilidade & Finanças 2012, 23, 232–245. [Google Scholar] [CrossRef]
  7. Lynn, P. The problem of nonresponse. In International Handbook of Survey Methodology; De Leeuw, E.D., Hox, J.J., Dillman, D.A., Eds.; Routledge: New York, NY, USA, 2008; pp. 35–55. [Google Scholar]
  8. King, W.R.; He, J. External validity in IS survey research. Commun. Assoc. Inf. Syst. 2005, 16, 880–894. [Google Scholar]
  9. Phillips, D.L.; Clancy, K.J. Some Effects of “Social Desirability” in Survey Studies. Am. J. Sociol. 1972, 77, 921–940. [Google Scholar] [CrossRef]
  10. Campbell, D.T.; Stanley, J.C. Experimental and quasi-experimental designs for research on teaching. In Handbook of Research on Teaching; Gage, N.L., Ed.; Rand McNally: Chicago, IL, USA, 1963. [Google Scholar]
  11. Sudman, S. Reducing Response Error in Surveys. J. R. Stat. Soc. Ser. D 1980, 29, 237–273. [Google Scholar] [CrossRef]
  12. Freeman, R.E. Strategic Management: A Stakeholder Approach; Pitman: Boston, MA, USA, 1984. [Google Scholar]
  13. Perrini, F. SMEs and CSR Theory: Evidence and Implications from an Italian Perspective. J. Bus. Ethics 2006, 67, 305–316. [Google Scholar] [CrossRef]
  14. Spence, L.J. CSR and Small Business in a European Policy Context: The Five “C”s of CSR and Small Business Research Agenda 2007. Bus. Soc. Rev. 2007, 112, 533–552. [Google Scholar] [CrossRef]
  15. Thompson, J.K.; Smith, H.L. Social Responsibility and Small Business: Suggestions for Research. J. Small Bus. Manag. 1991, 29, 30–44. [Google Scholar]
  16. Quinn, J.J. Personal Ethics and Business Ethics: The Ethical Attitudes of Owner/Managers of Small Business. J. Bus. Ethics 1997, 16, 119–127. [Google Scholar] [CrossRef]
  17. Spence, L.J. Does size matter? The state of the art in small business ethics. Bus. Ethics A Eur. Rev. 1999, 8, 163–174. [Google Scholar] [CrossRef]
  18. Spence, L.J.; Schmidpeter, R. SMEs, Social Capital and the Common Good. J. Bus. Ethics 2003, 45, 93–108. [Google Scholar] [CrossRef]
  19. Lepoutre, J.; Heene, A. Investigating the Impact of Firm Size on Small Business Social Responsibility: A Critical Review. J. Bus. Ethics 2006, 67, 257–273. [Google Scholar] [CrossRef]
  20. Russo, A.; Perrini, F. Investigating Stakeholder Theory and Social Capital: CSR in Large Firms and SMEs. J. Bus. Ethics 2010, 91, 207–221. [Google Scholar] [CrossRef]
  21. Murillo, D.; Vallentin, S. CSR, SMES and Social Capital: An Empirical Study and Conceptual Reflection. Ramon Llull J. Appl. Ethics 2012, 1, 17–46. [Google Scholar] [CrossRef]
  22. Fassin, Y. SMEs and the fallacy of formalising CSR. Bus. Ethics A Eur. Rev. 2008, 17, 364–378. [Google Scholar] [CrossRef]
  23. Dincer, B.; Dincer, C. Corporate social responsibility decisions: A dilemma for SME executives? Soc. Responsib. J. 2013, 9, 177–187. [Google Scholar] [CrossRef]
  24. Santos, M. CSR in SMEs: Strategies, practices, motivations and obstacles. Soc. Responsib. J. 2011, 7, 490–508. [Google Scholar] [CrossRef]
  25. Williams, S.; Schaefer, A. Small and Medium-Sized Enterprises and Sustainability: Managers’ Values and Engagement with Environmental and Climate Change Issues. Bus. Strategy Environ. 2013, 22, 173–186. [Google Scholar] [CrossRef]
  26. Wilson, E. Social responsibility of business: What are the small business perspectives? J. Small Bus. Manag. 1980, 18, 17–24. [Google Scholar]
  27. Perera, O. How Material is ISO 26000 Social Responsibility to Small and Medium-Sized Enterprises (SMEs)? International Institute for Sustainable Development: Winnipeg, MB, Canada, 2008. [Google Scholar]
  28. Chrisman, J.J.; Fry, F.L. Public versus business expectations: Two views on social responsibility for small business. J. Small Bus. Manag. 1982, 20, 19–26. [Google Scholar]
  29. McMahon, J.M.; Harvey, R.J. An Analysis of the Factor Structure of Jones’ Moral Intensity Construct. J. Bus. Ethics 2006, 64, 381–404. [Google Scholar] [CrossRef]
  30. Perrini, F.; Pogutz, S.; Tencati, A. Corporate social responsibility in Italy: State of the art. J. Bus. Strategies 2006, 23, 65–91. [Google Scholar]
  31. Klein, S.; Vorbohle, K. Corporate social responsibility and stakeholder relations—The perspective of German small and medium-sized enterprises. In Ethics in Small and Medium Sized Enterprises: A Global Commentary; Spence, L., Painter-Morland, M., Eds.; Springer: Dordrecht, The Netherlands, 2011; pp. 215–225. [Google Scholar]
  32. Aragón, C.; Narvaiza, L.; Altuna, M. Why and How Does Social Responsibility Differ Among SMEs? A Social Capital Systemic Approach. J. Bus. Ethics 2016, 138, 365–384. [Google Scholar] [CrossRef]
  33. Van Auken, P.M.; Ireland, R.D. Plain talk about small business social responsibility. J. Small Bus. Manag. 1982, 20, 1–3. [Google Scholar]
  34. Longenecker, J.G.; McKinney, J.A.; Moore, C.W. Ethics in Small Business. J. Small Bus. Manag. 1989, 27, 27–31. [Google Scholar]
  35. Bridge, S.; O’Neill, K.; Cromie, S. Understanding Enterprise, Entrepreneurship and Small Business; Palgrave Macmillan: Basingstoke, UK, 1998. [Google Scholar]
  36. Spence, L.J.; Coles, A.-M.; Harris, L. The Forgotten Stakeholder? Ethics and Social Responsibility in Relation to Competitors. Bus. Soc. Rev. 2001, 106, 331–352. [Google Scholar] [CrossRef]
  37. Spence, L.J.; Rutherfoord, R. Small Business and Empirical Perspectives in Business Ethics: Editorial. J. Bus. Ethics 2003, 47, 1–5. [Google Scholar] [CrossRef]
  38. Putnam, R.D. Bowling Alone: America’s Declining Social Capital; Simon & Schuster: New York, NY, USA, 2000. [Google Scholar]
  39. Moore, G.; Spence, L. Editorial: Responsibility and Small Business. J. Bus. Ethics 2006, 67, 219–226. [Google Scholar] [CrossRef]
  40. Jamali, D.; Zanhour, M.; Keshishian, T. Peculiar Strengths and Relational Attributes of SMEs in the Context of CSR. J. Bus. Ethics 2009, 87, 355–377. [Google Scholar] [CrossRef]
  41. Bonneveux, E.; Calmé, I.; Soparnot, R. Strategic CSR assets within SMEs A comparative case study. Int. Bus. Res. 2012, 5, 38–49. [Google Scholar] [CrossRef]
  42. Brammer, S.; Millington, A. Firm size, organizational visibility and corporate philanthropy: An empirical analysis. Bus. Ethics A Eur. Rev. 2006, 15, 6–18. [Google Scholar] [CrossRef]
  43. Amato, L.H.; Amato, C.H. The Effects of Firm Size and Industry on Corporate Giving. J. Bus. Ethics 2007, 72, 229–241. [Google Scholar] [CrossRef]
  44. Bosma, N.; van Praag, M.; Thurik, R.; de Wit, G. The Value of Human and Social Capital Investments for the Business Performance of Startups. Small Bus. Econ. 2004, 23, 227–236. [Google Scholar] [CrossRef]
  45. Brüderl, J.; Preisendörfer, P. Network Support and the Success of Newly Founded Business. Small Bus. Econ. 1998, 10, 213–225. [Google Scholar] [CrossRef]
  46. Gronum, S.; Verreynne, M.-L.; Kastelle, T. The Role of Networks in Small and Medium-Sized Enterprise Innovation and Firm Performance. J. Small Bus. Manag. 2012, 50, 257–282. [Google Scholar] [CrossRef]
  47. Partanen, J.; Möller, K.; Westerlund, M.; Rajala, R.; Rajala, A. Social capital in the growth of science-and-technology-based SMEs. Ind. Market. Manag. 2008, 37, 513–522. [Google Scholar] [CrossRef]
  48. Lindstrand, A.; Melén, S.; Nordman, E.R. Turning social capital into business: A study of the internationalization of biotech SMEs. Int. Bus. Rev. 2011, 20, 194–212. [Google Scholar] [CrossRef]
  49. Westerlund, M.; Svahn, S. A relationship value perspective of social capital in networks of software SMEs. Ind. Market. Manag. 2008, 37, 492–501. [Google Scholar] [CrossRef]
  50. Jung, S.; Nam, C.; Yang, D.-H.; Kim, S. Does Corporate Sustainability Performance Increase Corporate Financial Performance? Focusing on the Information and Communication Technology Industry in Korea. Sustain. Dev. 2017. [Google Scholar] [CrossRef]
  51. Burke, T.A.; McKee, J.R.; Wilson, H.C.; Donahue, R.M.J.; Batenhorst, A.S.; Pathak, D.S. A Comparison of Time-and-Motion and Self-Reporting Methods of Work Measurement. J. Nurs. Admin. 2000, 30, 118–125. [Google Scholar] [CrossRef]
  52. Kim, S.; Sohn, S. Accounting Information Quality in Different Industries. Korean Account. Rev. 2011, 36, 179–215. (In Korean) [Google Scholar]
  53. Kile, O.; Phillips, M. Using Industry Classification Codes to Sample High-Technology Firm: Analysis and Recommendations. J. Account. Audit. Finance 2009, 24, 35–58. [Google Scholar] [CrossRef]
  54. Ullmann, A.A. Data in Search of a Theory: A Critical Examination of the Relationships among Social Performance, Social Disclosure, and Economic Performance of U.S. Firms. Acad. Manag. Rev. 1985, 10, 540–557. [Google Scholar]
  55. Lu, W.; Chau, K.W.; Wang, H.; Pan, W. A decade’s debate on the nexus between corporate social and corporate financial performance: A critical review of empirical studies 2002–2011. J. Clean. Prod. 2014, 79, 195–206. [Google Scholar] [CrossRef] [Green Version]
  56. Kramer, M.; Pfitzer, M.; Lee, P. Competitive Social Responsibility: Uncovering the Economic Rationale for Corporate Social Responsibility among Danish Small and Medium-Sized Enterprises. Available online: http://citeseerx.ist.psu.edu/viewdoc/download?doi=10.1.1.615.7117&rep=rep1&type=pdf (accessed on 19 January 2018).
  57. Tantalo, C.; Caroli, M.G.; Vanevenhoven, J. Corporate social responsibility and SME’s competitiveness. Int. J. Technol. Manag. 2012, 58, 129–151. [Google Scholar] [CrossRef]
  58. Torugsa, N.A.; O’Donohue, W.; Hecker, R. Capabilities, Proactive CSR and Financial Performance in SMEs: Empirical Evidence from an Australian Manufacturing Industry Sector. J. Bus. Ethics 2012, 109, 483–500. [Google Scholar] [CrossRef]
  59. Madueño, J.H.; Jorge, M.L.; Conesa, I.M.; Martínez-Martínez, D. Relationship between corporate social responsibility and competitive performance in Spanish SMEs: Empirical evidence from a stakeholders’ perspective. BRQ Bus. Res. Q. 2016, 19, 55–72. [Google Scholar] [CrossRef]
  60. Jain, P.; Vyas, V.; Chalasani, D.P.S. Corporate Social Responsibility and Financial Performance in SMEs: A Structural Equation Modelling Approach. Glob. Bus. Rev. 2016, 17, 630–653. [Google Scholar] [CrossRef]
  61. Stoian, C.; Gilman, M. Corporate Social Responsibility That “Pays”: A Strategic Approach to CSR for SMEs. J. Small Bus. Manag. 2017, 55, 5–31. [Google Scholar] [CrossRef]
  62. Panwar, R.; Nybakk, E.; Hansen, E.; Pinkse, J. Does the Business Case Matter? The Effect of a Perceived Business Case on Small Firms' Social Engagement. J. Bus. Ethics 2017, 144, 597–608. [Google Scholar] [CrossRef]
  63. Cantele, S.; Zardini, A. Is sustainability a competitive advantage for small businesses? An empirical analysis of possible mediators in the sustainability–financial performance relationship. J. Clean. Prod. 2018, 182, 166–176. [Google Scholar] [CrossRef]
  64. Rodríguez-Fernández, M. Company financial performance: Does board size matter? Case of the EUROSTOXX50 index. Cuadernos de Gestión 2014, 15, 15–38. [Google Scholar] [CrossRef]
  65. Rodriguez-Fernandez, M. Social responsibility and financial performance: The role of good corporate governance. BRQ Bus. Res. Q. 2016, 19, 137–151. [Google Scholar] [CrossRef]
  66. Burke, L.; Logsdon, J.M.; Mitchell, W.; Reiner, M.; Vogel, D. Corporate Community Involvement in the San Francisco Bay Area. Calif. Manag. Rev. 1986, 28, 122–141. [Google Scholar] [CrossRef]
  67. Brammer, S.; Millington, A. Does it pay to be different? An analysis of the relationship between corporate social and financial performance. Strateg. Manag. J. 2008, 29, 1325–1343. [Google Scholar] [CrossRef]
  68. Cheng, S.; Lin, K.Z.; Wong, W. Corporate social responsibility reporting and firm performance: Evidence from China. J. Manag. Gov. 2015. [Google Scholar] [CrossRef]
  69. Park, H.; Kim, S.-Y. A moderated mediation model of corporate social responsibility. J. Commun. Manag. 2015, 19, 306–323. [Google Scholar] [CrossRef]
  70. Wang, S.; Gao, Y.; Hodgkinson, G.; Rousseau, D.; Flood, P. Opening the Black Box of CSR Decision Making: A Policy-Capturing Study of Charitable Donation Decisions in China. J. Bus. Ethics 2015, 128, 665–683. [Google Scholar] [CrossRef]
  71. Porter, M.E.; Kramer, M.R. The Link between Competitive Advantage and Corporate Social Responsibility. Harv. Bus. Rev. 2007, 84, 78–92. [Google Scholar]
  72. Porter, M.; Kramer, M.R. Creating Shared Value. Harv. Bus. Rev. 2007, 89, 62–77. [Google Scholar]
  73. Fry, L.W.; Keim, G.D.; Meiners, R.E. Corporate Contributions: Altruistic or For-Profit? Acad. Manag. J. 1982, 25, 94–106. [Google Scholar] [CrossRef]
  74. Weber, M. The business case for corporate social responsibility: A company-level measurement approach for CSR. Eur. Manag. J. 2008, 26, 247–261. [Google Scholar] [CrossRef]
Table 1. Descriptive statistics.
Full Sample (n = 11,135)SME Sample (n = 4317)
VariableMeanMedianst. dev.MeanMedianst. dev.
ROA0.0160.0310.184−0.0120.0220.269
donation−8.410−8.3051.924−8.699−8.5901.870
size18.97418.6771.48717.91017.9130.683
lev0.4430.4460.2000.3900.3840.199
ocf0.0520.0510.0930.0410.0410.106
loss0.2180.0000.4130.3080.0000.462
growth0.1930.0731.8610.2060.0571.911
rnd0.0100.0010.0200.0140.0040.025
adv0.0070.0010.0180.0050.0010.013
age3.1663.2960.6642.9732.9440.602
beta0.8130.7880.4270.8580.8420.446
opin0.9971.0000.0520.9971.0000.057
big0.5671.0000.4960.4020.0000.490
for0.3210.1392.311−0.5480.0002.188
maj3.6183.7300.6073.5403.6580.639
kosdaq0.5371.0000.4990.8351.0000.371
SME10.3880.0000.4871.0001.0000.000
hitech_kim0.2300.0000.4210.3140.0000.464
hitech_ict0.1750.0000.3800.2640.0000.441
hitech_pham0.0900.0000.2860.1320.0000.339
1 Variable descriptions are in Appendix A; 2 Some variables reported here are the natural log versions to enhance distributions of the variables; therefore, the numbers cannot be interpreted to represent the raw levels of each variable. 3 st. dev. is an abbreviation of standard deviation.
Table 2. Correlation matrix.
(1)(2)(3)(4)(5)(6)(7)(8)(9)(10)(11)(12)(13)(14)(15)(16)(17)(18)(19)
(1) ROA1
(2) donation0.0631
<0.0001
(3) size0.069−0.0791
<0.0001<0.0001
(4) lev−0.133−0.1080.2481
<0.0001<0.0001<0.0001
(5) ocf0.2290.0790.020-0.2361
<0.0001<0.00010.1831<0.0001
(6) loss−0.232−0.082−0.0010.332-0.3811
<0.0001<0.00010.9473<0.0001<0.0001
(7) growth−0.0110.002−0.0190.0310.0020.0041
0.4530.8850.2170.0390.9130.797
(8) rnd−0.0040.041−0.125-0.127-0.0190.054−0.0111
0.7980.007<0.0001<0.00010.2050.0000.468
(9) adv−0.0150.125−0.068−0.048−0.0320.0560.0160.0261
0.335<0.0001<0.00010.0020.0340.0000.2990.094
(10) age0.027−0.0450.1970.128−0.1050.032−0.062−0.230−0.0751
0.0720.003<0.0001<0.0001<0.00010.038<0.0001<0.0001<0.0001
(11) beta−0.0120.0110.030−0.0460.0220.0110.0070.168−0.005−0.2371
0.4210.4830.0500.0020.1530.4690.616<0.00010.708<0.0001
(12) opin0.2070.017−0.013−0.0400.013−0.0240.0040.0240.014−0.0330.0221
<0.00010.2690.3880.0090.3860.1190.8150.1190.3430.0320.147
(13) big0.0180.0050.0610.0150.050−0.019−0.0110.0610.032−0.1320.0460.0051
0.2350.720<0.00010.3380.0010.2080.485<0.00010.035<0.00010.0030.730
(14) for0.0100.0110.101−0.1170.050−0.067−0.0480.0410.055−0.0730.0470.034−0.0051
0.5120.472<0.0001<0.00010.001<0.00010.0010.0070.000<0.00010.0020.0270.722
(15) maj0.127−0.0050.141−0.0530.125−0.148−0.022−0.040−0.0390.115−0.150−0.023−0.016−0.0201
<0.00010.735<0.00010.001<0.0001<0.00010.1480.0100.011<0.0001<0.00010.1290.2980.197
(16) kosdaq0.0050.025−0.225−0.0580.079−0.0430.0000.150−0.013−0.3330.2400.030−0.0160.052−0.0141
0.7190.094<0.00010.000<0.00010.0050.994<0.00010.378<0.0001<0.00010.0520.2950.0010.349
(17) hitech_kim0.0340.0290.0020−0.0380.082−0.012−0.0230.185−0.122−0.1750.103−0.0140.0110.000−0.0290.1211
0.0280.0590.8960.012<0.00010.4450.132<0.0001<0.0001<0.0001<0.00010.3570.4630.9830.0601<0.0001
(18) hitech_ict0.0250.036−0.067−0.0620.094−0.014−0.0220.257−0.073−0.2350.158−0.0210.062-0.028−0.0280.1530.6281
0.0970.018<0.0001<0.0001<0.00010.3440.157<0.0001<0.0001<0.0001<0.00010.1613<0.00010.07020.064<0.0001<0.0001
(19) hitech_pham0.0260.082−0.044−0.102−0.015−0.006−0.0140.0200.1490.0550.0700.022−0.0440.072−0.0580.0330.026−0.2341
0.091<0.00010.004<0.00010.3180.7130.3480.178<0.00010.000<0.00010.1440.004<0.00010.0000.0280.090<0.0001
Table provides Pearson’s correlation coefficients and p-values.
Table 3. OLS regression analysis (1).
VariablesModel 1Model 2Model 3Model 4Model 5Model 6Model 7Model 8
Full SampleNon-SME SubsampleSME SubsampleSME Size Top 20%SME Size Upper 50%SME Size Lower 50%SME Size Lowest 20%SME Size Lowest 10%
ROAt+1ROAt+1ROAt+1ROAt+1ROAt+1ROAt+1ROAt+1ROAt+1
donation0.003 ***0.003 ***0.0030.007 ***0.003 **0.0040.004−0.011
(3.197)(4.375)(1.474)(3.039)(2.512)(0.931)(0.489)(−1.012)
Control variablesYesYesYesYesYesYesYesYes
Industry and Year controlledYesYesYesYesYesYesYesYes
Observations11,1356818431786321582159864432
R-squared0.1350.1700.1800.2970.2670.2620.3870.834
F20.3517.9112.525.24513.289.3427.77730.87
t-statistics in parentheses. *** p < 0.01, ** p < 0.05, * p < 0.1; 1 Test model: ROAt+1 = α1 + β1donationt + β2sizet + β3levt + β4ocft + β5losst + β6growtht + β7rndt + β8advt + β9aget + β10betat + β11opint + β12bigt + β13fort + β14omajt + β15kosdaqt + ε. 2 Table 3 shows the test result of the test model. Columns report the test results under the different data sets. From model 4 to 8 decile divisions were carried out within the SMEs subsample.
Table 4. OLS regression analysis (2).
VariablesModel 1Model 2Model 3Model 4Model 5Model 6Model 7
SME Hi-Tech SubsampleSME Hi-Tech Subsample Size Top 20%SME Hi-Tech Subsample Size Upper 50%SME Hi-Tech Subsample Size Lower 50%SME Hi-Tech Subsample Size Lowest 20%SME ICT SubsampleSME ICT Sample Size Lowest 20%
ROAt+1ROAt+1ROAt+1ROAt+1ROAt+1ROAt+1ROAt+1
donation0.005 ***0.011 **0.007 **0.0040.0060.007 ***0.010 **
(2.736)(2.271)(2.349)(1.484)(1.531)(3.449)(1.992)
Control variablesYesYesYesYesYesYesYes
Industry and Year controlledYesYesYesYesYesYesYes
Observations13572706786792681139228
R-squared0.3000.3490.2770.3600.4940.2670.399
F16.514.1117.21610.546.91713.314.226
t-statistics in parentheses. *** p < 0.01, ** p < 0.05, * p < 0.1; 1 Test model: ROAt+1 = α1+ β1donationt + β2sizet + β3levt + β4ocft + β5losst + β6growtht + β7rndt + β8advt + β9aget + β10betat + β11opint + β12bigt + β13fort + β14omajt + β15kosdaqt + ε. 2 Table 4 shows the test results for our test model. Columns report the test results under the different data sets. Models 1–5 are based on Kim and Sohn [52]’s classification, and model 6 to 7 from Kile and Phillips [53].
Table 5. OLS regression analysis (3).
VariablesModel 1Model 2Model 3Model 4Model 5Model 6Model 7
Non-SME SubsampleSME SubsampleSME Big SubsampleSME Middle & Small SubsampleSME Hi-Tech SubsampleSME Big and Hi-Tech SubsampleSME Middle/Small and Hi-Tech Subsample
ROAt+1ROAt+1ROAt+1ROAt+1ROAt+1ROAt+1ROAt+1
donation0.002 ***0.004 **0.004 ***−0.020 *0.005 ***0.005 ***−0.001
(2.680)(2.396)(3.646)(−1.795)(3.270)(3.093)(−0.089)
Control variablesYesYesYesYesYesYesYes
Industry and Year controlledYesYesYesYesYesYesYes
Observations55925543508246114421328114
R-squared0.1760.1630.2260.6230.2720.2760.428
F14.8513.3718.309.90615.3114.311.716
t-statistics in parentheses. *** p < 0.01, ** p < 0.05, * p < 0.1; 1 Test model: ROAt+1 = α1+ β1donationt + β2sizet + β3levt + β4ocft + β5losst + β6growtht + β7rndt + β8advt + β9aget + β10betat + β11opint + β12bigt + β13fort + β14omajt + β15kosdaqt + ε. 2 Table 5 shows the test results for our test model. Columns report the test results under the different data sets. Models 1–7 are based on SME definitions where 50–250 employees is a big SME, 10–50 is a middle-size SME, and less than 10 is a small SME.
Table 6. Alternative SME.
Panel A: Full SamplePanel B: SME Subsample (# of Employee)
Variablesn = 11,135FrequencyVariablesn = 5543Frequency
SME1431738.77%SME25543100.00%
SME2554349.78%SME_big508291.68%
SME_big508245.64%SME_med/small4618.32%
SME_med/small4614.14%

