Article

Life Cycle Environmental Impact Assessment of Circular Agriculture: A Case Study in Fuqing, China

1
State Key Laboratory of Earth Surface Processes and Resource Ecology, Faculty of Geographical Science, Beijing Normal University, Beijing 100875, China
2
College of Resources Science and Technology, Faculty of Geographical Science, Beijing Normal University, Beijing 100875, China
3
Sustainable Process Integration Laboratory—SPIL, NETME Centre, Faculty of Mechanical Engineering, Brno University of Technology—VUT Brno, Technická 2896/2, 616 69 Brno, Czech Republic
4
Fujian Academy of Agricultural Sciences, Fuzhou 350003, China
5
Joint Center for Global Change and China Green Development, Beijing Normal University, Beijing 100875, China
*
Author to whom correspondence should be addressed.
Sustainability 2018, 10(6), 1810; https://doi.org/10.3390/su10061810
Submission received: 13 May 2018 / Revised: 27 May 2018 / Accepted: 27 May 2018 / Published: 31 May 2018
(This article belongs to the Section Sustainable Agriculture)

Abstract

:
The process for reasonably evaluating the potential impacts of circular agriculture on the environment has become a key issue in the sustainable development of circular agriculture. Based on this consideration, by using Life Cycle Assessment (LCA) and focusing on the circular agriculture industry company of Xingyuan, Fuqing, this paper evaluates the potential impacts of the pig farming industry-dragon fruit planting-forage planting-fishery industry-mushroom planting-biogas generating-organic fertilizer production circular agriculture model compared to a main agriculture industrial model, the pig farming industry, from environmental and environmental-economic perspectives. Moreover, this paper determines key elements that restrict the development of circular agriculture through a sensitivity analysis. The results show that if we simply consider the potential environmental impacts, circular agriculture does not produce better results than those of the main agricultural production model. In addition, if we consider reducing the potential environmental impact as well as improving the economic benefits from the perspective of a “reduction ring”, we should consider removing mushroom planting and organic fertilizer from the circular agriculture framework. Moreover, if we want to reduce the potential environmental impact without changing the current recycling model, we should focus on the premix components, especially the three main components of corn, soybean meal, and whey protein concentrate.

1. Introduction

Because of increasingly serious environmental problems, countries around the world have promised to consider sustainable development as the main trend for future development. As the foundation of national economies, agriculture needs to become sustainable to further the broader sustainable development goals in key priority areas [1,2]. At present, China has experienced development that has resulted in improvements to people’s living standards; however, this development has also resulted in adverse effects such as environmental pollution and irrational use of resources, which are specifically reflected in China’s agriculture [3,4]. Characterized by high consumption, high pollution, and low efficiency for a long time the traditional agricultural production model has caused serious problems related to the irrational use of resources and environmental pollution as a result of China’s agricultural development [5]. Currently, the agricultural wastes originating from planting and aquaculture mainly include plant-type residual wastes, animal-type residual wastes, and processing-type residual wastes from agricultural production processes [6]. It is estimated that China produces about 3.8 billion tons of livestock and poultry manure each year. However, the overall utilization rate is less than 60%. Moreover, the annual outputs of straw are nearly 1.004 billion tons and 200 million tons go unused [7]. In addition, agricultural waste not being used for recycling is placed and burned at random, which seriously affects the ecological environment [8]. These figures show that the irrational use of resources and environmental pollution have become the two major factors restricting China’s agricultural development. In terms of the problems with the process of agricultural development, the Chinese government has explicitly proposed that “conserving and saving resources, streamlining the production process, recycling industrial chains and waste resources” should be promoted in the field of agriculture, and a recycling system for agricultural and forestry industries must be established [9].
After years of being put into practice, the idea of circular development, which is “replacing the one-way economy with a circular economy using various resources by recycling,” has gradually been recognized and accepted by more countries since it was first put forward by the American eco-economist Boulding in 1966 [10,11]. Over the past two decades, China has gradually introduced the concept of the circular economy into the field of agricultural development and explored the concepts and development principles of circular agriculture [12]. As a result, a series of models for circular agriculture are gradually being developed in various areas, such as the pig-biogas-grain model [13], straw recycling model [14], “four-in-one” courtyard recycling model [15], the circular and clean farmland production model of double cropping rice and wheat [16], and the recycling agricultural production model of cow-biogas-forage [17]. Among these models, a core agricultural industry that utilizes materials from multi-level recycling and the multiple levels of energy of other agricultural industries has been widely used to achieve the goal of combining planting and farming [18,19]. Currently, many scholars have conducted a wide range of evaluations on this circular agriculture model from the perspective of inputs and outputs [20,21,22] as well as energy [23,24], but these scholars have seldom quantified the potential harm to the environment. Moreover, scholars have blindly considered that the process of recycling agriculture results in zero emissions. This conclusion may result in a development trap where there is a vicious cycle of pursuing the economic benefits of circular agriculture at the expense of environmental damage. Thus, reasonably assessing the potential threats to the environment during the operation of circular agriculture and understanding the key elements that restrict the sustainable development of circular agriculture are of great significance to promoting the sustainable development of circular agriculture.
As an effective method to evaluate the environmental factors and their potential impact on the whole life cycle of products, from raw materials to production processes to final disposal, a life cycle assessment (LCA) has been widely used to evaluate the environmental load caused by these processes since it was first proposed [25,26]. Currently, LCA is also widely used in agriculture-related industries, specifically involving fisheries, animal husbandry, planting, food processing, packaging, and waste disposal, etc. The applications of LCA in these fields have been systematized, diversified, and intensified [27,28]. However, there are still only a few studies that apply a LCA to analyze circular agriculture. Based on this consideration, this study uses the circular agriculture industry company in Fuqing, Fujian as an example and from environmental and environmental-economic perspectives evaluates the potential impact of the pig farming industry-dragon fruit planting-forage planting-fishery-mushroom planting-biogas generating-organic fertilizer production circular agriculture model compared to a main industrial model, namely, the pig farming industry. Moreover, this article attempts to determine the key elements that restrict the development of this circular agriculture model through a sensitivity analysis to provide a scientific basis for the sustainable development of circular agriculture.

2. Research Methods and Data Sources

2.1. Research Methods

Generally, the LCA evaluation method includes four steps: goal and scope definition, life cycle inventory (LCI) analysis, impact assessment and results interpretation [29,30]. Among these steps, the goal and scope definition, which mainly includes defining the objectives of the evaluation, determining the functional unit, and clarifying the system boundary, is the prerequisite and basis for carrying out an LCA evaluation.

2.1.1. Objectives of the Evaluation

This study mainly attempts to quantify and compare the environmental load of circular agriculture to the main industrial model, namely, the pig farming industry, from environmental and environmental-economic perspectives; to determine the key elements that restrict the development of the circular agriculture model through a sensitivity analysis and to address the lack of research on environmental impact assessments of circular agriculture.

2.1.2. Functional Unit

Circular agriculture is a system where different agricultural industrial chains are connected by means of inputs-outputs. In this process, different agricultural industrial chains exist at different agricultural outputs. It is necessary to establish a functional unit to evaluate circular agriculture. In the circular model described in this study, the pig farming industry is not only the core link of the recycling industries but also the main mechanism for the enterprise’s economic income. Moreover, pig farming is closely linked with the circular relationship of other industrial structures. Thus, the pig farming industry is the ideal choice for this functional unit. Therefore, this study selected a 100-kg live pig as the functional unit of the study.

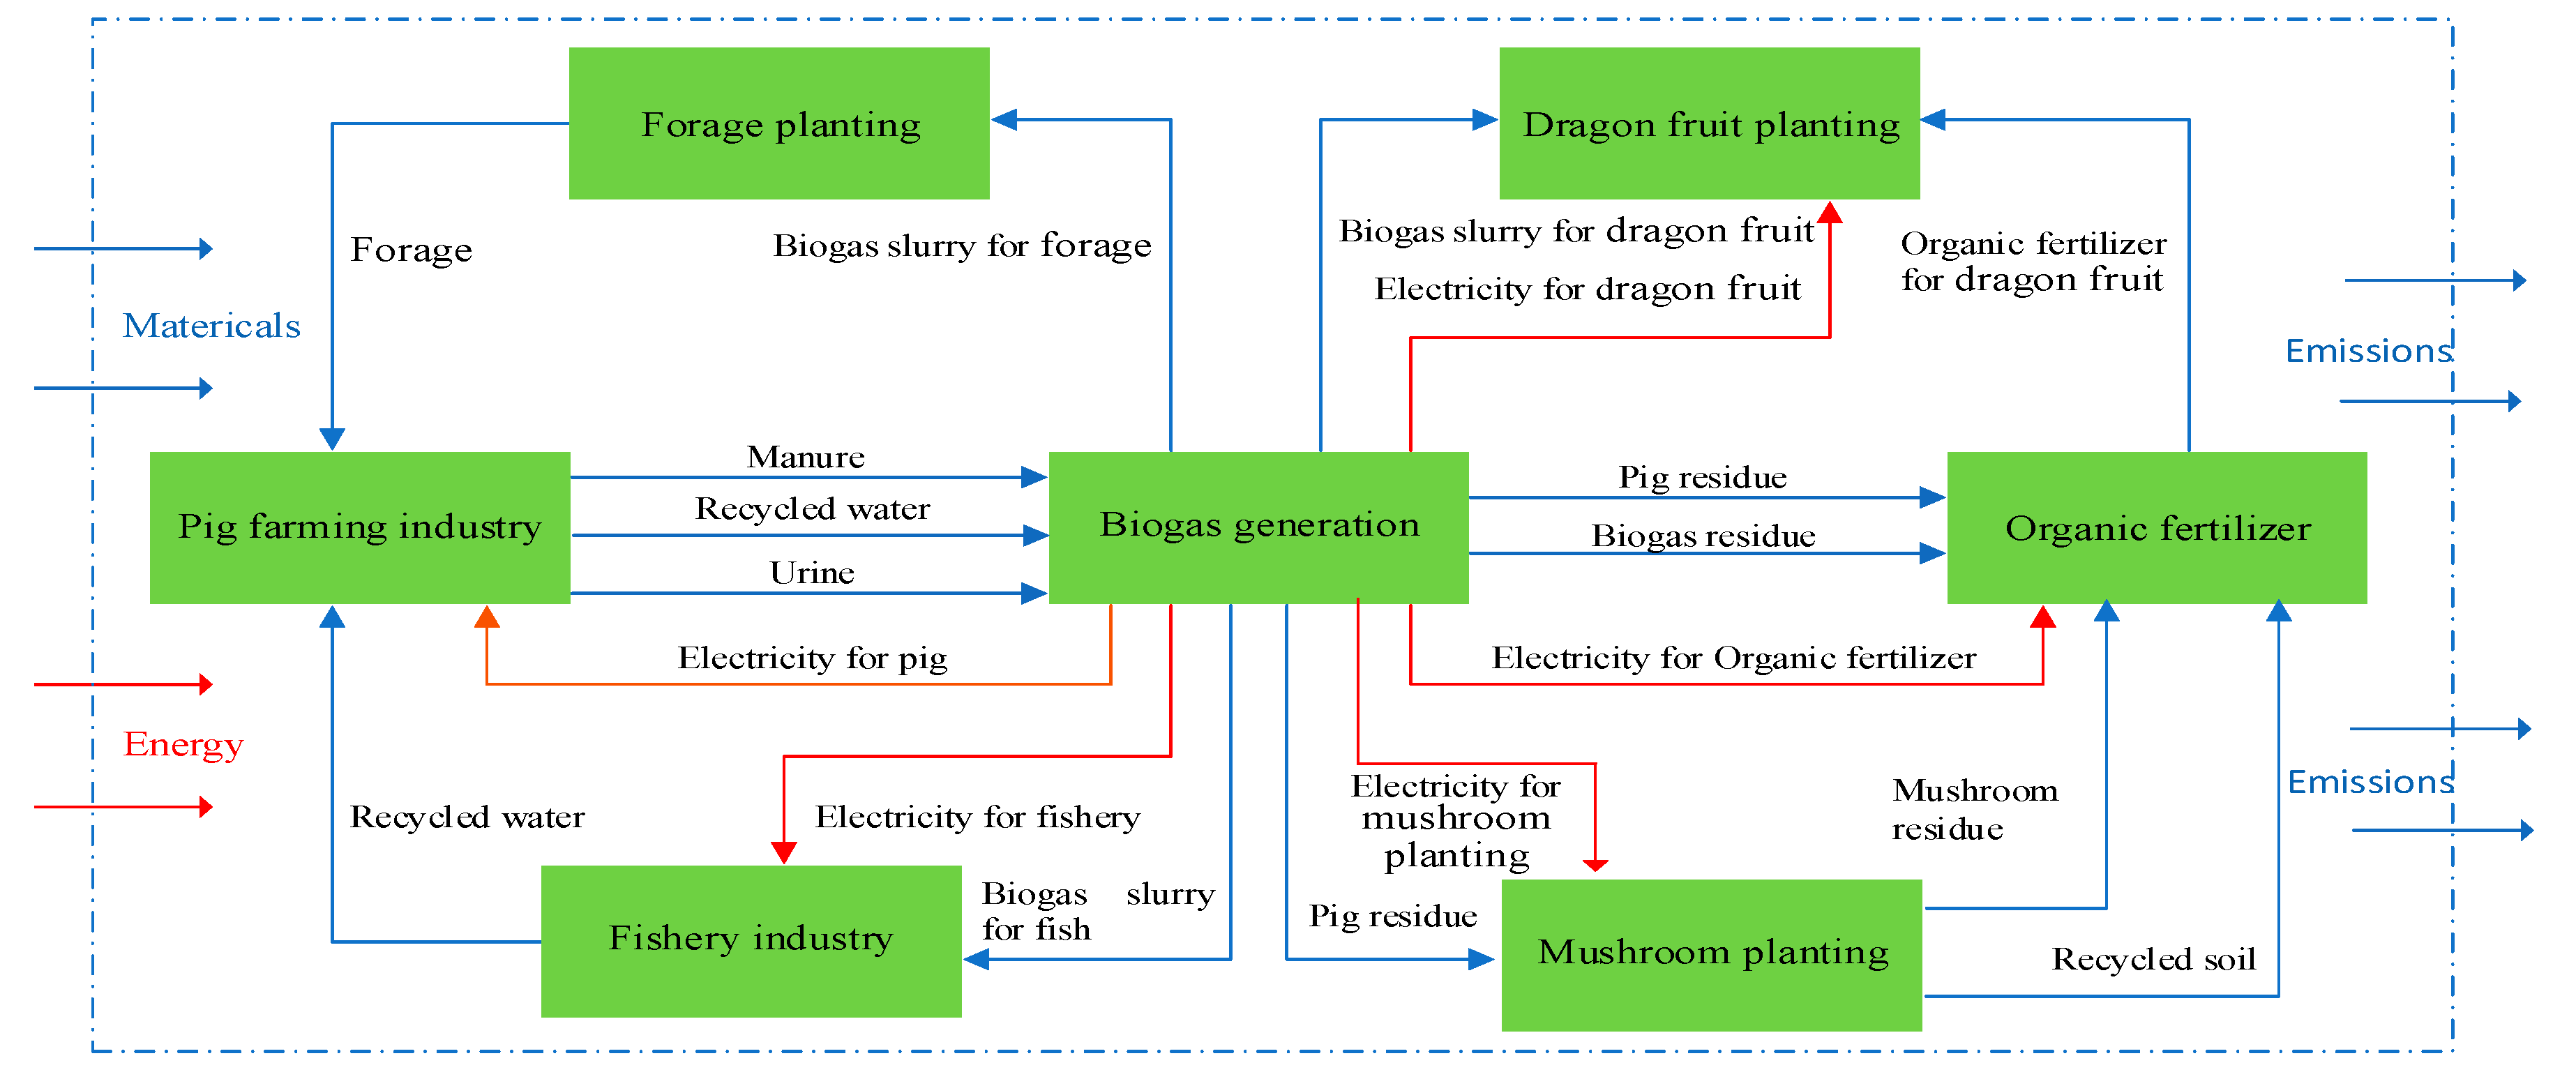
2.1.3. System Boundary

This article mainly considers the circular agriculture industry company of Xingyuan in Fuqing City, China, as an example for evaluation. The circular agriculture at this site mainly involves the sub-industry chains of pig farming, dragon fruit planting, forage planting, fishery industry, mushroom planting, biogas generation, and organic fertilizer production. Through the recycling of materials at multiple levels and the recycling of wastes, this circular agriculture industry has formed a complex ecosystem. More importantly, this system is relatively complete and advanced in China, and the various industrial chains are closely linked in this circular agricultural industry. Therefore, this site is suitable for establishing a complete evaluation system and a layer-by-layer analysis.
The choice of a system boundary has a significant impact on the results of an LCA. According to the objectives of this study, the system boundary is shown in Figure 1.
After the wastes are separated from the pig farming industry, pig manure is used to cultivate mushrooms and produce organic fertilizer only after it is treated by the sewage treatment system. After treatment with anaerobic fermentation as part of the biogas project, the waste generates biogas, and after being converted into electricity, it can be used for normal electricity consumption on the pig farm and for mushroom planting and other related-industries. The biogas slurry generated in the biogas project can be used in the fishery industry, dragon fruit planting, and forage planting. Forage planting is treated as feed, and water from a pond is treated as flushing water for the pig farming industry. The biogas residue from the waste water treatment, the mushroom residue, and the recycled soil from the mushroom planting are used as raw materials for the organic fertilizer. Moreover, approximately 5.5% of the organic fertilizer is used for dragon fruit planting, and the remaining 94.5% is for sale. In addition, this study considers the process of production and transportation of the premix and complete feed. However, because the production of the organic fertilizer sold to the market is not involved in the circular process, it is not considered in this study.

2.2. Data Sources

All the original data in this article were obtained through a field investigation of the circular agriculture industry company of Xingyuan (Fuqing, China) in 2015. Through a detailed record of the various input and output data, this study seeks to present the on-the-ground situation of this circular agriculture model to the greatest extent possible. As a subsystem of the pig farming industry involves transport, the distance traveled for the premix and complete feed was calculated based on communication with corporate technicians; we ensured that, for the transportation of the premix and complete feed, a 30-ton diesel-fueled truck was used with an average travel distance of 200 km. The specific input-output data of the subsystems of the circular agriculture system for 100-kg live pigs are shown in Appendix A, Table A1 and Table A2.
The above input-output data were mainly provided by Xingyuan Co., Ltd. (Fuqing, China) and converted according to the production of 100 kg live pigs. After all the data were converted proportionally based on 100 kg of live pigs, the corresponding data will be imported into Gabi software, and according to the corresponding allocation standard and impact assessment methodology, we can finally receive the required results. During the field investigation, some data were inevitably omitted due to the capacity of data acquisition. However, the data obtained provides the best information on the enterprises to the maximum extent and can best reflect the inputs-outputs of circular agriculture. In addition, the entire analytical process has the same caliber of data, which also ensures the integrity of the results to the greatest extent. Finally, it should be noted that, according to the existing research results, although the proportion of some substances and energy are small, they will still have significant impacts on the environment [31]. Therefore, these data (such as the consumption of diesel) are also included in the framework of the LCA analysis.

2.3. Allocation Criteria

An allocation of the environmental load has always been the focus of a LCA analysis [32], and this study is no exception. For an entire recycling industry chain, system expansion is usually used to solve the allocation problem. If all the outputs of a sub-industry chain are used as inputs in the other industry chains, then the distribution does not involve the circular framework. However, it is undeniable that, although circular agriculture can form a unified whole through input-output data linking different sub-industrial chains, there are differences in the degree of material utilization among different sub-industrial chains, that is, the output data from different industrial chains cannot be fully utilized, which results in the problem of environmental load allocation of different sub-industry chains. Considering the pig residue in Table A1 as an example, we can see that the amount of pig residue produced from biogas power generation is 23.10 kg, while the other sub-industries that need to use pig residue as an input for production are mushroom planting and organic fertilizer production, respectively. The required amount of pig residue is 6.33 kg and 10.44 kg, respectively. Thus, there are still 6.33 kg of pig residue that did not flow into the recycling industry chain. Therefore, if the 16.77 kg of pig residue flowing in the circulation system is assumed to bear the environmental burden of 23.10 kg of pig residue, the environmental cost of the circular agriculture system will be overestimated, which is unfair to the circular agriculture system. Based on this consideration, this study needed to allocate the environmental burden of the products in the circular agriculture system.
In general, when evaluated by an LCA analysis, the commonly used allocation criteria include mass-based allocation, economic-based allocation, and energy-based allocation. In this paper, the units of input-output data in each sub-industry chain are mainly mass. Considering data acquisition and ensuring the units are as consistent as possible, in this article, we use quality mass-based allocation to allocate the environmental load. The specific details on the utilization of the major outputs involved in the allocation of different sub-industry chains are shown in Table 1.

2.4. Impact Categories and Impact Assessment Methodology

Currently, evaluation frameworks such as the tool for the reduction and assessment of chemical and other environmental impacts (TRACI) [33] and the environmental design of industrial products (EDIP) [34] are widely used to evaluate the impact of different products and processes on the environmental burden. This paper uses CML to evaluate the environmental impact of the pig farming industry-dragon fruit planting-forage planting-fishery industry-mushroom planting-biogas generation-organic fertilizer production circular agriculture model. The CML is a problem-oriented LCA method developed by the Center of Environmental Sciences of the University of Leiden in the Netherlands. The index of CML is based on the objective of providing the best practices for midpoint indicators, and it objectively evaluates the environmental impact caused by the process of production [35].
Considering the objective of this article, we chose three types of indicators to evaluate the potential environmental load caused by the industry chains of circular agriculture. The first type of indicator is the total raw material or resource consumption that consists of ADP elements and ADP fossil fuels. The second indicator category is the impact of the atmosphere and water resources that consist of the acidification potential (AP), global warming potential (GWP), photochemical ozone creation potential (POCP), and ozone layer depletion potential (ODP), which are used to assess the impact on the atmosphere, and the eutrophication potential (EP), which is used to assess the impact on water. The last indicator category is toxicity, including freshwater aquatic eco-toxicity (FAETP), human toxicity potential (HTP), marine aquatic eco-toxicity (MAETP), and terrestrial eco-toxicity potential (TETP). Moreover, in order to analyze the economic-environmental benefits, the economic outputs divided by the corresponding environmental indicators are used to reflect the indicators.

3. Results

3.1. LCA Results of the Environmental Effects in the Circular Agriculture Industry Chain and the Main Industrial Model-Pig Farming Industry

For this analysis, we set two scenarios. S1 is used to represent the main industrial model—the pig farming industry—and S2 is used to represent the pig farming industry-dragon fruit planting-forage planting-fishery industry-mushroom planting-biogas generation-organic fertilizer production circular agriculture model. Using Gabi software, the potential environmental impact of the whole circular industry chain and the main industrial model was calculated. The specific results are shown in Table 2.
As seen in Table 2, if considered simply from the environmental perspective and ignoring the economic benefits of circular agriculture, whether considering the depletion of resources, materials, impacts on the atmosphere and water resources or the toxicological indicators of the main industrial approach, the environmental costs of the pig farming industry are less than the comprehensive utilization of the outputs of the different industries. Considering the impact on the atmosphere index AP in Table 2, for example, the AP equivalent value in S1 is 1.47 × 100 kg SO2 and 1.62 × 100 kg SO2 in S2, and the proportion of S1 in S2 is 90.48%. The results from the other indicators are similar. That is, the value of each index in S1 is less than that in S2. Thus, this result may be contrary to the original intention of the Chinese government that has always emphasized the need to vigorously develop circular agriculture. From the perspective of the life cycle analysis, the results show that although circular agriculture uses the outputs of different agricultural sub-industry chains for production and implements multi-level utilization, the related benefits generated in the production process may partially offset the environmental load caused by material and energy inputs; however, it is undeniable that with the establishment of the multi-cycle industrial approach, the corresponding production investment will increase. Due to the distribution effect, the number of inputs that are used for circular agriculture and that flow through the entire industrial chain is likely to increase, which will, to some extent, result in a positive contribution to each indicator. Based on the final calculation, this process cannot offset the emissions of additional inputs by only increasing the circular rate. Therefore, on the surface, circular agriculture seemingly improves the cycle utilization rate by linking different sub-industry chains, but circular agriculture cannot offset the extra environmental costs caused by additional inputs. Therefore, if we simply consider the environmental impact, then the environmental effects of the circular agriculture approach of linking different sub-industrial chains may not be better than the main mode of production. Thus, when the circular agricultural model is extended to a certain extent, the environmental emissions can be reduced by increasing circular rates or reducing the input of raw materials. However, currently, a longer chain is not better for the circular agriculture industry chain. The development of circular agriculture does not mean that the circular industry chain will be extended without consideration, but its development will involve the rational construction of the best circular mode and will ensure the environmental costs are less than the main agriculture mode of production. This scenario is needed for the sustainable development of circular agriculture in the future.

3.2. Economic-Environmental Benefits of Circular Agriculture and the Pig Farming Industry

The above results only represent the impact of the circular agricultural production mode and the main agriculture industrial model on environmental costs. The calculation process did not consider the economic outputs. Since the government strongly advocates the development of circular agriculture, it attaches importance not only to the relevant environmental indicators but also to the economic value created by circular agriculture. Thus, this paper will consider the economic-environmental benefits of circular agriculture and the main agricultural-pig farming industry. The economic outputs of the respective scenarios divided by the corresponding environmental indicators are the indicators of the economic-environmental benefits. The larger the indicator value, the better the results. Thus the economic-environmental benefits of AP, GWP, POCP, ODP, EP, FAETP, HTP, MAETP, and TETPADP, are represented by BAP, BGWP, BPOCP, BODP, BEP, BFAETP, BHTP, BMAETP and BTETP, respectively. Because the ADP elements and ADP fossil fuels only consider inputs, they are not appropriate for the economic-environmental benefit analyses. The monetary unit is the Chinese Yuan. The specific results are shown in Table 3.
Table 3 shows that if we consider the economic benefits of the circular agriculture model and pig farming industry, the results of the calculation are very different from those that only consider the environmental impact. Compared to the calculations that only consider the environmental impact, the index values of BAP, BGWP, BPOCP, BODP, BEP, and BTETP of the circular agriculture industry are better than the corresponding index values of the main industrial model pig farming industry, while the BFAETP, BHTP, and BMAETP index values of the circular agriculture model are lower compared to those of the pig farming industry, which indicates that the circular industry and the simple industrial production mode do not have a simple relationship in terms of one being superior or inferior to the other. Depending on the perspective taken, the final results may be different. If only considering the economic benefits of agricultural industries and their impacts on the atmosphere and water resources, the economic benefit per unit of environmental cost of the circular agriculture model is better than that of the traditional production mode. In contrast, if considering the economic benefits per unit of toxic indicators, the circular agriculture industry may be not better than the traditional pig farming industry. This result may be because the additional inputs of materials and energy are far more harmful to the environment over the whole life cycle than the economic value generated by additional inputs. Overall, considering the economic benefits and the dominance of the index, the circular agriculture mode is better than the traditional agriculture mode, and if relatively less environmentally toxic substances can replace the previously used additional inputs of materials and energy, then the results of circular agriculture should be better.

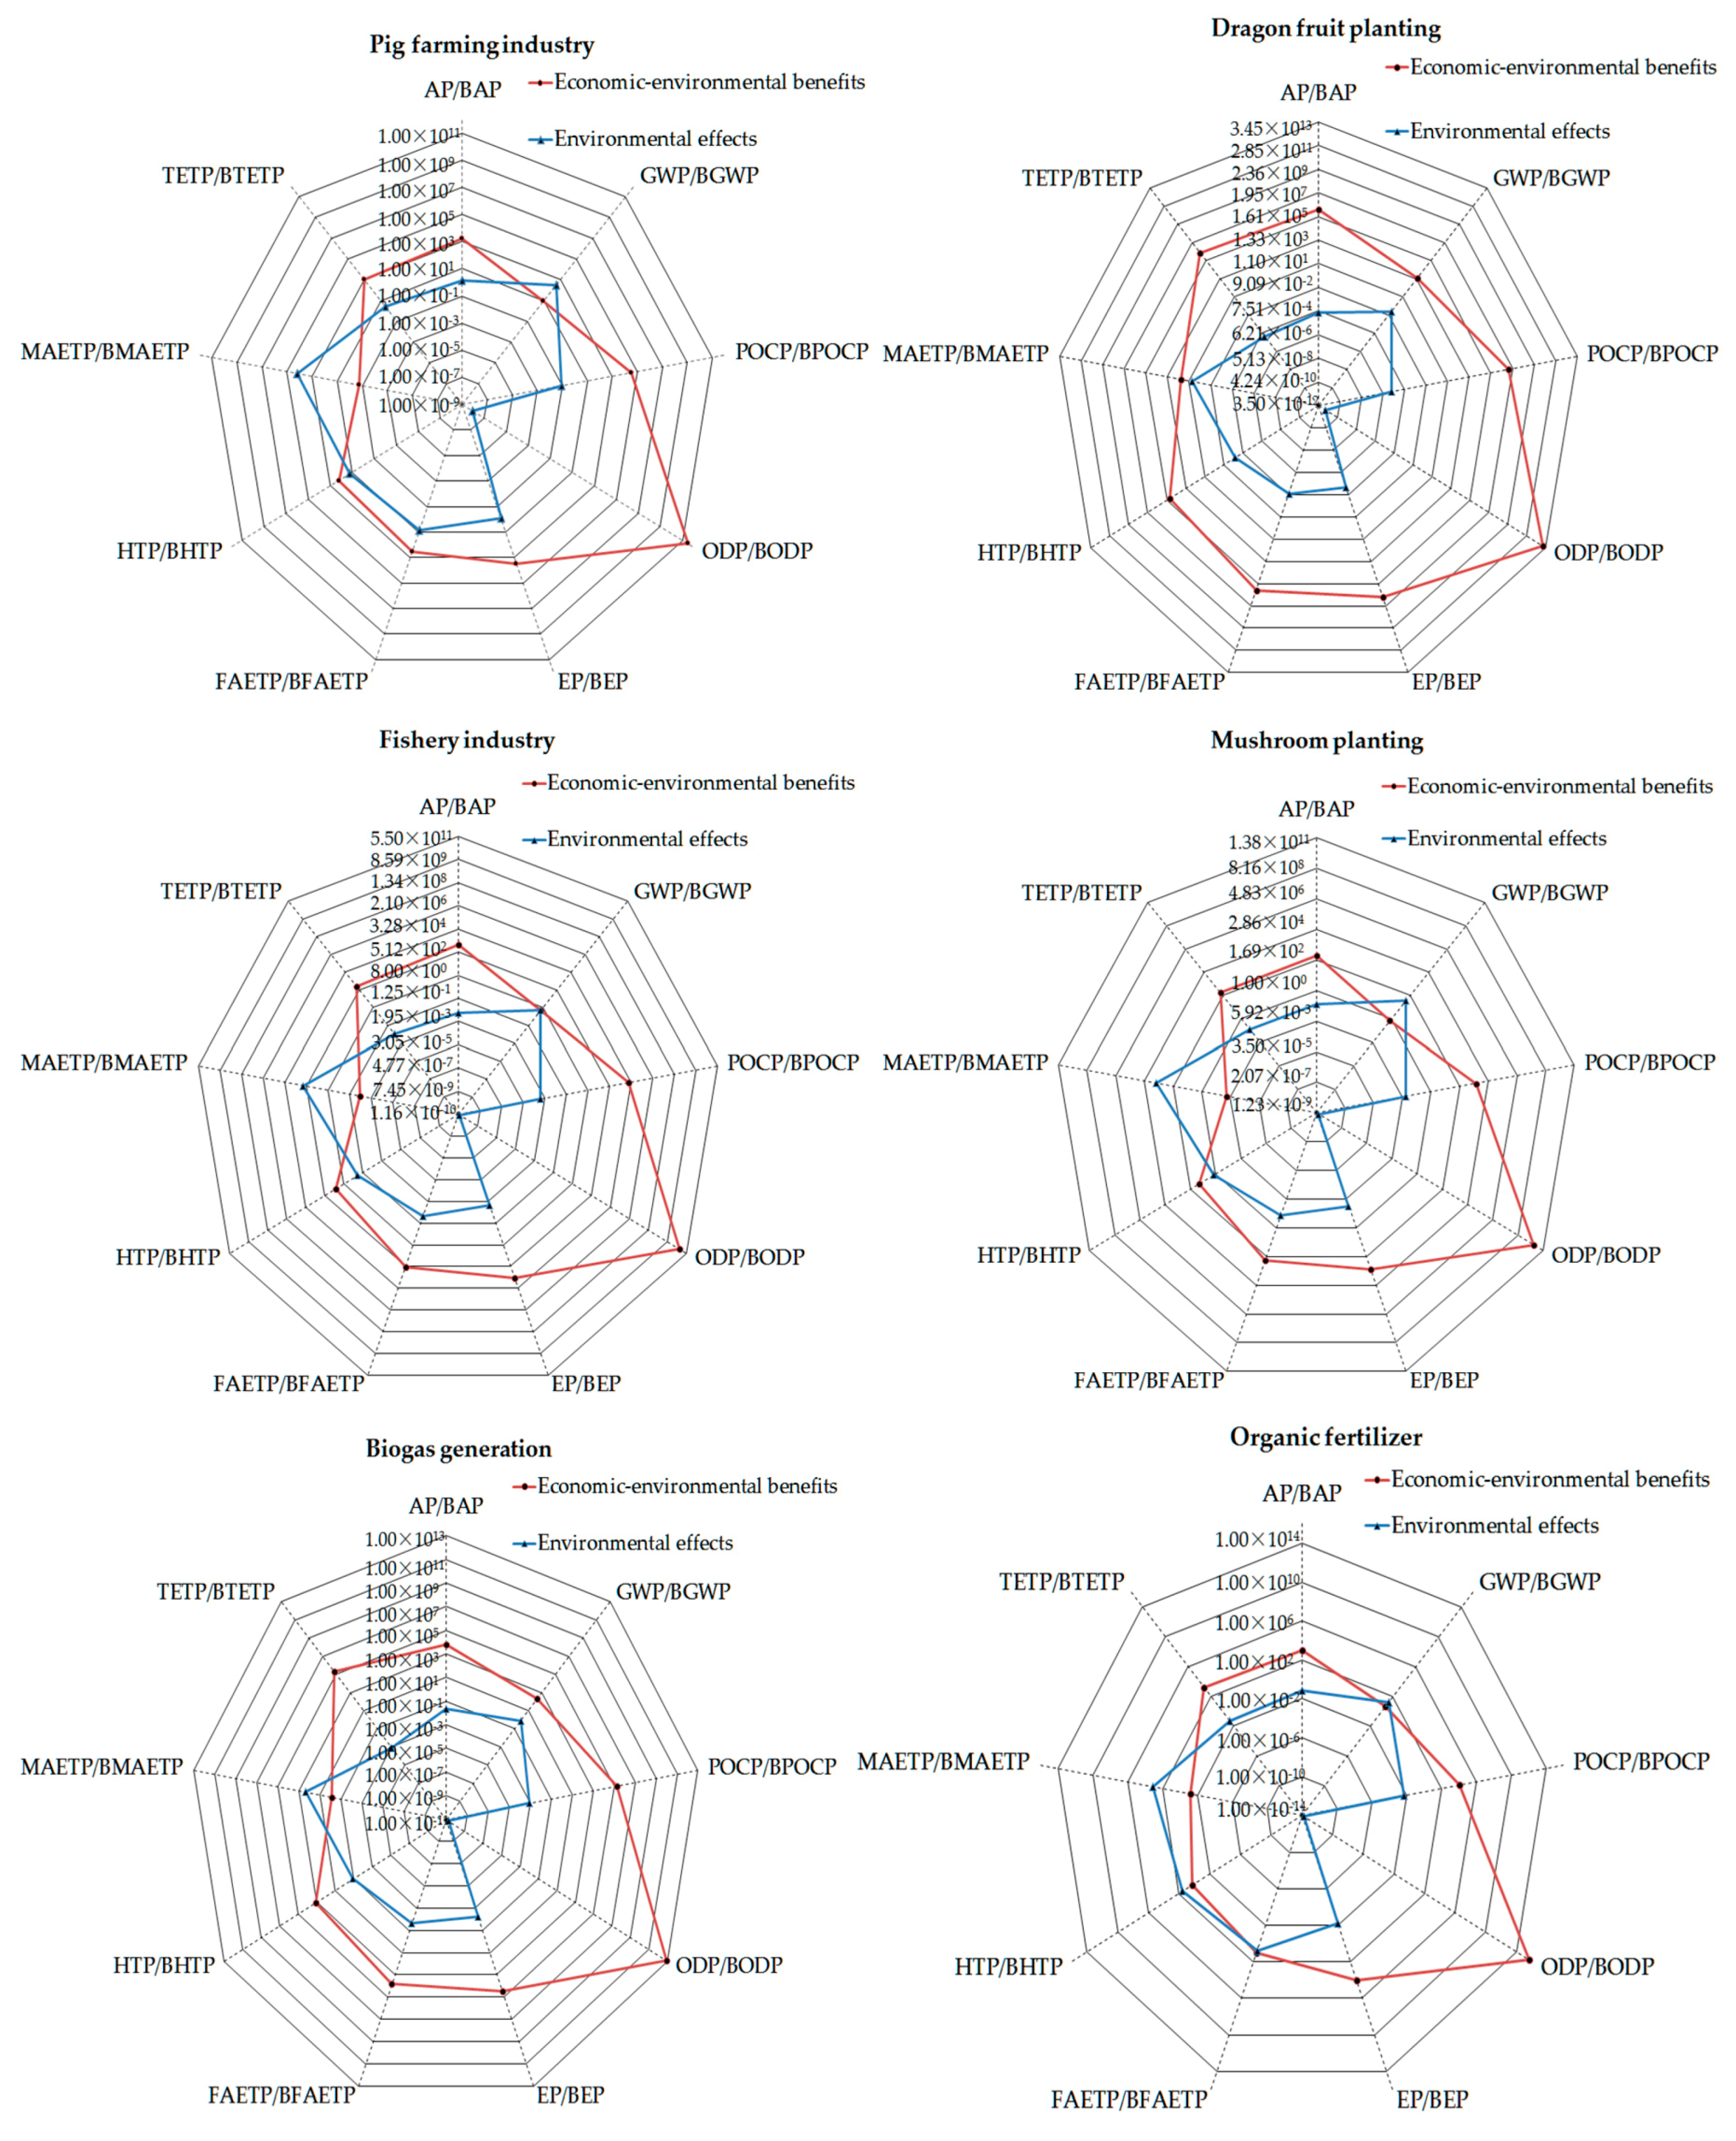
3.3. The Environmental Impact and Economic Benefit Evaluation of the Sub-Industrial Chain of the Circular Agricultural Industry Chain

As the previous calculations show, whether considering the impact on the environment or the perspective of economic benefits per unit of toxic indicators throughout the life cycle of the production mode, circular agriculture appears to be less efficient compared to traditional pig farming industry. To determine the link that makes circular agriculture overstaffed and whether any “ring reduction” measures could reduce the environmental emissions of circular agriculture throughout its life cycle, this paper calculated and compared the environmental impact and economic benefits of the sub-industry chains of the circular agricultural model. The results are shown in Figure 2.
As the final product of forage planting (grass) is used as the material for the pig farming industry, there is no residual value of forage planting. As a result, there is no corresponding environmental-economic indicator for forage planting. Therefore, Figure 2 shows the environmental and economic indicators of the remaining six sub-industrial chains. In addition, it should be noted that to facilitate the mapping, the environmental and environmental-economic index values of the biogas generation industry are shown in the figure as absolute values, and its true value is negative. This situation is reflected in Table 4, which shows that throughout the whole life cycle, the primary benefit generated by biogas generation is far greater than the harm to the environment caused by the substances needed for biogas generation, making the final impact of the biogas industry an environmental benefit and not a burden. Therefore, the purpose of reducing the emissions of the traditional production mode can be achieved by connecting the biogas generation industry with the traditional pig farming industry through the input-output relationship.
In addition, from the environmental protection perspective, for the circular agricultural model built around the pig farming industry, as shown in Figure 2 and Table 4, compared to the main production mode of pig farming, among the six sub-industry chains, the potentially most harmful industry chains are the organic fertilizer industry and mushroom planting. For example, in addition to the pig farming industry, seven types of environmental indicators for mushroom planting rank the highest, and two rank second, while two types of environmental indicators for the organic fertilizer industry rank highest, and six rank second, and HTP is greater than the same index for the pig farming industry. Thus, to reduce the potential burden of circular agriculture on the environment through “ring reduction” measures, excluding mushroom planting and organic fertilizer production from the circular agriculture model and improving the utilization of the industry chain could be considered.
Finally, if considering the economic benefits generated per unit of environmental impact based on Figure 2, then, in addition to the main production mode of pig farming, dragon fruit planting has the highest economic benefit per unit of environmental impact, which is far higher than the corresponding index value of the pig farming industry that is closely related to the low environmental impact of the inputs and the high value of the dragon fruit product. This result indicates that to improve the economic benefits per unit of environmental emissions for the whole recycling mode, dragon fruit planting should be included in the circular agriculture model. The fishery industry also shows similar results. Moreover, in terms of the economic benefits per unit of environmental burden, the contribution of mushroom planting and organic fertilizer to the circular agriculture system still remains low, which indicates that from the perspective of the “reduction ring” to reduce the environmental impact and increase the benefits per unit of potential environmental indictor, these two industries should be removed from the circulation system.

4. Discussion

4.1. Sensitivity Analysis of the Overall Circular Agriculture System

The previous section analyzes the contribution of each sub-industry chain to the overall circular agriculture system from the perspective of “reducing the ring”. However, if the approach of “reducing the ring” is not feasible, then given the existence of a system that does not change the current cycle and from the perspective of material and energy inputs, alternative materials with relatively low potential for environmental emissions that would reduce the environment burden caused by circular agriculture should be identified. To achieve this goal of clarifying which materials and energy have the greatest environmental impact on circular agriculture, sensitivity analyses can assist in determining these impacts [36]. Based on this consideration, this paper carried out a sensitivity analysis of the whole circular agriculture industry. Due to the materials and energy generated within the sub-industry chains of the overall circular agriculture system, one sub-industry chain is mainly used as the input of the next sub-industry chain throughout the entire circular agriculture system. Therefore, the changes in the amount of materials and energy will not affect the potential impact on the environment for the entire system of circular agriculture. Thus, we only need to consider the input materials and energy outside the circular agriculture system in the sensitivity analysis. The scenario was established that when compared to the baseline operating conditions, each of these operating parameters increased by 10% while the other elements were kept constant. Based on this scenario, we explored the impact of the 11 categories of environmental indicators on the overall circular agriculture system resulting from this parameter change. The results of the sensitivity analysis are shown in Table 5, Table 6 and Table 7.
As shown in Table 5, Table 6 and Table 7, in general, the effect of the premix on the pig farming sub-industry chain of the circular agriculture model is the most significant. As seen from Table 5, when the amount of premix increases by 10%, the 11 environmental indicators—ADP elements, ADP fossil, AP, GWP, POCP, ODP, EP, FAETP, HTP, MAETP, and TETP—in the overall circular agriculture system changed by 6.59%, 2.47%, 7.18%, 3.33%, 6.32%, 7.09%, 8.38%, 4.45%, 2.00%, 2.68%, and 7.32%, respectively. Among these indicators, the impacts from the changes in the premix on the ADP elements, AP, POCP, ODP, EP, and TETP are the most significant, and the corresponding degree of changes in the indicators ranks first for the 19 different parameters. Meanwhile, the changes in the ADP fossil, FAETP, HTP and MAETP rank second in the same index. Thus, premix is the key to reducing the potential environmental impact of the circular agriculture system without changing the recycling structure. Therefore, it is necessary to further analyze the impact of the composition of the premix on the reduction in emissions of the circular agriculture system to reduce the potential environmental emissions from the circular agriculture system without “reducing the ring”.
In addition to the premix, the changes in the complete feed and electricity (from hard coal) in the pig farming industry, polyvinyl chloride in organic fertilizer production, and limestone in mushroom planting can also have significant impacts on some of the potential environmental indicators for the whole circular agriculture system. Among these potential impacts, the impact of changes in complete feed on the TETP is second only to that of the premix, and the influence of the electricity parameter (from hard coal) on the indicators of ADP fossil, GWP, MAETP and HTP was greater than the premix, ranking first. The impact of limestone, an input in mushroom planting, on ODP was second only to the premix. At the same time, Table 5, Table 6 and Table 7 show that except for polyvinyl chloride, which has no effect on the indicator ODP, well water has the lowest impact on the other 11 environmental indicators.
In summary, according to the different environmental protection objectives and depending on the sensitivity of the different inputs to the environmental indicators of the circular agriculture system, reducing the potential impact of the overall circular agriculture system on the environment without changing the overall recycling system of the circular agriculture system is possible. For example, if we consider reducing the greenhouse effect of circular agriculture, we can rank the sensitivity of different raw materials against the GWP indicator from high to low and select the materials with higher sensitivities to a targeted treatment. In this paper, the top three materials with the highest sensitivities to the GWP indicator are electricity (from hard coal), premix in the pig farming industry and limestone in the mushroom planting. Thus, to reduce the greenhouse effect caused by circular agriculture, we can change the structure of power consumption, adjust the proportions of the premix ingredients, and select alternative materials that result in less greenhouse gas emissions.

4.2. Sensitivity Analysis of the Premix to Circular Agriculture

From the above analysis, the contribution of premix to the potential environmental impact of circular agriculture is obvious. Therefore, it is necessary to further explore the potential environmental impact of the various components of the premix on circular agriculture to reduce the potential impact of circular agriculture on the environment by changing the composition of the premix. Based on this consideration, the following section considers the sensitivity analysis of the 11 main components of the premix on circular agriculture, and the specific results are shown in Table 8.
From Table 8, we can see that except for the effect of rapeseed meal on the index of TETP as second only to the impact of corn at the farm, the three most significant components of the premix on the remaining 10 environmental indicators are whey protein concentrate, corn at the farm and soybean meal, and the difference is only the order of strength among the different indicators. For example, the first three parameters influencing the ADP elements are corn at the farm, soybean meal, and whey protein concentrate. The three most significant parameters on ADP fossil are whey protein concentrate, corn at the farm, and soybean meal. The first three parameters that have a significant influence on POCP are whey protein concentrate, soybean meal, and corn at the farm. Thus, if we consider reducing the potential environmental impact of the circular agriculture system in terms of changing the composition of the premix, we need to focus mainly on corn at the farm, soybean meal, and whey protein concentrate. These three types of ingredients in the premix are the most sensitive to changes in the value of the environmental indicators. Thus, without affecting the quantity of the output, looking for alternative ingredients or changing the proportion of the above three premix ingredients, we can minimize the potential impact of the circular agriculture system on the environment without “reducing the ring”.

5. Conclusions

As an important part of green sustainable development, the development of circular agriculture is critically important to China, which has 1.38 billion people. However, whether circular agriculture is green and results in zero-emissions deserves consideration. Thus, this paper considers the circular agriculture industry company of Xingyuan in Fuqing City, Fujian Province as an example and from environmental and environmental-economic perspectives evaluates the potential impact of the pig farming industry-dragon fruit planting-forage planting-fishery industry-mushroom planting-biogas generation-organic fertilizer production circular agriculture model compared to the main industrial model of pig farming. Moreover, this paper determined the key elements that restrict the development of the circular agriculture model through a sensitivity analysis. The main conclusions are as follows:
(1)
Opposite to conventional understanding, as a multi-coupled system, a circular agriculture system does not result in zero emissions. In addition, if simply considering the potential environmental impact, circular agriculture that links different sub-industrial chains does not have less environmental effects than those of the main industrial model. The circular agriculture mode could reduce the environmental emissions by reducing the input of raw materials with improved recycling rates to offset or even exceed the increased environmental emissions caused by the increased input of raw materials. However, based on the results of this study, we determined that the development of circular agriculture does not mean that the recycling industry chain can be extended without considering other factors. By reasonably building an optimal recycling model, the potential environmental impacts of the circular agriculture system can be minimized.
(2)
If the economic benefits are included in this study, then the results show that it is not easy to compare circular agriculture and the main industrial model, the pig farming industry, to determine which one is better. In addition, depending on the indicators, the evaluation results may be different. Specifically, the BAP, BGWP, BPOCP, BODP, BEP, and BTETP indicators of the circular agriculture system are higher than those of the pig farming industry, while the BFAETP, BHTP and BMAETP indicators are lower than those of the pig farming industry.
(3)
If we consider reducing the potential environmental impacts while improving the economic benefits per unit of environmental emissions of the circular agriculture system, then we can consider removing mushroom planting and organic fertilizer production from the recycling framework and rely on measures such as increasing recycling efficiency to minimize the potential environmental impact over the life cycle of the system.
(4)
From the perspectives of the material and energy input and depending on the sensitivity of different materials to the environmental indicators of circular agriculture, it is possible to reduce the potential impact of the environment without changing the circular agriculture system. At the same time, the effect of the premix in the sub-industry chain of the pig farming industry on the potential environmental impact of circular agriculture is obvious, especially for corn at the farm, soybean meal and whey protein concentrate. Thus, we should focus on the above three components of the premix to reduce the potential environmental impact of circular agriculture.
This article is an analysis of the existing mode of the circular agriculture industry company of Xingyuan, Fuqing, that is, to analyze what conditions they are now, what the existing problems are, and how to improve them from the perspective of sensitivity analysis. In the future, we will consider more comprehensive cases and include as many facilities as possible in a farming area for taking advantage of the produced waste for the sake of financial savings.
Overall, a circular agriculture system does not result in zero emissions, and this circular agriculture mode is better than the traditional mode from environmental-economic perspectives. However, as Fan et al. [37] said, whether from the perspective of environmental emissions, the environmental burden, or the economic-environmental benefits viewpoint, a longer industry chain of circular agriculture is not better. In future, in order to build a reasonable circular agricultural industry mode, on the one hand, it is necessary to use sensitivity analysis to identify the key factors that limit the development of circular agriculture. On the other hand, we should calculate different cycle industrial chain combinations of environmental burdens scientifically rather than relying solely on traditional concepts to determine extending the industry chain of circular agriculture as long as possible. Only in this way can we build the most economical circular agriculture mode with the lowest environmental burdens.

Author Contributions

Data curation, W.F., Z.X., H.W., N.L. and X.W.; Formal analysis, W.F., P.Z. and H.W.; Funding acquisition, X.D.; Investigation, B.W., Z.C. and F.W.; Methodology, W.F. and X.D.; Project administration, X.D.; Resources, B.W., Z.C. and F.W.; Software, W.F.; Supervision, X.D.; Validation, X.D.; Visualization, W.F.; Writing—original draft, W.F.; Writing—review & editing, X.D.

Funding

This research was funded by the National Natural Science Foundation of China (41671531, 41271549), International S&T Cooperation Program of China (YS2017YFGH000562), the Key Project of the National Societal Science Foundation of China (15ZDB163), Science &Technology Supporting Program of China (2012BAD14B03), and the EU project “Sustainable Process Integration Laboratory—SPIL” (No. CZ.02.1.01/0.0/0.0/15_003/0000456) funded by EU “CZ Operational Programme Research, Development and Education”.

Conflicts of Interest

The authors declare no conflict of interest.

Appendix A. Input-Output Data of the Subsystems of the Circular Agriculture for 100-kg Live Pigs

Table A1. Input–output data for pig farming industry and biogas generation.
InputsOutputsInputsOutputs
Pig Farming IndustryBiogas Generation
PremixCorn at farm (12% H2O content) 111.98 kgComplete feedCorn grains, at farm (12% H2O content) 25.50 kg Pig manure 353.18 kg For pig farming 4.01 kW·h
Soybean meal (wet mill) 33.29 kgSoybean meal (wet mill) 8.86 kgLive pigs 100 kg For pitaya 0.02 kW·h
Wheat bran (wheat mill) 19.30 kgRapeseed meal (wet mill) 0.97 kg Electricity 7.93 kW·hFor fishery 0.21 kW·h
Fish meal 1.00 kgWheat bran (wheat mill) 2.24 kgPig manure 353.18 kgPig urine 639.09 kg For edible fungus 0.02 kW·h
Soybean hulls (wet mill) 2.20 kgMonocalcium phosphate 0.08 kg For organic fertilizer 1.69 kW·h
Whey protein concentrate (powder) 2.61 kgLimestone flour (CaCO3; dried) 0.10 kgPig urine 639.09 kg For fishery 1354.13 kg
Cottonseed meal 1.79 kgSodium chloride (rock salt) 0.05 kg Used flushing water 2087.22 kgBiogas slurry 2771.54 kgFor grass 202.49 kg
Rapeseed meal (wet mill) 1.93 kgWater
3136.08 kg
Tap water 33.44%Used flushing water 2087.22 kg For pitaya 607.46 kg
Tricalcium phosphate 2.21 kgWater from fish pond 66.56% Pig residue 23.10 kgFor edible fungus 6.33 kg
Limestone flour (CaCO3; dried) 1.90 kgElectricity 164.74 kW·hFrom hard coal 160.73 kW·h From biogas power 4.01 kW·h Electricity from hard coal 0.55 kW·hFor organic fertilizer 10.44 kg
Heat 38.62 MJBiogas residue 64.67 kg
Sodium chloride (rock salt) 0.61 kgGrassFrom Grass planting 12.66 kg
Table A2. Input-output data for mushroom planting, organic fertilizer, dragon fruit planting, fishery industry and forage planting.
InputsOutputsInputsOutputsInputsOutputsInputsOutputs
Mushroom PlantingOrganic FertilizerDragon Fruit PlantingFishery Industry
Electricity 0.0228 kW·h Electricity 1.6874 kW·h Organic fertilizer 5.0622 kg Biogas slurry 1354.1335 kg
Limestone 2088.1410 kg Pig residue 10.4407 kg Npk(15N-15P2O5-15K2O) 0.2531 kg tap water 1,533,274,170 kgFish 1.6874 kg
Pig residue 6.3277 kgMushrooms 6.3277 kgMushroom dreg 21.0923 kg Triple Superphosphate 0.0020 kg Electricity 0.2109 kW·hWater 151,865,439 kg
Soil 18.9831 kgMushroom dreg 21.0923 kgBiogas residue 64.6694 kgOrganic fertilizer 92.8062 kgPesticide (average) 0.0033 kgDragon fruits 35.4354 kgForage planting
Straw 1.2655 kgSoil 9.8431 kgHousehold refuse 0.8437 kg Electricity 0.0168 kW·h Biogas slurry 202.4873kg
Wasted Wood 0.0562 kg Polyvinyl chloride 92.8062 kg Diesel mix at refinery 0.0202 L Tap water 3837.1343 kgGrass 12.6555 kg
Well water 1.0124 kg Diesel
0.0190 kg
Biogas slurry 607.464 kg Seedlings 0.0844 kg
Soil
9.8431 kg

References

  1. Shelef, O.; Weisberg, P.J.; Provenza, F.D. The value of native plants and local production in an era of global agriculture. Front. Plant Sci. 2017, 8, 2069. [Google Scholar] [CrossRef] [PubMed]
  2. Yang, S.Q.; Mei, X.R. A sustainable agricultural development assessment method and a case study in China based on euclidean distance theory. J. Clean. Prod. 2017, 168, 551–557. [Google Scholar] [CrossRef]
  3. Lwin, C.M.; Murakami, M.; Hashimoto, S. The implications of allocation scenarios for global phosphorus flow from agriculture and wastewater. Resour. Conserv. Recycl. 2017, 122, 94–105. [Google Scholar] [CrossRef]
  4. Wu, H.J.; Gao, L.M.; Yuan, Z.W.; Wang, S. Life cycle assessment of phosphorus use efficiency in crop production system of three crops in Chaohu Watershed, China. J. Clean. Prod. 2016, 139, 1298–1307. [Google Scholar] [CrossRef]
  5. Wang, H.G.; Zhai, H.Y. Research review and outlook of agricultural circular economy. J. Huazhong Agric. Univ. 2016, 4, 59–66. [Google Scholar]
  6. Sun, Y.M.; Li, G.X.; Zhang, F.D.; Shi, C.L.; Sun, Z.J. Status quo and developmental strategy of agricultural residues resources in China. Trans. Chin. Soc. Agric. Eng. 2005, 21, 169–173. [Google Scholar]
  7. National Development and Reform Commission, Ministry of Agriculture. National Rural Biogas Development 13th Five-Year Plan. Available online: http://www.gov.cn/xinwen/2017-02/10/content_5167076.htm/ (accessed on 28 May 2018).
  8. Guan, D.X.; Qiu, C. Preliminary research of the situation and countermeasures of pollution of rural domestic garbage. China Resour. Compr. Util. 2008, 26, 29–31. [Google Scholar]
  9. Zhao, L.X.; Meng, H.B.; Shen, Y.J.; Ding, J.T.; Zhang, X. Investigation and development analysis of planting-breeding circulating agriculture ecosystem system in northern plains in China. Trans. Chin. Soc. Agric. Eng. 2017, 33, 1–10. [Google Scholar]
  10. Alberti, J.; Balaguera, A.; Brodhag, C.; Fullana-i-Palmer, P. Towards life cycle sustainability assessent of cities. A review of background knowledge. Sci. Total Environ. 2017, 609, 1049–1063. [Google Scholar] [CrossRef] [PubMed]
  11. Kilkis, S.; Kilkis, B. Integrated circular economy and education model to address aspects of an energy-water-food nexus in a dairy facility and local contexts. J. Clean. Prod. 2017, 167, 1084–1098. [Google Scholar] [CrossRef]
  12. Therond, O.; Duru, M.; Roger-Estrade, J.; Richard, G. A new analytical framework of farming system and agriculture model diversities. A review. Agron. Sustain. Dev. 2017, 37, 21. [Google Scholar] [CrossRef]
  13. Wang, L.G.; Qu, F.; Yin, X.Z.; Qiu, Y.H.; Huang, D.Q.; Tao, M.S. Economic analysis and standardization of Pig-Biogas-Fruit eco-agriculture model in South China. China J. Eco-Agric. 2008, 16, 1283–1286. [Google Scholar] [CrossRef]
  14. Liu, Z.; Liu, L.; Zhang, S.M.; Sun, T.; Ning, T.Y.; Li, C.R.; Li, Z.J. Comparison of emergy efficiency and sustainable development capability between different agricultural circulation modes with straw utilization. Acta Ecol. Sin. 2016, 36, 4739–4750. [Google Scholar]
  15. Wei, X.M.; Chen, B.; Qu, Y.H.; Lin, C.; Chen, G.Q. Emergy analysis for ‘Four in One’ peach production system in Beijing. Commun. Nonlinear Sci. Numer. Simul. 2009, 14, 946–958. [Google Scholar] [CrossRef]
  16. Liu, H.Z.; Chen, H.X.; Zhang, Y.F.; Kang, Z.H. Evaluation of the circular clean production model of a wheat-rice double cropping system in south Jiangsu. Jiangsu J. Agric. Sci. 2010, 26, 1395–1401. [Google Scholar]
  17. Li, Y.C.; Huang, X.S.; Pan, Y.; Ying, Z.Y.; Huang, Y.B. Emergy analysis of circular agriculture mode of Dairy cattle-Biogas-Forage. J. Ecol. Rural Environ. 2010, 26, 120–125. [Google Scholar]
  18. Wielemaker, R.C.; Weijma, J.; Zeeman, G. Harvest to harvest: Recovering nutrients with new sanitation systems for reuse in urban agriculture. Resour. Conserv. Recycl. 2018, 128, 426–437. [Google Scholar] [CrossRef]
  19. Vega-Quezada, C.; Blanco, M.; Romero, H. Synergies between agriculture and bioenergy in Latin American countries: A circular economy strategy for bioenergy production in Ecuador. New Biotechnol. 2017, 39, 81–89. [Google Scholar] [CrossRef] [PubMed]
  20. Sun, X.X.; Li, J.; Li, L. Estimating circular agricultural efficiency using DEA methods. Agro Food Ind. Hi Tech 2016, 27, 94–98. [Google Scholar]
  21. Pagotto, M.; Halog, A. Towards a circular economy in Australian agri-food industry: An application of input-output oriented approaches for analyzing resource efficiency and competitiveness potential. J. Ind. Ecol. 2016, 20, 1176–1186. [Google Scholar] [CrossRef]
  22. Kuisma, M.; Kahiluoto, H. Biotic resource loss beyond food waste: Agriculture leaks worst. Resour. Conserv. Recycl. 2017, 124, 129–140. [Google Scholar] [CrossRef]
  23. Sun, L.; Tian, G.C.; Wu, F.Q. Emergy evaluation of a Pig-Methane-Grain circular agricultural mode in Guanzhong Plain. Agric. Res. Arid Areas 2015, 33, 246–252. [Google Scholar]
  24. Han, Y.; Long, P.; Chen, Y.Q.; Sui, P.; Gu, S.G. Research progress of evaluation system for China circular agriculture development. China J. Eco-Agric. 2013, 21, 1039–1048. [Google Scholar] [CrossRef]
  25. Millward-Hopkins, J.; Busch, J.; Purnell, P.; Zwirner, O.; Velis, C.A.; Brown, A.; Hahladakis, J.; Iacovidou, E. Fully integrated modelling for sustainability assessment of resource recovery from waste. Sci. Total Environ. 2018, 612, 613–624. [Google Scholar] [CrossRef] [PubMed]
  26. Ding, N.; Liu, J.R.; Yang, J.X.; Yang, D. Comparative life cycle assessment of regional electricity supplies in China. Resour. Conserv. Recycl. 2017, 119, 47–59. [Google Scholar] [CrossRef]
  27. Levasseur, A.; Bahn, O.; Beloin-Saint-Pierre, D.; Marinova, M.; Vaillancourt, K. Assessing butanol from integrated forest biorefinery: A combined techno-economic and life cycle approach. Appl. Energy 2017, 198, 440–452. [Google Scholar] [CrossRef]
  28. Khatri, P.; Jain, S.; Pandey, S. A cradle-to-gate assessment of environmental impacts for production of mustard oil using life cycle assessment approach. J. Clean. Prod. 2017, 166, 988–997. [Google Scholar] [CrossRef]
  29. Gilpin, G.S.; Andrae, A.S.G. Comparative attributional life cycle assessment of European cellulase enzyme production for use in second-generation lignocellulosic bioethanol production. Int. J. Life Cycle Assess. 2017, 22, 1034–1053. [Google Scholar] [CrossRef]
  30. Kim, K.J.; Yun, W.G.; Cho, N.; Ha, J. Life cycle assessment based environmental impact estimation model for pre-stressed concrete beam bridge in the early design phase. Environ. Impact Assess. Rev. 2017, 64, 47–56. [Google Scholar] [CrossRef]
  31. Xiao, R.F.; Zhang, Y.; Yuan, Z.W. Environmental impacts of reclamation and recycling processes of refrigerators using life cycle assessment (LCA) methods. J. Clean. Prod. 2016, 131, 52–59. [Google Scholar] [CrossRef]
  32. Brito, M.; Martins, F. Life cycle assessment of butanol production. Fuel 2017, 208, 476–482. [Google Scholar] [CrossRef]
  33. Sengupta, D.; Hawkins, T.R.; Smith, R.L. Using national inventories for estimating environmental impacts of products from industrial sectors: A case study of ethanol and gasoline. Int. J. Life Cycle Assess. 2015, 20, 597–607. [Google Scholar] [CrossRef]
  34. Martinez, E.; Blanco, J.; Jimenez, E.; Saenz-Diez, J.C.; Sanz, F. Comparative evaluation of life cycle impact assessment software tools through a wind turbine case study. Renew. Energy 2015, 74, 237–246. [Google Scholar] [CrossRef]
  35. Petrescu, L.; Bonalumi, D.; Valenti, G.; Cormos, A.M.; Cormos, C.C. Life cycle assessment for supercritical pulverized coal power plants with post-combustion carbon capture and storage. J. Clean. Prod. 2017, 157, 10–21. [Google Scholar] [CrossRef]
  36. Zhou, Z.Z.; Tang, Y.J.; Chi, Y.; Ni, M.J.; Buekens, A. Waste-to-energy: A review of life cycle assessment and its extension methods. Waste Manag. Res. 2018, 36, 3–16. [Google Scholar] [CrossRef] [PubMed]
  37. Fan, W.G.; Dong, X.B.; Wei, H.J.; Weng, B.Q.; Liang, L.; Xu, Z.H.; Wang, X.C.; Wu, F.L.; Chen, Z.D.; Jin, Y.; et al. Is it true that the longer the extended industrial chain, the better the circular agriculture? A case study of circular agriculture industry company in Fuqing, Fujian. J. Clean. Prod. 2018, 189, 718–728. [Google Scholar] [CrossRef]
Figure 1. Boundaries of the circular agriculture system.
Sustainability 10 01810 g001
Figure 2. Environmental impacts and economic benefits of sub-industry chain.
Sustainability 10 01810 g002
Table 1. System utilization in the circular agriculture model.
OutputUnitsQuantityRecycle QuantityRate of Circuit
Recycled waterkg151,865,439.25 2087.22 0.0014%
Organic fertilizerkg92.815.06 5.45%
Pig residuekg23.1016.7772.60%
Biogas slurrykg2771.54 2164.08 78.08%
ElectricitykW·h7.935.94 74.98%
Table 2. LCA results of the pig farming industry and the circular agriculture model.
CategoryS1S2Units
ADP elements4.45 × 1045.26 × 104kg Sb-Equiv.
ADP fossil2.73 × 1033.66 × 103MJ
AP1.47 × 1001.62 × 100kg SO2-Equiv.
GWP3.06 × 1023.76 × 102kg CO2-Equiv.
POCP8.20 × 1029.93 × 102kg Ethene-Equiv.
ODP7.97 × 1099.92 × 109kg R11-Equiv.
EP8.58 × 1018.85 × 101kg P-Equiv.
FAETP6.88 × 1001.31 × 101kg DCB-Equiv.
HTP1.66 × 1015.18 × 101kg DCB-Equiv.
MAETP1.61 × 1042.11 × 104kg DCB-Equiv.
TETP2.61 × 1002.78 × 100kg DCB-Equiv.
Table 3. Economic-environmental benefits of the pig farming industry and circular agriculture industry.
CategoryS1S2Units
BAP1.75 × 1031.99 × 103yuan/kg SO2-Equiv.
BGWP8.36 × 1008.58 × 100yuan/kg CO2-Equiv.
BPOCP3.12 × 1043.24 × 104yuan/kg Ethene-Equiv.
BODP3.21 × 10113.25 × 1011yuan/kg R11-Equiv.
BEP2.98 × 1033.64 × 103yuan/kg P-Equiv.
BFAETP3.72 × 1022.45 × 102yuan/kg DCB-Equiv.
BHTP1.54 × 1026.22 × 101yuan/kg DCB-Equiv.
BMAETP1.59 × 10−11.53 × 10⁻¹yuan/kg DCB-Equiv.
BTETP9.81 × 1021.16 × 103yuan/kg DCB-Equiv.
Table 4. The environmental load of each industrial chain as a part of the circular agriculture model.
CategoryPig Farming IndustryDragon Fruit PlantingForage PlantingFishery IndustryMushroom PlantingBiogas GenerationOrganic Fertilizer
AP89.82%0.03%0.11%0.60%6.28%−1.51%4.67%
GWP80.21%0.06%0.21%1.16%14.18%−0.21%4.51%
POCP81.66%0.04%0.17%0.94%11.99%−0.86%6.06%
ODP79.69%0.22%0.26%1.43%18.60%−0.20%0.00%
EP96.79%0.02%0.09%0.50%2.52%−0.61%0.70%
FAETP52.32%0.00%0.05%0.25%0.80%−0.18%46.75%
HTP31.63%0.01%0.15%0.81%2.74%−0.23%64.89%
MAETP74.00%0.03%0.83%4.58%16.30%−1.03%5.28%
TETP93.45%0.01%0.10%0.57%4.01%0.03%1.82%
Table 5. Parameter sensitivity analysis of circular agriculture (pig farming industry and organic fertilizer).
CategoriesPig Farming IndustryOrganic Fertilizer
ParameterPremixComplete FeedTap WaterElectricity (from Hard Coal)Transport DistancePolyvinyl ChlorideDiesel
Variation10%10%10%10%10%10%10%
ADP elements6.59 × 1021.38 × 1021.39 × 1051.83 × 1044.67 × 1051.75 × 1024.69 × 108
ADP fossil2.47 × 1023.30 × 1036.79 × 1054.48 × 1022.47 × 1037.89 × 1031.39 × 106
AP7.18 × 1024.68 × 1032.90 × 1051.33 × 1022.22 × 1034.67 × 1031.85 × 107
GWP3.33 × 1023.22 × 1035.57 × 1054.35 × 1021.69 × 1034.51 × 1031.45 × 107
POCP6.32 × 1022.07 × 1054.50 × 1051.84 × 1021.49 × 1026.06 × 1034.91 × 107
ODP7.09 × 1027.82 × 1036.88 × 1058.85 × 1045.05 × 1060.00 × 1001.72 × 107
EP8.38 × 1029.29 × 1032.39 × 1053.65 × 1039.57 × 1046.99 × 1045.70 × 108
FAETP4.45 × 1027.10 × 1031.23 × 1056.97 × 1044.83 × 1044.67 × 1021.66 × 107
HTP2.00 × 1023.27 × 1033.90 × 1058.34 × 1035.74 × 1046.49 × 1021.68 × 107
MAETP2.68 × 1023.49 × 1032.21 × 1044.35 × 1027.04 × 1045.28 × 1032.27 × 107
TETP7.32 × 1021.70 × 1022.75 × 1053.23 × 1038.55 × 1051.82 × 1033.02 × 107
Table 6. Parameter sensitivity analysis of circular agriculture (dragon fruit planting, fishery industry, and biogas generation).
CategoriesDragon Fruit PlantingFishery IndustryBiogas Generation
ParameterNpkTriple SuperphosphatePesticideDieselTap WaterElectricity (from Hard Coal)
Variation10%10%10%10%10%10%
ADP elements2.05 × 1048.20 × 1078.21 × 1057.91 × 1072.89 × 1044.95 × 107
ADP fossil6.64 × 1057.88 × 1071.51 × 1052.35 × 1051.41 × 1031.21 × 104
AP2.42 × 1056.08 × 1074.48 × 1063.12 × 1066.02 × 1043.61 × 105
GWP4.79 × 1054.24 × 1077.85 × 1062.45 × 1061.16 × 1031.18 × 104
POCP2.72 × 1056.47 × 1078.32 × 1068.27 × 1069.35 × 1044.98 × 105
ODP2.10 × 1042.01 × 1066.16 × 1062.89 × 1069.35 × 1042.40 × 106
EP1.40 × 1056.11 × 1088.87 × 1079.60 × 1074.96 × 1049.89 × 106
FAETP8.58 × 1078.74 × 1087.04 × 1072.79 × 1062.55 × 1041.89 × 106
HTP4.88 × 1068.28 × 1071.83 × 1062.83 × 1068.10 × 1042.26 × 105
MAETP1.65 × 1053.38 × 1076.15 × 1063.82 × 1064.58 × 1031.18 × 104
TETP1.84 × 1067.42 × 1084.25 × 1065.09 × 1065.71 × 1048.75 × 106
Table 7. Parameter sensitivity analysis of circular agriculture (mushroom planting and forage planting).
CategoriesMushroom PlantingForage Planting
ParameterLimestoneSoilStrawWasted WoodWell WaterTap Water
Variation10%10%10%10%10%10%
ADP elements2.88 × 1031.28 × 1076.42 × 1061.47 × 1061.39 × 1085.26 × 105
ADP fossil1.74 × 1023.80 × 1061.47 × 1057.12 × 1066.77 × 1082.57 × 104
AP6.24 × 1036.28 × 1063.24 × 1056.01 × 1062.89 × 1081.10 × 104
GWP1.41 × 1022.77 × 1063.87 × 1055.43 × 1065.56 × 1082.11 × 104
POCP1.19 × 1022.20 × 1053.69 × 1051.25 × 1054.49 × 1081.70 × 104
ODP1.85 × 1024.68 × 1071.50 × 1056.61 × 1056.87 × 1082.60 × 104
EP2.47 × 1032.48 × 1064.99 × 1052.02 × 1062.38 × 1089.03 × 105
FAETP7.44 × 1044.65 × 1075.58 × 1057.04 × 1071.22 × 1084.64 × 105
HTP2.72 × 1038.67 × 1071.91 × 1052.23 × 1063.89 × 1081.47 × 104
MAETP1.63 × 1026.18 × 1072.66 × 1058.41 × 1062.20 × 1078.35 × 104
TETP4.00 × 1038.30 × 1073.75 × 1061.22 × 1062.74 × 1081.04 × 104
Table 8. Sensitivity analysis of the parameters related to the composition of the premix.
ParameterCorn at FarmSoybean MealWheat Bran Fish MealSoybean HullsWhey Protein ConcentrateCottonseed Meal Rapeseed MealTricalcium PhosphateLimestone FlourSodium Chloride
Variation10%10%10%10%10%10%10%10%10%10%10%
ADP elements2.8449%2.6042%0.0763%0.0001%0.0806%0.8141%0.0031%0.0154%0.0908%0.0003%0.0518%
ADP fossil0.7970%0.3095%0.1025%0.0189%0.0096%0.9150%0.0165%0.0131%0.0873%0.0016%0.0005%
AP1.1871%0.4754%0.1383%0.0299%0.0147%5.0398%0.0169%0.0253%0.0674%0.0006%0.0007%
GWP0.8133%0.3150%0.1175%0.0147%0.0098%1.8438%0.0155%0.0138%0.0470%0.0013%0.0004%
POCP0.4923%0.5603%0.0501%0.0269%0.0173%6.3864%0.0302%0.0120%0.0716%0.0011%0.0016%
ODP1.4621%0.5153%0.0944%0.0000%0.0160%4.7290%0.0285%0.0199%0.2230%0.0017%0.0015%
EP2.4734%1.1370%0.2688%0.0322%0.0352%4.2729%0.0476%0.0293%0.0068%0.0002%0.0003%
FAETP1.9152%0.8766%0.1350%0.0051%0.0271%1.3378%0.0756%0.0302%0.0097%0.0001%0.0001%
HTP0.9792%0.2733%0.0328%0.0177%0.0085%0.5099%0.0105%0.0267%0.0917%0.0002%0.0001%
MAETP0.9553%0.3691%0.0970%0.0401%0.0114%1.0758%0.0195%0.0149%0.0374%0.0015%0.0002%
TETP6.7847%0.0848%0.0135%0.0088%0.0026%0.1445%0.0003%0.2617%0.0082%0.0004%0.0001%

