Article

Analysis of Embodied Environmental Impacts of Korean Apartment Buildings Considering Major Building Materials

1
Sustainable Building Research Center, Hanyang University, 55 Hanyangdaehak-ro, Sangnok-gu, Ansan 15588, Korea
2
Department of Architecture & Architectural Engineering, Hanyang University, 55 Hanyangdaehak-ro, Sangnok-gu, Ansan 15588, Korea
3
Architectural Engineering, Hanyang University, 55 Hanyangdaehak-ro, Sangnok-gu, Ansan 15588, Korea
*
Authors to whom correspondence should be addressed.
Sustainability 2018, 10(6), 1693; https://doi.org/10.3390/su10061693
Submission received: 7 April 2018 / Revised: 10 May 2018 / Accepted: 12 May 2018 / Published: 23 May 2018
(This article belongs to the Special Issue Sustainable Built Environment and Urban Growth Management)

Abstract

:
Because the reduction in environmental impacts (EIs) of buildings using life-cycle assessment (LCA) has been emphasized as a practical strategy for the sustainable development of the construction industry, studies are required to analyze not only the operational environmental impacts (OEIs) of buildings, but also the embodied environmental impacts (EEIs) of building materials. This study aims to analyze the EEIs of Korean apartment buildings on the basis of major building materials as part of research with the goal of reducing the EIs of buildings. For this purpose, six types of building materials (ready-mixed concrete, reinforcement steel, concrete bricks, glass, insulation, and gypsum) for apartment buildings were selected as major building materials, and their inputs per unit area according to the structure types and plans of apartment buildings were derived by analyzing the design and bills of materials of 443 apartment buildings constructed in South Korea. In addition, a life-cycle scenario including the production, construction, maintenance, and end-of-life stage was constructed for each major building material. The EEIs of the apartment buildings were quantitatively assessed by applying the life-cycle inventory database (LCI DB) and the Korean life-cycle impact assessment (LCIA) method based on damage-oriented modeling (KOLID), and the results were analyzed.

1. Introduction

With the rising importance of sustainable development, efforts have been made in all industrial areas to reduce environmental impacts (EIs) [1,2,3,4,5]. In line with this, the construction industry has focused its research on cutting-edge technologies (e.g., highly efficient insulating materials, high-performance glass, high-air-tightness windows, and renewable energy systems) capable of dramatically reducing the energy consumption of a building during its operation stage in order to decrease operational environmental impacts (OEIs), which account for over 70% of the EIs of conventional buildings [6,7,8,9,10]. As a result, zero-energy buildings—energy-efficient buildings that use little energy during their operation stage—have been developed and successfully constructed in many countries [11,12,13,14,15].
As technologies to reduce the OEIs of buildings have been commercialized, research on the life-cycle assessment (LCA) of buildings—which considers the reduction in the OEIs of buildings as well as in the embodied environmental impacts (EEIs) caused by the production, construction, maintenance, and end-of-life stages of the building materials used—has been emphasized recently [16,17,18,19,20,21,22]. This is because additional building materials may be necessary for energy-efficient buildings compared with conventional buildings, thus increasing EEIs, but decreasing OEIs [17]. Results of previous LCAs of energy-efficient buildings showed that EEIs were higher than OEIs [23,24]. Hence, more research is necessary to assess and reduce the EEIs of buildings, as the importance and influence of EEIs have gradually increased [25,26].
Some of the previous studies on the analysis of EEIs are important in terms of their approach, methodology, and case studies [27,28,29,30,31,32,33]. Because they mostly analyzed only carbon emissions during the production stage of the building materials, their use has been limited. Therefore, for a study’s results to be used as basic data for reducing the EEIs of buildings, these impacts must be analyzed by considering the following:
  • The EEIs of a number of buildings must be analyzed according to the characteristics of those buildings. This is because the results of analyzing the EEIs for one or more buildings cannot be generalized as the EEI characteristics of all buildings.
  • The assessment target must be expanded from carbon emissions to other EI categories. To achieve sustainable development, it is necessary to address not only global warming due to carbon emissions but also various other global environmental problems [34].
  • The scope of assessment must be extended from the building material’s production stage to a life-cycle perspective. This is because the overall EEIs of buildings must be examined quantitatively to be reduced [35].
  • The EEI assessment results of buildings must be analyzed from a building-material perspective. In this way, EEIs can be reduced by identifying building materials that have the greatest influence on these EEIs.
  • EIs must be assessed not only for EI categories, but also for safety guards. This is because the end-point-level damage to humans and ecosystems by each EI must be identified.
Therefore, the aim of this study is to analyze the EEIs of Korean apartment buildings on the basis of major building materials as part of research with the goal of reducing the life-cycle environmental impacts (LCEIs) of buildings.

2. Background

2.1. Embodied Environmental Impact

The LCEIs of buildings can be divided into EEIs and OEIs [24,27]. The EEIs of buildings correspond to the LCEIs excluding the EIs caused by energy consumption (e.g., heating, cooling, hot water, lighting, and ventilation). In other words, EEIs include EIs that arise from the building-material production stage and the building construction, maintenance, and end-of-life stages. EEIs for a building are calculated using Equation (1):
EEI = EI PS + EI CS + EI MP + EI ES ,
where EEI denotes the life-cycle embodied environmental impact (LCEEI) of the building. EIPS, EICS, EIMP, and EIES are the EEIs of the building-material production stage, and the building construction, maintenance, and end-of-life stages.

2.2. Environmental Impact Categories

EI categories represent global environmental changes caused by human behavior or technology. Global warming potential (GWP), acidification potential (AP), eutrophication potential (EP), ozone layer depletion potential (ODP), photochemical ozone creation potential (POCP), and abiotic depletion potential (ADP) are representative EI categories, which can be assessed quantitatively through various life-cycle impact assessment (LCIA) methodologies [36,37].
GWP represents climate change, that is, the rise in average temperatures of the earth’s atmosphere, and causes environmental problems because of changing ecosystems in soil or water, or because of rising sea levels. AP represents the acidification of water and soil, mainly by the circulation of pollutants, threatening the survival of living organisms such as fish, plants, and animals. EP represents the harmful impacts on the marine environment, such as red tides resulting from the amount of nutrients abnormally increasing through the introduction of chemical fertilizers or sewage. ODP is a phenomenon in which the ozone in the ozone layer—located in the stratosphere 15–30 km above the ground—is destroyed and its density decreases. It can lead to diseases such as skin cancer because of the increase in ultraviolet radiation. POCP is a reaction between air pollutants and sunlight in which chemical compounds such as ozone (O3) are created, in turn causing damage to ecosystems and human health and inhibiting the growth of crops. ADP represents the cause behind the destruction of ecosystem balance and environmental pollution caused by the excessive collection and consumption of resources.

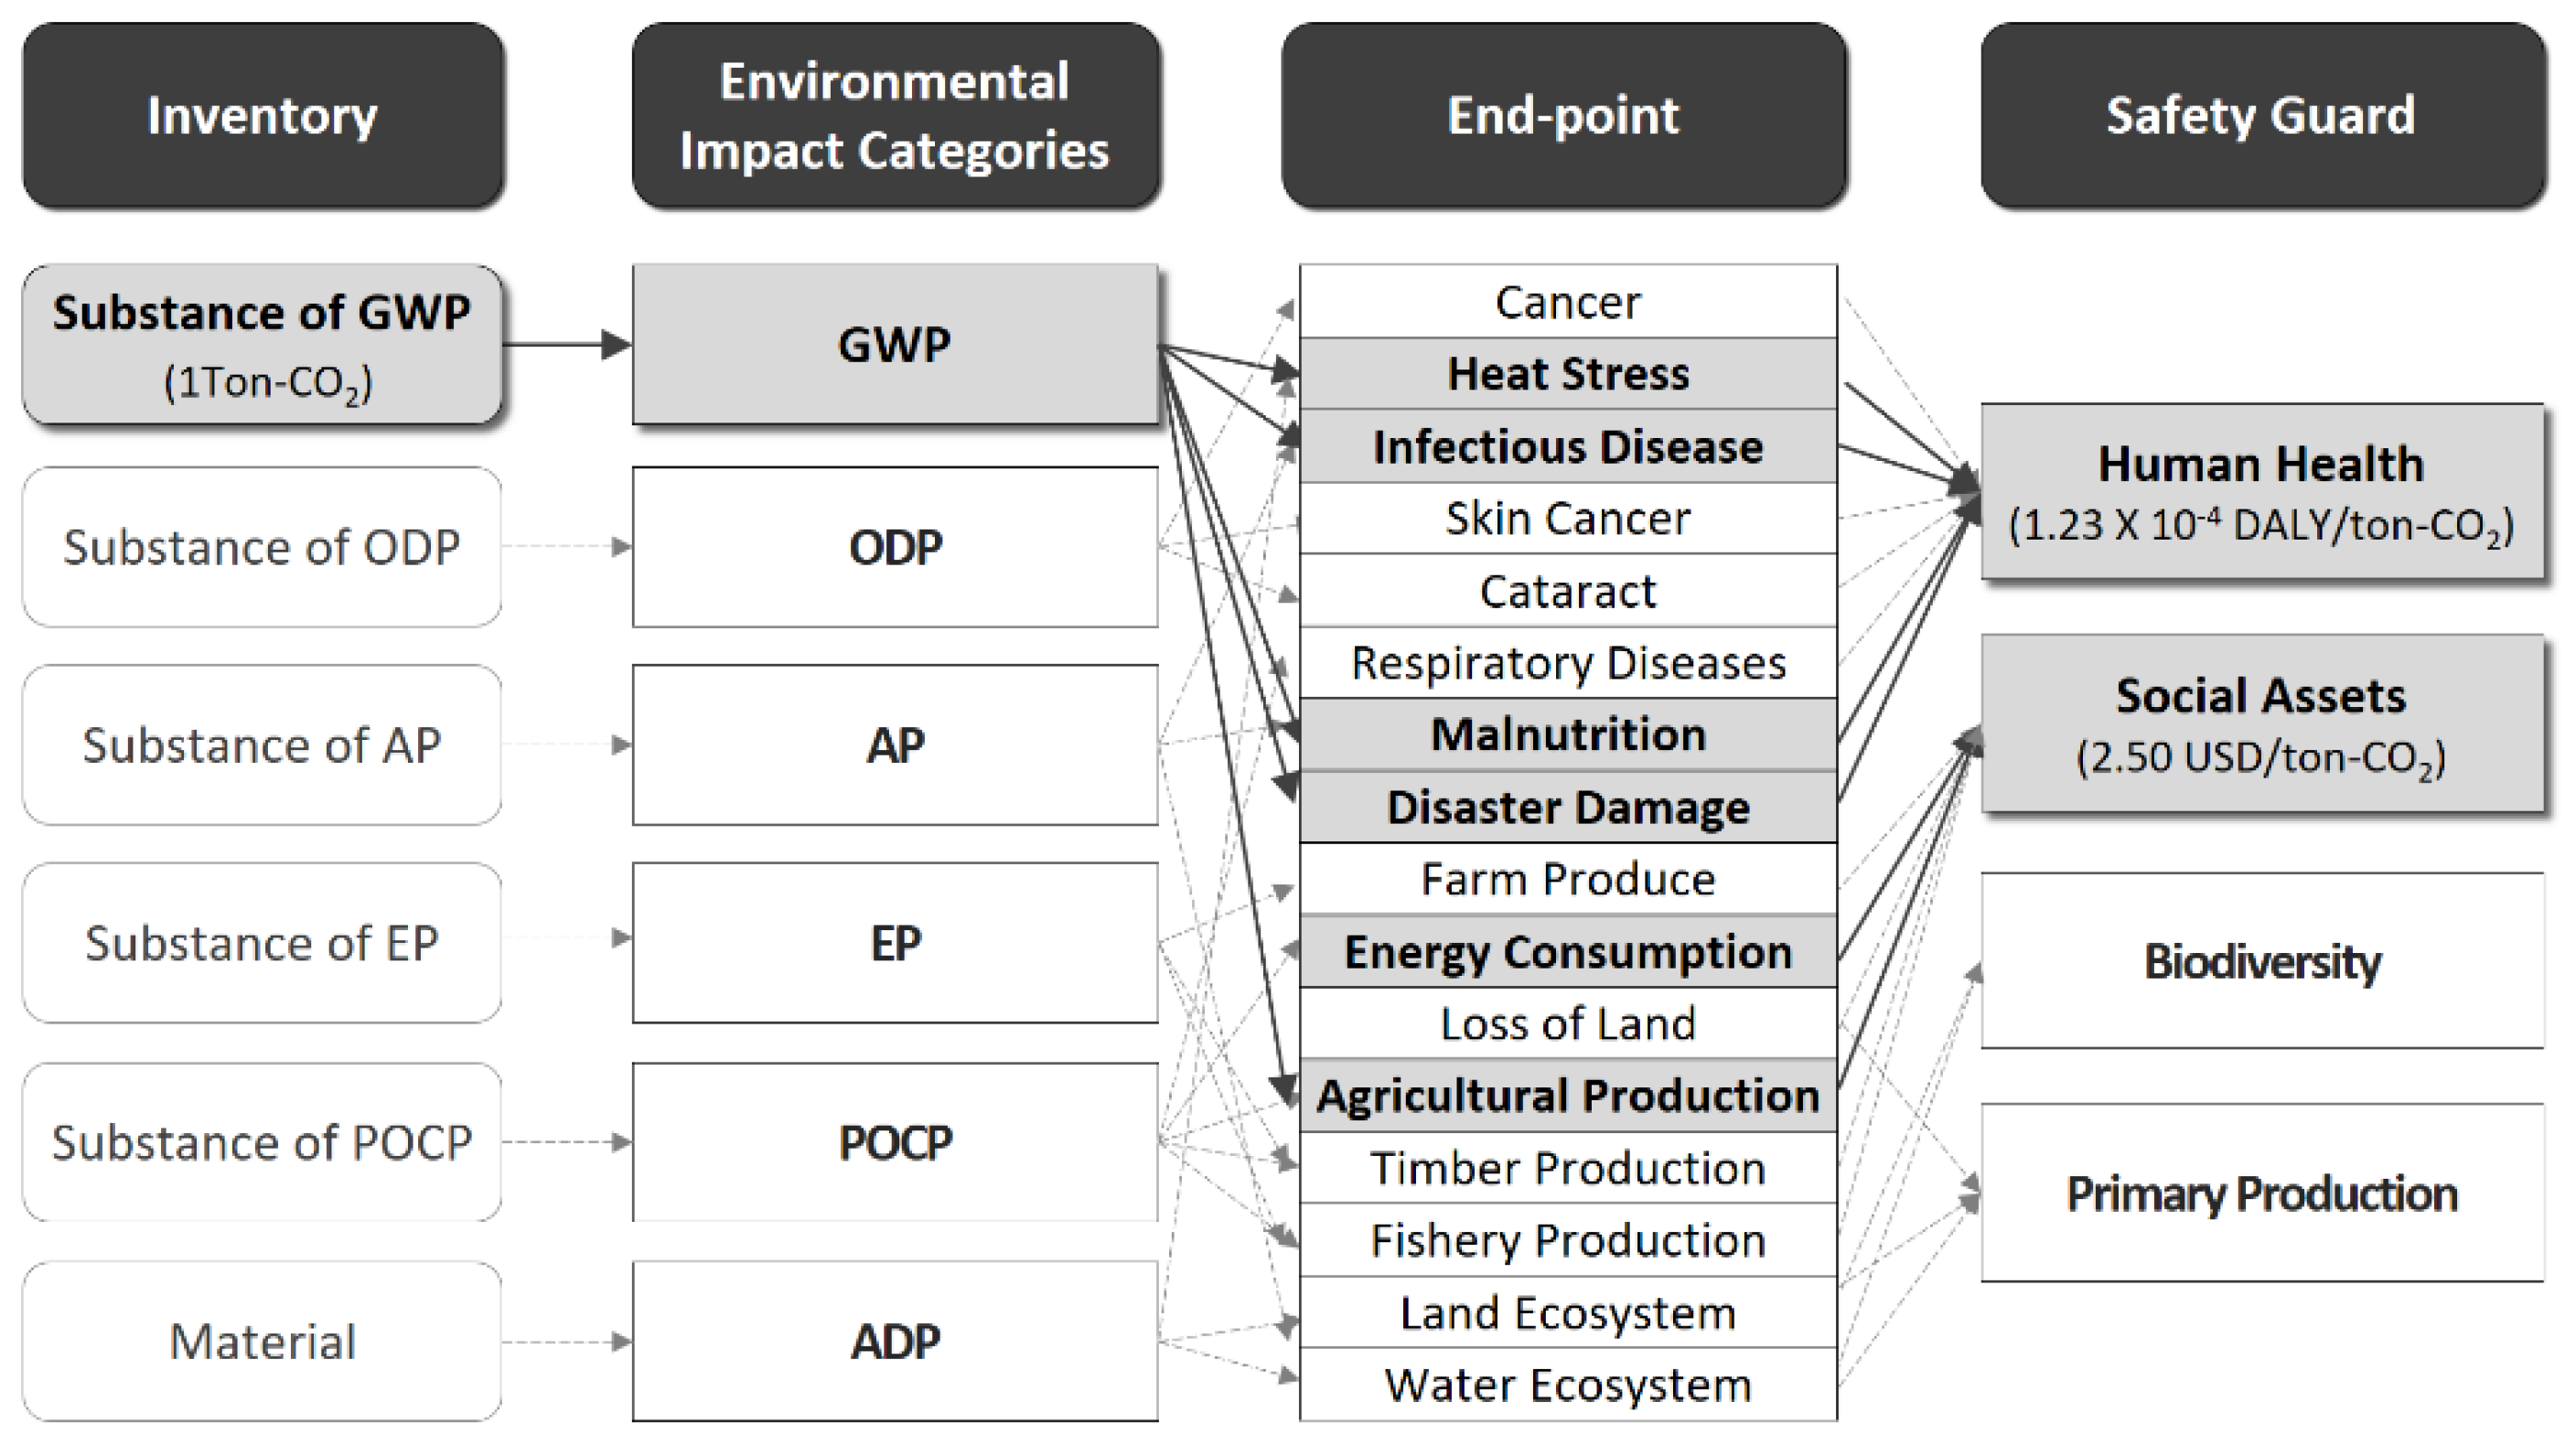
2.3. Safety Guard and Damage Index

From an environmental ethics perspective, the “safety guard” represents the environment that the human race must protect. It can be classified into human and ecosystem items. The human items are divided into human health, which is required for humans to live a healthy life, and social assets, which support human society. The ecosystem items can be subdivided into biodiversity, which refers to the preservation of animals and plants, and primary production, which is essential for maintaining biodiversity [38].
The damage index quantifies the damage to the aforementioned safety guard (human health, social assets, biodiversity, and primary production) caused by EIs. For assessing damages to human health, disability-adjusted life years (DALY) are used. DALY is a damage index representing the number of years of healthy life lost as a result of EIs. For social assets, the mean economic cost (USD) for the suppression and depletion of crops; fossil fuels; and fishery, forest, and mineral resources is used. In addition, biodiversity is assessed through the expected increase in the number of extinct species (EINES) damage index, that is, the expected number of extinct species of vascular and aquatic plants. For primary production, the net primary production (NPP) is used as a damage index, assessing the amount (kg/m2·y) of organic matter created by the photosynthesis of land plants and marine plankton. The damage index for each safety guard can be assessed through the end-point-level LCIA methodology, which systematizes damage indexes for each safety guard using research results from natural sciences. Figure 1 is an example of the LCIA method at the end-point level [39]. It shows the structures and degrees of the impacts of GWP caused by 1 ton of CO2 emission on human health and social assets as safety guards. According to Figure 1, GWP caused by 1 ton of CO2 emission adversely affects heat stress, exposure to infectious diseases, malnutrition, disaster damage, energy consumption, and agricultural production at the end-point level and ultimately causes a damage of 1.23 × 10⁻⁴ DALY and 2.5 USD to human health and social assets, respectively.

3. Materials and Methods

The section details the assessment of the EEIs of Korean apartment buildings on the basis of the major building materials using the sequential LCA methodology. For this purpose, in the goal and scope definition stage, the purpose of LCA and the scope of the system were defined. In the life-cycle inventory (LCI) analysis stage, the average inputs per unit area of major building materials were derived according to the structure types and plans of apartment buildings by analyzing the design and bills of materials of apartment buildings constructed in South Korea. In addition, a life-cycle scenario including the production, construction, maintenance, and end-of-life stage was constructed for each of the major building materials. In the LCIA stage, the EEIs of the six impact categories and damage indexes for each safety guard were quantitatively assessed by applying the life-cycle inventory database (LCI DB) and the Korean LCIA method based on damage-oriented modeling (KOLID) [38], an end-point-level LCEI assessment methodology.

3.1. Goal and Scope Definition

The purpose of performing LCA in this study was to analyze the EEIs of Korean apartment buildings on the basis of major building materials. As for a system boundary, building material production, the building construction, maintenance, and end-of-life stages were included, and six EI categories (GWP, AP, EP, ODP, POCP, and ADP) and four safety guards (human health, social assets, biodiversity, and primary production) were evaluated. Gross floor area (m2) was established as the functional unit. The criteria used to determine the quality of the LCA results were classified into temporal, regional, and technical ranges, as described in Table 1. Furthermore, the building material inputs were analyzed on the basis of the building material quantities applied to the ground floor of the apartment buildings, and it was assumed that the total quantities of building materials specified in the bills of materials were used in the buildings.

3.2. Life-Cycle Inventory Analysis

3.2.1. Selection of Major Building Materials

To analyze the EEIs of buildings more efficiently, it is necessary to select building materials with the highest EIs. The construction of buildings includes more complex procedures than the production processes for general products, and the EEI analysis requires excessive time and labor, as more than 1000 building materials can be used in a construction project.
Therefore, this study analyzed the EEIs of apartment buildings using results from previous research [39] that derived six major building materials (ready-mixed concrete, reinforcement steel, concrete bricks, glass, insulation, and gypsum) accounting for over 95% of the six EI categories (GWP, AP, EP, ODP, POCP, and ADP) in accordance with the cut-off criteria of ISO 14040, an international standard for LCA.

3.2.2. Analysis of Major Building Material Inputs

A total of 443 apartment buildings in South Korea were selected as samples, and the inputs per unit area of the six major building materials were analyzed according to the structure types and plans of the apartment buildings. In this case, the structure types were divided into wall structures, frame structures, and flat plate structures, and the plans were classified into plate, tower, and mixed types. Table 2 lists the number of samples, and Table 3 represents the average input quantities per unit area of the major building materials according to the structure types and plans of the apartment buildings.

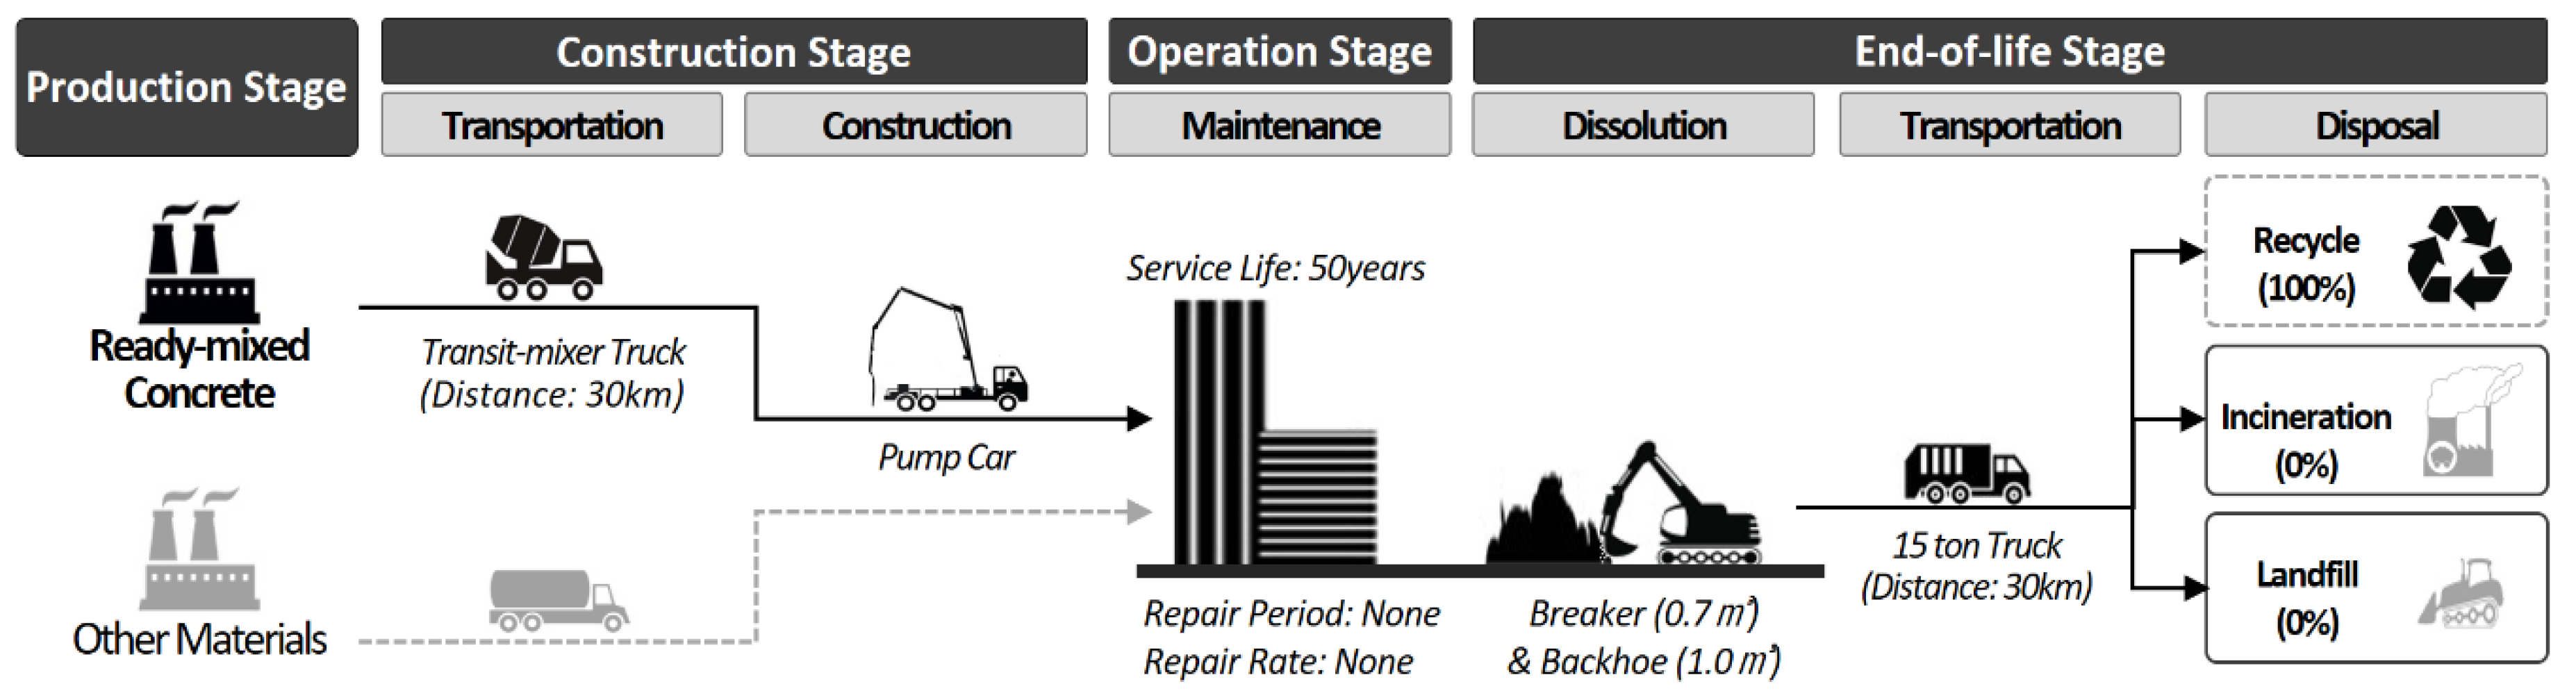
3.2.3. Construction of the Life-Cycle Scenario

For the analysis of LCEEIs, the EEIs of the six major building materials with the highest EIs were assessed in the production stage, and a life-cycle scenario was constructed so that the EEIs could be assessed in the construction, maintenance, and end-of-life stages on the basis of the major building material inputs in the production stage [40]. Figure 2 shows the case of ready-mixed concrete as an example of the EEI assessment on the basis of the constructed life-cycle scenario.
(1) Production stage:
In the production stage, the EIs arising from the production of building materials are assessed. In this study, the EIs of the production stage were assessed using the average inputs per unit area of the six major building materials (ready-mixed concrete, reinforcement steel, glass, concrete bricks, insulation, and gypsum) derived from previous research in accordance with the cut-off criteria of LCA.
(2) Construction stage:
The construction stage is divided into the transportation process of building materials and the construction process of buildings.
In the transportation process, building materials are transported from their production sites to the construction site. In this study, freight vehicles for each of the major building materials were selected as shown in Table 4 on the basis of the standard estimation system for construction works [41]. In addition, the transport distance was assumed to be 30 km for all of the major building materials.
The construction stage represents the EIs caused by the use of equipment during construction, and it was assessed using the LCI DB for the unit of construction work for each building material.
(3) Maintenance stage:
In the maintenance stage, the EIs arising from the production and transport of building materials that are periodically replaced in order to recover the status of aging buildings during their service life are assessed. In this study, the service life of buildings was set to 50 years, in accordance with the upper limit of the standard service life of the Enforcement Regulations of the Corporate Tax Act of Korea [42]. In addition, the EIs of the maintenance stage were assessed using the repair period and rate for each building material suggested by the standards for the formulation of the long-term repair plan in the Enforcement Regulations of the Multi-Family Housing Management Act of Korea. In other words, it was assumed that ready-mixed concrete, reinforcement steel, concrete bricks, glass, and insulation, among the selected six major building materials, were not replaced during the service life of the buildings and that 100% of the gypsum boards were replaced every 20 years.
(4) End-of-life stage:
The end-of-life stage is divided into the demolition process, the transportation process of waste building materials, the incineration process, and the landfill process.
In the dissolution process, the EIs of the equipment and machinery used for building demolition are assessed through fuel efficiency (diesel consumption per unit of work) information of the demolition machines after the number of machines is calculated on the basis of the amount of waste material generated in the demolition process. In this study, it was assumed that both crushers (0.7 m3) and backhoes (1.0 m3) were used as demolition equipment [19] and that the amount of waste material generated in the demolition process was the same as the input quantities of the six major building materials in the production stage.
In the transportation process, the EIs arising from transporting the waste materials generated in the demolition process to recycling centers, incineration plants, or landfills are assessed. In this case, it was assumed that the waste building materials were transported using 15 ton trucks in accordance with the standard estimation system for construction works [41] and that the distances from the demolition site to recycling centers, incineration plants, and landfills were 30 km.
In the end-of-life process, the EIs arising from incinerating or landfilling waste materials are assessed. In this study, the cut-off method imposed on recycling companies was applied to the EIs of the waste material recycling process, and only the EIs of the incineration and landfilling of non-recycled waste materials were assessed. For this, the construction waste processing data from waste statistics [43] published by the Korean Environmental Industry and Technology Institute were investigated, and the recycling, incineration, and landfill rates of each major building material were applied as shown in Table 5.

3.3. Life-Cycle Impact Assessment

3.3.1. Application of the LCI DB

For the assessment of LCEEIs, the LCI DBs for building materials used in buildings, freight vehicles for transporting building materials and waste materials, unit construction work for each building material, and incineration and landfill processes of waste materials must be applied.
In this study, LCI DBs were applied in the order of the Korean LCI DB [44] of the Ministry of Trade, Industry and Energy and the Ministry of Environment (ME) of South Korea; the National Database on Environmental Information of Building Materials of the Korean Institute of Civil Engineering and Building Technology [45]; and Oekobaudat [46] of Germany, considering regional, temporal, and technical correlations, which are the LCI DB selection criteria for LCA suggested by ISO 14040 (refer to Table 6). Furthermore, the EEIs of the six EI categories were assessed through the multiplication of the activity and the EI factor, as shown in Equation (2):
EI i = j = 1 n ( A j × EF i , j ) ,
where EIi are the EEIs of EI category (i), Aj are the building material and energy input quantity for activity (j), and EFi,j is the EI factor of EI category (i) for activity (j).

3.3.2. Application of KOLID

To calculate direct impacts on humans and ecosystems using the EEI assessment results derived for each EI category, the end-point-level LCIA methodology, which systematizes the damage index for each safety guard using results from natural science research, is required.
In this study, KOLID [38] was applied. KOLID is an end-point-level damage-calculation LCEI assessment methodology developed by the Korean ME in 2009 to better understand the damage caused by environmental issues and to expand the distribution of environmentally friendly products. This methodology quantifies 16 end-point damages, including cancer, infectious disease, and cataract, attributable to the six EI categories (GWP, AP, EP, ODP, POCP, and ADP) triggered by products and services, and it evaluates the four safety guards (human health, social assets, biodiversity, and primary production) (refer to Figure 1). Regional correlations were considered, and the damage index for safety guard objects was quantitatively calculated using the LCEEIs of the apartment buildings. Table 7 shows the safety guards and damage indexes of KOLID, and Equation (3) represents the damage-index calculation formula for each safety guard using KOLID:
SI i = j = 1 n ( EI j × DF i , j ) ,
where SIi is the damage index of safety guard (i), EIj are the EEIs of EI category (j), and DFi,j is the damage factor of safety guard (i) for EI category (j).

4. Results and Discussion

This section describes the assessment of the LCEEIs of the apartment buildings with different structure types and plans, as well as the analysis of the assessment results and characteristics from the perspectives of total EIs, building life-cycle stages, major building materials, and safety guards.

4.1. Analysis of Total Environmental Impacts

Figure 3 shows the results of the LCEEI assessment of the apartments analyzed in this study. According to Figure 3, the EIs of tower-type apartment buildings with a flat plate structure were the lowest for all EI categories, while those of plate-type apartment buildings with a wall structure were the highest. If the reduction in EIs is considered during the apartment building design stage using such characteristics, planning only tower-type apartment buildings with a flat plate structure instead of plate-type buildings with wall structures will reduce the potential EIs of each EI category by between 10.74% and 21.67% (refer to Table 8).
The increase or decrease in EIs according to the structure types and plans of the apartment buildings tended to vary relatively regularly for all EI categories. In other words, it was found that the EIs tended to decrease as the structure type changed from a wall structure to frame structures and flat plate structures. Within the same structure type, EIs also varied regularly according to the change in plan. In other words, in wall structures, the EIs of all EI categories decreased as the plan changed from plate to mixed and to tower type. In the flat plate structure, EIs decreased as the plan changed from mixed to plate and to tower type. In the frame structure, the tower type exhibited the lowest EIs despite that changes in some EIs depended on the EI category.

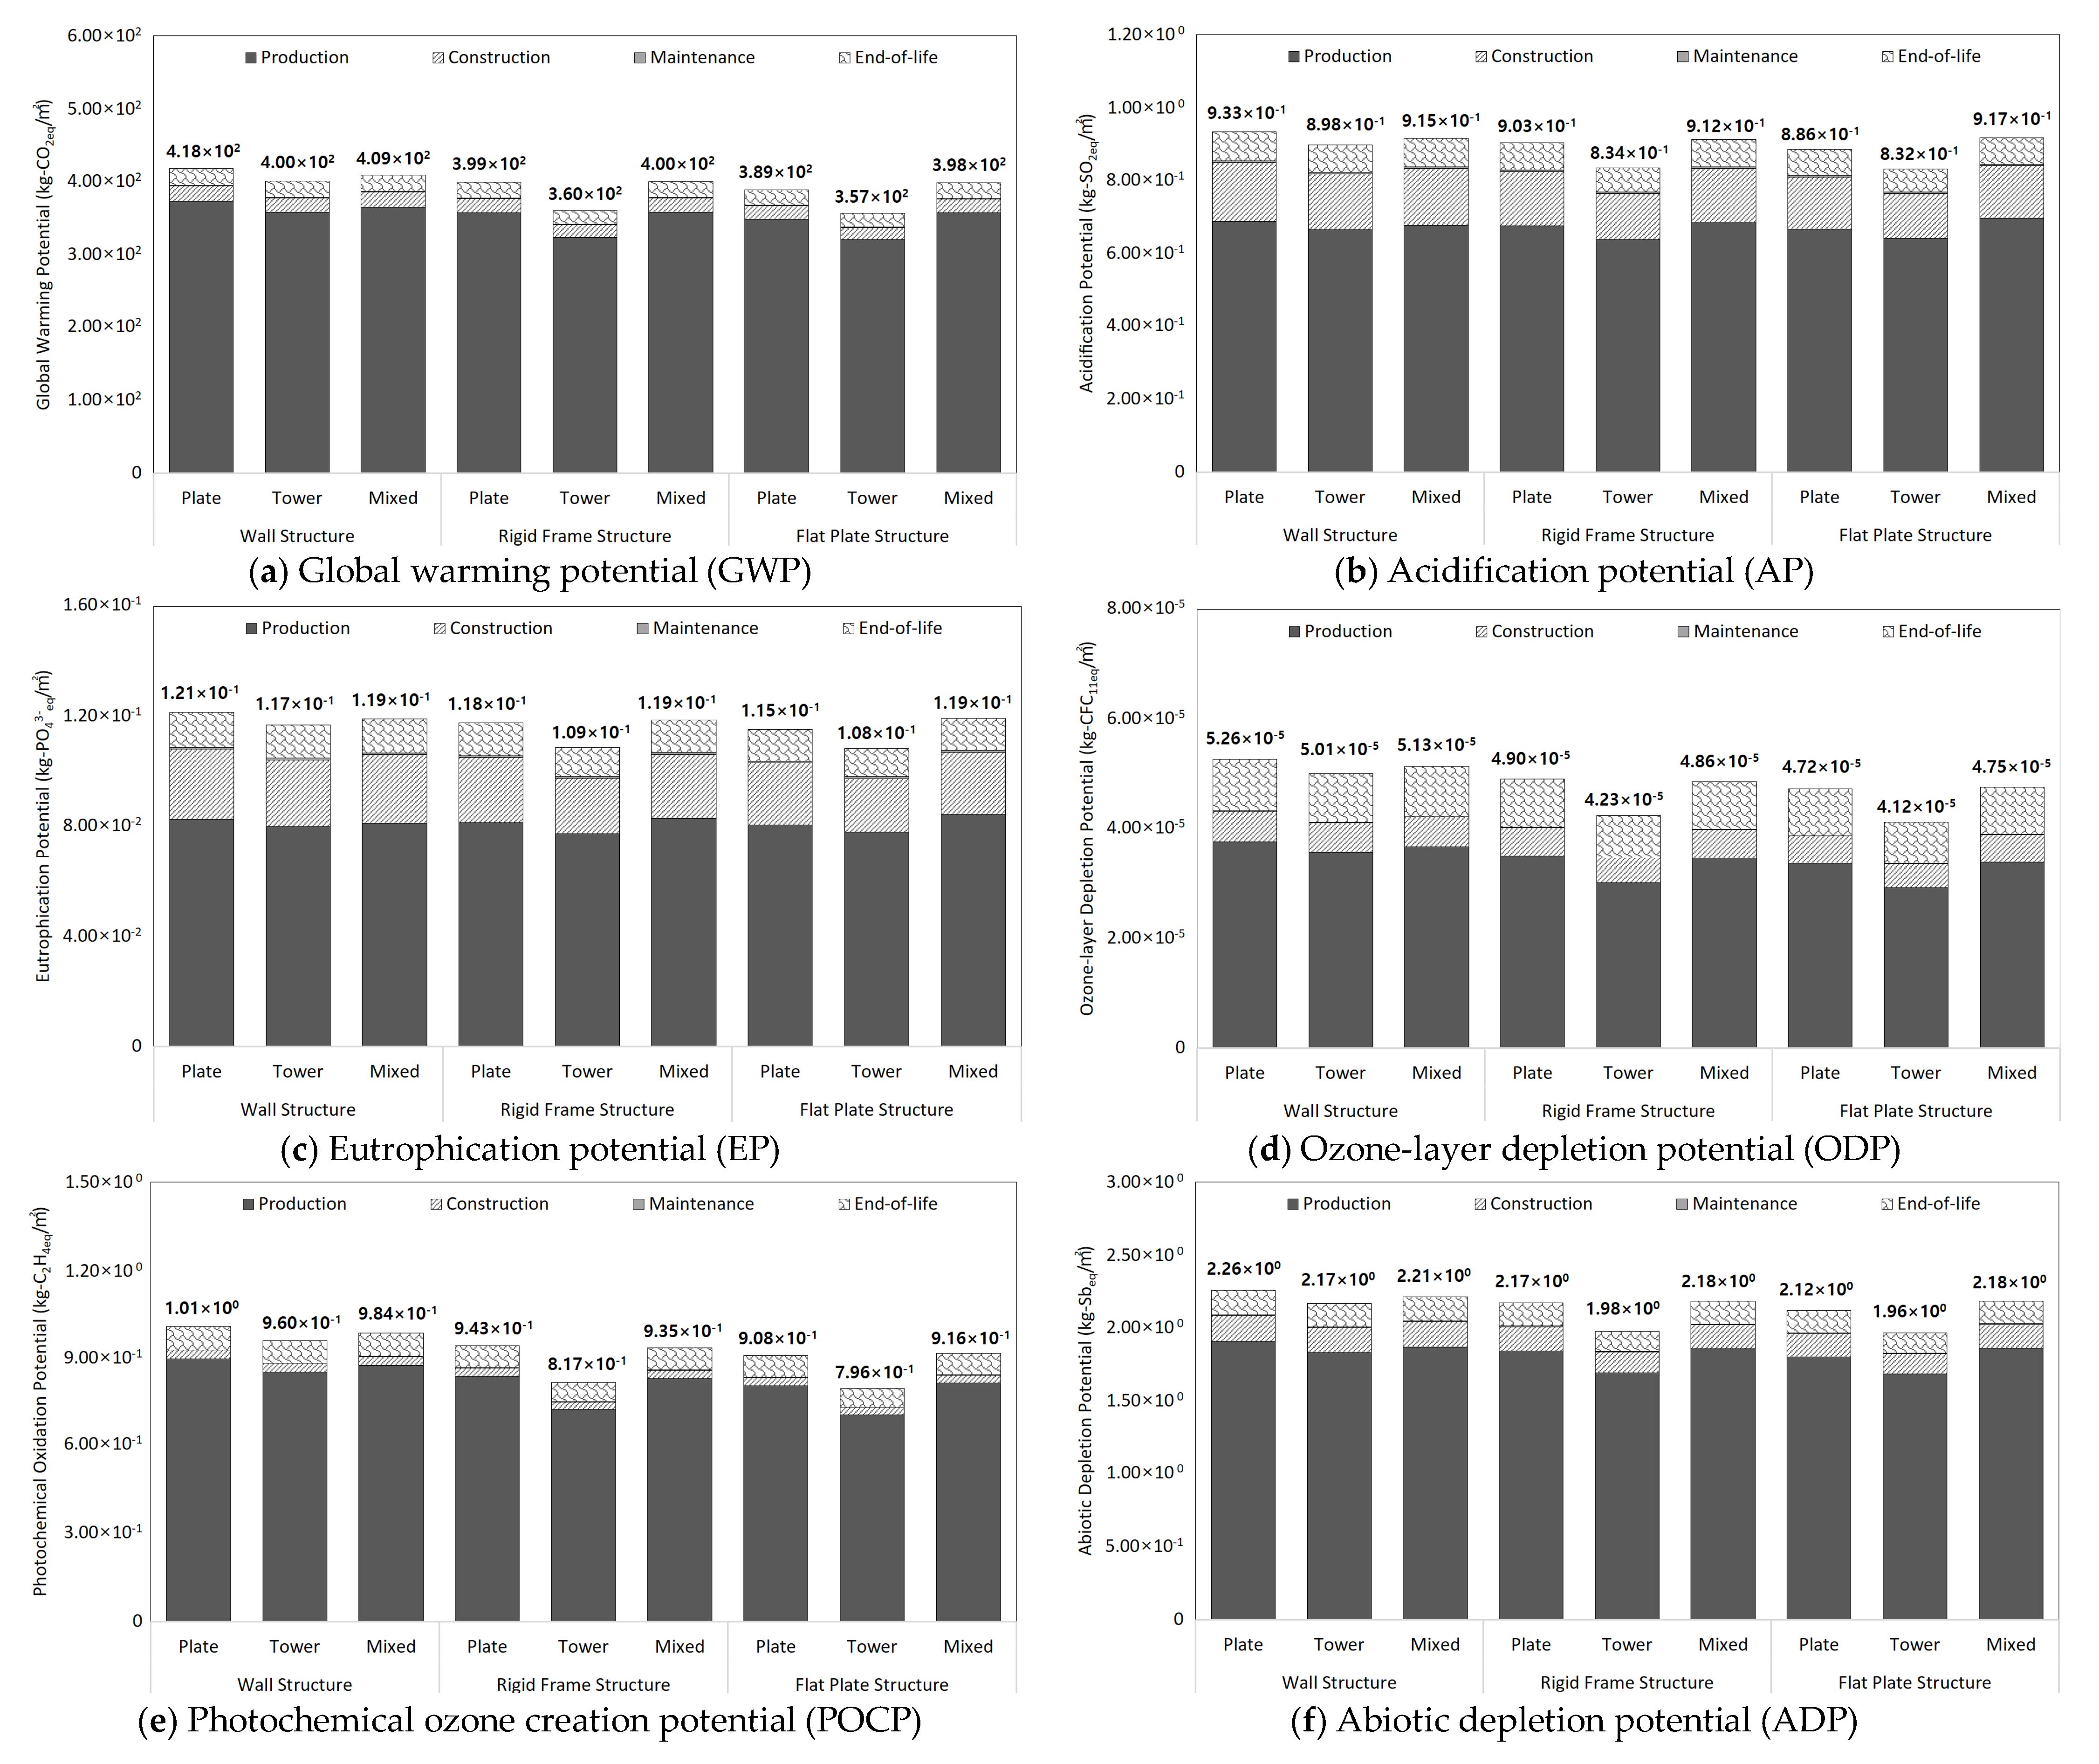
4.2. Analysis by Life-Cycle Stage

According to Figure 3, among the LCEEIs of the apartment buildings, the impacts of the production stage were the highest for all EI categories, while those of the maintenance stage were the lowest. In particular, among the overall EEIs assessed in this study, the percentages of EEIs caused by the production stage ranged from 67.96% (EP, wall structure, plate type) to 90.04% (GWP, flat plate structure, tower type), indicating that reducing EEIs during the production stage is imperative for decreasing LCEEIs of apartment buildings.
The percentages of the EEIs caused by the construction stage ranged from 2.94% (POCP, flat plate structure, tower type) to 21.04% (EP, wall structure, plate type) depending on the EI category, and the percentages caused by the end-of-life stage ranged from 5.23% (GWP, flat plate structure, tower type) to 18.29% (ODP, flat plate structure, tower type). In particular, the proportions of EEIs caused by the construction and end-of-life stages were generally higher for the ODP, AP, and EP impact categories. This indicates that the GWP analysis focused on the production stage, which was mainly performed in previous studies, as well as that the EEI analysis, which considers various EI categories, is necessary for reducing EEIs caused by buildings. This confirms that EI reduction strategies in terms of a building’s entire life cycle, including production, construction, and end-of-life stages, are indispensable.

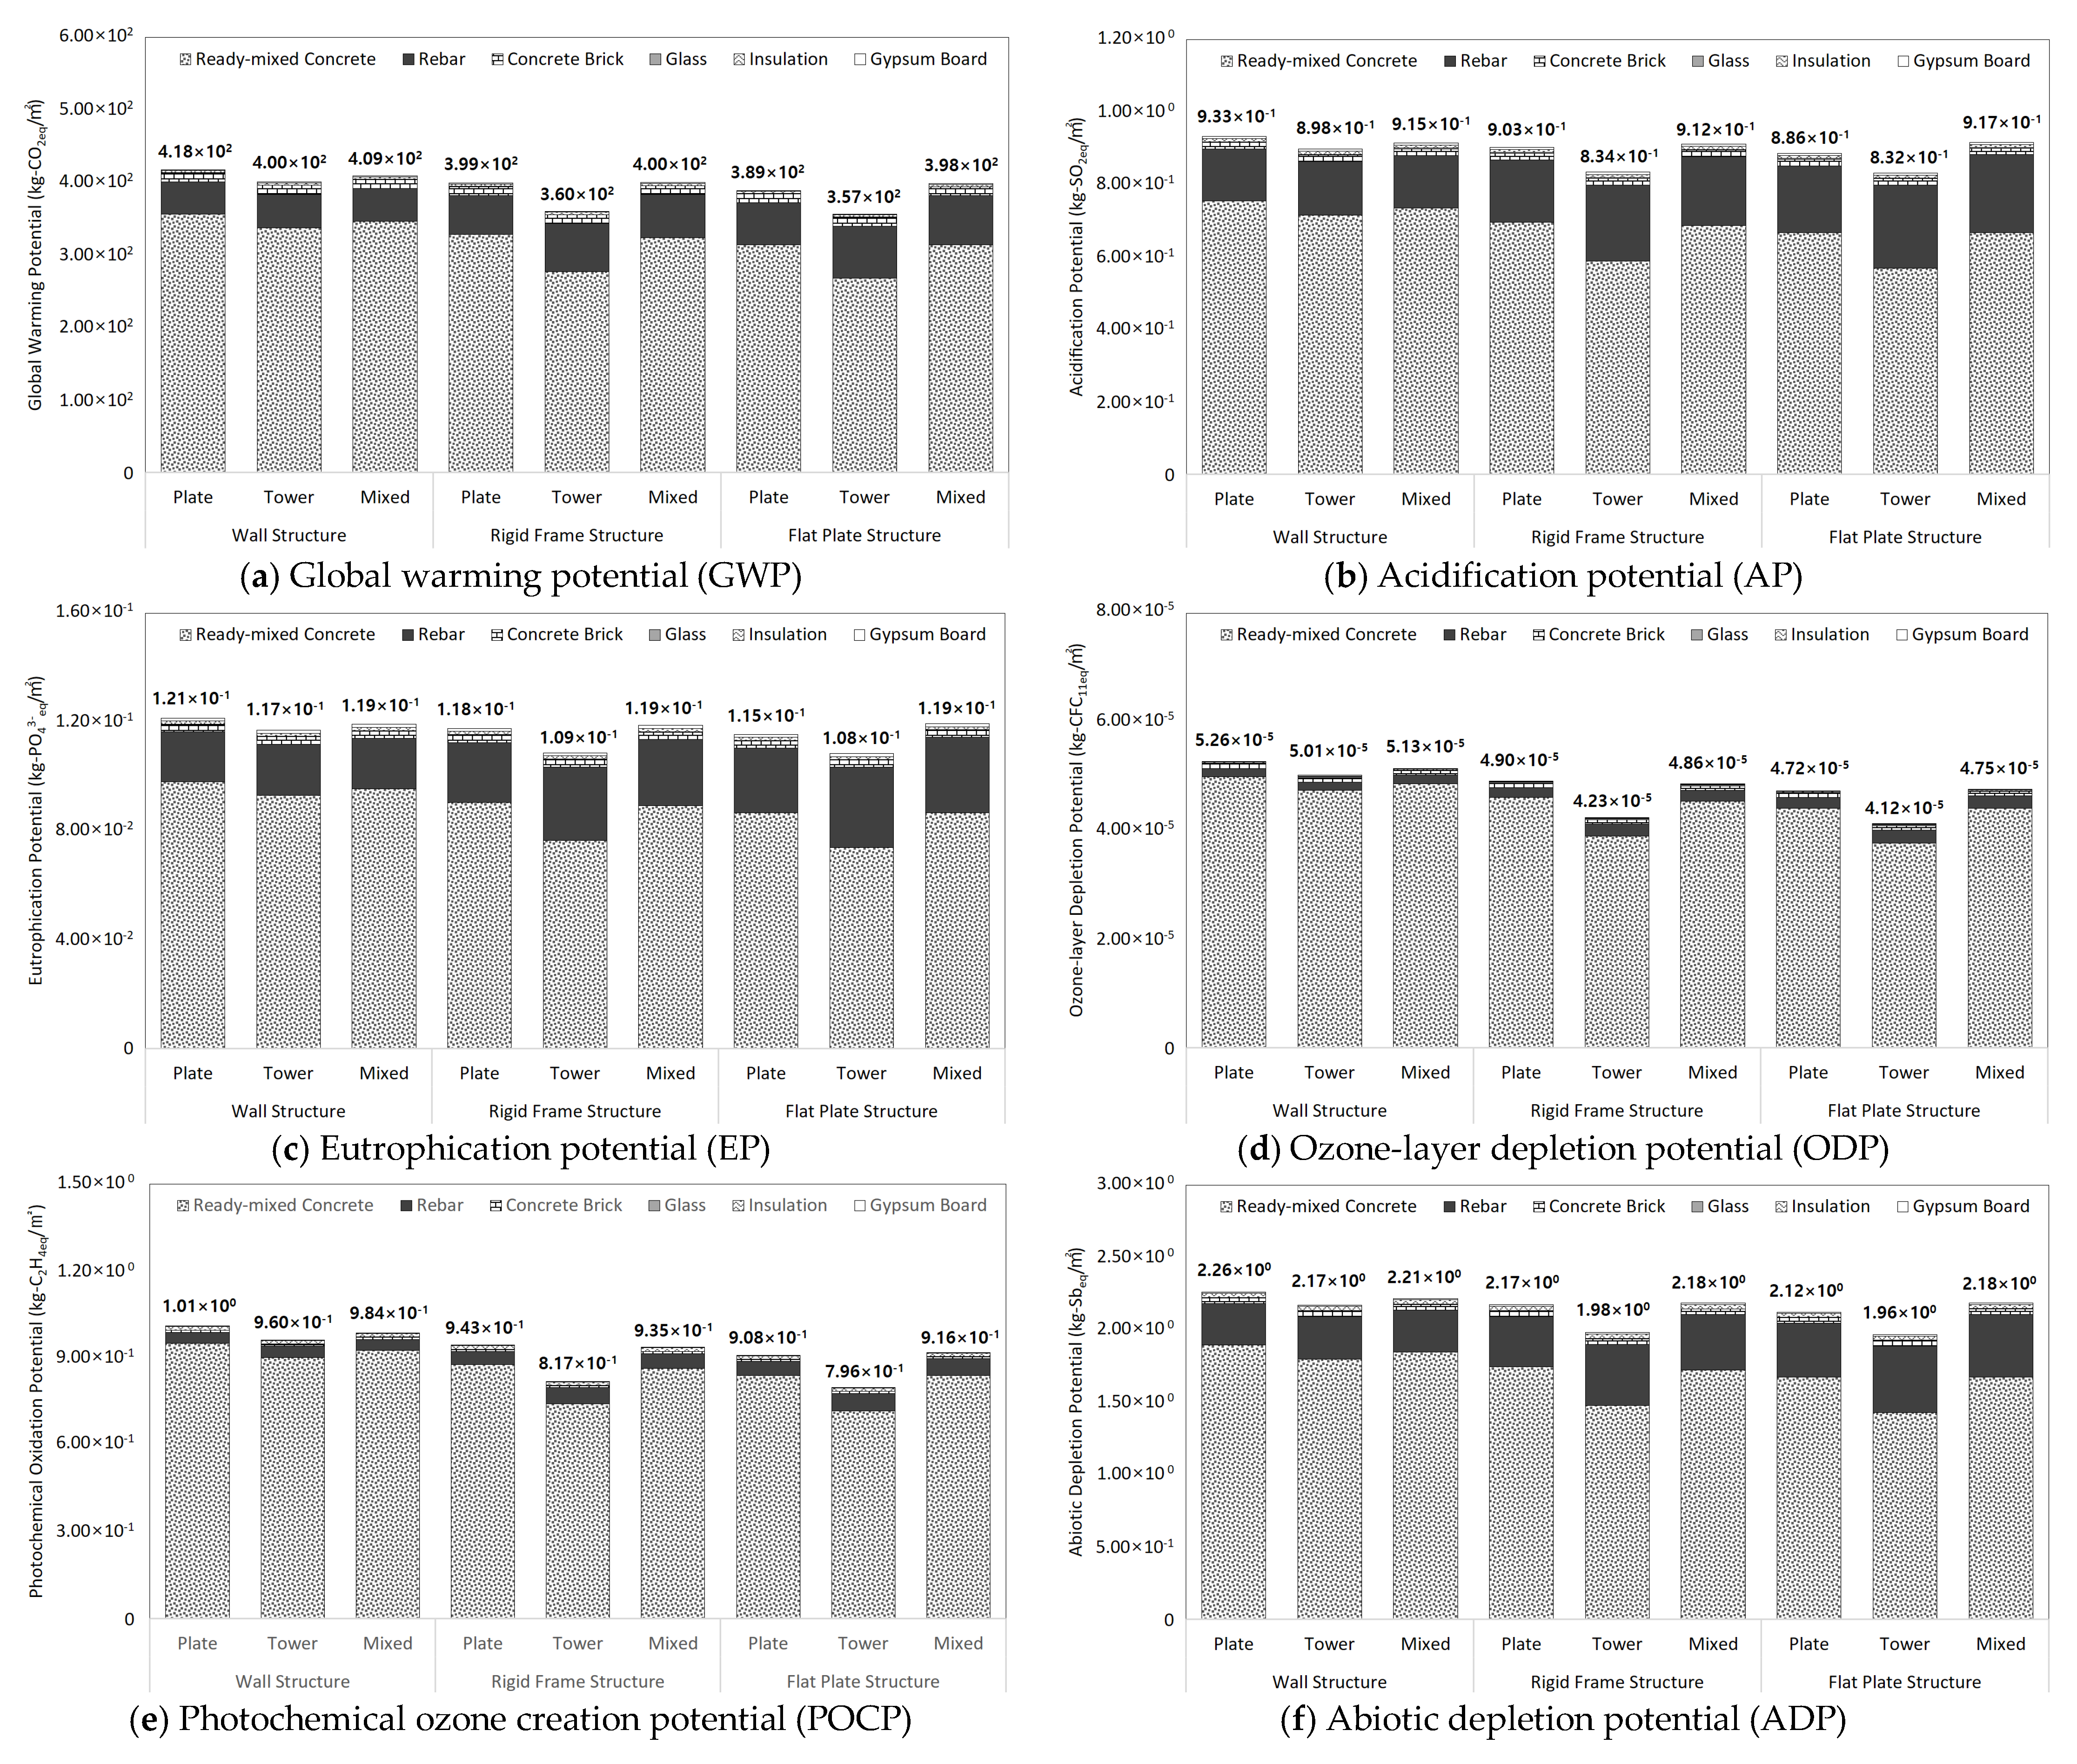
4.3. Analysis by Major Building Materials

Figure 4 shows the results of the LCEEI assessment for the major building materials. As shown in the figure, the impacts of ready-mixed concrete were the highest for all EI categories, while those of glass were the lowest. In particular, among the overall EEIs assessed in this study, the percentages of those caused by ready-mixed concrete ranged from 68.13% (EP, flat plate structure, tower type) to 94.75% (ODP, wall structure, plate type). This indicates that the development and application of concrete with reduced EIs, which considerably replaces conventional concrete with supplementary cementitious materials (SCMs), must be performed to reduce the LCEEIs of apartment buildings.
The percentages of EEIs caused by reinforcement steel ranged from 2.83% (ODP, wall structure, plate type) to 27.52% (AP, flat plate structure, tower type) depending on the EI category. In particular, the EEIs of reinforcement steel were inversely proportional to those of ready-mixed concrete. This is because reinforcement steel and ready-mixed concrete are materials that largely constitute the structures of buildings, and thus the input quantity of reinforcement steel relatively decreased as that of ready-mixed concrete increased, depending on the structure types and plans. As such, from the perspective of EI reduction for apartment buildings, it is necessary to design structural materials considering the balance between EEIs of ready-mixed concrete and reinforcement steel.

4.4. Analysis by Safety Guards

Table 9 shows the results of the damage index assessment by safety guards according to the structure types and plans of the apartment buildings. As can be seen from the figure, the tower-type buildings with a flat plate structure exhibited the lowest damage indexes for all safety guards, while the plate-type buildings with a wall structure showed the highest values. In addition, the increase or decrease in the damage indexes by safety guards tended to vary relatively similarly to how the structure types and plans of the apartment buildings changed regularly for all items. In other words, the damage index by safety guard tended to decrease as the structure type changed from wall structures to frame structures and flat plate structures in the same way as the characteristics of the EI categories changed, as mentioned earlier in Section 4.1: Analysis of Total Environmental Impacts. Furthermore, for wall structures, the damage indexes for all safety guards decreased as the plan changed from plate to mixed and to tower type. In flat plate structures, the damage indexes for safety guards tended to decrease as the plan changed from mixed to plate and to tower type.

4.5. Discussion

As the reduction in the LCEEIs of buildings has been emphasized recently, studies should be carried out to analyze the EEIs of building materials. This is because quantitative values of the LCEEIs of buildings and their major causes must be analyzed first in order to reduce these impacts.
This study provides a significant contribution towards this goal because it presents basic data for reducing the EEIs of buildings by selecting 443 Korean apartment buildings as samples and analyzing their EEIs in terms of six impact categories and damage indexes by safety guards. In particular, the EEIs analyzed in this study according to the structure types and plans of the apartment buildings can be used as factors for easily identifying the EEIs of apartment buildings in construction practice. Furthermore, it appears that the improvement in the environmental performance of ready-mixed concrete, which was found to be the main cause of EEIs, can be utilized as basic data for reducing the EEIs of apartment buildings.
On the other hand, plate-type apartment buildings with a wall structure produced the highest results for all EI categories within the scope of this study, because plate-type apartment buildings with a wall structure used the highest quantity of ready-mixed concrete, which was the most influential in all the EI categories compared to the apartment buildings with other structure types and plans. Therefore, in order to effectively reduce the EEIs of plate-type apartment buildings with a wall structure, it would be effective to apply high-strength concrete to the vertical structural member to reduce the input quantity of ready-mixed concrete and rebar by way of reducing the cross-section. In addition, it is necessary to actively use low-EI concrete that replaces cement, which causes high EIs, with industrial by-products such as fly ash (FA) and ground-granulated blast-furnace slag (GGBS) as a binder for concrete.
This study, however, conducted research only for apartment buildings, not considering various other building types, and the numbers of samples for each structure type and plan were not even a result of difficulty in data collection. In the future, it is necessary to extend the analysis to other building types and improve the reliability and significance of analysis results by securing additional sample data. Moreover, further studies are required to conduct deterministic analyses of EEIs of buildings in combination with probabilistic analysis methods. Research to facilitate the decision-making of stakeholders by integrating EEI assessment results composed of various impact categories and damage indexes for each safety guard into a single index is also required.

5. Conclusions

The purpose of this study was to analyze the EEIs of Korean apartment buildings on the basis of major building materials as part of research with the goal of reducing the LCEIs of buildings. The results are summarized as follows:
  • The LCEEIs of apartment buildings according to structure types and plans were assessed using 443 apartment buildings in South Korea, and the results were analyzed from the perspectives of total EIs, building life-cycle stages, major construction materials, and safety guards.
  • The analysis results showed that the tower-type apartment buildings with a flat plate structure exhibited the lowest EIs for all EI categories (GWP, AP, EP, ODP, POCP, and ADP) on the basis of total EIs, whereas the plate-type apartment buildings with a wall structure showed the highest EIs.
  • In particular, the percentage of EEIs caused by the production stage was the highest for all EI categories; for example, the maximum proportion of 90.04% was found for the tower-type apartment buildings with a flat plate structure for GWP. In addition, the percentages of EEIs of the construction and end-of-life stages reached 21.04% and 18.29%, respectively, depending on the EI category.
  • It was confirmed that ready-mixed concrete and reinforcement steel, both of which constitute the structures of apartment buildings, are major construction materials that cause such EEIs and that the EEIs of ready-mixed concrete are inversely proportional to those of reinforcement steel. In particular, the percentage of the EEIs caused by ready-mixed concrete reached 94.75% for ODP in plate-type apartment buildings with a wall structure, whereas that caused by reinforcement steel reached 27.52% for AP in tower-type apartment buildings with a flat plate structure.
  • The damage index by safety guard was the lowest in the tower-type apartment buildings with a flat plate structure, similarly to total EIs, and was the highest in the plate-type apartment buildings with a wall structure.

Author Contributions

All authors contributed substantially to all aspects of this article.

Acknowledgments

This research was supported by a grant (16CTAP-C114806-01) from the Technology Advancement Research Program (TARP), funded by the Ministry of Land, Infrastructure, and Transport of the Korean government.

Conflicts of Interest

The authors declare no conflict of interest.

Abbreviations

The following abbreviations are used in this manuscript.
LCALife-cycle assessment
LCILife-cycle inventory analysis
LCIALife-cycle impact assessment
LCI DBLife-cycle inventory database
KOLIDKorean life-cycle impact assessment method based on damage-oriented modeling
LCEILife-cycle environmental impact
LCEEILife-cycle embodied environmental impact
EIEnvironmental impact
EEIEmbodied environmental impact
OEIOperational environmental impact
GWPGlobal warming potential
APAcidification potential
EPEutrophication potential
ODPOzone-layer depletion potential
POCPPhotochemical ozone creation potential
ADPAbiotic depletion potential
DALYDisability-adjusted life years
EINESExpected increase in number of extinct species
NPPNet primary production
SCMSupplementary cementitious material
FAFly ash
GGBSGround-granulated blast-furnace slag

References

  1. Simpson, N.P.; Basta, C. Sufficiently capable for effective participation in environmental impact assessment? Environ. Impact Assess. Rev. 2018, 70, 57–70. [Google Scholar] [CrossRef]
  2. Gorobets, A. Eco-centric policy for sustainable development. J. Clean. Prod. 2014, 64, 654–655. [Google Scholar] [CrossRef]
  3. Vrieze, R.; Moll, H. An analytical approach towards sustainability-centered guidelines for Dutch primary school building design. Int. J. Sustain. Build. Technol. Urban Dev. 2017, 8, 93–124. [Google Scholar]
  4. Vonka, M.; Hajek, P.; Lupisek, A. SBToolCZ: Sustainability rating system in the Czech Republic. Int. J. Sustain. Build. Technol. Urban Dev. 2013, 1, 46–52. [Google Scholar] [CrossRef]
  5. Braganca, L.; Mateus, R.; Koukkari, H. Building Sustainability Assessment. Sustainability 2010, 2, 2010–2023. [Google Scholar] [CrossRef]
  6. Simona, P.L.; Spiru, P.; Ion, I.V. Increasing the energy efficiency of buildings by thermal insulation. Energy Procedia 2017, 128, 393–399. [Google Scholar] [CrossRef]
  7. Li, J.; Colombier, M. Managing carbon emissions in China through building energy efficiency. J. Environ. Manag. 2009, 90, 2436–2447. [Google Scholar] [CrossRef] [PubMed]
  8. Pierucci, A.; Cannavale, A.; Martellotta, F.; Fiorito, F. Smart windows for carbon neutral buildings: A life cycle approach. Energy Build. 2018, 165, 160–171. [Google Scholar] [CrossRef]
  9. Dong, L.; Wang, Y.; Li, H.X.; Jiang, B.; Al-Hussein, M. Carbon Reduction Measures-Based LCA of Prefabricated Temporary Housing with Renewable Energy Systems. Sustainability 2018, 10, 718. [Google Scholar] [CrossRef]
  10. Huedo, P.; Mulet, E.; Lopez-Mesa, B. A model for the sustainable selection of building envelope assemblies. Environ. Impact Assess. Rev. 2016, 57, 63–77. [Google Scholar] [CrossRef]
  11. Cellura, M.; Guarino, F.; Longo, S.; Mistretta, M. Different energy balances for the redesign of nearly net zero energy buildings: An Italian case study. Renew. Sustain. Energy Rev. 2015, 45, 100–112. [Google Scholar] [CrossRef]
  12. Haase, M.; Andresen, I.; Gustavsen, A.; Dokka, T.H.; Hestnes, A.G. Zero Emission Building Concepts in Office Buildings in Norway. Int. J. Sustain. Build. Technol. Urban Dev. 2011, 2, 150–156. [Google Scholar] [CrossRef]
  13. Ferrante, A.; Mochi, G.; Predari, G.; Badini, L.; Fotopoulou, A.; Gulli, R.; Semprini, G. A European Project for Safer and Energy Efficient Buildings: Pro-GET-onE (Proactive Synergy of inteGrated Efficient Technologies on Buildings’ Envelopes). Sustainability 2018, 10, 812. [Google Scholar] [CrossRef]
  14. Harkouss, F.; Fardoun, F.; Biwole, F.H. Multi-objective optimization methodology for net zero energy buildings. J. Build. Eng. 2018, 16, 57–71. [Google Scholar] [CrossRef]
  15. Annunziata, E.; Frey, M.; Rizzi, F. Towards nearly zero-energy buildings: The state-of-art of national regulations in Europe. Energy 2013, 57, 125–133. [Google Scholar] [CrossRef]
  16. AIA. AIA Guide to Building Life Cycle Assessment in Practice; AIA: Washington, DC, USA, 2010. [Google Scholar]
  17. Zuo, J.; Zhao, Z.Y. Green building research–Current status and future agenda: A review. Renew. Sustain. Energy Rev. 2014, 30, 271–281. [Google Scholar] [CrossRef]
  18. Oliveira, Z.L.; David, V.L.; Serra, S.M.B.; Barreto, D. Decision making process assisted by life cycle assessment: Greenhouse gas emission. Int. J. Sustain. Build. Technol. Urban Dev. 2017, 8, 244–253. [Google Scholar]
  19. Roh, S.; Tae, S. Building Simplified Life Cycle CO2 Emissions Assessment Tool (B-SCAT) to Support Low-Carbon Building Design in South Korea. Sustainability 2016, 8, 567. [Google Scholar] [CrossRef]
  20. Rovers, R. Material-Neutral Building: Closed Cycle Accounting for Buildings Construction a new practical way to measure improvements in creating a balanced resource use for construction. Int. J. Sustain. Build. Technol. Urban Dev. 2010, 1, 152–159. [Google Scholar] [CrossRef]
  21. Geng, S.; Wang, Y.; Zuo, J.; Zhou, Z.; Du, H.; Mao, G. Building life cycle assessment research: A review by bibliometric analysis. Renew. Sustain. Energy Rev. 2017, 76, 176–184. [Google Scholar] [CrossRef]
  22. Rashid, A.F.A.; Yusoff, S. A review of life cycle assessment method for building industry. Renew. Sustain. Energy Rev. 2015, 45, 244–248. [Google Scholar] [CrossRef]
  23. Iban-Mohammed, T.; Greenough, R.; Taylor, S.; Ozawa-Meida, L.; Acquaye, A. Operational vs. embodied emissions in buildings—A review of current trends. Energy Build. 2013, 66, 232–245. [Google Scholar] [CrossRef]
  24. Chastas, P.; Theodosiou, T.; Bikas, D.; Kontoleon, K. Embodied Energy and Nearly Zero Energy Buildings: A Review in Residential Buildings. Procedia Environ. Sci. 2017, 38, 554–561. [Google Scholar] [CrossRef]
  25. Basbagill, J.; Flager, F.; Lepech, M.; Fischer, M. Application of life-cycle assessment to early stage building design for reduced embodied environmental impacts. Build. Environ. 2013, 60, 81–92. [Google Scholar] [CrossRef]
  26. Luo, Z.; Yang, L.; Liu, J. Embodied carbon emissions of office building: A case study of China’s 78 office buildings. Build. Environ. 2016, 95, 365–371. [Google Scholar] [CrossRef]
  27. Roh, S.; Tae, S.; Shin, S. Development of building materials embodied greenhouse gases assessment criteria and system (BEGAS) in the newly revised Korea Green Building Certification System (G-SEED). Renew. Sustain. Energy Rev. 2014, 35, 410–421. [Google Scholar] [CrossRef]
  28. Li, X.; Yang, F.; Zhu, Y.; Gao, Y. An assessment framework for analyzing the embodied carbon impacts of residential buildings in China. Energy Build. 2014, 85, 400–409. [Google Scholar] [CrossRef]
  29. Moncaster, A.M.; Song, J.Y. A comparative review of existing data and methodologies for calculating embodied energy and carbon of buildings. Int. J. Sustain. Build. Technol. Urban Dev. 2012, 1, 26–36. [Google Scholar] [CrossRef]
  30. Zeng, R.; Chini, A. A review of research on embodied energy of buildings using bibliometric analysis. Energy Build. 2017, 155, 172–184. [Google Scholar] [CrossRef]
  31. Shi, Q.; Yu, T.; Zuo, J. What leads to low-carbon buildings? A China study. Renew. Sustain. Energy Rev. 2015, 50, 726–734. [Google Scholar] [CrossRef]
  32. Wen, T.J.; Siong, H.C.; Noor, Z.Z. Assessment of embodied energy and global warming potential of building construction using life cycle analysis approach: Case studies of residential buildings in Iskandar Malaysia. Energy Build. 2015, 93, 295–302. [Google Scholar] [CrossRef]
  33. Roh, S.; Tae, S.; Shin, S.; Woo, J. Development of an optimum design program (SUSB-OPTIMUM) for the life cycle CO2 assessment of an apartment house in Korea. Build. Environ. 2014, 73, 40–54. [Google Scholar] [CrossRef]
  34. Heinonen, J.; Säynäjoki, A.; Junnonen, J.; Pöyry, A.; Junnila, S. Pre-use phase LCA of a multi-story residential building: Can greenhouse gas emissions be used as a more general environmental performance indicator? Build. Environ. 2016, 95, 116–125. [Google Scholar] [CrossRef]
  35. Dixit, M.K. Life cycle embodied energy analysis of residential buildings: A review of literature to investigate embodied energy parameters. Renew. Sustain. Energy Rev. 2017, 79, 390–413. [Google Scholar] [CrossRef]
  36. Guinee, J.B. Handbook on Life Cycle Assessment Operational Guide to the ISO Standards, CML; Leiden University: Leiden, The Netherlands, 2002. [Google Scholar]
  37. ISO. ISO 14025: Environmental Labels and Declarations—Type III Environmental Declarations—Principles and Procedures; ISO: Geneva, Switzerland, 2006. [Google Scholar]
  38. Korea Environmental Industry & Technology Institute. Development of Integrated Evaluation Technology on Product Value for Dissemination of Environmentally Preferable Products; Korea Ministry of Environment: Sejong, Korea, 2009.
  39. Roh, S.; Tae, S.; Suk, S.J.; Ford, G. Evaluating the embodied environmental impacts of major building tasks and materials of apartment buildings in Korea. Renew. Sustain. Energy Rev. 2017, 73, 135–144. [Google Scholar] [CrossRef]
  40. Roh, S.; Tae, S.; Suk, S.J.; Ford, G.; Shin, S. Development of a building life cycle carbon emissions assessment program (BEGAS 2.0) for Korea’s green building index certification system. Renew. Sustain. Energy Rev. 2016, 53, 954–965. [Google Scholar] [CrossRef]
  41. Korea Institute of Civil Engineering and Building Technology (KICT). Standard Estimating System of the Construction Work; KICT: Goyang, Korea, 2017. [Google Scholar]
  42. Korea Legislation Research Institute (KLRI). Korea Corporate Tax Act: Korea Ministry of Strategy and Finance. 2013. Available online: http://elaw.klri.re.kr/kor_service/lawView.do?hseq=28577&lang=ENG (accessed on 31 March 2018).
  43. Korea Environmental Industry & Technology Institute (KEITI). Waste Statistics; KEITI: Seoul, Korea, 2017. [Google Scholar]
  44. Korea Environmental Industry & Technology Institute (KEITI). Korea Life Cycle Inventory Database. 2004. Available online: http://www.edp.or.kr/lci/lci_db.asp (accessed on 12 March 2018).
  45. Korea Institute of Civil Engineering and Building Technology (KICT). The Final Report of National DB on Environmental Information of Building Materials; KICT: Goyang, Korea, 2008. [Google Scholar]
  46. Germany Federal Ministry of the Interior, Building and Community. Oekobaudat. 2017. Available online: http://www.oekobaudat.de/en/database/database-oekobaudat.html (accessed on 31 March 2018).
Figure 1. Example of the evaluation method for life-cycle environmental impacts (LCEIs) at the end-point level [38].
Sustainability 10 01693 g001
Figure 2. Example of scenario-based embodied environmental impact (EEI) evaluation.
Sustainability 10 01693 g002
Figure 3. Results of life-cycle embodied environmental impacts (LCEEIs) by life-cycle stages.
Sustainability 10 01693 g003
Figure 4. Results of life-cycle embodied environmental impacts (LCEEIs) by major building materials.
Sustainability 10 01693 g004
Table 1. Data quality criteria.
ClassificationTemporal RangesRegional RangesTechnical Ranges
Internal data
(Bills of materials)
Bills of materials prepared at the commencement of the workBills of materials prepared in South KoreaSix major building materials listed in the bills of materials
External data
(LCI DB)
Latest LCI DBLCI DB constructed in South Korea and GermanyLCI DB of same or similar building materials
Table 2. Number of samples.
ClassificationWall StructureRigid Frame StructureFlat Plate Structure
Plate type118226
Tower type1014022
Mixed type606410
Table 3. Average input quantity of building materials by structure types and plans of apartment building.
ClassificationUnitWall StructureRigid Frame StructureFlat Plate Structure
Plate TypeTower TypeMixed TypePlate TypeTower TypeMixed TypePlate TypeTower TypeMixed Type
Ready-mixed concretem3/m20.770.730.750.710.600.700.680.580.68
Rebarkg/m298.13101.3599.92118.34145.26131.55127.52158.40149.24
Concrete brickkg/m290.8790.8186.5290.5289.9886.8989.7788.8585.54
Glasskg/m25.87 5.99 5.99 5.87 6.12 5.61 5.74 5.74 5.99
Insulationkg/m21.561.481.581.621.571.601.441.401.49
Gypsum boardkg/m22.632.682.672.662.722.652.502.692.62
Table 4. Freight vehicles.
ClassificationReady-Mixed ConcreteRebarOthers
Freight vehicleTransit-mixer truck20 ton truck8 ton truck
Table 5. Processing ratios of waste building materials.
ClassificationRecycle Ratio (%)Incineration Ratio (%)Landfill Ratio (%)
Waste concrete100.00.00.0
Waste rebar100.00.00.0
Waste concrete brick100.00.00.0
Waste glass79.00.021.0
Waste insulation46.753.30.0
Waste gypsum board62.70.237.1
Table 6. Environmental impact (EI) factors.
ClassificationUnitGWPAPEPODPPOCPADPRef.
kg CO2eq/Unitkg SO2eq/Unitkg PO43−eq/Unitkg CFC11eq/Unitkg C2H4eq/Unitkg Sbeq/Unit
Production stageReady-mixed concretem34.09 × 1026.82 × 10−17.96 × 10−24.65 × 10−51.10 × 1002.04 × 100
Rebarkg4.38 × 10−11.40 × 10−31.79 × 10−41.04 × 10−83.41 × 10−42.79 × 10⁻³
Concrete brickkg1.23 × 10−11.56 × 10−42.26 × 10−54.71 × 10−93.82 × 10−53.02 × 10⁻⁴
Construction stageTransit-mixer truckm3 × km6.74 × 10−16.50 × 10−31.03 × 10−32.44 × 10−71.12 × 10−34.47 × 10⁻³
8 ton truckkg × km2.88 × 10−62.17 × 10−83.86 × 10−91.06 × 10−126.45 × 10−91.94 × 10−8
End-of-life stageDieselkg6.82 × 10−21.40 × 10−49.55 × 10−61.26 × 10−101.18 × 10−52.16 × 10−2
Construction waste dumpingkg6.05 × 10−28.52 × 10−51.31 × 10−51.23 × 10−112.21 × 10−55.02 × 10−9
Ⓐ: Korean life-cycle inventory database; Ⓑ: National Database on Environmental Information of Building Materials; Ⓒ: Oekobaudat.
Table 7. Safety guard and damage index of Korean life-cycle impact assessment method based on damage-oriented modeling (KOLID).
ClassificationSafety GuardEnd PointIndicatorDamage Factor
GWPHuman healthMortality damages caused by heat/cold stress, infections, natural disaster damage, and malnutritionLost life1.23 × 10−7 DALY/kg CO2
Social assetsDecreases in agricultural production outputAgricultural production output2.54 × 10−3 USD/kg CO2
Changes in energy consumption due to increases in cooling and decreases in heatingEnergy consumption quantity
Sea-level risingLand prices
APHuman healthDamages caused by asthma and respiratory diseasesLost life2.38 × 10−4 DALY/kg SO2
Social assetsDecreases in wood production outputWood production output4.76 × 100 USD/kg SO2
Primary productionDecreases in primary production output of land plantsPrimary production output2.27 × 101 kg/kg SO2
EPSocial assetsDecreases in fishery production outputFishery production output2.16 × 100 USD/kg PO43-
ODPHuman healthDamages caused by malignant melanoma, basal cell carcinoma, and spinocellular carcinomaLost life1.35 × 10−3 DALY/kg CFC-11
Social assetsDecreases in agricultural and wood production outputAgricultural and wood production output1.21 × 100 USD/kg CFC-11
Primary productionDecreases in primary production output of land plants and phytoplanktonPrimary production output2.79 × 102 kg/kg CFC-11
POCPHuman healthDamages caused by sudden death, asthma, and respiratory diseasesLost life3.22 × 10−5 DALY/kg C2H4
Social assetsDecreases in agricultural and wood production outputAgricultural and wood production output0.77 × 100 USD/kg C2H4
Primary productionDecreases in primary production output of land plantsPrimary production output2.64 × 101 kg/kg C2H4
ADPSocial assetsDecreases in resource depositsUsers’ costs1.42 × 101 kg/kg Sb
BiodiversityChanges in the composition of plant speciesSpecies changes1.53 × 10−1 EINES/kg Sb
Primary productionLand changes, and potential NPP decreases in land usePrimary production output8.90 × 10−14 kg/kg Sb
Table 8. Reduction ratio of environmental impacts (EIs).
ClassificationWall Structure, Plate TypeFlat Plate Structure, Tower TypeReduction Ratio
GWP (kg CO2eq/m2)4.18 × 1023.57 × 10214.59%
AP (kg SO2eq/m2)9.33 × 10−18.32 × 10−110.83%
EP (kg PO43−eq/m2)1.21 × 10−11.08 × 10−110.74%
ODP (kg CFC11eq/m2)5.26 × 10−54.12 × 10−521.67%
POCP (kg C2H4eq/m2)1.01 × 1007.96 × 10121.19%
ADP (kg Sbeq/m2)2.26 × 1001.96 × 10013.27%
Table 9. Results of damage index by safety guard.
ClassificationUnitWall StructureRigid Frame StructureFlat Plate Structure
Plate TypeTower TypeMixed TypePlate TypeTower TypeMixed TypePlate TypeTower TypeMixed Type
Human healthDALY/m23.06 × 10−4 2.94 × 10⁻⁴ 3.00 × 10−42.94 × 10−42.69 × 10−42.96 × 10−42.88 × 10−42.68 × 10−42.97 × 10⁻⁴
Social assetsUSD/m26.11 × 1005.87 × 1005.99 × 1005.88 × 1005.38 × 1005.92 × 1005.75 × 1005.34 × 1005.93 × 100
BiodiversityEINES/m23.46 × 10−13.32 × 10−13.39 × 10−13.32 × 10−13.03 × 10−13.34 × 10−13.25 × 10−13.01 × 10−13.34 × 10−1
Primary Productionkg/m25.11 × 10−24.89 × 10−25.00 × 10−24.86 × 10−24.35 × 10−24.86 × 10−24.72 × 10−24.29 × 10−24.83 × 10−2

