Flooding Hazards across Southern China and Prospective Sustainability Measures


1
State Key Laboratory of Ocean Engineering, School of Naval Architecture, Ocean, and Civil Engineering, Shanghai Jiao Tong University, Shanghai 200240, China
2
Collaborative Innovation Center for Advanced Ship and Deep-Sea Exploration (CISSE), Department of Civil Engineering, School of Naval Architecture, Ocean & Civil Engineering, Shanghai Jiao Tong University, Shanghai 200240, China
3
Institute of Tunnel and Underground Structure Engineering, Xi’an University of Architecture and Technology, Xi’an 710055, China
4
Department of Civil and Construction Engineering, Swinburne University of Technology, Hawthorn, VIC 3122, Australia
*
Author to whom correspondence should be addressed.
Sustainability 2018, 10(5), 1682; https://doi.org/10.3390/su10051682
Submission received: 21 March 2018
/
Revised: 7 May 2018
/
Accepted: 14 May 2018
/
Published: 22 May 2018
(This article belongs to the Section Environmental Sustainability and Applications)
Abstract
:The Yangtze River Basin and Huaihe River Basin in Southern China experienced severe floods 1998 and 2016. The reasons for the flooding hazards include the following two factors: hazardous weather conditions and degradation of the hydrological environment due to anthropogenic activities. This review work investigated the weather conditions based on recorded data, which showed that both 1998 and 2016 were in El Nino periods. Human activities include the degradations of rivers and lakes and the effects caused by the building of the Three Gorges Dam. In addition, the flooding in 2016 had a lower hazard scale than that in 1998 but resulted in larger economic losses than that of 1998. To mitigate urban waterlogging caused by flooding hazards, China proposed a new strategy named Spongy City (SPC) in 2014. SPC promotes sustainable city development so that a city has the resilience to adapt to climate change, to mitigate the impacts of waterlogging caused by extreme rainfall events. The countermeasures used to tackle the SPC construction-related problems, such as local inundation, water resource shortage, storm water usage, and water pollution control, are proposed for city management to improve the environment.
1. Introduction
Global warming has caused concern among the international community and has become an urgent issue worldwide. The Intergovernmental Panel on Climate Change (IPCC) reported that climate change caused by global warming will be a serious threat to human beings [1,2]. Global warming has been deemed a primary problem that will affect the world in the next few decades. Ecological environmental protection has been identified in China as an international responsibility, essential for the nation to achieve sustainable development [3,4,5]. The sea level rise caused by global warming has led to a series of flooding hazards in coastal cities in China [6]. Climate change not only causes various natural disasters but also significantly influences global economic growth [7,8]. To mitigate the impacts of climate change, developing countries are facing difficulties in balancing economic growth with the need to reduce energy consumption [9]. Inevitably, economic growth is accompanied by the generation of greenhouse gases that exacerbate global warming.
Due to rapid urbanization in China, a large number of people have migrated to coastal cities since the late 1990s, which has been identified as a factor contributing to global warming. Urbanization is another important factor responsible for land contamination in urban areas [10,11] along with infrastructure construction [12,13,14,15,16]. Existing studies [17] showed that the urbanization rate ranged from 18% to 46% over 30 years, during the period of 1978 to 2008. In 2013, the urbanization rate increased to 58%, and it is expected that this rate will reach 80% in the near future. At present, more than 50% of cities are experiencing urbanization, as increasing numbers of people move to urban areas, especially to the coastal Chinese cities.
Rapid urbanization triggers the construction of roads, bridges, and underground transit networks [18,19,20,21,22], as well as the development of residential areas [23]. Increasing numbers of river banks and lakes are being reclaimed [24,25,26]. Due to the degradation of rivers and lakes, excess rainwater does not have sufficient drainage. Thus, the decrease in river bank and lake area intensifies flooding disasters. Many cities in the coastal regions of China have experienced land subsidence and flooding hazards induced by urbanization [27,28,29]. As a result, many researchers have focused on the impact of climate change caused by urbanization [30,31,32,33], as well as the risk of flooding caused by a combination of climate change and engineering activities [34,35,36,37].
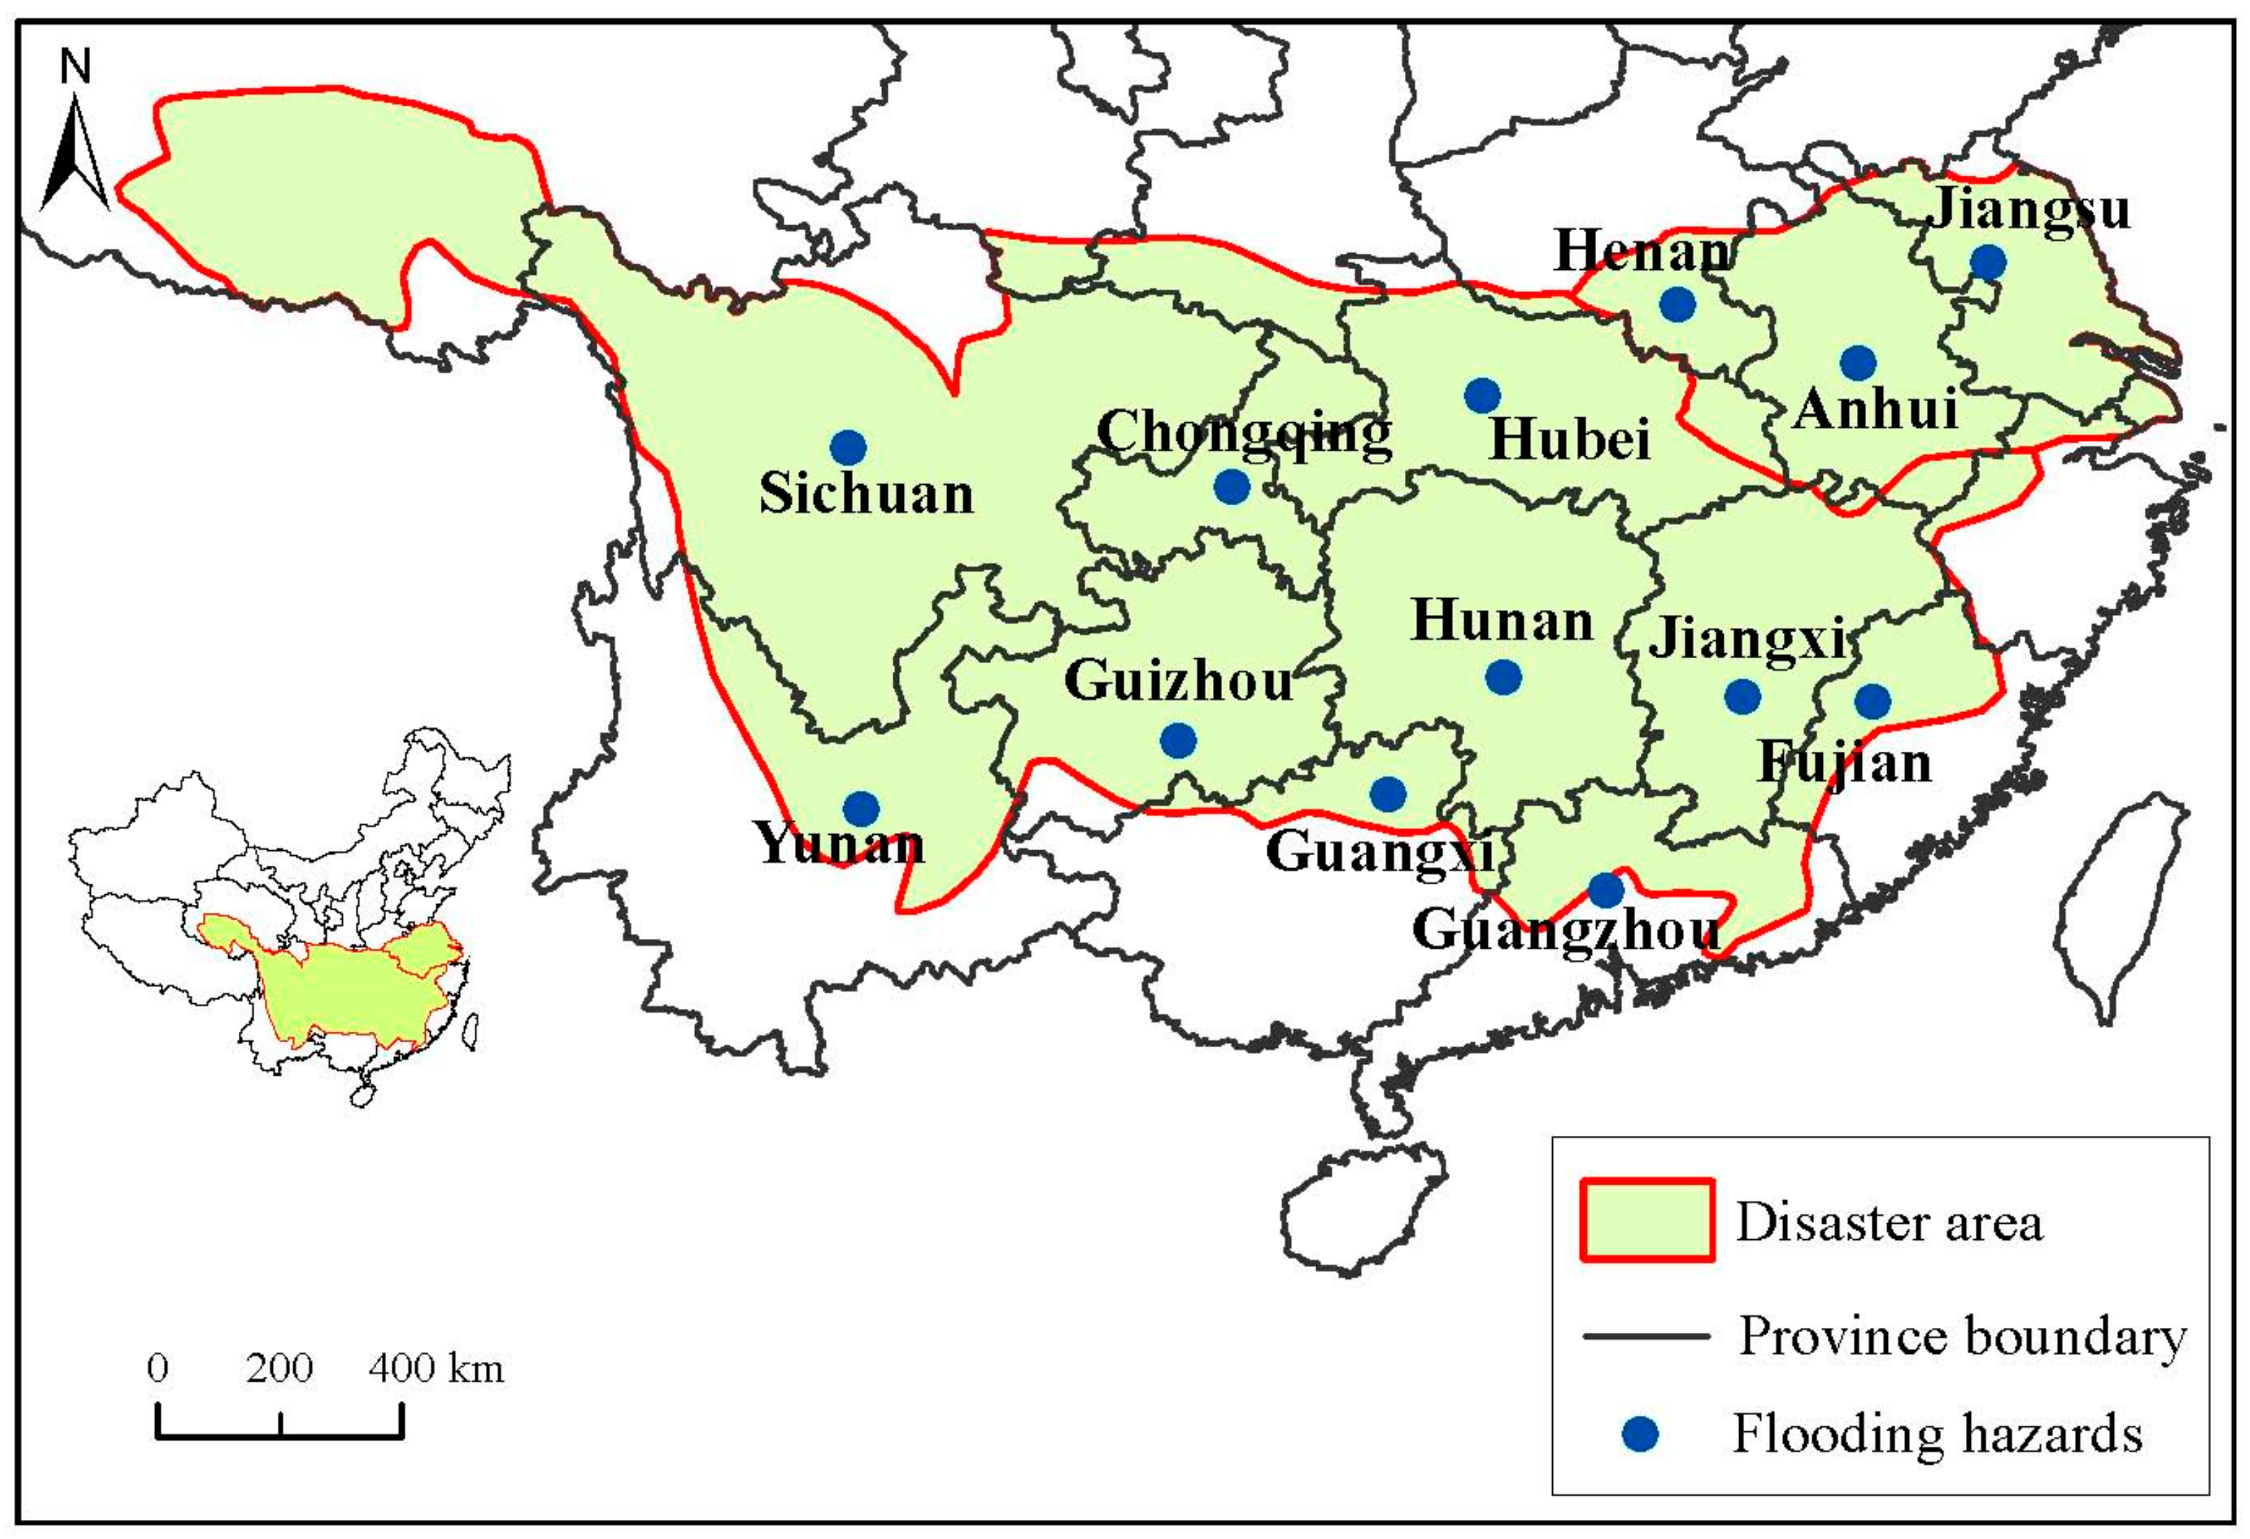
In 2016, the Yangtze River Basin and Huaihe River Basin experienced heavy rainfall from May to July. Moreover, a series of extensive floods caused by heavy rainfall claimed 132 lives across 13 provinces from 30 June to 6 July 2016. Figure 1 shows the location of the areas that experienced flooding hazards. As shown in this figure, the provinces of Jiangsu, Anhui, Henan, Hubei, Jiangxi, Chongqing, Hunan, Sichuan, Guizhou, Yunnan, and Guangxi were severely affected by the flooding (Figure 1). Thousands of flats and apartments were also destroyed or damaged in the distressed areas. The objectives of this paper are to: (1) investigate the reason for these floods; (2) compare the flooding hazard situations that occurred in 1998 and 2016; and (3) propose prospective management countermeasures for the prevention of flooding hazards to promote sustainable development in China.
2. Investigations
2.1. Rainfall Formation
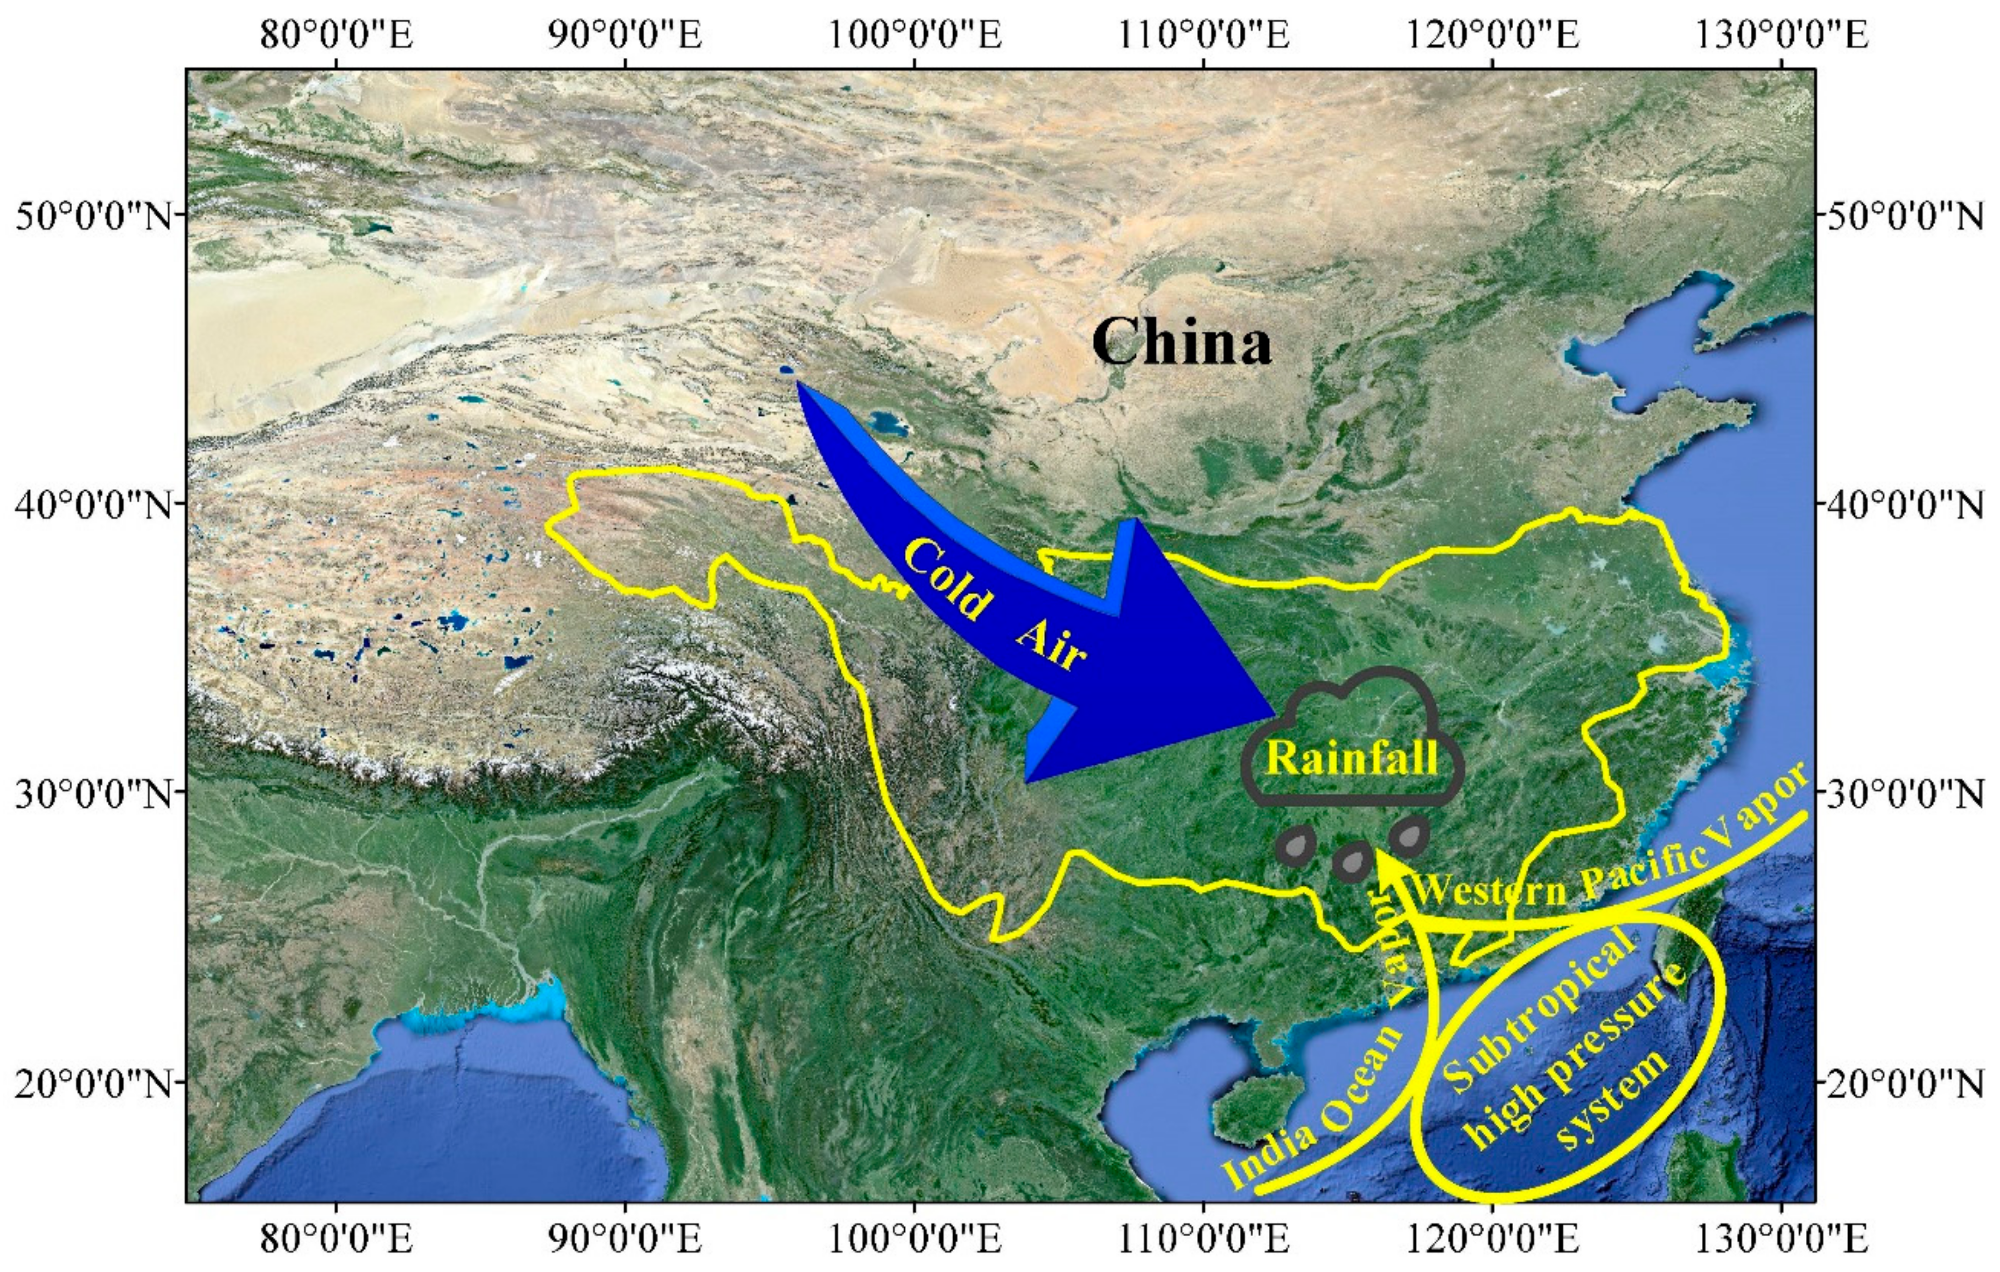
Floods caused by heavy rainstorms occur often during the rainy season. Figure 2 illustrates how a connective airflow forms over and severely affects Southeast China. Vapor from the Western Pacific and Indian Oceans is transported to inland areas of China during the summer monsoon. The Pacific subtropical high pressure over the Western Pacific Ocean controls the advance and retreat of the summer monsoon across Southern China. The position and magnitude of the subtropical high-pressure system directly influences the distribution of the rain belt during the summer [38,39,40]. When colliding with cold air from the arid north, this airflow is lifted, causing abundant rainfall [37,41,42]. When the Western Pacific vapor meets that from the Indian Ocean, a subtropical high-pressure system forms. Then heavy rainfall occurs when the subtropical high-pressure system meets the cold air from Northwestern China or other parts of China [43,44,45]. The larger the subtropical high-pressure system, the more severe the flooding disaster.
2.2. Rainy Season
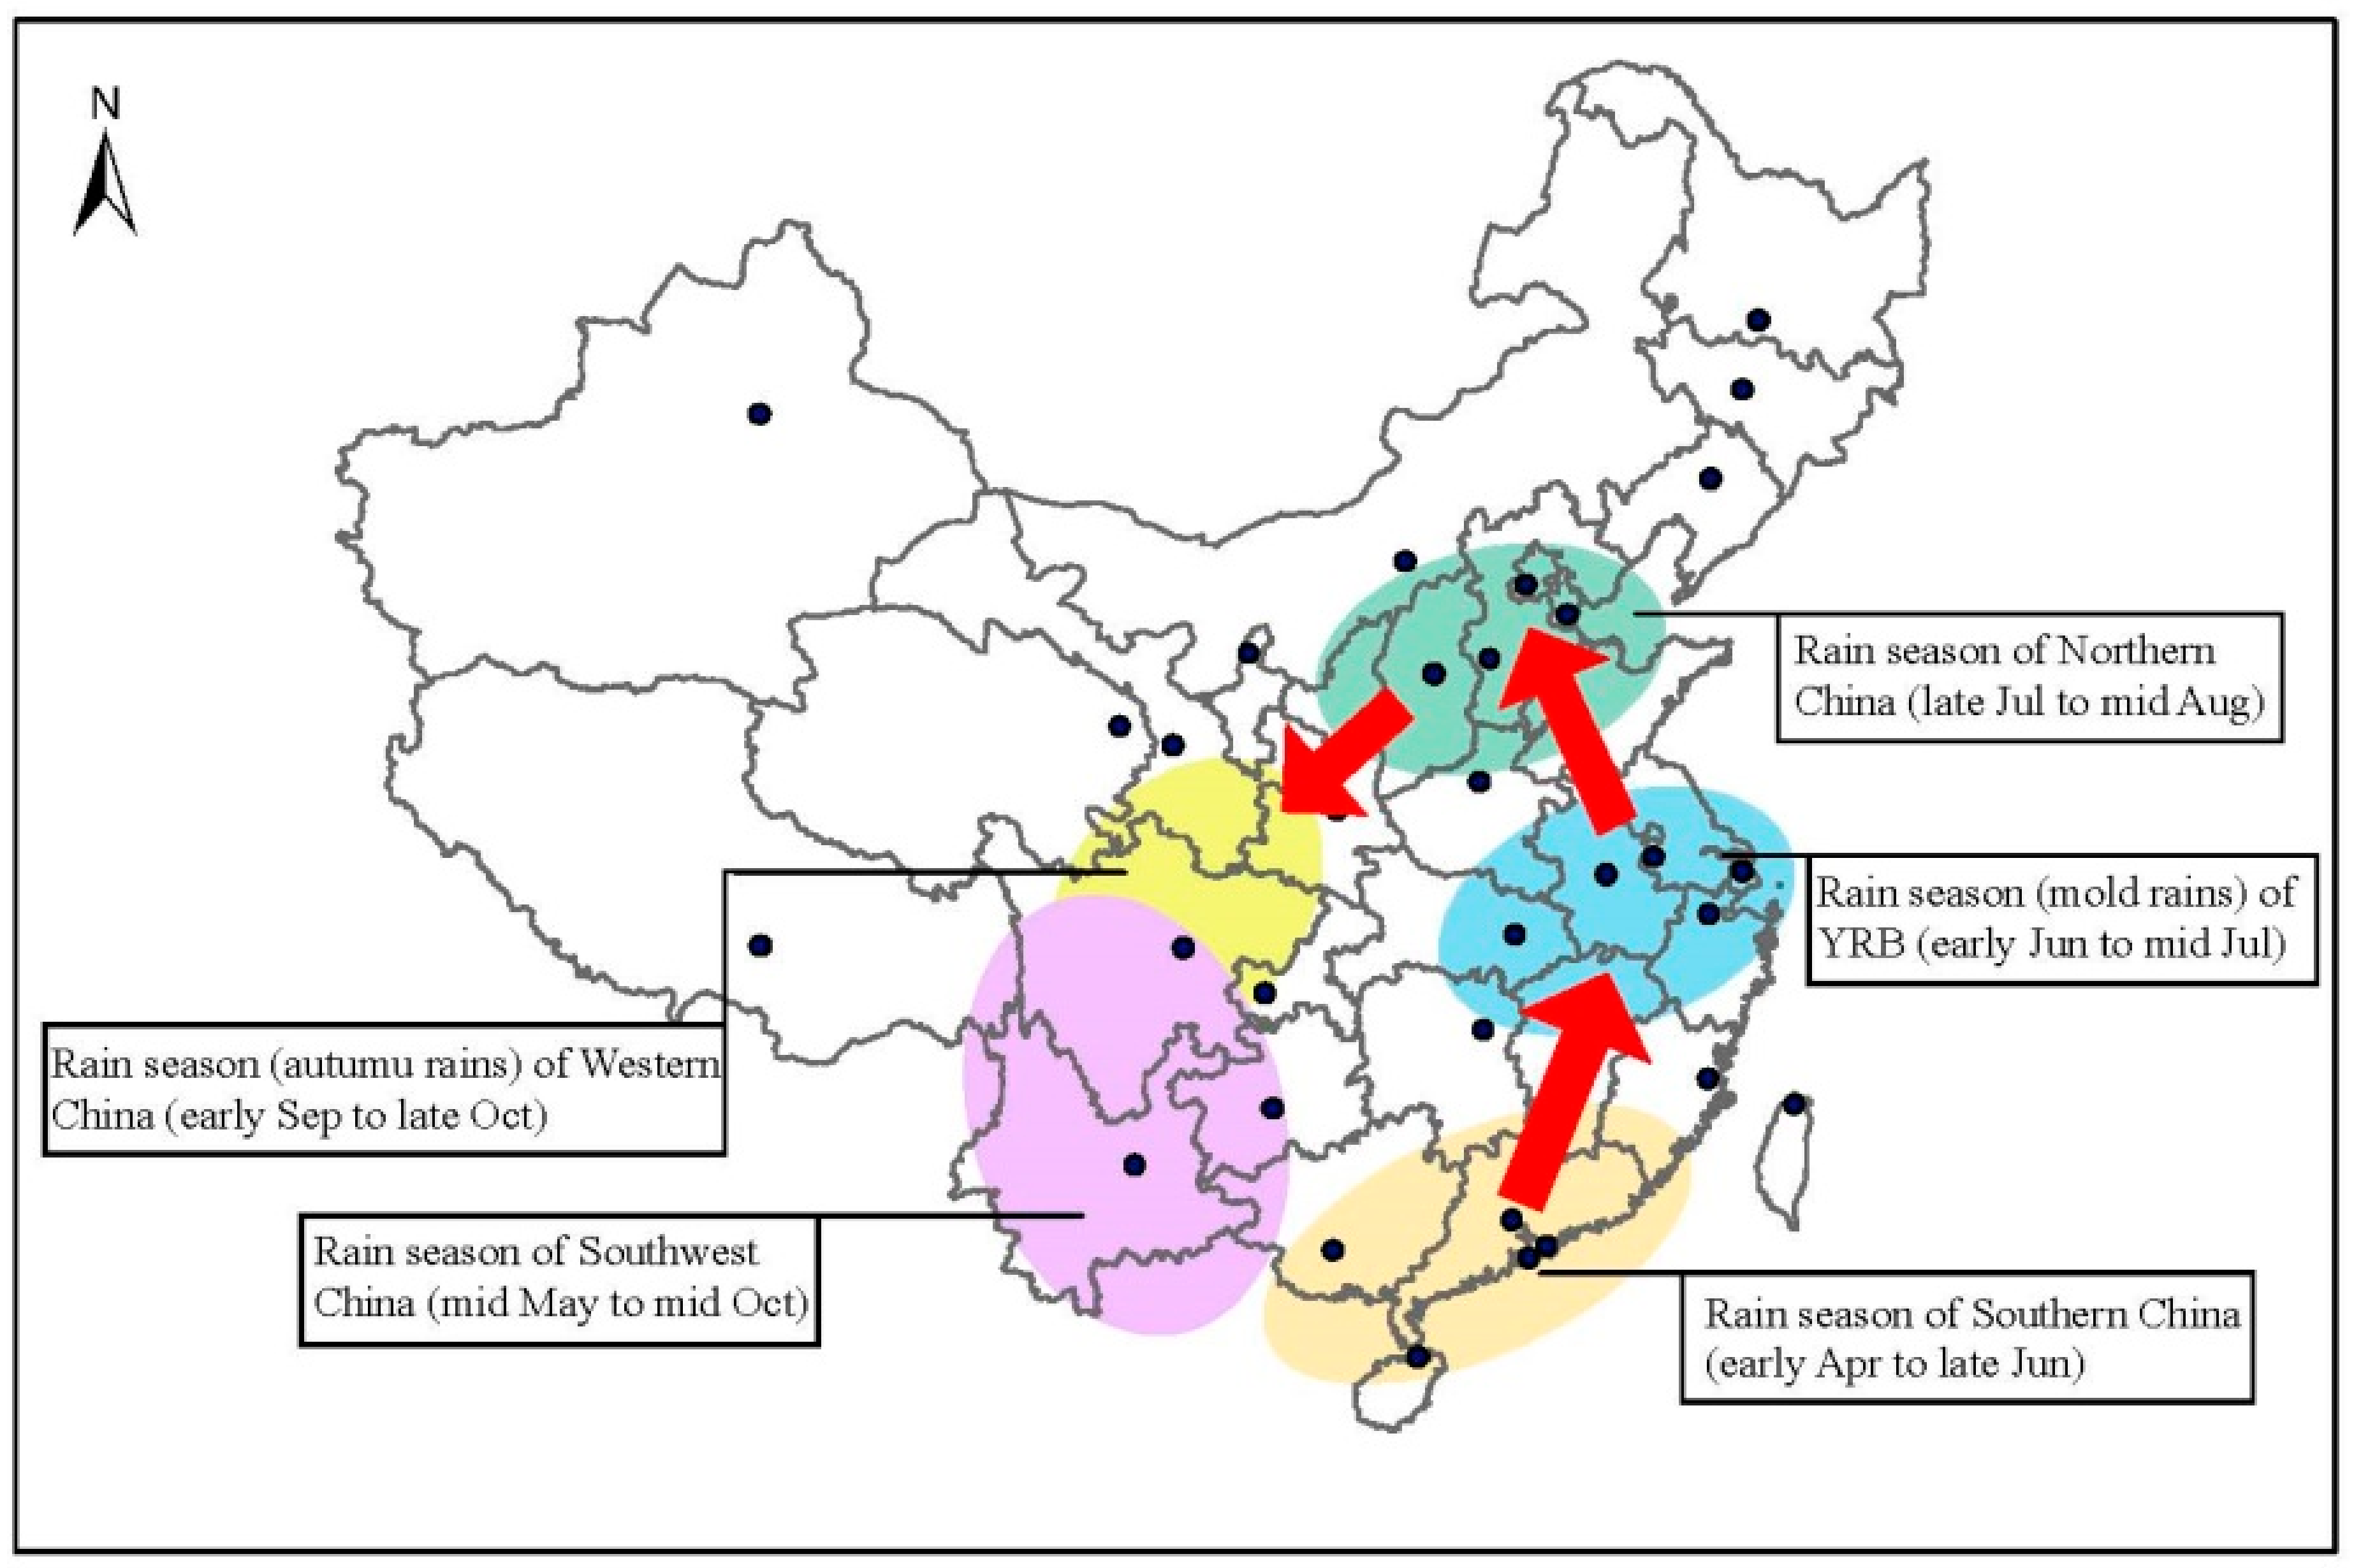
In China, the flood period varies by region. Connective airflow dominates the movement of the rain belt during the flooding period. Subtropical high-pressure systems initially form over the oceans south of China, subsequently encountering cold air from the north, creating a rain belt. Figure 3 shows the movement of the rain belt footprint during a flood period. As shown in Figure 3, during the period from early April to late June, the southern regions of China start being affected by the rain belt. As the subtropical high-pressure system moves north, the impact on the southern regions of China decreases and the Yangtze River Basin and Huaihe River Basin begin to be influenced by the rain belt from early June to mid-July. These large amounts of rainfall are also known as “mold rains”. Continued rainfall over the northern regions of China, due to persistent water vapor transported from ocean to land, occurs during the period from late July to mid-August when the subtropical high-pressure system moves further north. Since the southwest air current causes more water vapor from both the South China Sea and the Indian Ocean to enter the western regions of China, the “Autumn rains” are brought to the western regions of China from early September to late October [46]. The extreme flooding disaster occurrences across the provinces of Jiangsu, Anhui, Henan, Hubei, Jiangxi, Chongqing, Hunan, Sichuan, Guizhou, Yunnan, and Guangxi may have some implications for the development (e.g., moving footprint) of subtropical high-pressure systems [37]. The subtropical high-pressure system causes extensive and continuous heavy rainfall in Southern China, whereas more drought anomalies may occur in Northwestern China.
2.3. Extreme Natural Hazards
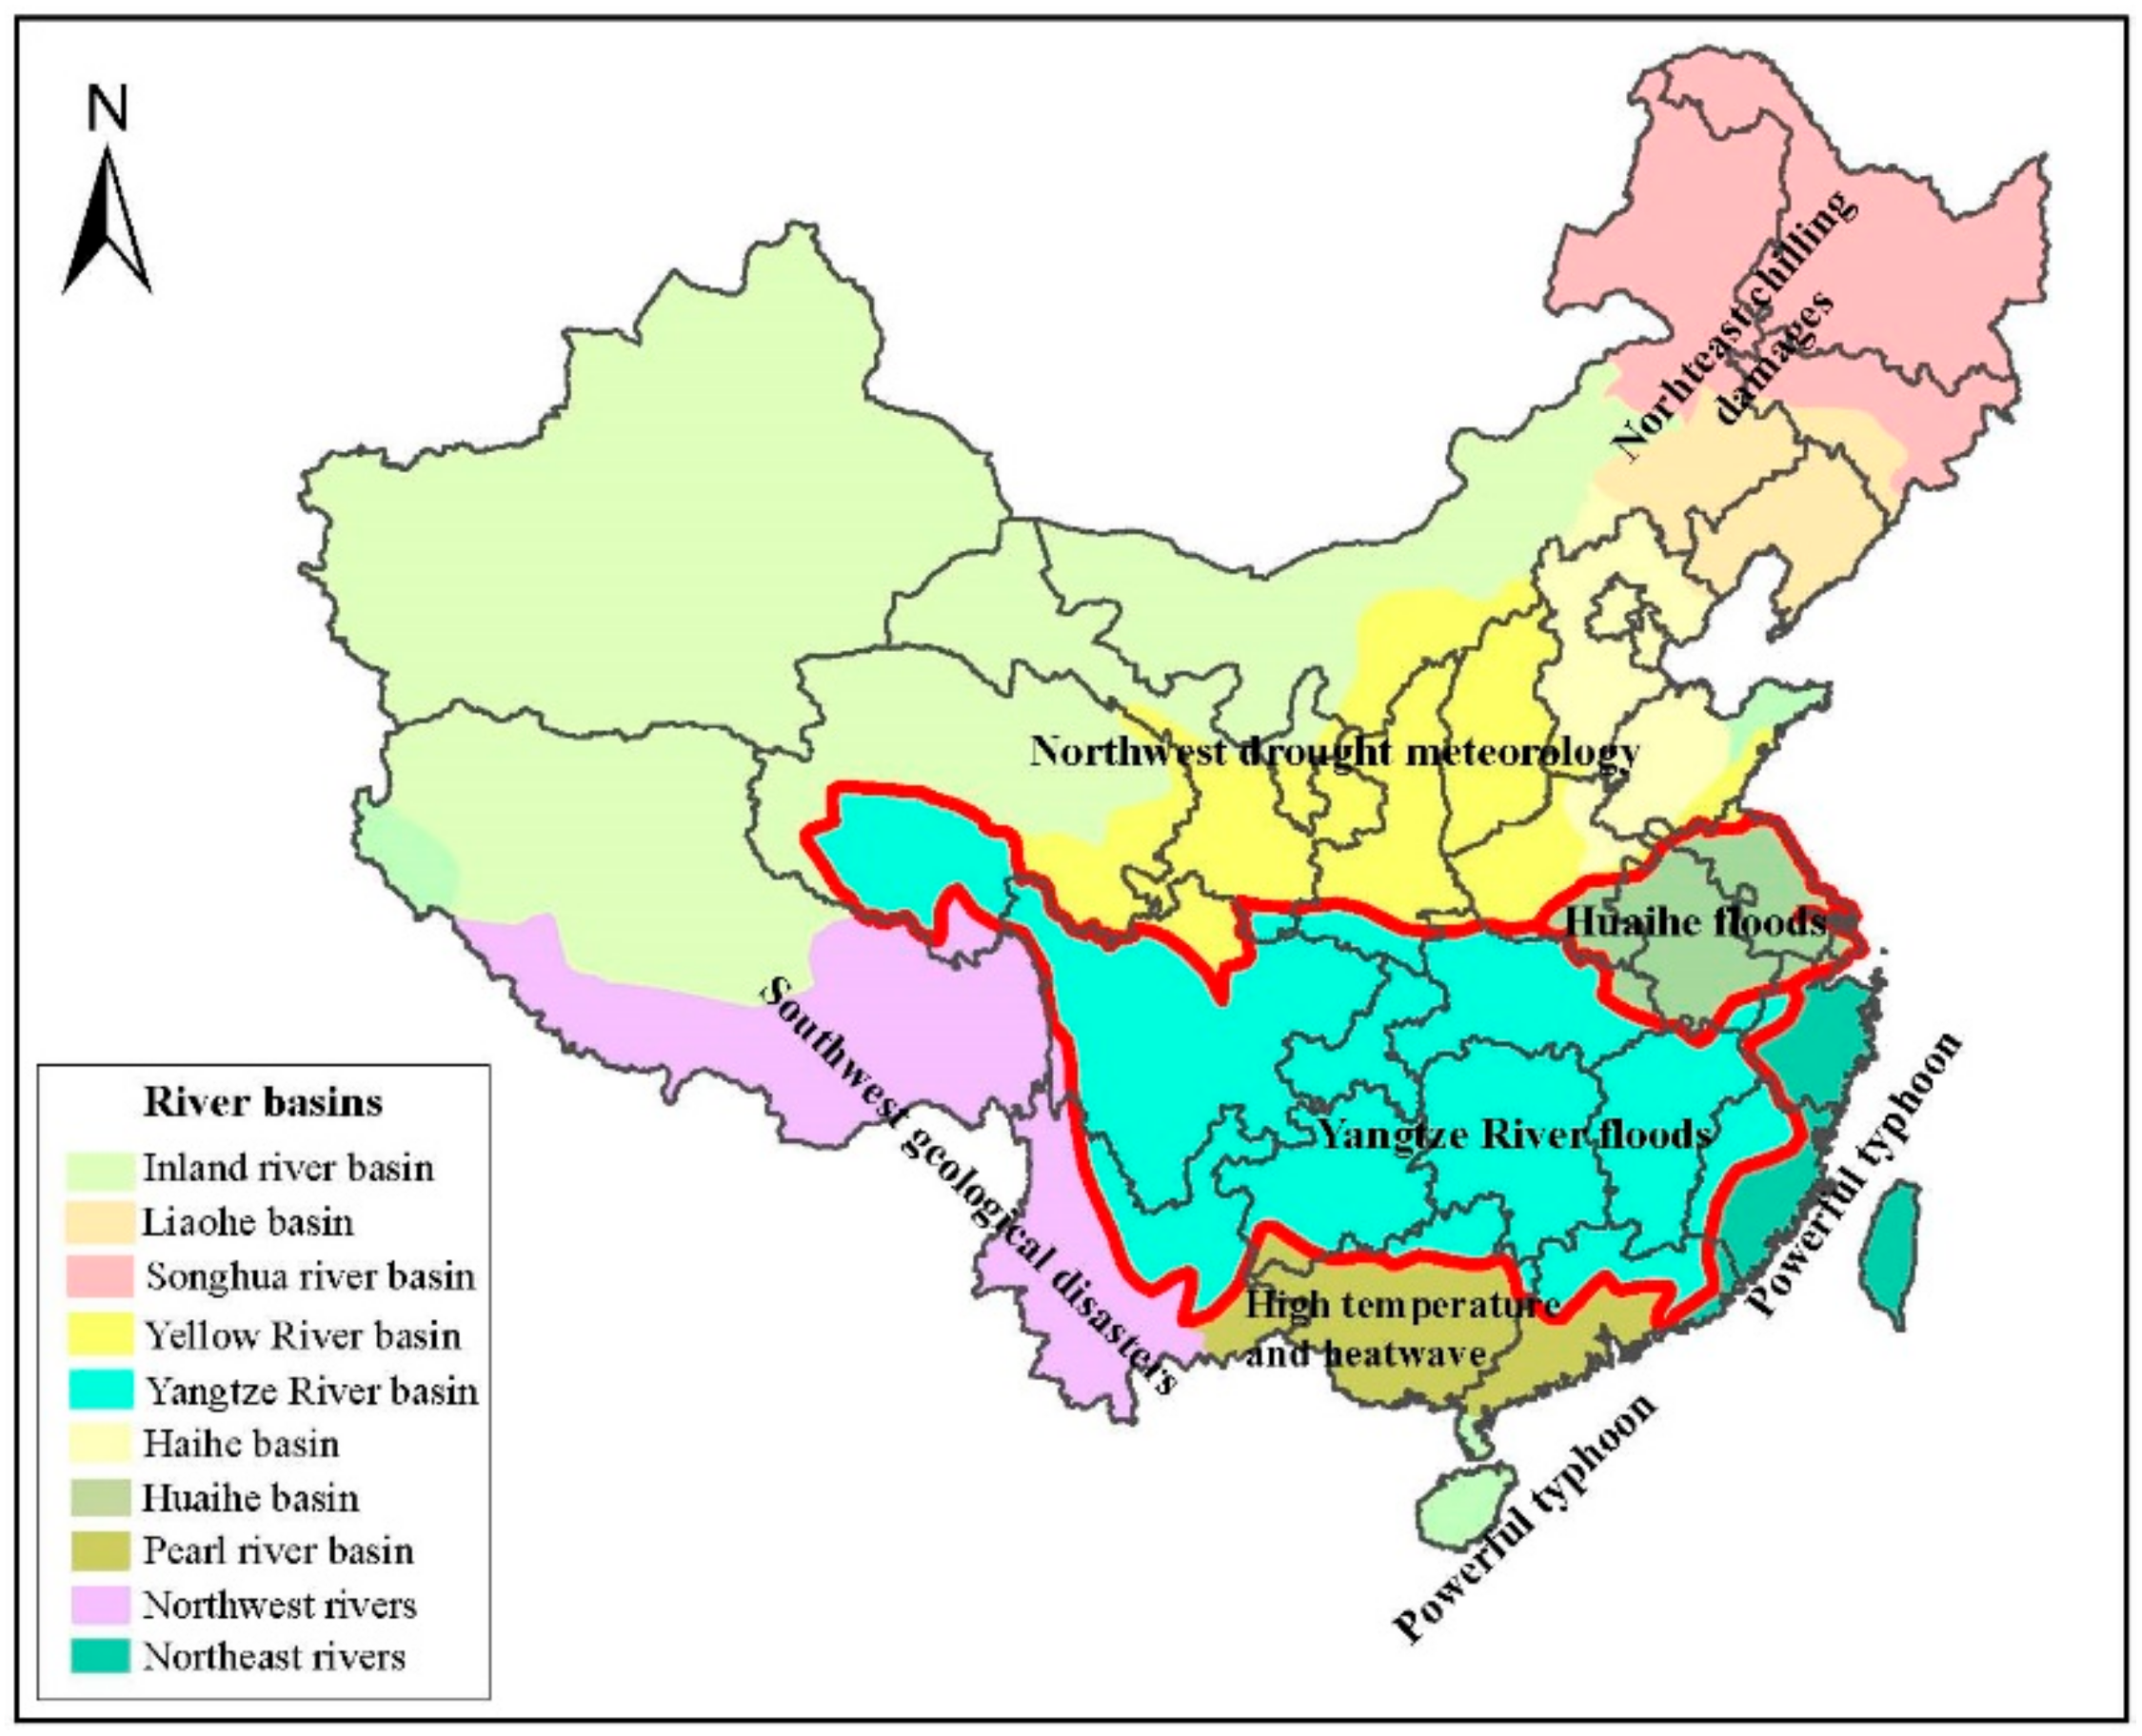
China has 9.6 million square kilometers of land. Different regions have different climatic characteristics, which experience different types of natural hazards. Figure 4 presents the observed record of extreme natural disasters for various river basins in China. As seen in Figure 4, South China was affected by a flood disaster from April until July in 2016, when the Yangtze and Huaihe Rivers flooded. The floods occurred in many cities within the Yangtze River and Huaihe River Basins from late June until the middle of July. On 9 July 2016, the powerful typhoon Nepartak struck Fujian Province, toppling houses and inundating roads. Although the Nepartak had weakened to a tropical storm, it lashed the eastern coast of China. The arrival of Nepartak worsened the existing flood problems in Fujian Province. Figure 4 also reveals drought anomalies in Northwestern China (i.e., in the Songhua River Basin and Liaohe Basin). Since the turn of the century, drought anomalies have become more severe and frequent. In Southwestern China, landslides and debris flow are the most common natural hazards. Climate change due to the impacts of rapid urbanization has increased the severity and frequency of natural hazards, especially during El Nino years. The causes of and damages resulting from the flooding hazards in the Yangtze River Basin and Huaihe River Basin will be discussed in the following sections.
3. Comparison of the 1998 and 2016 Floods
3.1. Flooding Disaster in 1998
In 1998, the Yangtze River Basin experienced a severe flood. The provinces of Hubei, Jiangxi, Hunan, Anhui, Zhejiang, Fujian, Jiangsu, Henan, Guangxi, Guangdong, Sichuan, and Yunnan were severely flooded from the 12 June to 21 August 1998. More than 100 million people and 1000 hectares of crops were affecting, killing more than 1800 people and causing an economic loss of more than 150 billion RMB ($22.3 billion USD). In Hubei Province, the flooding hazard claimed 345 lives and inundated 66 counties.
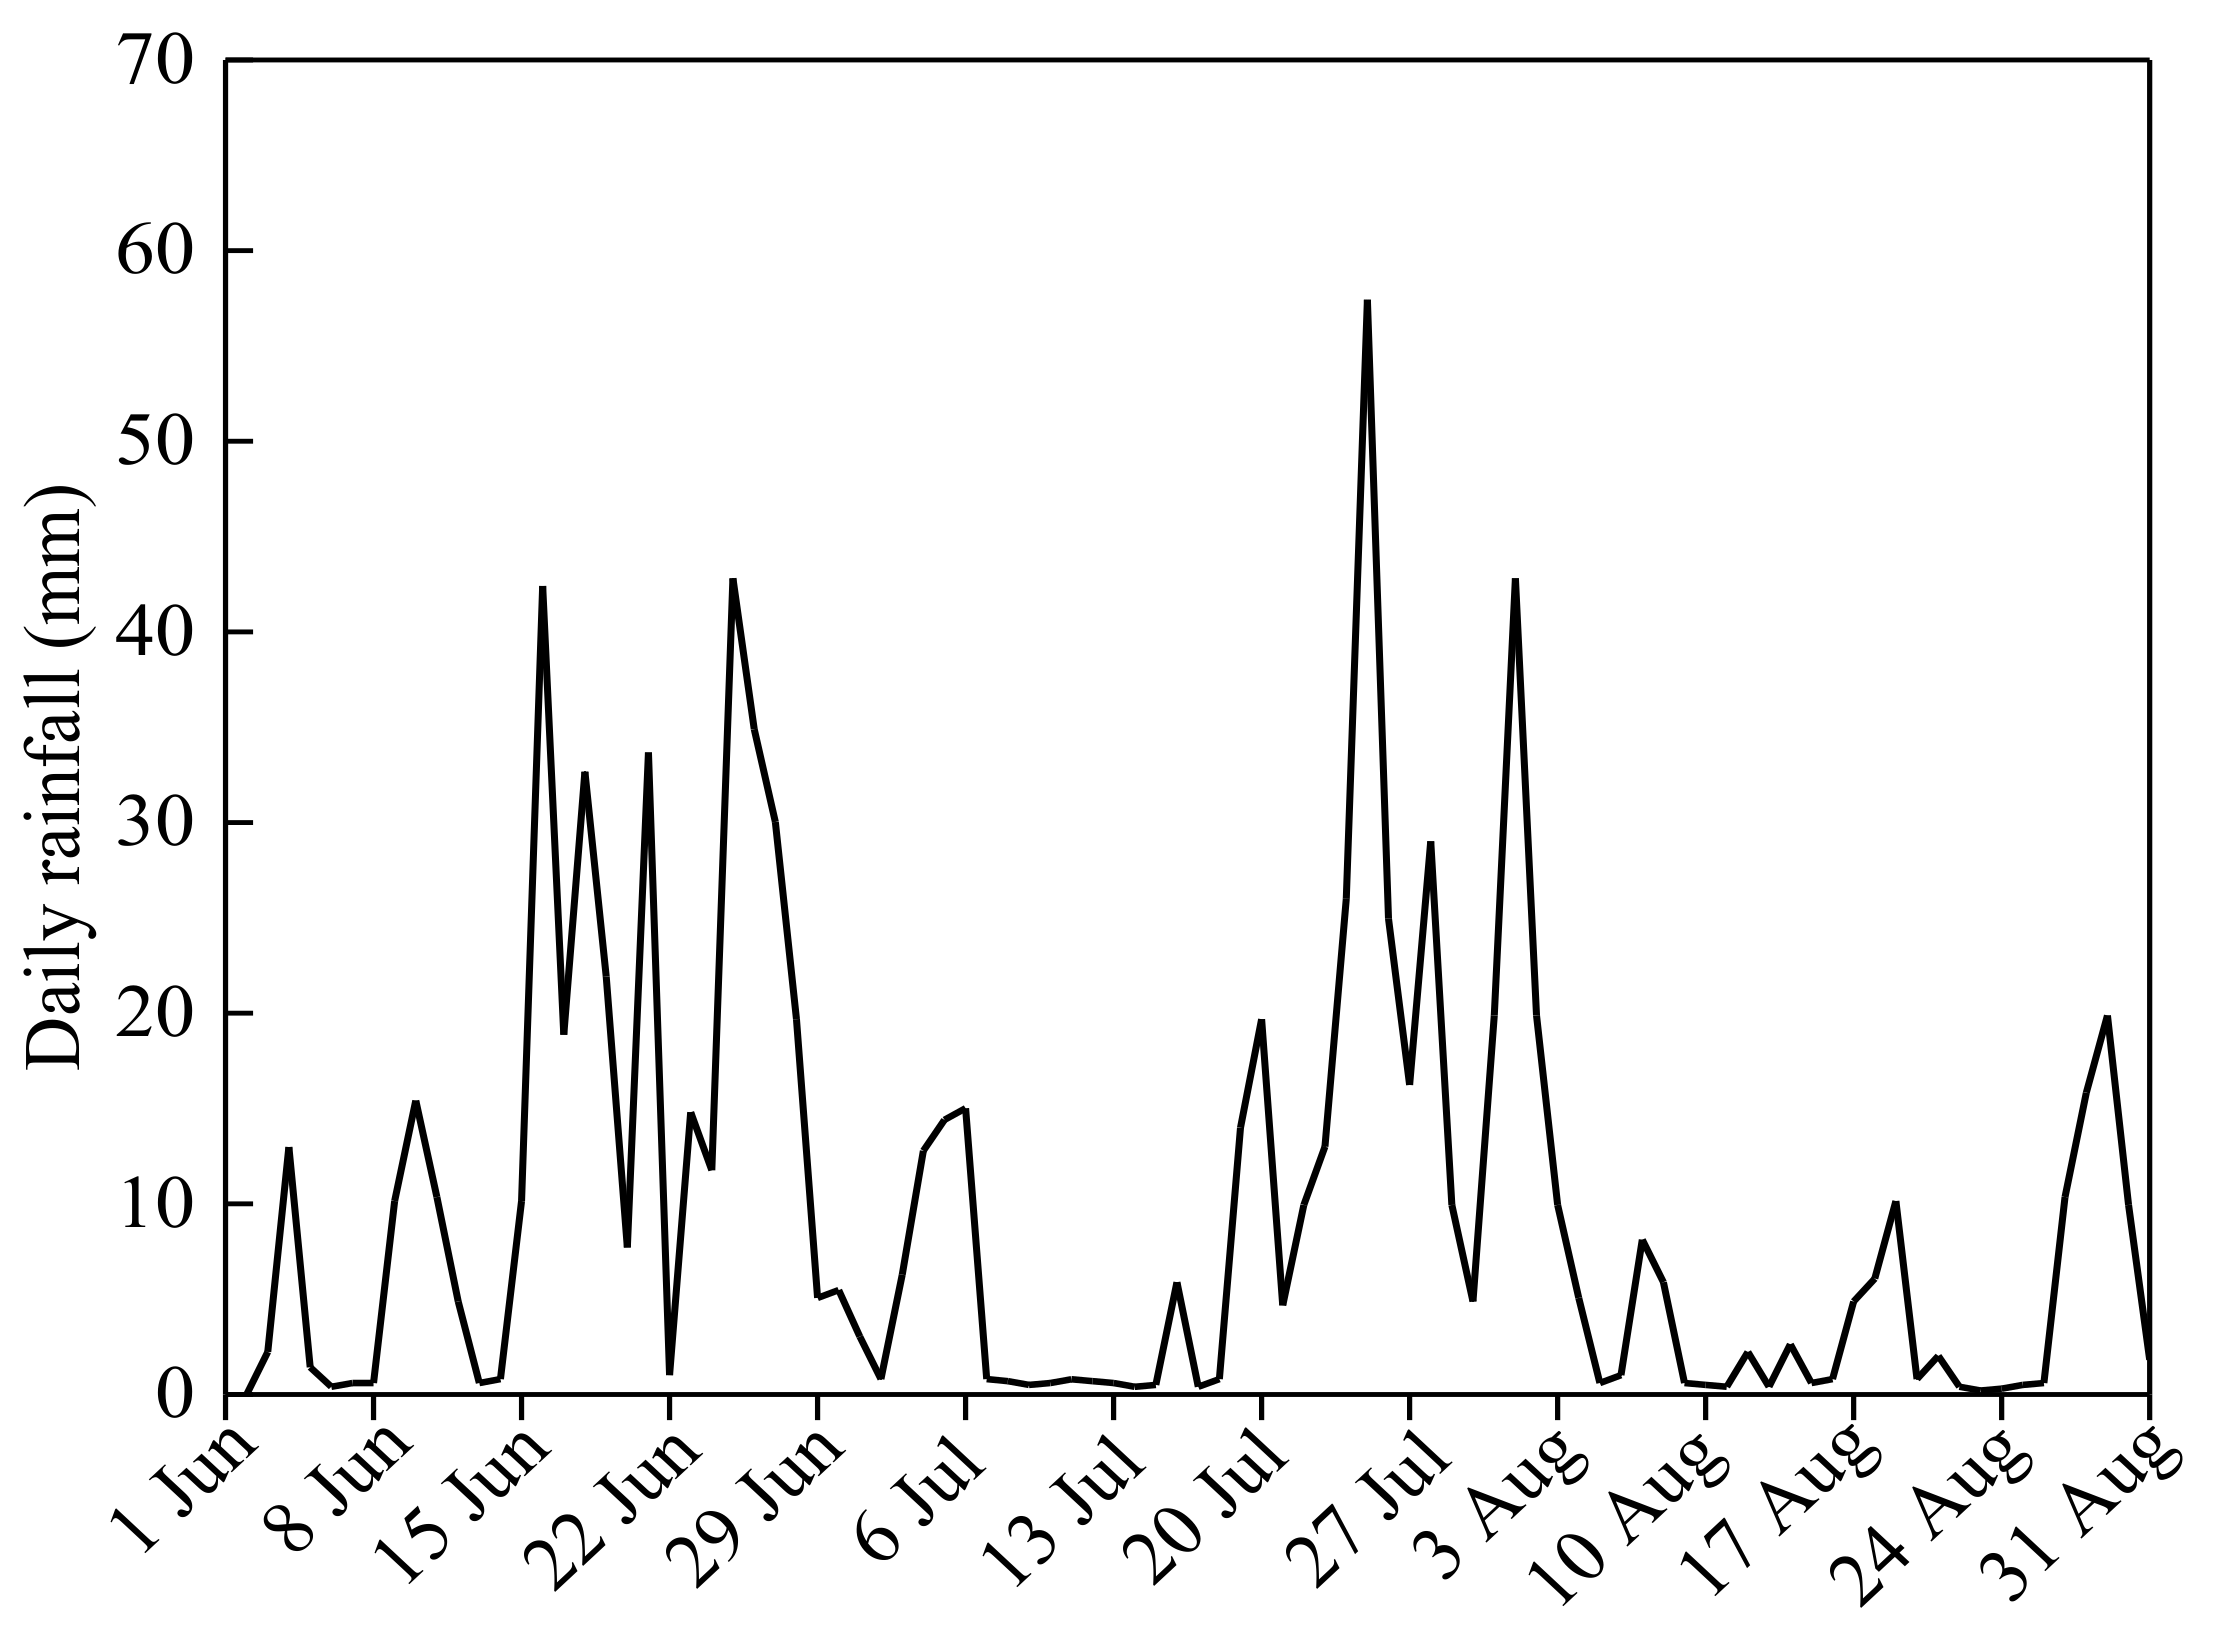
Figure 5 shows the daily rainfall in the Yangtze River Basin as measured by 16 meteorological stations from June to August 1998 [46]. As shown in Figure 5, the Yangtze River Basin received remarkable rainfall amounts from the 12 June to 27 June and from 21 July to 27 July 1998. A total of 74 extreme rain events occurred in the Yangtze River Basin, among which 18 events were classified as extraordinary rainstorms (III). Due to the continuous rainfall, the water in the Yangtze River was at a record level for this time of year.
After the 1998 flooding, many new farmland water conservancy facilities and levees were built along the Yangtze River, including Three Gorges Dam, approved by the National People’s Congress in 1993 [47]. As the largest dam in the world, the Three Gorges Dam project has attracted global attention. The main purpose for constructing the Three Gorges Dam was to adjust the water levels of Yangtze River, preventing flooding disasters [48]. During the 2016 floods, the Three Gorges Dam successfully operated to adjust the water level of the Yangtze River and river water storage [49,50].
3.2. Flooding Disaster in 2016
The southern regions of China experienced serious flooding from 30 June to 6 July 2016. This flooding disaster in Southern China affected 32 million people across 26 provinces, killing 186 people, and leaving 45 people missing since May 2016. Table 1 summarizes the damages caused by this flood [51]. As listed in the table, the death toll in Hubei Province was 42 people within six days. Nanling City, Anhui Province was inundated in floodwaters after just one night. The water depth in the distressed areas was up to two meters, and for some areas with higher surface elevations, the water depth still reached one meters. Local people indicated that floodwaters arrived violently, striking their houses with insufficient time for evacuation. Millions of people were temporarily evacuated from the disaster areas. This flooding hazard was greater compared with that in 1998.
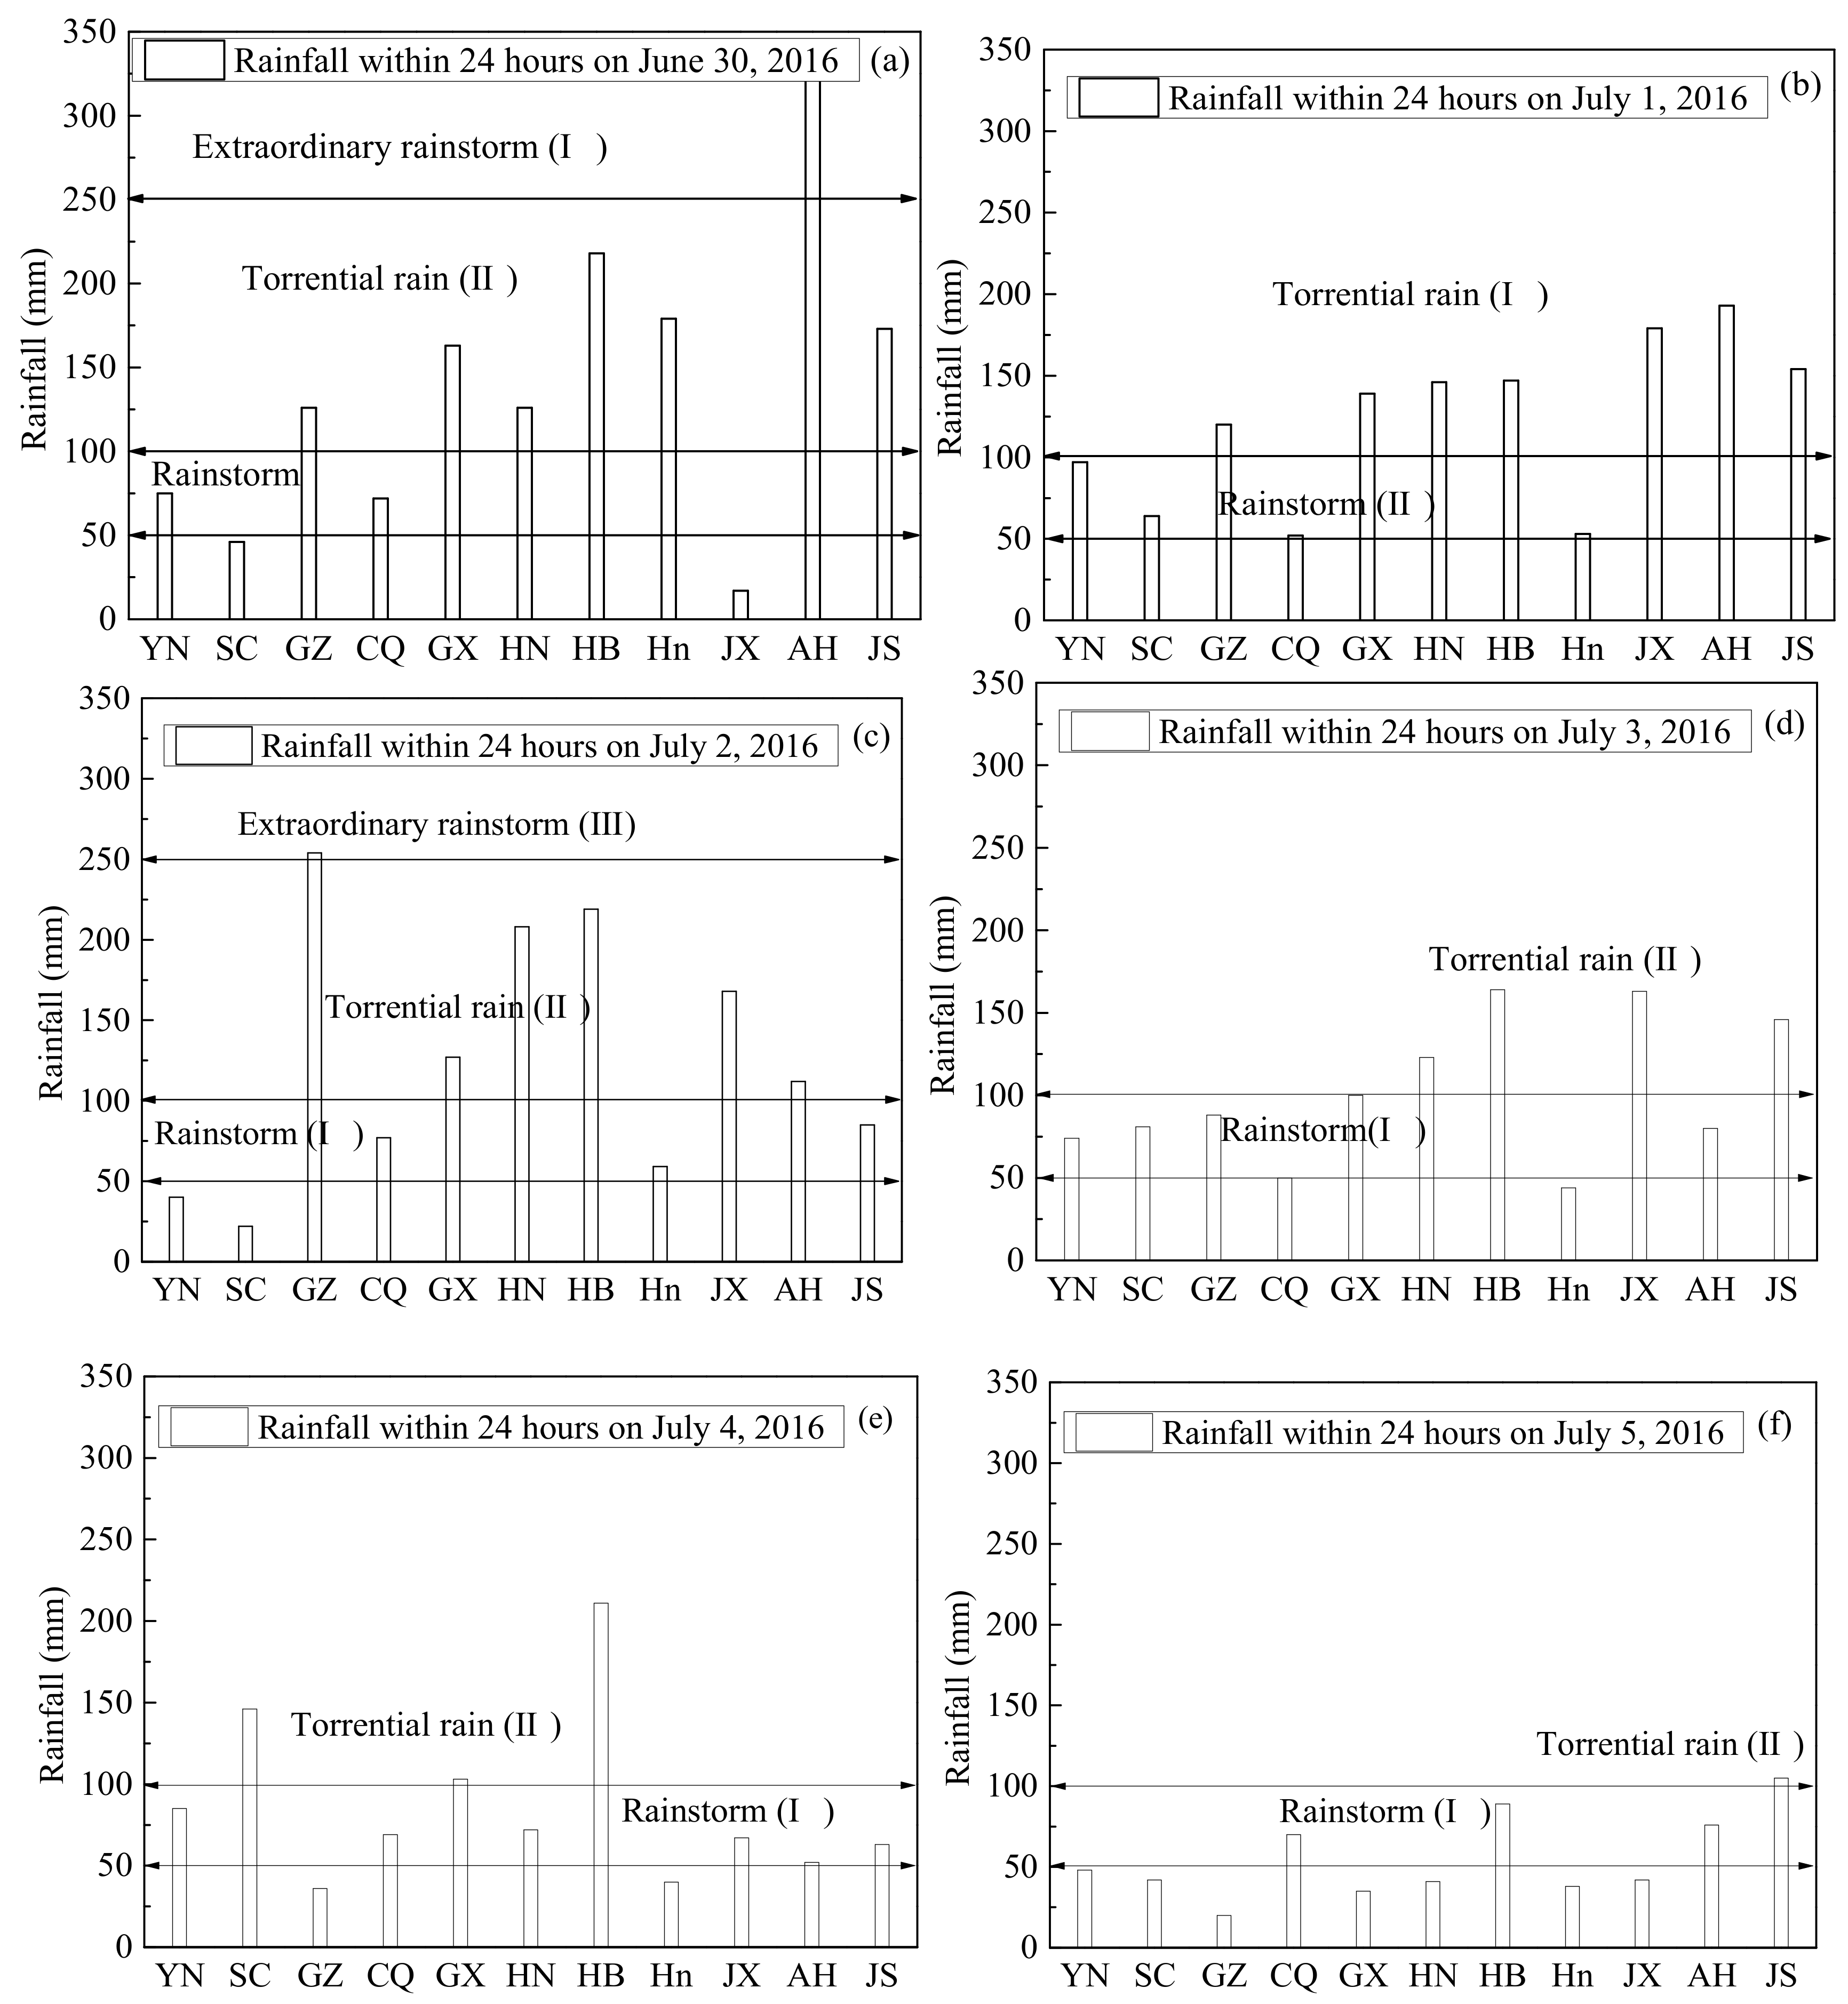
To investigate the effect of rainfall on the severity of the flooding, a rainstorm intensity index R, defined as precipitation within the past 24 h, was introduced into the analysis. Based on the standard rainfall level, rainfall can be classified into three levels: (I) rainstorm, where R varies from 50 mm to 100 mm; (II) torrential rain, where R varies from 100 mm to 250 mm; and (III) extraordinary rainstorm, where R exceeds 250 mm. Figure 6 shows the rainfall for 11 provinces from 30 June to 6 July 2016 [52]. As shown in Figure 6, 11 provinces suffered torrential rain (II) from 30 June to 6 July 2016, among which two provinces suffered extraordinary rainstorms (III). On 30 June the rainfall in Anhui Province was up to 323 mm within 24 h (Figure 6a). On the 2 July, the daily rainfall for Guizhou Province was up to 254 mm and many cities were inundated in rainwater (Figure 6c).
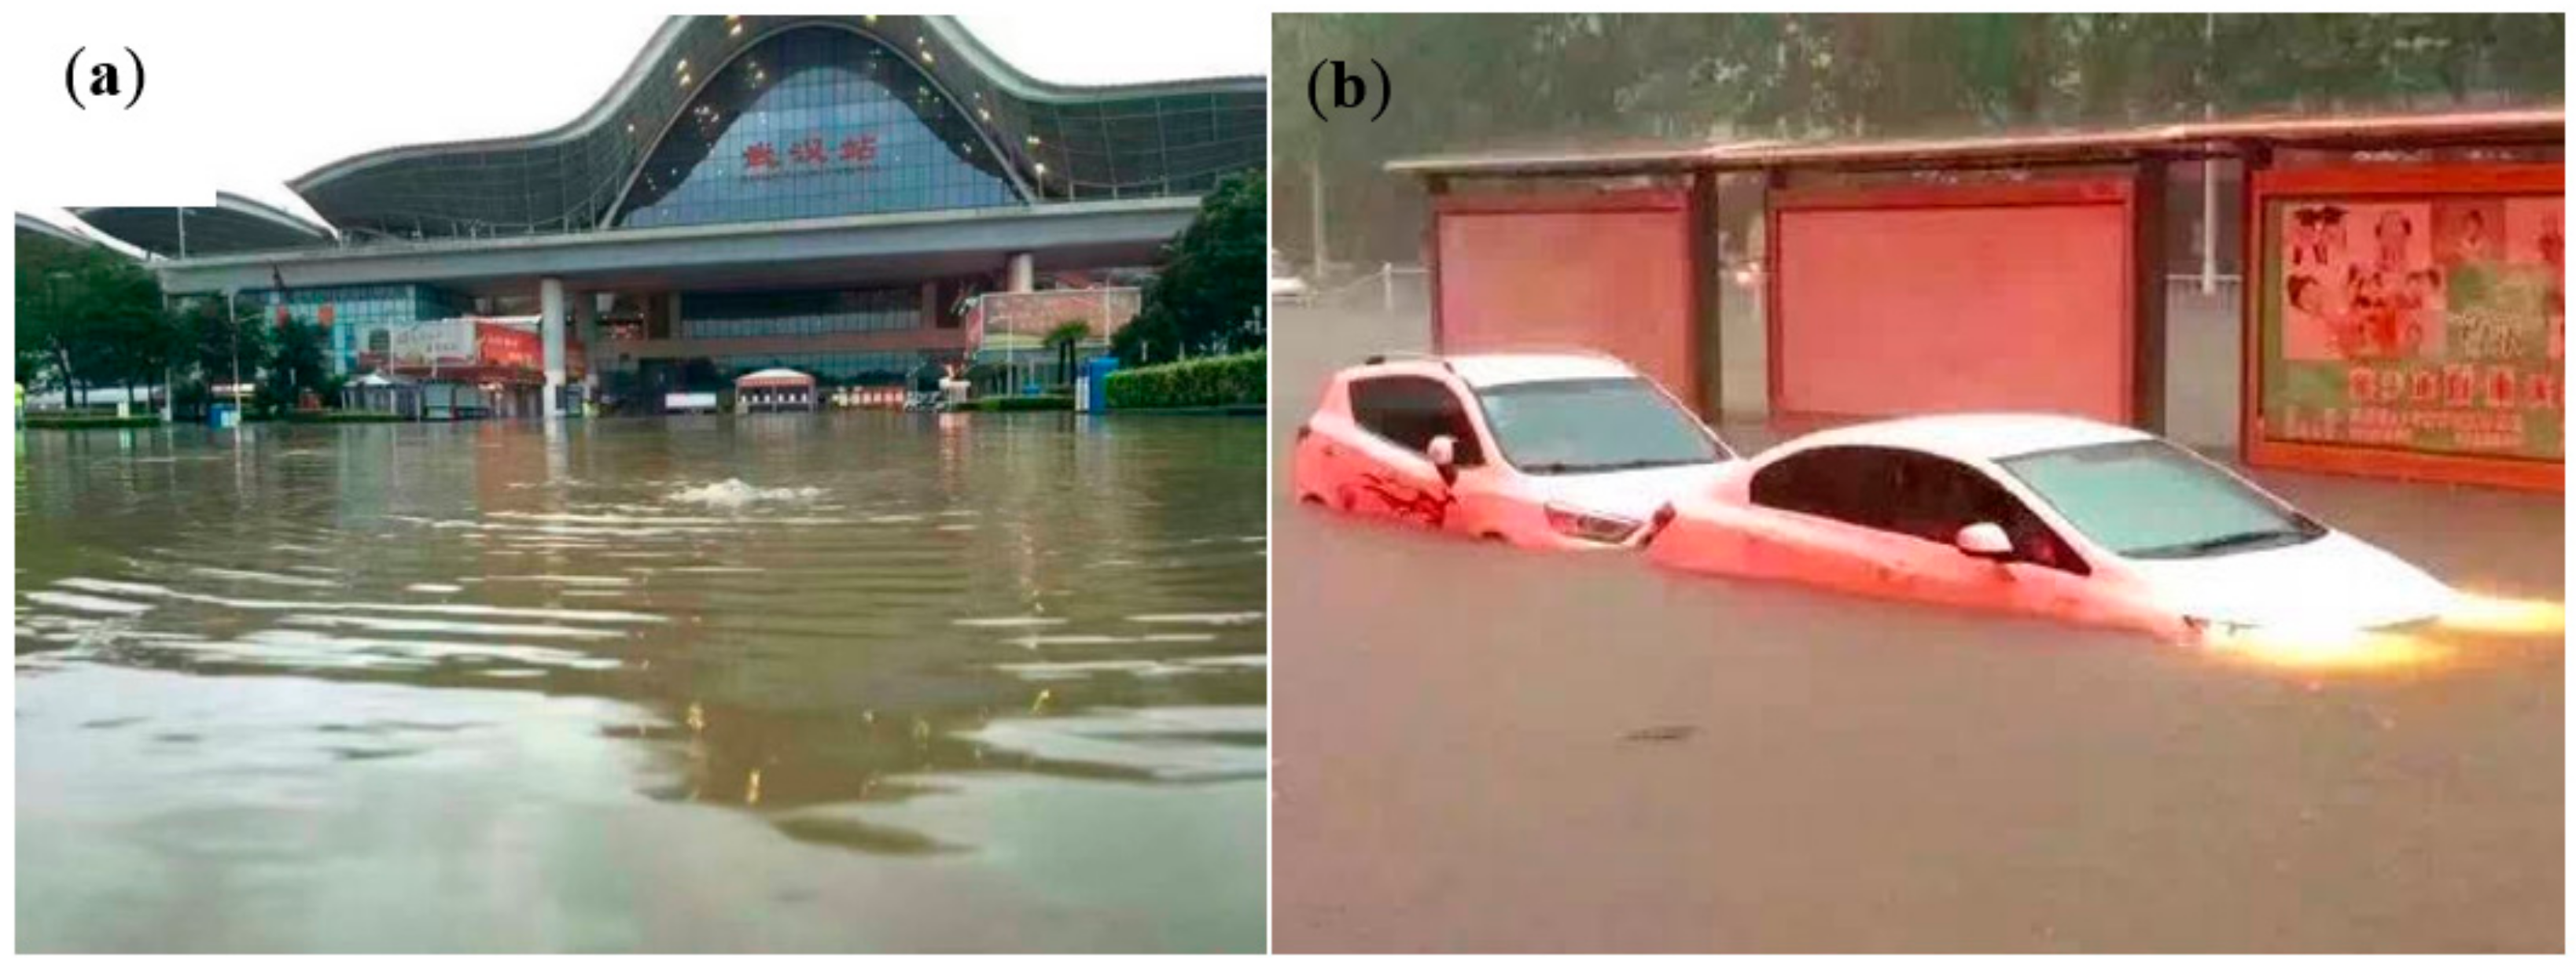
Figure 7 shows Wuhan station and Xinxiang City submerged by rainwater. Wuhan City in Hubei Province located in the Yangtze River Basin suffered from this historical flooding disaster. Road networks and metro stations were immersed in rainwater, and trains had to be cancelled (Figure 7a). Buildings and vehicles were submerged (Figure 7b). Xinxiang City, Henan Province was submerged in just one night, causing the suspension of city transport links and water and power supplies. This flooding disaster led to extensive damage and economic losses in China.
3.3. Comparison between the 1998 and 2016 Floods
The flood in 1998 in the Yangtze River Basin lasted longer than in 2016. Despite the shorter rainfall duration in 1998, it was more intensive in 2016, resulting in a larger affected area than in 1998. During the flooding disasters, many cities, including Wuhan, Anhui, and Nanjing, were inundated in rainwater. Table 2 compares the 1998 and 2016 flood damage [46]. As shown in Table 2, the scale of the flooding in 1998, measured by affected people, death toll, collapsed houses, and damaged crops, was much larger than in 2016. However, the total economic loss in 2016 was much larger than in 1998. This is due to the rapid economic development during those 18 years in China. Moreover, both flooding hazards in 1998 and 2016 similarly occurred after El Nino events. Thus, preventing flooding hazards and mitigating damages have become one of the most urgent urban environmental management affairs for authorities in China.
4. Analysis and Discussion
4.1. Relationship between Floods and Extreme Weather
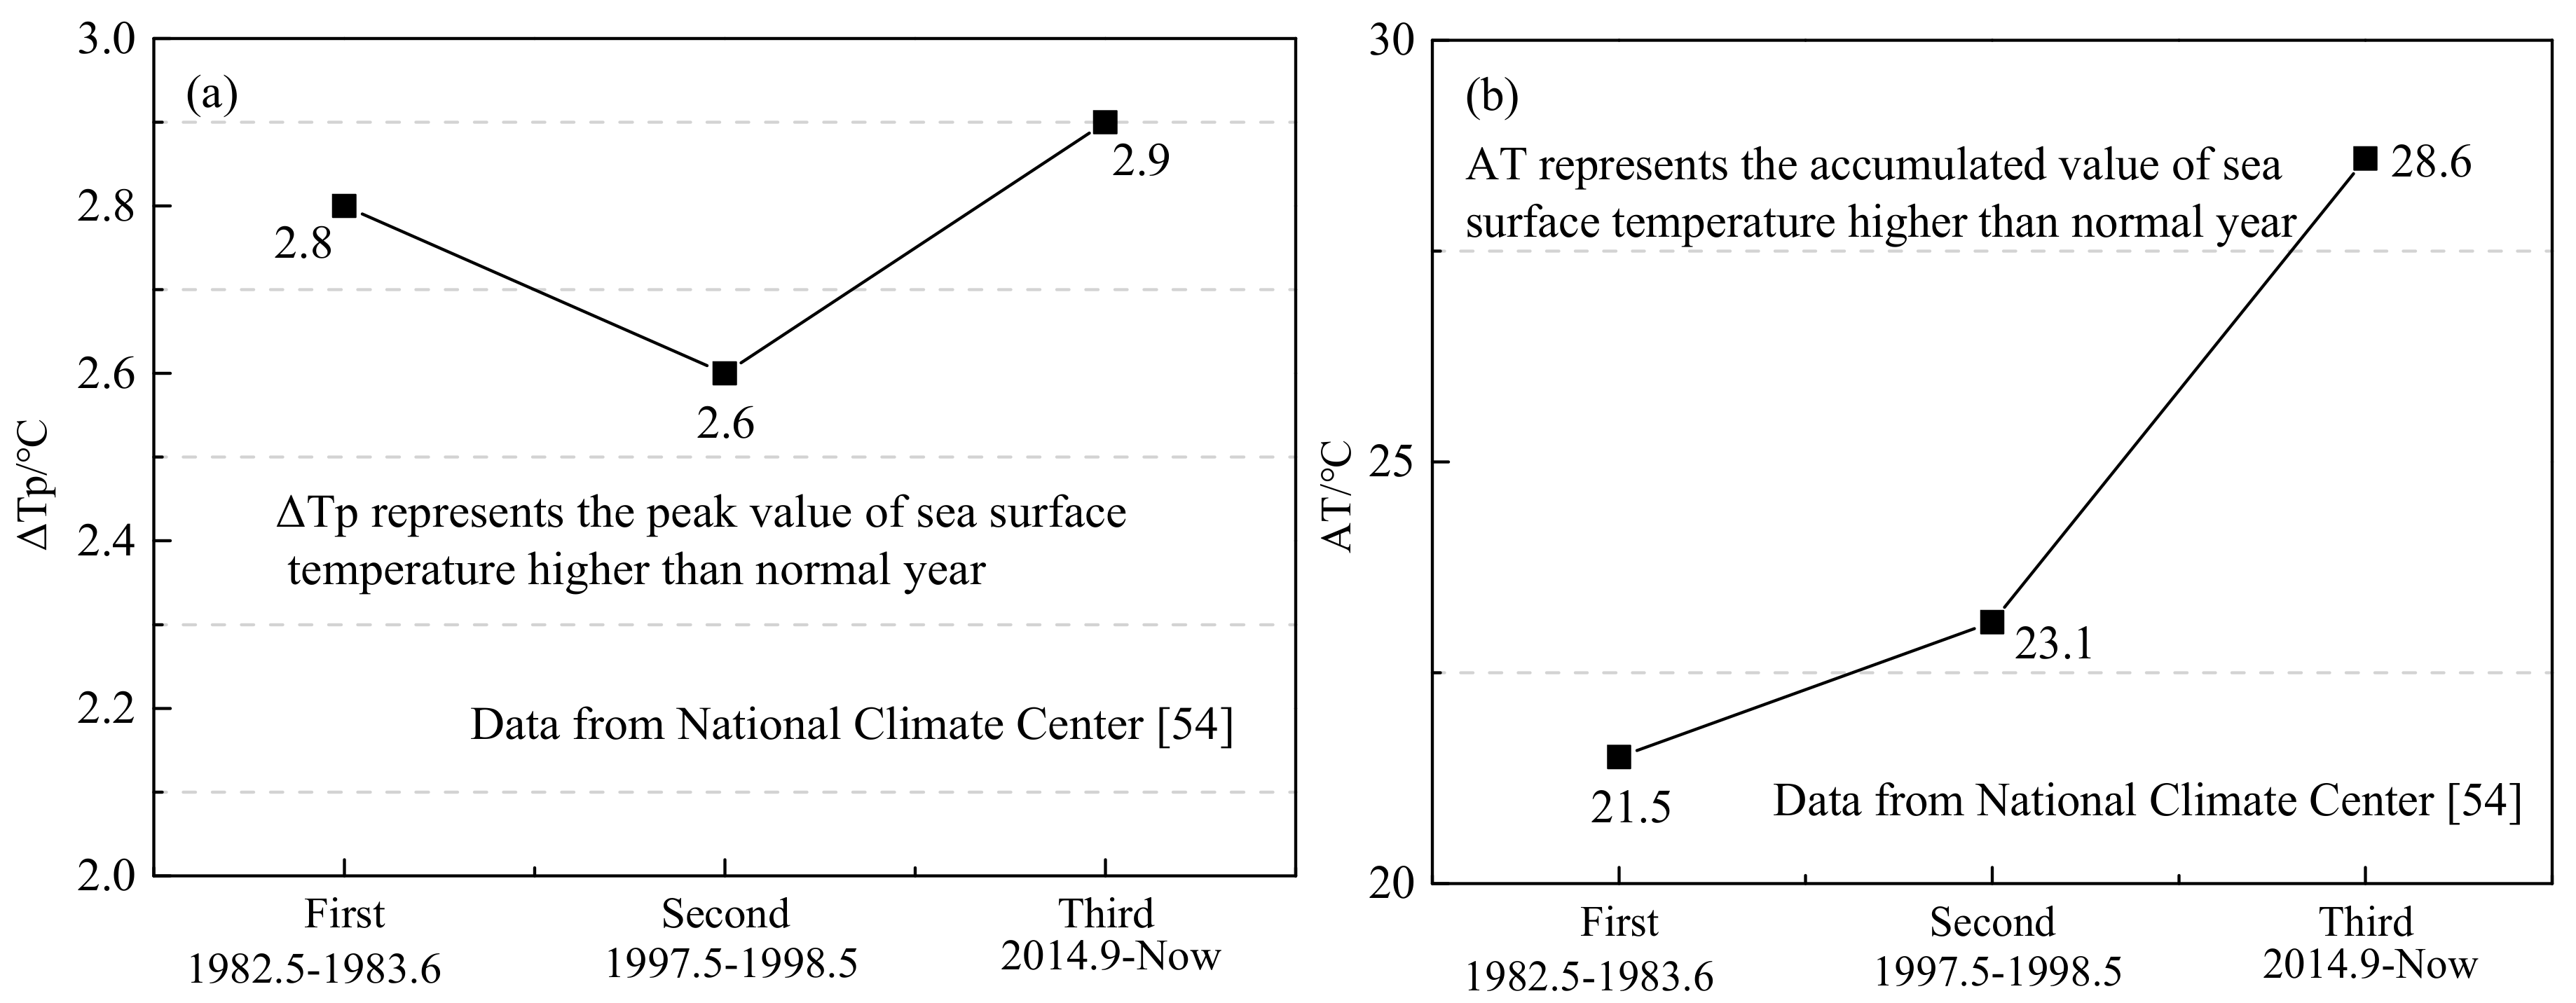
Extreme weather caused by climate change always accompanies El Nino events. An El Nino event is defined as any time the five-month average difference from normal temperature was equal to or greater than 0.4 °C [35,36,37]. Since 1951, a total of 14 El Nino events have occurred globally, of which three events, 1982–1983, 1997–1998, and 2015–2016, were identified as Top El Nino events (TEN). Figure 8 plots the sea surface temperature for these three TENs [54]. The first TEN occurred from May 1982 to June 1983. The second TEN occurred from May 1997 to May 1998. The third TEN started in September 2014. The third El Nino event had reached its peak in November 2015. Due to the effects of the third TEN, 2015 was the warmest year in the 136-year record period. As shown in Figure 8a, the peak value of the sea surface temperature in the third TEN was the highest among the three TENs [54]. Figure 8b shows that the third TEN had the largest accumulated sea surface temperature (AT) value. Figure 3 also shows that the 1998 flood fell within the second El Nino period, and the 2016 flood was within the third El Nino period. Therefore, we speculate that flood disasters were often followed by El Nino events. Moreover, the third TEN was characterized by increased sea temperature for long periods of time. EI Nino can cause more severe rainfall in the Yangtze River and Huaihe River Basins, increasing the flooding potential.
4.2. Role of the Three Gorges Dam in the 2016 Flood
The Three Gorges Dam is a multi-functional water control system over 2300 m long and 190 m tall, located in upstream Yangtze River in Yichang city, Hubei Province. The Three Gorges Dam was built to adjust the peak flood level of the Yangtze River and allow people to continue living in the middle and lower reaches of the Yangtze River during flooding periods. For instance, the Three Gorges Dam stores floodwater in summer and releases floodwater during the dry season to ease droughts, particularly in the rice-growing areas of the lower reaches of the river. Table 3 shows the inflow and outflow rates of the Three Gorges Dam from 30 June to 2 July 2016 [55]. During the first flooding peak on 1 July 2016, the inflow and outflow rates were 50,000 m3/s and 31,000 m3/s, respectively. This implies that the Three Gorges Dam reduced the flow rate by 38%, thus preventing the lower reaches (i.e., Hubei, Hunan, Jiangsu, and Anhui) from flooding. Since the heavy rainfall from 30 June to 6 July 2016 was mainly concentrated in the lower reaches of the Yangtze River, the flooding was induced by the intensive rainfall events more than the upper reaches. It was reported by the Yangtze River Flood Control and Drought Relief Headquarters that, due to the combined effects of El Nino and climate change, precipitation along the Yangtze River increased by 10–20%, and in some areas that figure reached 80%. More drought anomalies could occur in Northwestern China as a result. If the Three Gorges Dam does not function as usual during flooding periods, the lower reaches may experience more serious flooding hazards, and the flooding hazards could also affect the upper reaches as the rain belt moves westward.
4.3. Degradation of Rivers and Lakes
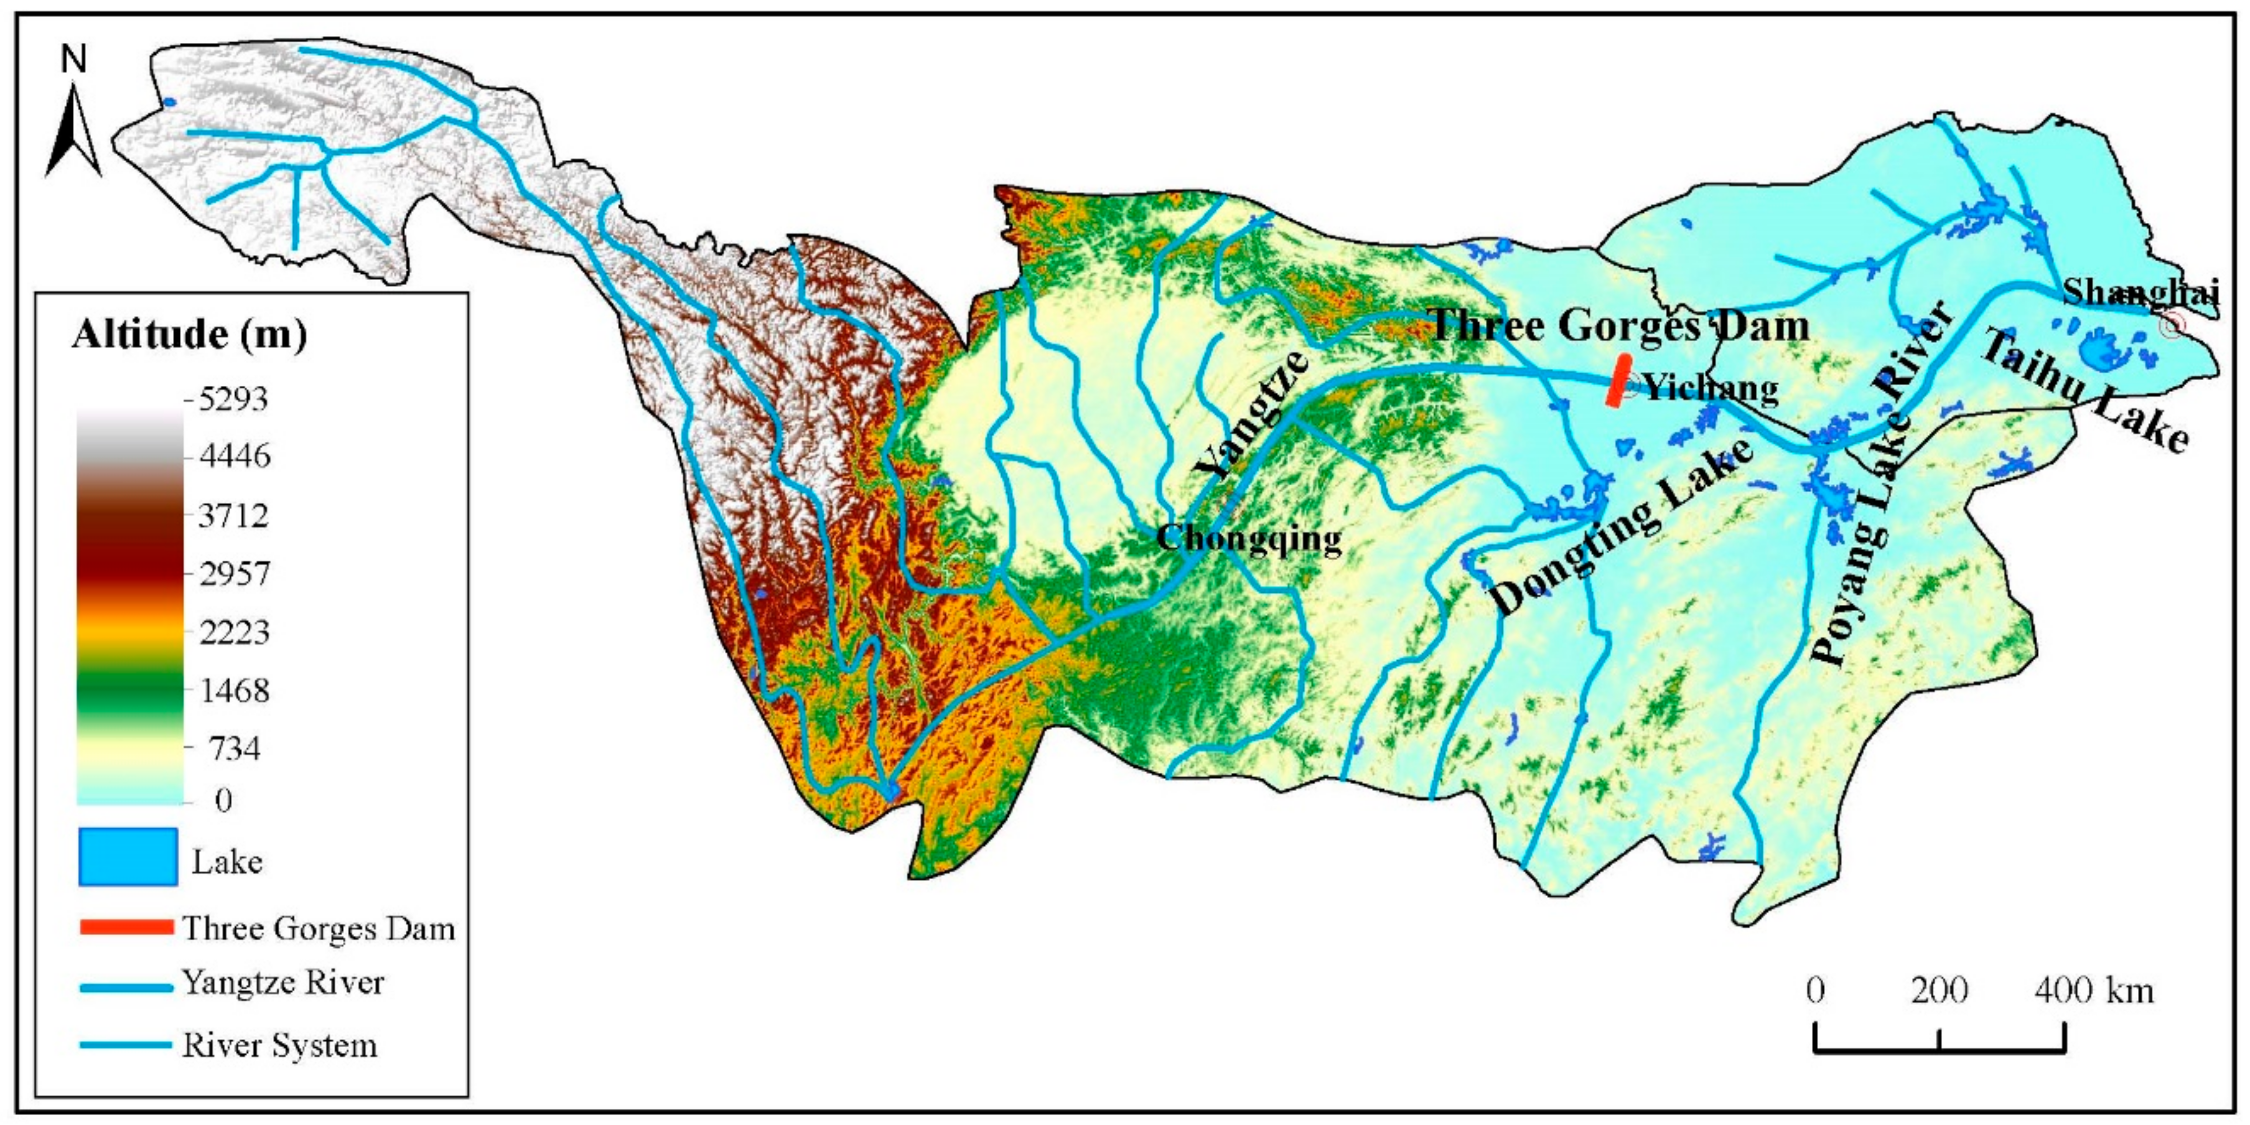
The cause of flooding disasters is complex due to the interactions between urbanization, climate change, human engineering activities, and catchment conditions. Flooding hazards are initiated by intensive rainfall events. The degradation of rivers and lakes play an important role in the development of flooding hazards. Figure 9 shows the topography of the Yangtze River Basin and Huaihe River Basin. As shown in Figure 9, large numbers of rivers and lakes in the Yangtze River Basin and Huaihe River Basin have been reclaimed. Wuhan City in Hubei province, which lies in the Yangtze River Basin, suffered from the historic flooding from 30 June to 6 July 2016. The Yangtze River water level, measured from Hankou station located in Wuhan City was up to 27.08 m on 3 July 2016, which is 0.22 m lower than the alert level. During the flooding, the water level of Taihu and Poyang lakes in Jiangsu and Jiangxi provinces, respectively, were at record levels and significantly threatened the adjacent cities. For Dongting Lake, the water level measured from Chenglingji station reached the alert level of 32.5 m on the 3 July 2016. Then, it surpassed its alert level by 0.56 m on the 4 July 2016.
Generally, rivers and lakes can absorb excessive rainwater during flooding periods, thus reducing the possibility of flooding disasters. However, due to the degradation of rivers and lakes, their abilities to collect excessive rainwater are largely reduced. The surface area of Dongting Lake has been reduced by 57%, from 6000 km2 in 1990 to 2600 km2 in 2016. In Wuhan City, the number of lakes has decreased from 127 in 1950 to 30 in 2016 [56]. The degradation of rivers and lakes has caused a significant decline in flood storage capacity. To restore the flood storage capacity, degraded rivers and lakes need to be restored. However, the river restoration process is usually time consuming and not cost effective. Therefore, in 2014, the Chinese government started promoting the “Sponge City” strategy. Features of sponge cities include construction of large green areas, rooftop gardens, and permeable roads and pavements to allow the soil to absorb excessive rainwater without channeling into gutters or rivers. Sponge cities also allow the rainwater to be reused to irrigate urban farms or even in domestic environments.
4.4. Advances in Urban Flooding Precautions
Many researchers focused on the assessment of flood risk [57,58,59,60]. Plate [57] gave a comprehensive overview for flood risk and flood management. Plate’s study established a framework by means of the different processed of flood management. Marchi et al. [58] collected 25 major flash floods in Europe in the period from 1994 to 2008 to explore the storm characteristics of the rainfall to runoff transformation, including the peak discharges and the runoff volume. Gouldby et al. [59] developed a method for regional-scale flood risk assessment from fluvial and coastal sources. To investigate the change in flood risk in the Huaihe River Basin between period I (1960–1980) and period II (1980–2010), Wu et al. [60] established a risk assessment index system that considers risk as the production of hazard and vulnerability. The increased risk in the Huaihe River Basin was a result of the combined effects of climate change and social-economic development. Yin et al. [29] reported new development, including improvement of infrastructure, flooding defense system, and land use planning, will add value to municipal flooding risk management. Despite the advances in urban flooding risk management in China, flooding from 30 June to 6 July 2016 still affected 32 million people across 26 provinces, killing 186 people, and leaving 45 people missing. Thus, many research issues should be addressed to overcome the existing constraints and to provide more robust conclusions about urban flood risk management for cities in China. The first challenge is that the input data and techniques for urban flood modeling require a higher resolution to yield more accurate inundation data. Airborne and terrestrial Light Detection and Ranging (LiDAR) data can be used to generate a high resolution Digital Terrain Model (DTM) for urban flood modeling [61,62]. The calibration and validation of urban flooding simulations should incorporate detailed quantitative evidence, such as remote sensing data [63,64]. Unmanned Aerial Vehicle (UAV) remote sensing technologies could also be used for the rapid investigation of the extent of flooding in urban environment in the large basins of China [65].
5. Prospective Measures
5.1. Traditional Evaluation Approaches on Flood Risk
Generally, there are four types of approaches to evaluate flood risk: (1) statistical method based on historical disaster records [66]; (2) multi-criteria index analysis [67]; (3) GIS and remote sensing technologies [68]; (4) scenario-based inundation analysis [69]. Long-term historical flood records have crucial references for flood risk assessment, but it cannot reflect spatial variation of flood disasters. Multi-criteria index analysis can evaluate regional flood risk by establishing the multi-criteria index system. However, this approach exists a few deficits in the determination of indices. GIS and remote sensing techniques provided technological supports for flood risk assessment. Remote sensing technology is suggested to the application for the monitoring of regional flood disasters. Scenario-based inundation simulation always applied to analyze the water depth, flood extent and flow velocity, which have crucial role for flood risk assessment [70,71,72]. However, scenario-based inundation simulation requires the data of topography, land use, and urban drainage system. Except for these four method, Kourgialas and Karatzas (2013) [70] use the characteristics of water depth, flow velocity, sediment transport load to estimate the flood propagation. These flood risk predictions are helpful to propose precaution and mitigation measures for flood disasters.
5.2. Sponge City Strategy
With the increase of urban floods, many researches on flood risk management have been conducted [73,74,75]. Herk et al. [73] proposed a new framework to organize a resilience action to support collaborative planning for flood risk management. Due to river and lake degradation, urban inundation has become a common phenomenon for flood-prone cities in China [76,77]. To restore the flood storage capacity, remediation of the waterways that can no longer perform essential ecological and social functions such as mitigating floods, providing clean drinking water, and supporting fisheries and wildlife, should be completed. However, river restoration is usually time consuming and may not be cost effective. To improve urban runoff management to prevent flooding in flood-prone cities, the Ministry of Housing and Urban-Rural Development (MHURD) proposed a new strategy in 2014 named Sponge City (SPC) to capture and reuse rainwater [78,79,80,81,82].
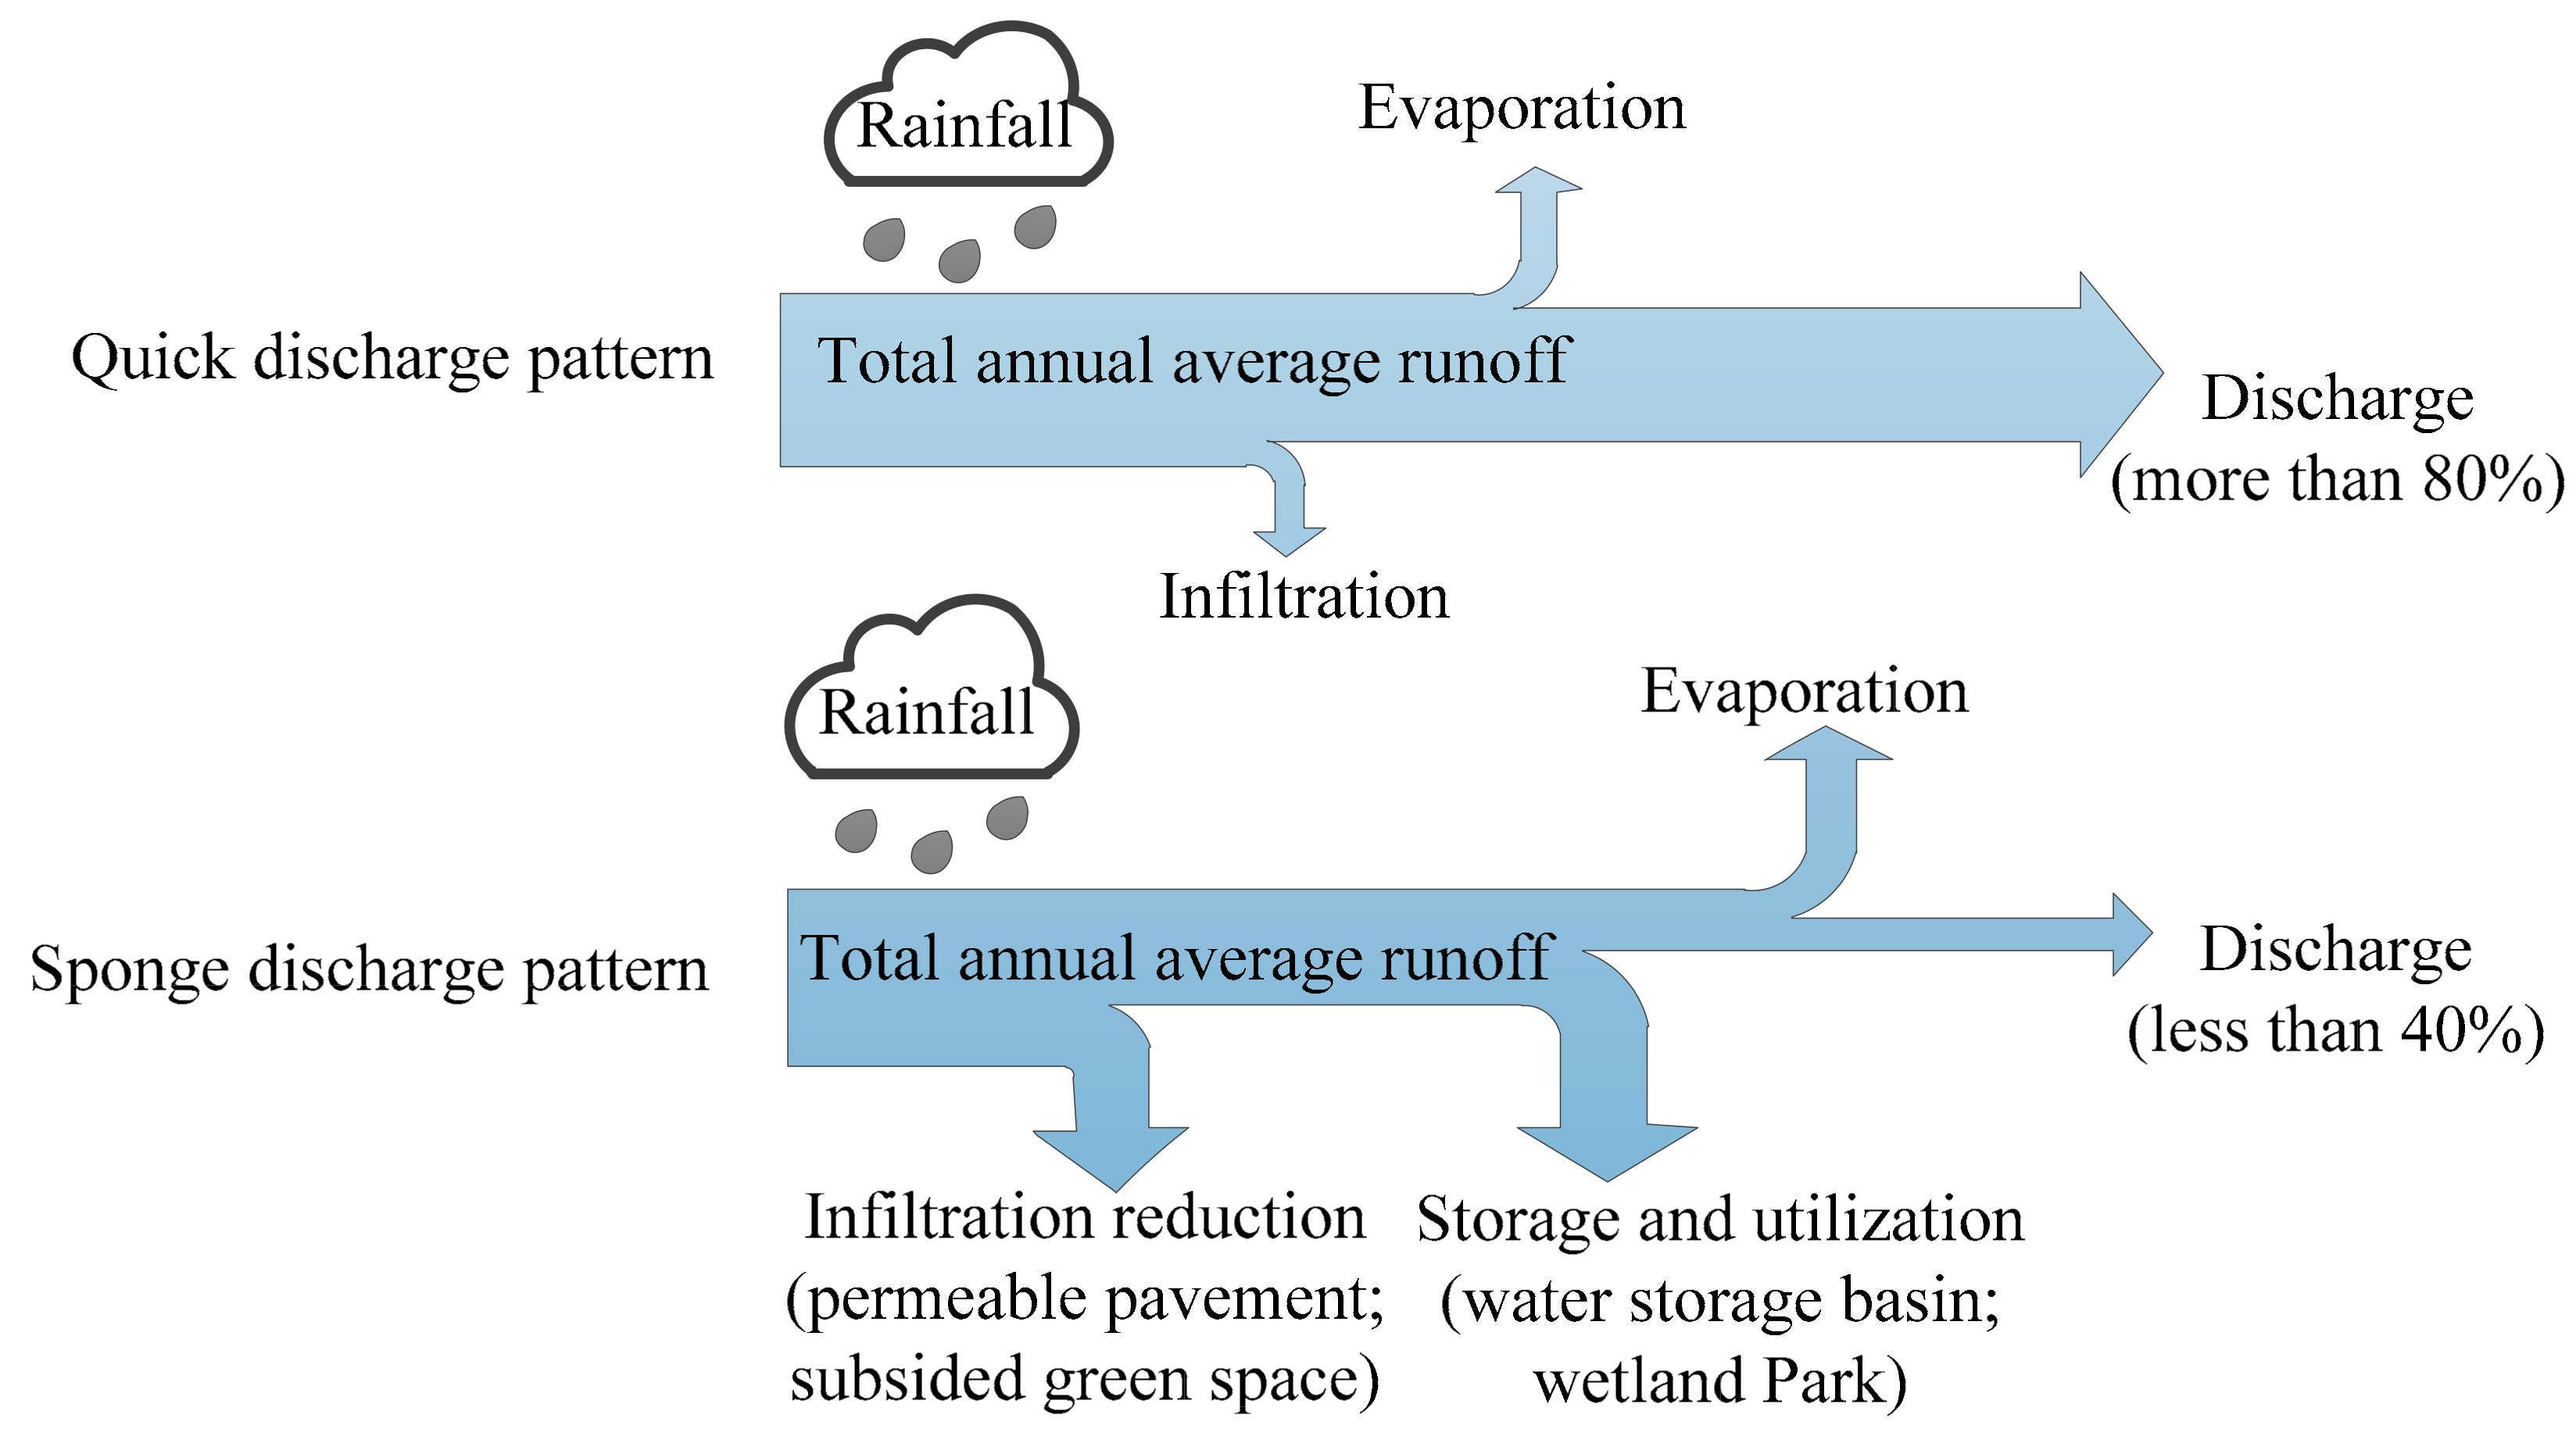
Land-Use and Land-Cover Changes (LUCC) can reflect the rate of urbanization. Previous investigations demonstrated that the construction area significantly increases, whereas unused land correspondingly decreases. Thus, LUCC causes flood storage capacity to sharply decline. Due to LUCC, the original hydrological cycle in urban areas has changed, which leads to an increased runoff coefficient and corresponding increase in storm water runoff and peak flood discharge. Heavy rainfall can easily cause flooding in urban areas, particularly in undercrossing metro tunnels and residential areas. The combination of El Nino and climate change can lead to continuous rainfall, resulting in a greater risk of waterlogging. SPC addresses critical factors such as maintaining a continuous and healthy hydrological cycle, preventing and controlling urban inundation, reducing water pollution, and creating an ecologically friendly environment. The features of SPC include retention, detention, infiltration, purification, and release of storm water [83]. Figure 10 compares the traditional discharge pattern and the sponge discharge pattern. As shown in Figure 10, with the traditional discharge pattern, the storm water is at a level of more than 80% of capacity, whereas with the sponge discharge pattern, it is reduced to less than 40% [83]. This implies that approximately 40% rainwater can be reused.
Geiger [84] explained the meanings of SPC and Low Impact Development (LID) based on the Chinese and international examples, which gives the further advice for planning strategies, including principles for merging technical and landscape issues. The benefits obtained from constructing SPC are as follows: (1) SPC decreases the possibility of urban inundation—since SPC uses pervious pavements and grass swales to reduce runoff volume, the possibility of urban inundation is considerably reduced; (2) SPC improves the ecological environment—SPC preserves the natural forest, green spaces or lands, rivers, lakes, and wetlands, which is deemed as the basic goal of SPC construction; (3) SPC reduces the construction cost of cities—as SPC protects the natural urban ecological environment and preserves green lands, rivers, ponds, and trenches, the required amount of reinforced concrete for city construction and development is reduced; and (4) solving the problem of water scarcity caused by rapid urbanization—the water quality of urban rivers is worsening because large amounts of pollutants from storm water runoff and some untreated wastewater are being discharged into the rivers, so SPC aims to relieve cities’ water shortage situations to avoid forest, lake, and wetland occupation that breaks the natural hydrological cycle.
5.3. Sponge City in China
The China Ministry of Finance (MOF), MHURD, and the Ministry of Water Resource (MWR) jointly announced the application of a SPC pilot construction on 20 January 2015 [79,85]. The 16 SPC pilots are located in Baicheng (Jilin Province), Qian’an (Hebei Province), Jinan (Shandong Province), Hebi (Henan Province), Zhenjiang (Jiangsu Province), Jiaxing (Zhejiang Province), Chizhou (Anhui Province), Wuhan (Hubei Province), Xi’an New District (Shanxi Province), Suining (Sichuan Province), Chongqing, Changde (Hunan Province), Pingxiang (Jiangxi Province), Xiamen (Fuzhou Province), Nanning (Guangxi Province), and Gui’an New District (Guizhou Province). Shanghai is on the estuary of Yangtze River and surrounded by the East Sea and Yellow Sea. Thus, Shanghai was deemed favorable for development of SPC because of its location and abundant groundwater resources [86,87].
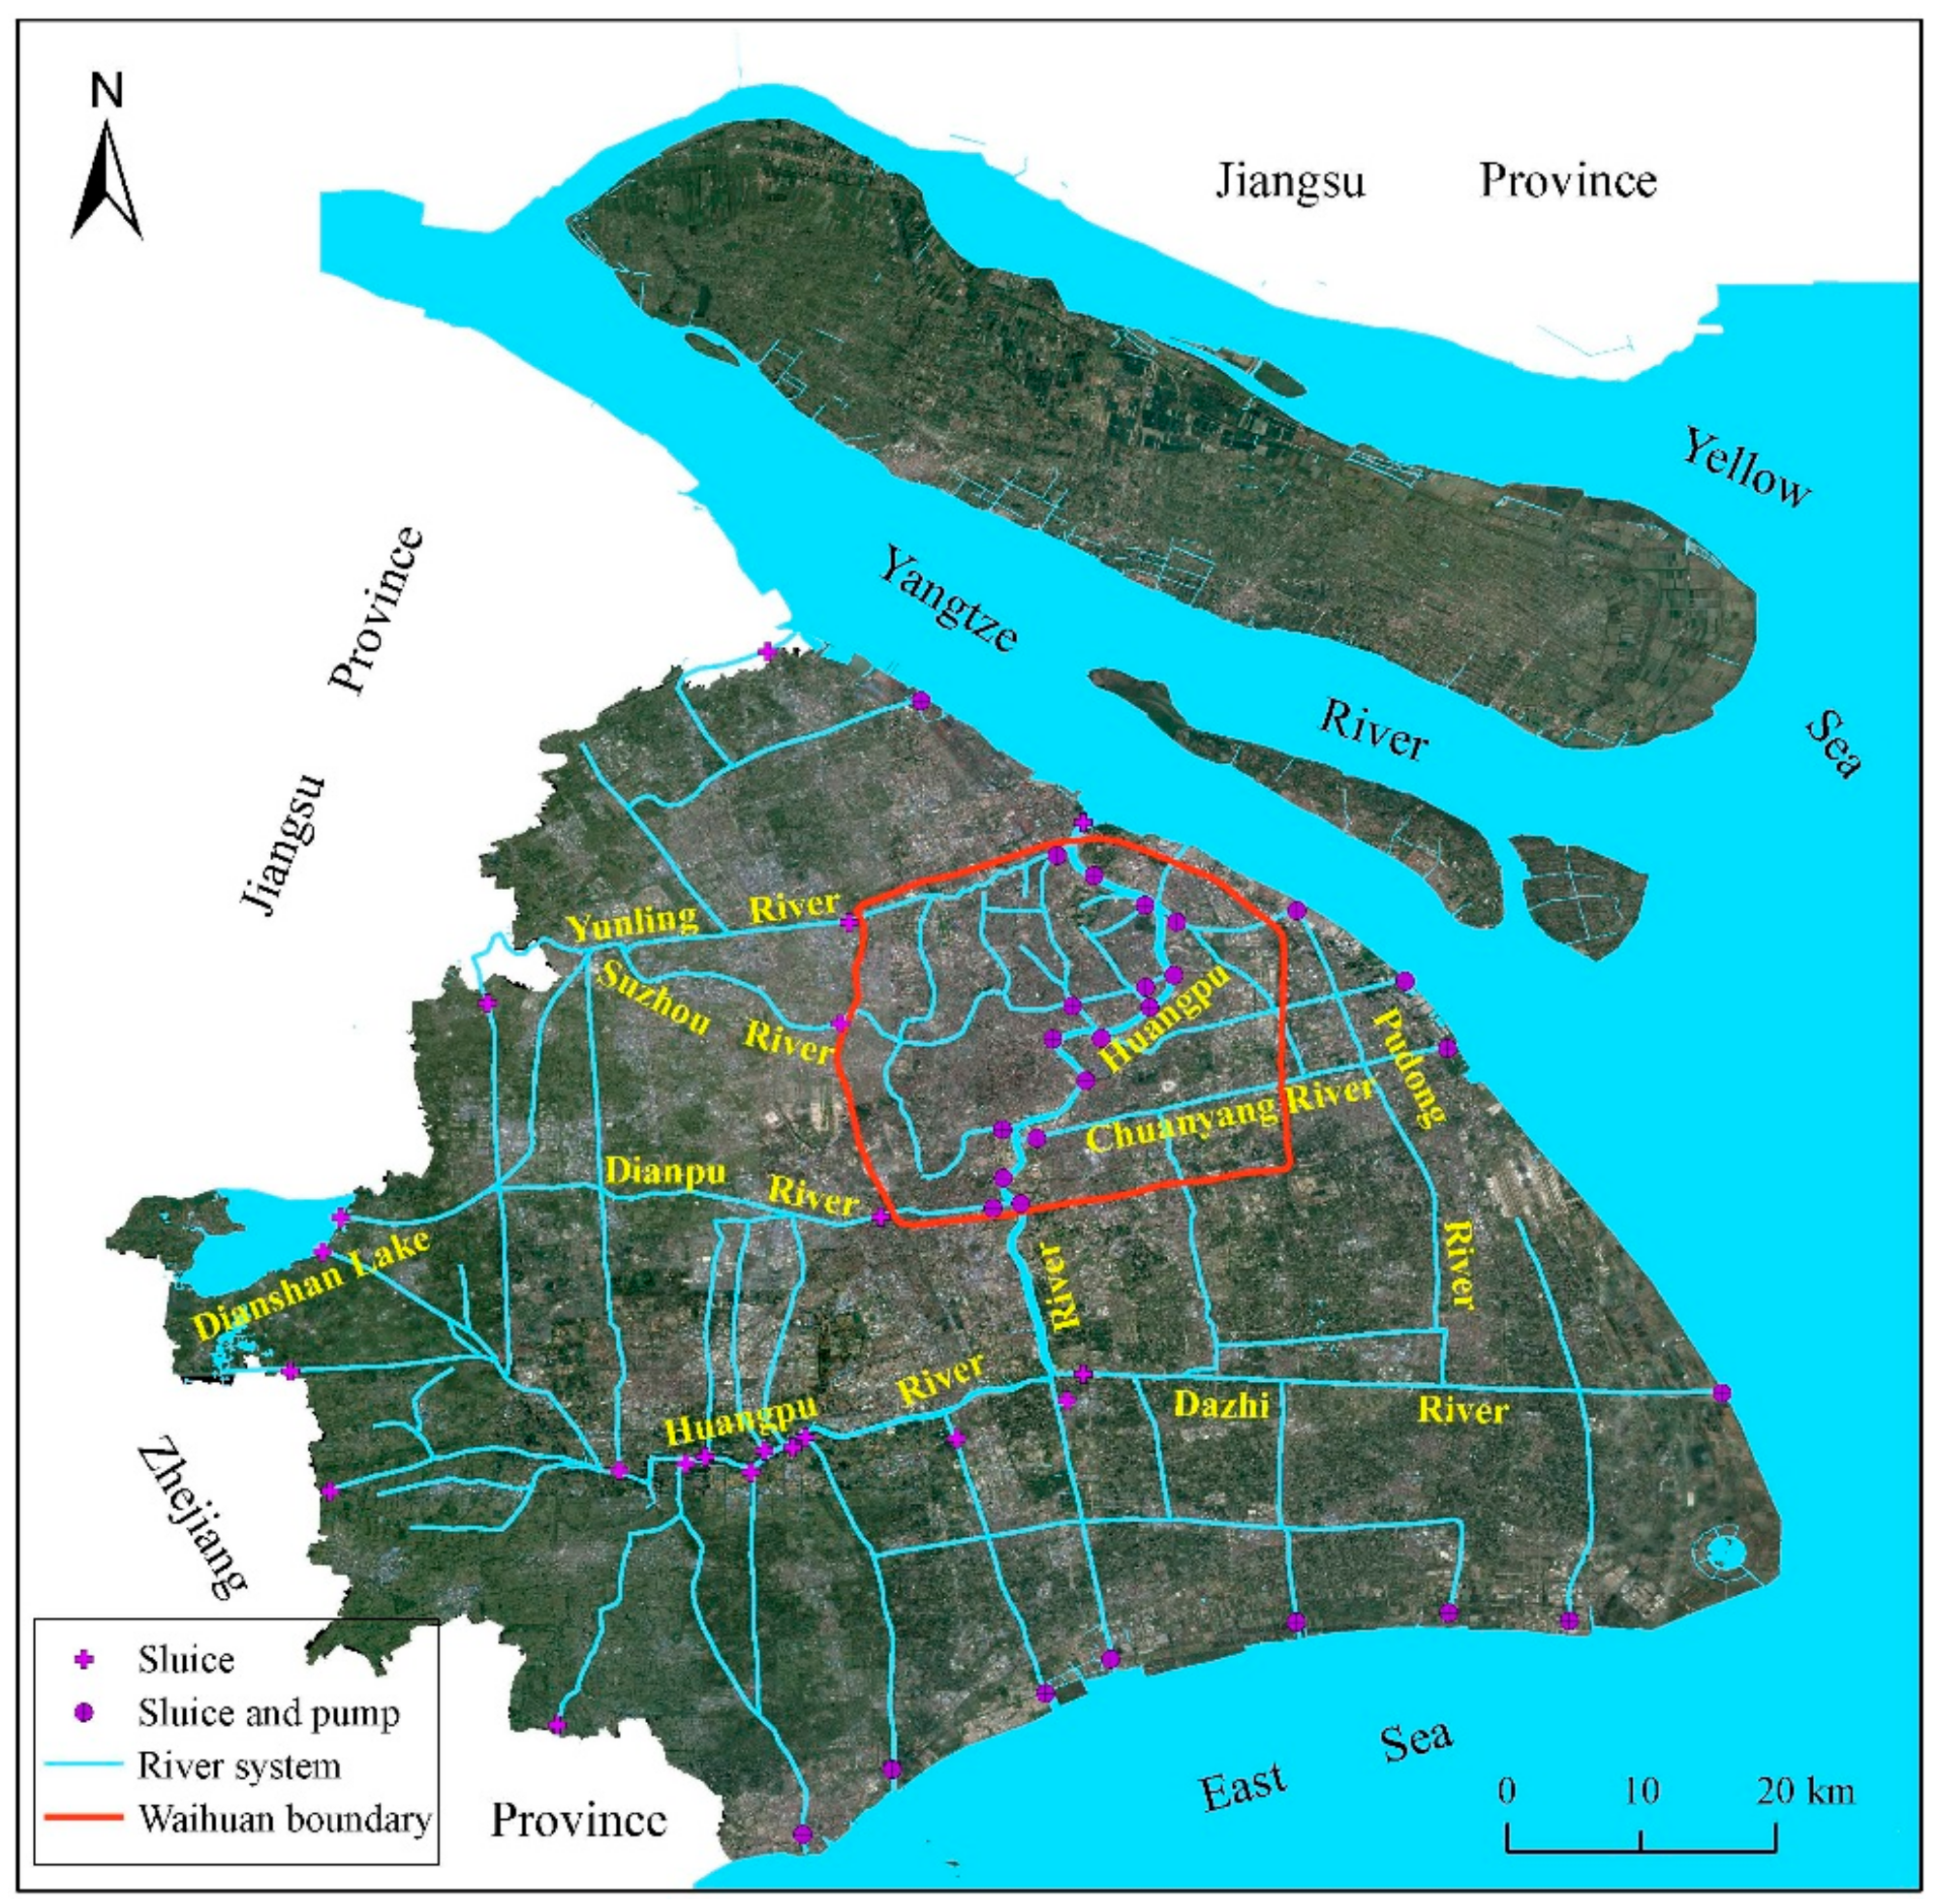
River networks are designed to control flooding when rainstorms occur [88]. In the process of SPC construction, Shanghai benefits from its own intensive river system for building sluices and pumping stations. Figure 11 shows the distribution of sluices and pumping stations in Shanghai [89]. Excessive rainwater can be managed and discharged into rivers through these sluices and pumping stations. Due to the land subsidence problem resulting from uncontrolled groundwater withdrawal in the past, most of the sluices and pumping stations were deployed inside the Waihuan boundary. Some of the pumping stations were installed along Huangpu River for local flooding prevention. The sluices and pumping stations were also distributed along the boundary of the East Sea and the estuary of the Yangtze River as a result of the river water level fluctuation resulting from the tidal effect. Despite the deployment of sluices and pumping stations, it was reported from an investigation into the structures, flood control measures, and historic flood events of Shanghai Metro Lines 1-3 that underground spaces in the urban area are susceptible to the impacts of flooding due to the lack of adequate flood control facilities and mitigation plans. To summarize, flood management in Shanghai is a complex and comprehensive task, and considerable improvements are needed.
5.4. Problems Related to SPC Construction
During SPC construction, some problems occur. These are: (1) local inundation in streets and flooding in rivers—due to special geographic and topographic setting, flooding in river and local inundation (flash flooding) in streets can occur concurrently; (2) water resource shortage—the MWR stated that 110 cities are faced with severe water shortages in China, and of 32 megacities, 30 in China are suffering serious water shortage problems and challenges [80]; (3) storm water use—since urban sprawl affects many forests, grasslands, and wetlands that can store water resources, most storm water runoff is directly discharged out of the city; and (4) water pollution control—some wastewater from communities in older districts is still directly infiltrated into groundwater though septic tanks, which may pollute the water source wells. To tackle these problems, more LID facilities are required to increase the storm water runoff infiltration and reuse and protect the water resources. Additionally, eliminating the surface water which is inferior to a higher quality standard, through interception and water purification, has been deemed feasible for controlling water pollution. Moreover, in cases where local inundation in streets along with river flooding is frequent, to ensure rivers can handle and discharge larger floods, dredging rivers is worth the consideration of the authorities.
6. Concluding Remarks
We presented a review of recent severe flooding hazard events with the economic loss along the Yangtze River basin in 1998 and 2016. Then, prospective measures for mitigating the hazards and protecting the environment were proposed. Based on the analyses and discussions, the following conclusions can be drawn:
- (1)
- The flood in 1998 in the Yangtze River Basin lasted longer than the one in 2016. Despite the shorter rainfall duration, it was more intense in 2016, resulting in a larger affected area than in 1998. The scale of the flooding in 1998, measured by people affected, death toll, collapsed houses, and damaged crops, was much larger than in 2016. However, the total economic losses in 2016 were much larger than that in 1998. This is due to the rapid economic development in China during this 18-year period.
- (2)
- The reasons for these severe flooding hazards were hazardous weather conditions and degradation of the ecological environment. The hazardous weather conditions both in 1998 and 2016 were linked to the El Nino effect. The degraded ecological environment is due to rivers and lakes which did not have enough suitable locations for the discharge of excessive rainwater, resulting in urban waterlogging. Additionally, the lower reaches of the Yangtze River would suffer from more severe flooding if the Three Gorges Dam does not function as usual during the flood period. Thus, preventing flooding hazards and mitigating damages have become some of the most urgent urban environmental management affairs for authorities in China.
- (3)
- To mitigate flooding hazards, China proposed a new strategy named Spongy City (SPC) in 2014, drawing on international experiences. SPC promotes sustainable city development so that a city has the resilience to adapt to climate change, to mitigate the impacts of waterlogging caused by extreme rainfall events. Some SPC construction-related problems, including local inundation in streets and flooding in rivers, meant that storm water use, water resource shortage, and water pollution control improved. Dredging rivers, constructing more LID facilities, and intercepting and purifying surface water are recommended to solve these problems.
- (4)
- In addition to the traditional flood risk assessment approach (e.g., statistical data-based analysis, multi-criteria index analysis, GIS-based techniques, and scenario-based analysis), remote sensing technologies, as well as LiDAR data, were recommended for applications in flood risk assessment and management in flood prone areas.
Author Contributions
This paper represents a result of collaborative teamwork. Y.-S.X. developed the concept of the manuscript; H.-M.L. wrote the manuscript; W.-C.C. and A.A. provided constructive suggestions both for technical and manuscript preparation. The four authors contributed equally to this work.
Acknowledgments
The research work described herein was funded by the National Basic Research Program of China (973 Program: 2015CB057802). This financial support is gratefully acknowledged.
Conflicts of Interest
The authors declare no conflict of interest.
References
- IPCC. Climate Change: Observed and Projected Changes in Climate as They Relate to Water; Cambridge University Press: Cambridge, UK, 2008. [Google Scholar]
- IPCC. Climate Change: Radiative Forcing of Climate Change and an Evaluation of the IPCC IS92 Emission Scenarios; Cambridge University Press: Cambridge, UK, 1995. [Google Scholar]
- Doornkamp, J.C. Coastal flooding, global warming and environmental management. J. Environ. Manag. 1998, 52, 327–333. [Google Scholar] [CrossRef]
- Peng, J.; Peng, F.L. A GIS-Based evaluation method of underground space resource for urban spatial planning: Part 1 Methodology. Tunnel. Undergr. Space Technol. 2018, 74, 82–95. [Google Scholar] [CrossRef]
- Qiao, Y.K.; Peng, F.L.; Wang, Y. Monetary valuation of urban underground space: A critical issue for the decision-making of urban underground space development. Land Use Policy 2017, 69, 12–24. [Google Scholar] [CrossRef]
- Ni, J.; Sun, L.; Li, T. Assessment of flooding impacts in terms of sustainability in mainland China. J. Environ. Manag. 2010, 91, 1930–1942. [Google Scholar] [CrossRef] [PubMed]
- Gallina, V.; Torresan, S.; Critto, A. A review of multi-risk methodologies for natural hazards: Consequences and challenges for a climate change impact assessment. J. Environ. Manag. 2016, 168, 123–132. [Google Scholar] [CrossRef] [PubMed]
- Lyu, H.M.; Wang, G.F.; Cheng, W.C. Tornado hazards on June 23rd in Jiangsu Province, China: Preliminary investigation and analysis. Nat. Hazards 2017, 85, 597–604. [Google Scholar] [CrossRef]
- Peng, C.; Yuan, M.; Gu, C.; Peng, Z.; Ming, T. A review of the theory and practice of regional resilience. Sustain. Cities Soc. 2017, 29, 86–96. [Google Scholar] [CrossRef]
- Wu, H.N.; Shen, S.L.; Liao, S.M.; Yin, Z.Y. Longitudinal structural modelling of shield tunnels considering shearing dislocation between segmental rings. Tunnel. Undergr. Space Technol. 2015, 50, 317–323. [Google Scholar] [CrossRef]
- Du, Y.J.; Jiang, N.J.; Shen, S.L.; Jin, F. Experimental investigation of influence of acid rain on leaching and hydraulic characteristics of cement-based solidified/stabilized lead contaminated clay. J. Hazards Mater. 2012, 225–226, 195–201. [Google Scholar] [CrossRef] [PubMed]
- Wu, Y.X.; Shen, S.L.; Yuan, D.J. Characteristics of dewatering induced drawdown curve under barrier effect of retaining wall in aquifer. J. Hydrol. 2016, 539, 554–566. [Google Scholar] [CrossRef]
- Xu, Y.S.; Shen, S.L.; Ren, D.J.; Wu, H.N. Analysis of factors in land subsidence in Shanghai: A view based on a strategic environmental assessment. Sustainability 2016, 8, 573. [Google Scholar] [CrossRef]
- Shen, S.L.; Wu, H.N.; Cui, Y.J.; Yin, Z.Y. Long-term settlement behavior of metro tunnels in the soft deposits of Shanghai. Tunnel. Undergr. Space Technol. 2014, 40, 309–323. [Google Scholar] [CrossRef]
- Shen, S.L.; Cui, Q.L.; Ho, C.E.; Xu, Y.S. Ground response to multiple parallel microtunneling operations in cemented silty clay and sand. J. Geotech. Geoenviron. Eng. 2016, 142, 04016001. [Google Scholar] [CrossRef]
- Shen, S.L.; Wang, Z.F.; Cheng, W.C. Estimation of lateral displacement induced by jet grouting in clayey soils. Geotechnique. ICE 2017, 67, 621–630. [Google Scholar] [CrossRef]
- Qiu, B.X. Challenges and strategies for China’s urbanisation. Urban. Stud. 2010, 17, 1–7. (In Chinese) [Google Scholar]
- Tan, Y.; Wei, B.; Diao, Y.; Zhou, X. Spatial corner effects of long and narrow multipropped deep excavations in Shanghai soft clay. J. Perform. Construct. Facil. ASCE 2014, 28, 04014015. [Google Scholar] [CrossRef]
- Tan, Y.; Lu, Y. Why excavation of a small air shaft caused excessively large displacements: Forensic investigation. J. Perform. Construct. Facil. ASCE 2016, 31, 04016083. [Google Scholar] [CrossRef]
- Arulrajah, A.; Yaghoubi, E.; Imteaz, M.; Horpibulsuk, S. Recycled waste foundry sand as a sustainable subgrade fill and pipe-bedding construction material: Engineering and environmental evaluation. Sustain. Cities Soc. 2017, 28, 343–349. [Google Scholar] [CrossRef]
- Shen, S.L.; Wu, Y.X.; Xu, Y.S.; Hino, T.; Wu, H.N. Evaluation of hydraulic parameters from pumping tests of multi-aquifers with vertical leakage Tianjin. Comput. Geotech. 2015, 68, 196–207. [Google Scholar] [CrossRef]
- Shen, S.L.; Wu, Y.X.; Misra, A. Calculation of head difference at two sides of a cut-off barrier during excavation dewatering. Comput. Geotech. 2017, 91, 192–202. [Google Scholar] [CrossRef]
- Lyu, H.M.; Cheng, W.C.; Shen, J.S. Investigation of collapsed building incidents on soft marine deposit: Both from social and technical perspectives. Land 2018, 7, 20. [Google Scholar] [CrossRef]
- Yin, Z.Y.; Jin, Y.F.; Shen, J.S.; Hicher, P.Y. Optimization techniques for identifying soil parameters in geotechnical engineering: Comparative study and enhancement. Int. J. Numer. Anal. Methods Geomech. 2018, 42, 70–94. [Google Scholar] [CrossRef]
- Yin, Z.Y.; Hicher, P.Y.; Dano, C.; Jin, Y.F. Modeling the mechanical behavior of very coarse granular materials. J. Eng. Mech. 2017, 143, C4016006. [Google Scholar] [CrossRef]
- Jin, Y.F.; Yin, Z.Y.; Wu, Z.X.; Zhou, W.H. Identifying parameters of easily crushable sand and application to offshore pile driving. Ocean Eng. 2018, 154, 416–429. [Google Scholar] [CrossRef]
- Lyu, H.M.; Wang, G.F.; Shen, J.S.; Lu, L.H.; Wang, G.Q. Analysis and GIS mapping of flooding hazards on 10 May, 2016, Guangzhou, China. Water. 2016, 8, 447. [Google Scholar] [CrossRef]
- Shen, S.L.; Xu, Y.S. Numerical evaluation of land subsidence induced by groundwater pumping in Shanghai. Can. Geotech. J. 2011, 48, 1378–1392. [Google Scholar] [CrossRef]
- Yin, J.; Ye, M.; Yin, Z.; Xu, S. A review of advances in urban flood risk analysis over China. Stoch. Environ. Res. Risk Assess. 2015, 29, 1063–1070. [Google Scholar] [CrossRef]
- Zhang, L.; Zhu, Q.; Zhang, L.; Liang, D.Q.; Tian, Y.X. An efficient algorithm to plot flooded intertidal areas. Comput. Geosci. 2009, 35, 1072–1078. [Google Scholar] [CrossRef]
- Lyu, H.M.; Sun, W.J.; Shen, S.L.; Arulrajah, A. Flood risk assessment in metro systems of mega-cities using a GIS-based modeling approach. Sci. Total Environ. 2018, 626, 1012–1025. [Google Scholar] [CrossRef]
- Lyu, H.M.; Shen, S.L.; Arulrajah, A. Assessment of geohazards and preventative countermeasures using AHP incorporated with GIS in Lanzhou, China. Sustainability 2018, 10, 304. [Google Scholar] [CrossRef]
- Cheng, W.C.; Ni, J.C.; Shen, S.L. Experimental and analytical modeling of shield segment under cyclic loading. Int. J. Geomech. 2016, 17, 04016146. [Google Scholar] [CrossRef]
- Zhao, S.; Yang, S. Dynamical prediction of the early season rainfall over southern China by the NCEP climate forecast system. Weather Forecast. 2014, 29, 1391–1401. [Google Scholar] [CrossRef]
- Madu, C.N.; Kuei, C.H.; Lee, P. Urban sustainability management: A deep learning perspective. Sustain. Cities Soc. 2017, 30, 1–17. [Google Scholar] [CrossRef]
- Samel, A.N.; Liang, X.Z. Understanding relationships between the 1998 Yangtze River flood and northeast Eurasian blocking. Clim. Res. 2003, 149–158. [Google Scholar] [CrossRef]
- Shankman, D.; Keim, B.D.; Song, J. Flood frequency in China's Poyang Lake region: Trends and teleconnections. Int. J. Climatol. 2006, 26, 1255–1266. [Google Scholar] [CrossRef]
- Shankman, D.; Keim, B.D.; Nakayama, T. Hydroclimate analysis of severe floods in China’s Poyang Lake region. Earth Interact. 2012, 16. [Google Scholar] [CrossRef]
- Ward, P.J.; Kummu, M.; Lall, U. Flood frequencies and durations and their response to El Niño Southern Oscillation: Global analysis. J. Hydrol. 2016, 539, 358–378. [Google Scholar] [CrossRef]
- Li, Y.; Zhang, C.; Wang, Y. The verification of millennial-scale monsoon water vapor transport channel in northwest China. J. Hydrol. 2016, 536, 273–283. [Google Scholar] [CrossRef]
- Zhu, Z.; Li, T. Amplified contiguous United States summer rainfall variability induced by east asian monsoon interdecadal change. Clim. Dyn. 2017, 4, 1–14. [Google Scholar] [CrossRef]
- Lu, M.M.; Chu, P.S.; Lin, Y.C. Seasonal prediction of tropical cyclone activity near Taiwan using the Bayesian multivariate regression method. Weather Forecast. 2010, 25, 1780–1795. [Google Scholar] [CrossRef]
- Huang, J.; Du, J.; Qian, W. A comparison between a generalized beta–advection model and a classical beta–advection model in predicting and understanding unusual typhoon tracks in eastern China seas. Weather Forecast. 2015, 30, 771–792. [Google Scholar] [CrossRef]
- Zhao, J.; Yang, X.G.; Liu, Z.J.; Lv, S.; Wang, J.; Dai, S.W. Variations in the potential climatic suitability distribution patterns and grain yields for spring maize in Northeast China under climate change. Clim. Chang. 2016, 137, 29–42. [Google Scholar] [CrossRef]
- Song, J. Reconstruction of the southern oscillation from dryness/wetness in China for the last 500 years. Int. J. Climatol. 1998, 18, 1345–1355. [Google Scholar] [CrossRef]
- China Weather. Available online: http://www.weather.com.cn/ (accessed on 20 June 2016).
- Min, Q. Preliminary analysis of Poyang Lake relatively big flood occurrence characteristics during the past 500 years. Jiangxi Hydraulic Sci. Technol. 1999, 18, 76–83. [Google Scholar]
- Edmonds, R.L. The Sanxia (Three Gorges) Project: The environmental argument surrounding China’s super dam. Glob. Ecol. Biogeogr. Lett. 1992, 2, 105–125. [Google Scholar] [CrossRef]
- Tullos, D. Assessing the influence of environmental impact assessments on science and policy: An analysis of the Three Gorges Project. J. Environ. Manag. 2009, 90, S208–S223. [Google Scholar] [CrossRef] [PubMed]
- Lee, B.S.; You, G.J.Y. An assessment of long-term overtopping risk and optimal termination time of dam under climate change. J. Environ. Manag. 2013, 121, 57–71. [Google Scholar] [CrossRef] [PubMed]
- China News. Available online: http://www.chinanews.com/ (accessed on 7 June 2016).
- National Science & Technology Infrastructure. Available online: http://data.cma.cn/ (accessed on 10 June 2016).
- The Latest News on Rainstorm in Wuhan on July 6, 2016. Available online: https://www.keyunzhan.com/tianqi/news-54776/ (accessed on 10 June 2016).
- National Climate Center (NCC), CMA. Special for El Nino topics. Available online: https://www.natureindex.com/institution-outputs/china/national-climate-center-ncc-cma/582d53f9140ba0a9428b456e (accessed on 20 June 2016).
- The Three Gorges Project has been put to the Test and Played Its Role in Stopping Floods, Clipping Peaks, and Shifting Peaks. Available online: http://energy.people.com.cn/GB/115016/140071/198636/index.html (accessed on 12 June 2016).
- Deng, M.R.; Luo, Y.T.; Han, Q. Monitoring and analysis of water and soil loss in Dongting Lake region based on GIS. J. Hengyang Normal Univ. 2016, 37, 118–124. (In Chinese) [Google Scholar]
- Plate, E.J. Flood risk and flood management. J. Hydrol. 2002, 267, 2–11. [Google Scholar] [CrossRef]
- Marchi, L.; Borga, M.; Preciso, E.; Gaume, E. Characterisation of selected extreme flash floods in Europe and implications for flood risk management. J. Hydrol. 2010, 394, 118–133. [Google Scholar] [CrossRef]
- Gouldby, B.; Sayers, P.; Mulet-Marti, J.; Hassan, M.A.A.M.; Benwell, D. A methodology for regional-scale flood risk assessment. Water Manag. 2008, 161, 169–182. [Google Scholar] [CrossRef]
- Wu, Y.; Zhong, P.A.; Xu, B.; Zhu, F.; Ma, B. Changing of flood risk due to climate and development in Huaihe River basin, China. Stoch. Environ. Res. Risk Assess. 2016, 31, 935–948. [Google Scholar] [CrossRef]
- Meesuk, V.; Vojinovic, Z.; Mynett, A.E.; Abdullah, A.F. Urban flood modelling combining top-view LiDAR data with ground-view SfM observations. Adv. Water Resour. 2015, 75, 105–117. [Google Scholar] [CrossRef]
- French, J.R. Airborne LiDAR in support of geomorphological and hydraulic modelling. Earth Surf. Process. Landf. 2003, 28, 321–335. [Google Scholar] [CrossRef]
- Lim, K.; Treitz, P.; Wulder, M.; St-Onge, B.; Flood, M. LiDAR remote sensing of forest structure. Prog. Phys. Geogr. 2003, 27, 88–106. [Google Scholar] [CrossRef]
- Sharma, P.K.; Chopra, R.; Verma, V.K.; Thomas, A. Technical note flood management using remote sensing technology: The Punjab (India) experience. Int. J. Remote Sens. 1996, 17, 3511–3521. [Google Scholar] [CrossRef]
- Bates, P.D. Remote sensing and flood inundation modelling. Hydrol. Process. 2004, 18, 2593–2597. [Google Scholar] [CrossRef]
- Nott, J. Extreme Events: A physical Reconstruction and Risk Assessment; Cambridge University Press: Cambridge, UK, 2006. [Google Scholar]
- Jiang, W.; Deng, L.; Chen, L.; Wu, J.; Li, J. Risk assessment and validation of flood disaster based on fuzzy mathematics. Prog. Nat Sci. 2009, 19, 1419–1425. [Google Scholar] [CrossRef]
- Tanavud, C.; Yongchalermchai, C.; Bennui, A.; Densreeserekul, O. Assessment of flood risk in Hat Yai municipality, Southern Thailand, using GIS. J. Nat. Dis. Sci. 2004, 26, 1–14. [Google Scholar] [CrossRef]
- Willems, P. Revision of urban drainage design rules after assessment of climate change impacts on precipitation extremes at Uccle, Belgium. J. Hydrol. 2013, 496, 166–177. [Google Scholar] [CrossRef]
- Kourgialas, N.N.; Karatzas, G.P. A hydro-sedimentary modeling system for flash flood propagation and hazard estimation under different agricultural practices. Nat. Hazards Earth Syst. Sci. 2014, 1, 5855–5880. [Google Scholar] [CrossRef]
- Chatterjee, C.; Förster, S.; Bronstert, A. Comparison of hydrodynamic models of different complexities to model floods with emergency storage areas. Hydrol. Process. 2008, 22, 4695–4709. [Google Scholar] [CrossRef]
- Rodríguez-Blanco, M.L.; Taboada-Castro, M.M.; Taboada-Castro, M.T. Factors controlling hydro-sedimentary response during runoff events in a rural catchment in the humid Spanish zone. Catena 2010, 82, 206–217. [Google Scholar] [CrossRef]
- Herk, S.V.; Zevenbergen, C.; Ashley, R.; Rijke, J. Learning and action alliances for the integration of flood risk management into urban planning: A new framework from empirical evidence from the Netherlands. Environ. Sci. Policy 2011, 14, 543–554. [Google Scholar] [CrossRef]
- Gupta, K. Urban flood resilience planning and management and lessons for the future: A case study of Mumbai, India. Urban Water J. 2007, 4, 183–194. [Google Scholar] [CrossRef]
- Lamond, J.E.; Proverbs, D.G. Resilience to flooding: Lessons from international comparison. Proceed. Instit. Civ. Eng.-Urban Des. Plan. 2009, 162, 63–70. [Google Scholar] [CrossRef]
- Khan, S.I.; Hong, Y.; Wang, J.; Yilmaz, K.K.; Gourley, J.J.; Adler, R.F.; Irwin, D. Satellite remote sensing and hydrologic modeling for flood inundation mapping in Lake Victoria basin: Implications for hydrologic prediction in ungauged basins. IEEE Trans. Geosci. Remote Sens. 2011, 49, 85–95. [Google Scholar] [CrossRef]
- Shen, D.; Rui, Y.; Wang, J.; Zhang, Y.; Cheng, L. Flood inundation extent mapping based on block compressed tracing. Comput. Geosci. 2015, 80, 74–83. [Google Scholar] [CrossRef]
- Alam, M.J. “The organized encroachment of land developers”—Effects on urban flood management in Greater Dhaka, Bangladesh. Sustain. Cities Soc. 2014, 10, 49–58. [Google Scholar] [CrossRef]
- Li, X.N.; Li, J.Q.; Fang, X.; Gong, Y.W.; Wang, W.L. Case studies of the Sponge City Program in China. World Environ. Water Resour. Congr. 2016, 295–306. [Google Scholar] [CrossRef]
- Shen, S.L.; Wang, J.P.; Wu, H.N.; Xu, Y.S.; Ye, G.L.; Yin, Z.Y. Evaluation of hydraulic conductivity for both marine and deltaic deposits based on piezocone testing. Ocean Eng. 2015, 110, 174–182. [Google Scholar] [CrossRef]
- Chen, Y.; Samuelson, H.W.; Tong, Z. Integrated design workflow and a new tool for urban rainwater management. J. Environ. Manag. 2016, 180, 45–51. [Google Scholar] [CrossRef] [PubMed]
- Wu, D.J.; Zhan, S.Z.; Li, Y.H.; Tu, M.Z.; Zhen, J.Y.; Guo, Y.Y.; Peng, H.Y. New trends and practical research on the Sponge Cities with Chinese characteristics. China Soft Sci. 2016, 1, 79–97. [Google Scholar]
- Geiger, W.F. Sponge city and LID Technology—Vision and tradition. Landsc. Arch. Front. 2015, 3, 10–22. [Google Scholar]
- Ministry of Housing and Urban-Rural Development of the People’s Republic of China. Performance Evaluation and Assessment Method for Sponge City Construction. 2014, No. 635. Available online: http://www.mohurd.gov.cn/wbdt/ (accessed on 20 August 2016). (In Chinese)
- Hao, W.; Chao, M.; Liu, J. H.; Shao, W.W. A new strategy for integrated urban water management in china: Sponge city. Sci. China Technol. Sci. 2018, 61, 1–13. [Google Scholar]
- Decree of Shanghai Municipal People’s Government. The state council general office pushing the guidance for Construction Sponge City (in Chinese), 2015, No. 111. Available online: http://www.shanghai.gov.cn.html (accessed on 16 August 2016).
- Costa, D.; Burlando, P.; Priadi, C. The importance of integrated solutions to flooding and water quality problems in the tropical megacity of Jakarta. Sustain. Cities Soc. 2016, 20, 199–209. [Google Scholar] [CrossRef]
- Cui, B.S.; Wang, C.F.; Tao, W.D.; You, Z.Y. River channel network design for drought and flood control: A case study of Xiaoqinghe River basin, Jinan City, China. J. Environ. Manag. 2009, 90, 3675–3686. [Google Scholar] [CrossRef] [PubMed]
- Dai, S.Z. Research on the planning and construction strategy of Sponge City in Shanghai. Shanghai Urban Plan. Rev. 2016, 1, 9–12. (In Chinese) [Google Scholar]
Figure 1.
Areas affected by flooding hazards in 2016.

Figure 2.
Factors triggering the formation of rainfall.

Figure 3.
Moving footprint of the rainy season in China (Data from [46]).
Figure 3.
Moving footprint of the rainy season in China (Data from [46]).

Figure 4.
Zone map of the extreme natural hazards in China in 2016.
Figure 5.
Daily rainfall from June to August in 1998 (Data from [46]).
Figure 5.
Daily rainfall from June to August in 1998 (Data from [46]).

Figure 6.
Summary of the rainfall measured from 30 June to 5 July 2016. Abbreviations: Yunnan (YN), Sichuan (SC), Guangzhou (GZ), Chongqing (CQ), Guangxi (GX), Hunan (HN), Hubei (HB), Henan (Hn), Jiangxi (JX), Anhui (AH), and Jiangsu (JS) (Data from [52]).
Figure 6.
Summary of the rainfall measured from 30 June to 5 July 2016. Abbreviations: Yunnan (YN), Sichuan (SC), Guangzhou (GZ), Chongqing (CQ), Guangxi (GX), Hunan (HN), Hubei (HB), Henan (Hn), Jiangxi (JX), Anhui (AH), and Jiangsu (JS) (Data from [52]).

Figure 7.
Wuhan station and Xinxiang city submerged by rainwater: (a) Wuhan station; (b) Xinxiang city (Data from [53]).
Figure 7.
Wuhan station and Xinxiang city submerged by rainwater: (a) Wuhan station; (b) Xinxiang city (Data from [53]).

Figure 8.
Peak and accumulated sea surface temperatures for the three Top El Nino (TEN) events: (a) peak value; (b) accumulated value.
Figure 8.
Peak and accumulated sea surface temperatures for the three Top El Nino (TEN) events: (a) peak value; (b) accumulated value.

Figure 9.
Catchment conditions of the study area and location of the Three Gorges Dam.

Figure 10.
Comparison of the traditional discharge pattern and the sponge discharge pattern (modified from Wu et al. 2016 [83]).
Figure 10.
Comparison of the traditional discharge pattern and the sponge discharge pattern (modified from Wu et al. 2016 [83]).

Figure 11.
Distribution of the sluices and pumping stations in Shanghai.


Table 1.
Summary of flooding damage from June 30 to July 5, 2016 (Data from [51]).
Table 1.
Summary of flooding damage from June 30 to July 5, 2016 (Data from [51]).
| Province | Affected People (Thousands) | Death Toll | Missing People | Collapsed Houses | Crops (Thousand Hectares) | Economy Loss ($ Billion USD) |
|---|---|---|---|---|---|---|
| Jiangsu | 553 | 0 | 0 | 4400 | 122.9 | 14.3 |
| Anhui | 6647 | 17 | 2 | 11,000 | 532.6 | 137.5 |
| Jiangxi | 799 | 0 | 0 | 1200 | 54.3 | 9.1 |
| Henan | 128 | 6 | 0 | 1200 | 9.1 | 4.6 |
| Hubei | 9994 | 48 | 14 | 16,000 | 923.3 | 135.7 |
| Hunan | 4044 | 11 | 2 | 5100 | 250.9 | 53.9 |
| Guangxi | 21 | 0 | 2 | - | 1.1 | 0.22 |
| Chongqing | 525 | 9 | 2 | 1800 | 21.7 | 6.1 |
| Sichuan | 18 | 1 | 0 | - | 1.9 | 0.34 |
| Guizhou | 516 | 41 | 20 | 3100 | 15.8 | 18.8 |
| Yunnan | 89 | 1 | 0 | - | 1.3 | 1.2 |
Table 2.
Comparison of flooding damage between 1998 and 2016 (Data from [46]).
Table 2.
Comparison of flooding damage between 1998 and 2016 (Data from [46]).
| Time | Affected People (Thousands) | Death Toll | Collapsed House (Thousands) | Crops (Thousand Hectares) | Economic Loss ($ Billion USD) |
|---|---|---|---|---|---|
| 1998 | 100,000 | 1800 | 43,000 | 10,000 | 150 |
| 2016 | 32,820 | 186 | 11,000 | 2942 | 506 |
Table 3.
Inflow and outflow rates of Three Gorges Dam during the first flood peak of the Yangtze River.
Table 3.
Inflow and outflow rates of Three Gorges Dam during the first flood peak of the Yangtze River.
| Time | Inflow (m3/s) | Outflow (m3/s) |
|---|---|---|
| 30 June 2:00 p.m. | 31,000 | 29,900 |
| 1 July 2:00 p.m. | 50,000 | 31,000 |
| 2 July 2:00 p.m. | 39,000 | 30,300 |
| 10 June (ordinary time) | 18,000 | 20,000 |
© 2018 by the authors. Licensee MDPI, Basel, Switzerland. This article is an open access article distributed under the terms and conditions of the Creative Commons Attribution (CC BY) license (http://creativecommons.org/licenses/by/4.0/).
Share and Cite
MDPI and ACS Style
Lyu, H.-M.; Xu, Y.-S.; Cheng, W.-C.; Arulrajah, A. Flooding Hazards across Southern China and Prospective Sustainability Measures. Sustainability 2018, 10, 1682. https://doi.org/10.3390/su10051682
AMA Style
Lyu H-M, Xu Y-S, Cheng W-C, Arulrajah A. Flooding Hazards across Southern China and Prospective Sustainability Measures. Sustainability. 2018; 10(5):1682. https://doi.org/10.3390/su10051682
Chicago/Turabian StyleLyu, Hai-Min, Ye-Shuang Xu, Wen-Chieh Cheng, and Arul Arulrajah. 2018. "Flooding Hazards across Southern China and Prospective Sustainability Measures" Sustainability 10, no. 5: 1682. https://doi.org/10.3390/su10051682
Note that from the first issue of 2016, this journal uses article numbers instead of page numbers. See further details here.