Customer Satisfaction and Loyalty as a Part of Customer-Based Corporate Sustainability in the Sector of Mobile Communications Services


Faculty of Operation and Economics of Transport and Communications, University of Zilina, Univerzitna 8215/1, 010 26 Zilina, Slovakia
*
Author to whom correspondence should be addressed.
Sustainability 2018, 10(5), 1657; https://doi.org/10.3390/su10051657
Submission received: 20 April 2018
/
Revised: 16 May 2018
/
Accepted: 17 May 2018
/
Published: 21 May 2018
(This article belongs to the Special Issue Quality Management and Sustainable Development)
Abstract
:In the service sector, the issue of customer satisfaction is being paid great attention. It has become central concern for companies of services to improve service quality, and to maintain customer loyalty within a highly competitive marketplace. The success of customer satisfaction is not only closely related to a company’s quality management and marketing activities but it also has significant impacts on the company’s future and its customer-based corporate sustainability. Customer satisfaction influences variables that are indicators of customer loyalty and long-time customer relationships. The aim of this paper is to provide information about customer satisfaction with quality of electronic communications services and show the results of application of the European customer satisfaction index (ECSI) model carried out in Slovak electronic communications market. Our marketing research pointed out that the ECSI model can provide a better understanding of the complex relationships of the variables of customer loyalty and customer satisfaction and their impact to sustainability of Slovak telecom provider.
1. Introduction
In the service sector, especially on the electronic communications market, sustainability has been emerging in addition to the traditional competitive priorities. It is necessary so companies are increasingly integrating sustainability priorities into their development and business strategy [1]. The majority of service companies take sustainability into account in developing and marketing new services. Sustainability is a global trend now but still there is no group of elements that need to be a part of a sustainable business model. Surprisingly, none of the business modeling approaches even consider sustainability as a major element. Dewan et al. carefully identified and determined the required elements for a sustainable e-business model [2]. The elements are three-dimensional and selected from customer value area, business value area, and process value area so that the modeling elements safeguard the interests of all stakeholders (customer, business, society, and environment) while maintaining sustainability. Customer value area as an element for sustainable business model is very important [2]. Customer value, customer satisfaction and customer loyalty are perceived as the main indicators of success in the development of companies´ economies and contributes to corporate sustainability development [2].
In the service sector, the trend that high customer satisfaction leads to a stronger competitive position resulting in higher market share and profit prevails. Customer satisfaction is the result of a well-functioning concept of Total Quality Management and it also has permanent effects on the company’s future and its customer-based corporate sustainability [3].
In this paper, we perceive customer-based corporate sustainability as a set of corporate elements that reflect the degree of the company is perceived by its customers [4]. Customer-based corporate sustainability significantly and positively impacts customer loyalty in the service sector. In area of electronic communication services, the influence is even more pronounced.
The relationship between customer loyalty and customer-based corporate sustainability has previously been investigated by various scholars. Most of these scholars have focused their research on the concept of corporate social responsibility (CSR), overlapping to a large extent with corporate sustainability [5,6,7]. In the electronic communications sector, research regarding the relationships between customer loyalty and corporate sustainability has been conducted in many countries or regions, such as Spain [8], Greece [9], Taiwan [10], South Korea [11] and Romania [4]. The results showed that corporate sustainability can positively influence customer loyalty through customer satisfaction. Applying sustainability principles by telecom companies has a positive influence on their customers’ satisfaction, generating higher loyalty.
Besides adding to the many studies on quality in the telecommunication sector [12,13,14,15,16,17,18], this paper presents an innovative approach. Our marketing research, conducted from January 2017 to April 2017, pointed out that the ECSI model can provide a better understanding of the complex relationships of the variables of customer loyalty and customer satisfaction and their impact to sustainability of Slovak telecom provider. The ECSI model allows us to research the relationships between service quality, customer satisfaction and customer loyalty in the mobile communications sector in a different way, using a combination of theoretical framework of the ECSI model and sustainability aspects. Considerable attention is paid to relationships between latent and measurable variables identifying the quality of services, customer loyalty and customer satisfaction, and their impact to sustainability of Slovak telecom provider.
2. Theoretical Framework (Literature Overview)
2.1. Quality of Electronic Communications Services and Customer Satisfaction
The issue of the quality of mobile communications services (as a part of electronic communications services) is very complex and interesting. The issue of quality is present in our everyday lives. Each one of us requires the highest possible quality from mobile communications service providers. Quality has become part of regular company policy along with profitability.
Electronic communications are nowadays certainly of special social importance. They virtually remove the importance of geographic distance and of the existing barriers. The notion of electronic communications is the result of the convergence of the sectors of telecommunications, media and information technology. The results of this merger affect not only the extent and structure of transmitted information but also the quality of life of all of us. They are the key factor on the road to the information society while creating basic preconditions for the access of companies, public institutions and individuals to modern communication networks and services within global information infrastructure (National Policy for Electronic Communications for 2020) [19].
Electronic communications are a constantly developing and evolving sector in which customer satisfaction is a very important factor. A condition for achieving quality in this sector is continuous development in the area of customer solutions. The electronic communications sector’s particularity lies in the fact that the quality of provided services is the main factor in distinguishing a company from its competitors. Services in this sector are too homogenous. The one who offers quality for the best price is the winner.
There are various views and perspectives of quality perception in the literature [20,21,22,23]. There is a problem with a generally accepted definition of quality. Various definitions are used for the term quality. It is therefore necessary to define relevant dimensions of the quality of services, and the various characteristics of services perceived according to the internal and external target groups.
Marketing literature [20,24] pays attention to three dimensions of service quality: potential dimension, process dimension and result dimension. Potential dimension relates to the structures and potentials of the service provider (management and resources—material, information, and human), e.g., specification of service, technical possibilities, organization and systemic relations, qualification and motivation of staff. Process dimension captures the service as a sequence of activities (processes) consisting of the marketing process, design process and process of service provision. Result dimension relates to the assessment of the result of a service (customer satisfaction/dissatisfaction with the service or with the service provider) [20].
Professional literature [21,23] highlights especially these two dimensions: the technical and functional dimensions of quality (Table 1). The technical dimension of quality includes, for example, establishment, logout and configuration of service, as well as service operation, selection of additional services, technical support of service, etc. The parameters of the functional dimension include, for example, the image of service provider, guarantee, advertisement campaign, personal quality of personnel, and level of counselling.
At the same time, the two dimensions are reflected in the two basic perspectives from which we can perceive the quality in electronic communications. According to Rostášová [21], from the first perspective, quality is perceived from the customer’s viewpoint. Quality is understood as the customer’s opinion on the value of services because only the customer’s view tells the company whether its quality of services is high or low. According to the author, it can be assumed that the quality is what the customer considers as quality.
Although the requirement for quality is always determined by the customer, who is the basic point of reference for quality measurement, it cannot be defined one-dimensionally, i.e., with regard only to the customer’s requirements. It is a multi-dimensional approach, and it is necessary to also consider the requirements from the points of view of the competition and the company. The first of the two requirements relates to how a company can get a better position than its competitors by setting a targeted strategy. In the case of requirements from the view of the company itself, it is mainly the ability of the offer to be prompt and to offer a certain level of product quality to the customer.
The liberalization of the electronic communications market, which began in Slovakia in the 1990s, also had a major impact on the quality of services in electronic communications. Liberalization has brought benefits for both businesses and end-users, in terms of the entry of new providers into the market with the offer of attractive services and competitive prices. A proof of this is also the ATO survey, according to which up to 88% of business customers were convinced that the liberalization of the electronic communications market contributed to an increase in quality [21].
Network sectors such as electronic communications are characterized by features such as compatibility and standards, network externality, network customer loyalty, cost of switching to another network, and significant economies of scale. These include other features that arise from the nature of network products such as product non-storability, direct customer contact, etc. The quality of services in electronic communications is directly related to solving the problem of customer satisfaction and should be the basis for its formation [21].
2.2. Customer Satisfaction Measurement
Customer satisfaction measurement helps companies decide what direction they should go to improve their performance. There are many ways to measure customer satisfaction, in most cases based on certain research. These studies deal with customer satisfaction with a product or service. They include business initiatives alone, national research or international studies.
Customer satisfaction is analyzed at a corporate level in many countries [3,18,25,26,27,28,29]. The starting point of these analyses is the effort to identify factors that affect customer satisfaction and its effects on the economies of individual countries. This is conditioned by the fact that customer satisfaction is perceived as the main indicator of success in the development of individual economies and contributes to sustainability development.
The usual step in the analysis of customer satisfaction is the construction of so-called customer satisfaction indices. Customer satisfaction is measured for single products, for product lines, for companies, for entire sectors of the economy, and, finally, for national economies as a whole. Indices such as the ACSI (American Customer Satisfaction Index) or the ECSI (European Customer Satisfaction Index) are adapted to the different levels, calculated at regular time intervals, and monitored for time dynamics [25].
European Customer Satisfaction Index
Customer satisfaction can be attained by companies that have understood their customers’ needs and make every effort to provide services in an effective and efficient manner [22]. Consequently, service quality is clearly associated with customer satisfaction. The ECSI enables companies to assess their level of customer satisfaction. The ECSI is one of the well-established models for assessing customer satisfaction and its antecedents in predicting loyalty [26]. Using structural equation modeling, ECSI has been validated across many industries (e.g., electronic communications) and across several European countries.
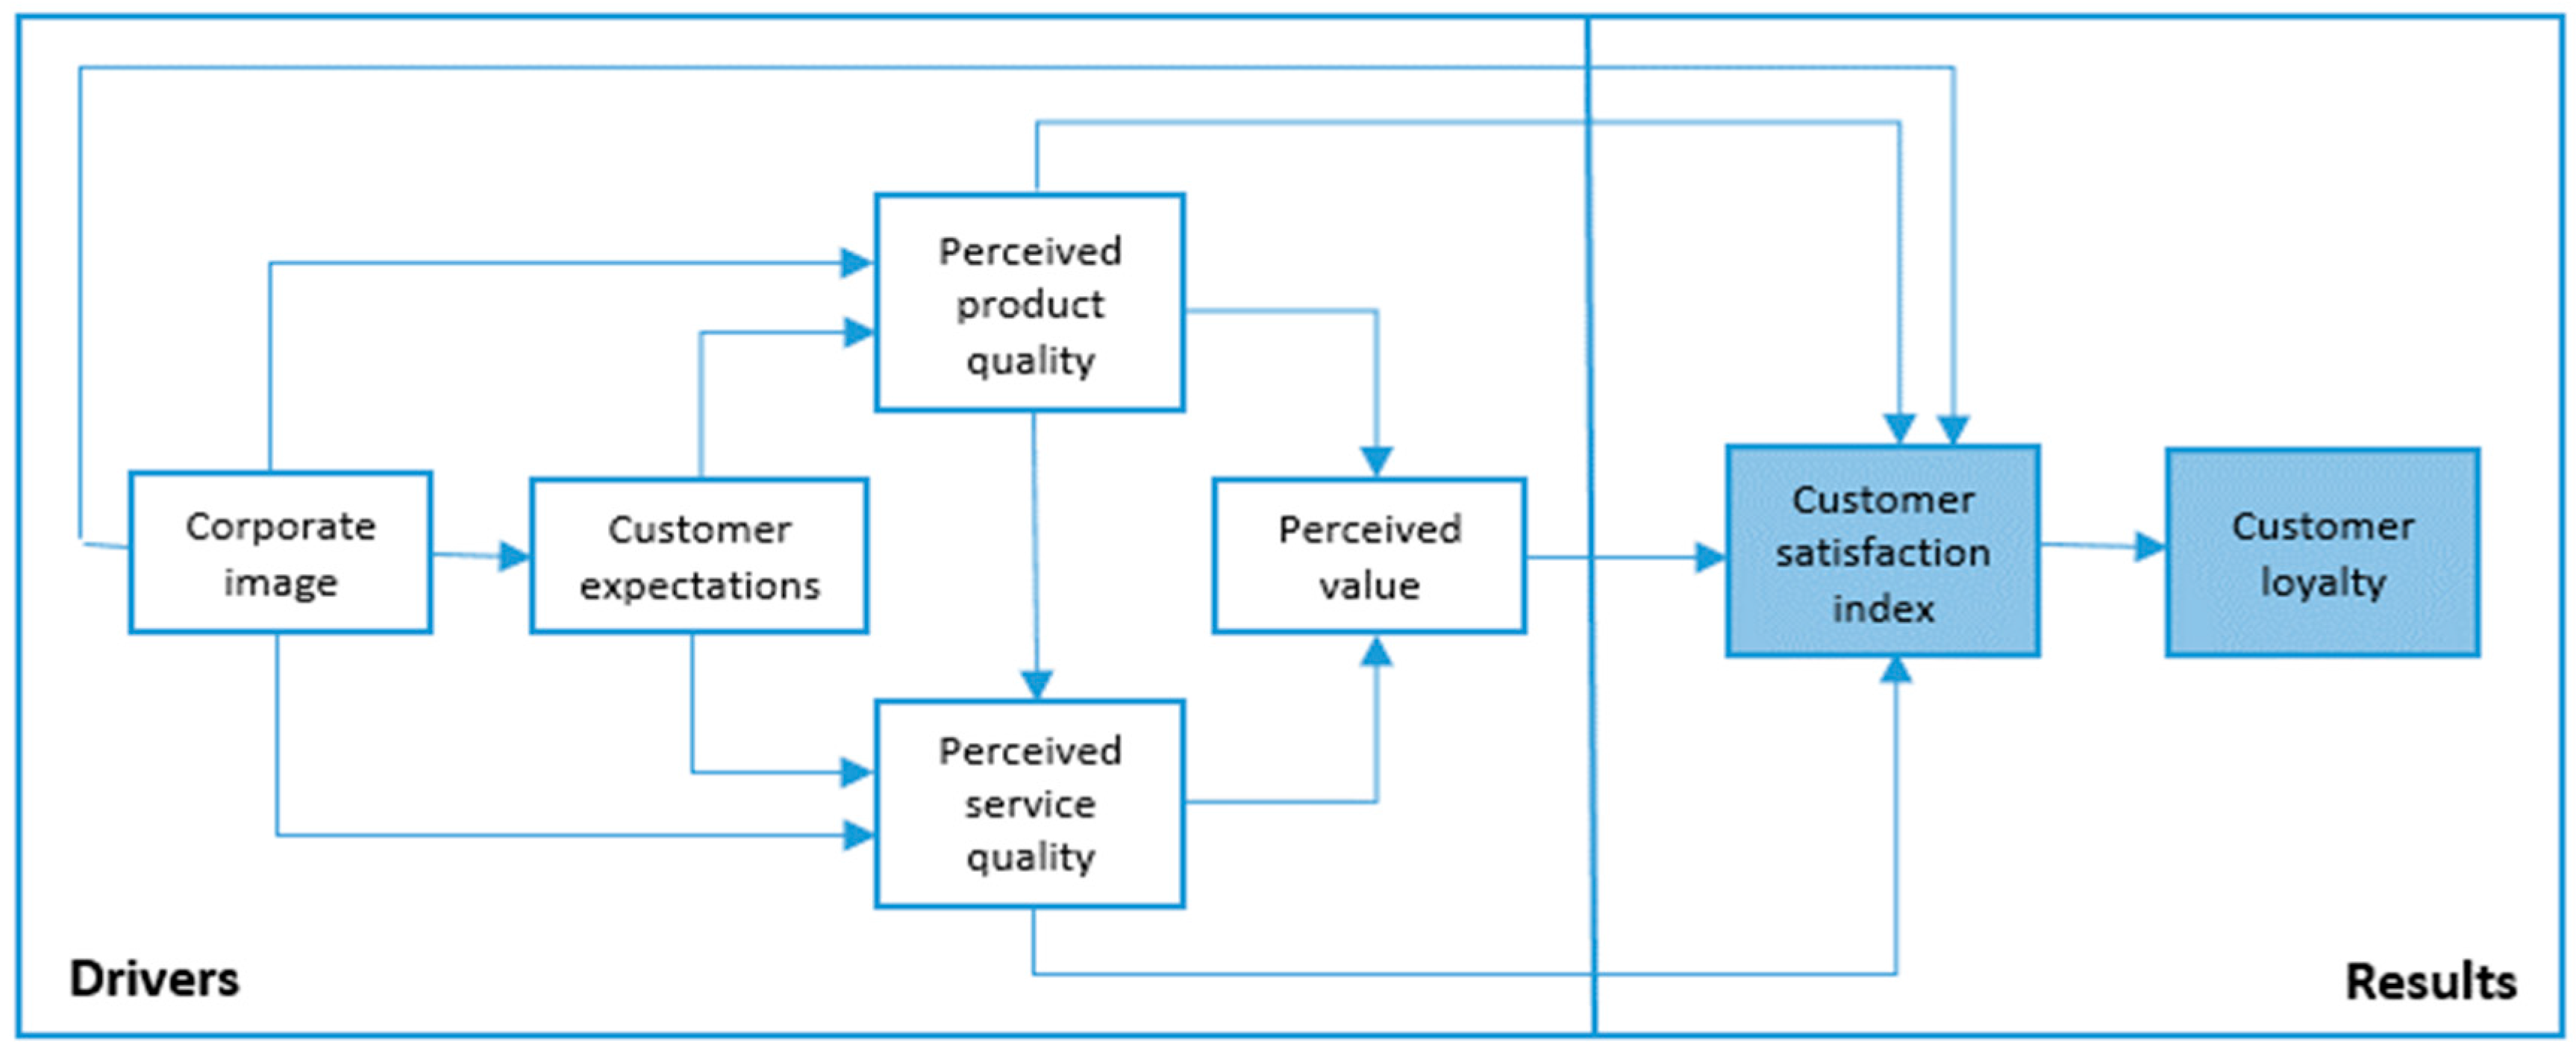
Customer satisfaction depends on many mutually interrelated factors [30]. The ECSI model monitors seven areas (variables) that have a determining impact on customer satisfaction: product/service/company image, customer expectations, customer perception, customer perceived value, customer satisfaction, customer complaints and customer loyalty. Relationships between the variables are shown in Figure 1. Clearly, the image plays a large role in the functioning of the enterprise; it represents the starting point of the satisfaction analysis. It refers to a service or product, brand, and business. The second point is the customer’s expectation. It is the result of product promotion on the market, and it directly influences customer satisfaction. The perceived value is expressed as the ratio of price and perceived quality. Customer complaints and loyalty have a mutually different meaning. Customer complaints are reflected in the negative impact on their expectations. On the contrary, customer loyalty is the result of a positive disagreement, and it is manifested by repeated purchases and price tolerance [27]. The measurement of customer satisfaction adheres to the microeconomic model of satisfaction.
Customer loyalty is fundamental to business success; it is recognized as a strategic priority and as an important asset to businesses [31]. Loyalty is important to a firm’s long-term success, profitability and sustainability [28,29,32]. Given the current situation, it is very challenging for mobile communications service providers to establish loyalty.
Many studies have shown that customer satisfaction is affected by variables that are indicators of customer loyalty or orientation toward a long-term relationship [27,28]. A satisfied customer's feelings about a service provider could motivate the customer to patronize the provider again and recommend the provider to other customers. Therefore, we posit the following hypothesis:
Hypothesis 1.
Customer satisfaction regarding mobile services has a positive effect on loyalty to telecommunications company.
Marketing literature provides empirical evidence on the relationship among corporate image, customer behavior and customer loyalty [33]. Corporate image leads to development of customer loyalty. Therefore, we posit the following hypothesis:
Hypothesis 2.
Image of telecommunications company has an effect on customer loyalty.
3. Materials and Methods
Our case study was focused on customer satisfaction analysis with quality of electronic communications services in Slovak electronic communications market, which has significant impacts on the future and sustainability of Slovak telecom providers. As a suitable method for this purpose, we chose the ECSI model, which can provide diagnostic of the complex relationships of the variables of customer loyalty and customer satisfaction and their impact to sustainability of Slovak telecom provider.
The subject of our research was the mobile services customers of a significant Slovak telecom provider. Slovak Telekom has a dominant position in Slovak electronic communications market and sustainability have become the important part of their strategy. The strategy of Slovak Telekom is in line with The National Policy for Electronic Communications for 2020 [19], which aims, in addition to economic growth, to a general improvement in the quality of life in society.
3.1. National Policy for Electronic Communications for 2020
The National Policy for Electronic Communications for 2020 [19] sets the priorities of the Government of the Slovak Republic to ensure the creation of conditions for the provision of modern, accessible, high quality, secure and interoperable electronic communication services that meet the highest requirements of the advanced economy.
The National Policy for Electronic Communications for 2020 outlines new goals in terms of technological progress, strategy, legislation, standardization and competence at national and European level in electronic communications. By pursuing these goals, in addition to economic growth, an overall improvement in the quality of life in society is expected, with developed electronic communications services contributing to easier and faster access to government services, business, banking, and increase the security and efficiency in transport, education, health and other sectors of the economy. The National Policy for Electronic Communications for 2020 is based on the current state of electronic communications in the Slovak Republic and in Europe, taking into account the development of services and technologies in the electronic communications sector. The results of the statistical findings show some important information on the use of mobile services in Slovakia [19].
The number of active SIM cards in mobile networks in Slovakia reached in 2014 about 6.38 million units, which is an increase of almost 137 thousand compared to 2013. The number of subscribers of mobile networks with invoiced services also grew steadily, even at the expense of prepaid cards, which fell slightly year-on-year (about eight thousand).
Comparing voice service in mobile and fixed networks, it is possible to state that [19]:
- Mobile network services are on the rise and fixed network services are decreasing (approximately 10% in 2014 compared to 2013).
- Operation in mobile networks is several times higher than in fixed networks (e.g., the number of internal calls in mobile networks is more than 18 times higher than in fixed networks, while average call time in the mobile network about 2.1 min and in the fixed network about 4.3 min).
3.2. Slovak Telekom Customer Satisfaction
The principles of corporate responsibility have become a permanent part of Slovak Telekom philosophy and strategy. In the area of corporate responsibility, Slovak Telekom tries to improve the quality of life of all stakeholders touched (customers, employees, and contractors), including economic, social and environmental stakes. Slovak Telekom’s approach contributes to greater satisfaction of its customers, who are a very important stakeholder.
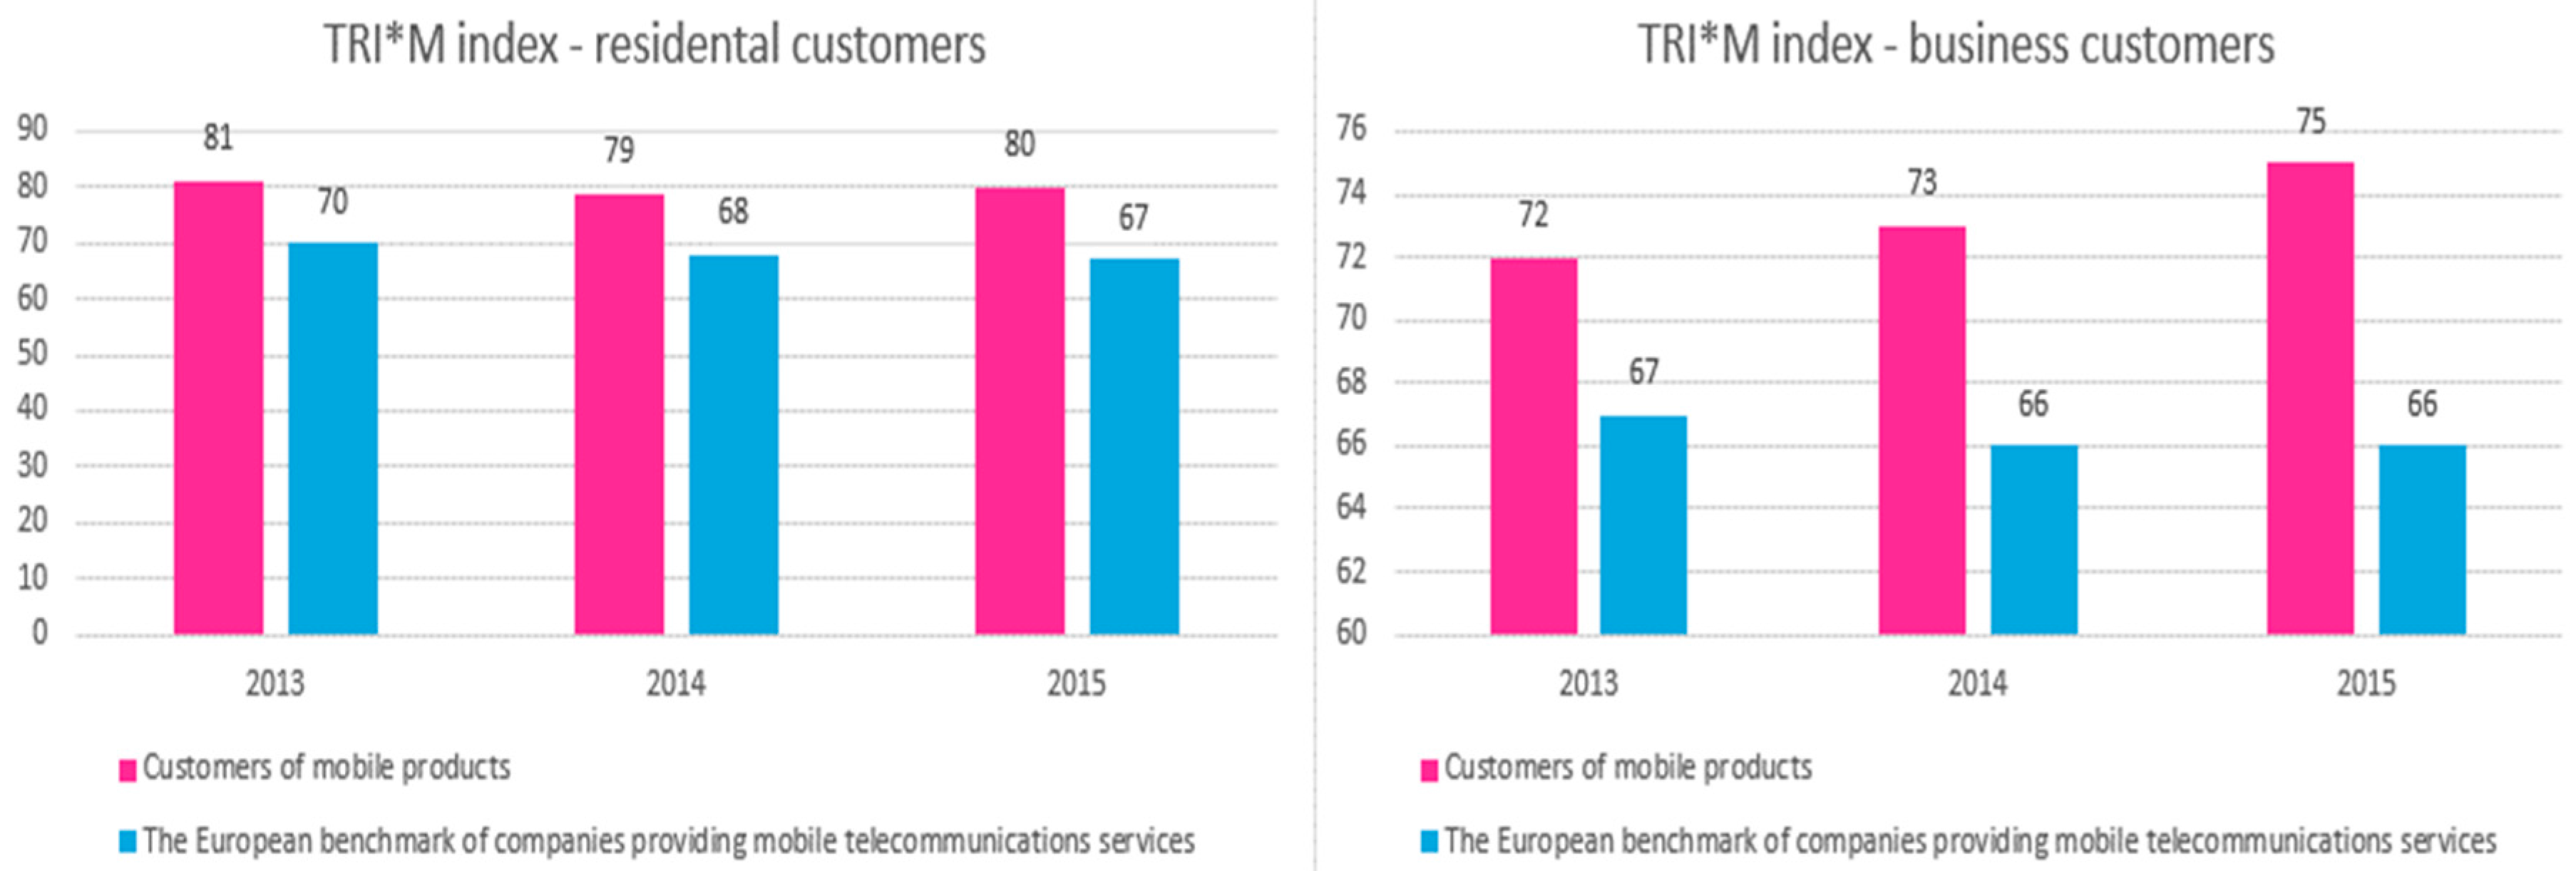
Slovak Telekom receives feedback from their customers primarily through the automatic ICCA (International Customer Contact Analysis) system, which runs surveys among customers directly after they contact a call center or technical hotline, visit a Telekom Centre or meet a sales representative. Thus, Slovak Telekom obtains feedback on-line, which allows for an immediate response in terms of changes in processes, communication or the environment where Slovak Telekom meets their customers. The main tool to measure customer satisfaction is the TRI*M survey, conducted quarterly by an independent research agency. The result of this survey is the TRI*M index (customer satisfaction and loyalty index), which allows benchmarking not only against other telecommunications operators in Slovakia and across Europe, but also against a variety of industries. According to the TRI*M customer satisfaction survey conducted during 2013–2015 (Figure 2 and Figure 3), the company managed to maintain a high level of customer satisfaction [34].
3.3. ECSI Application to Evaluate Quality of Mobile Communications Services
We used ECSI model´s application to evaluate quality of mobile communications services in term of customer satisfaction. The ECSI Model represents one of the possible models to quantify customer satisfaction. ECSI introduces seven latent variables (image, expectations, perceived quality, perceived value, customer satisfaction, customer complaints, and customer loyalty) corresponding to the areas of interest examined. Each of these latent variables is determined by several measurable variables. These measurable variables are each defined within one measurable scale (e.g., on a scale from 1 to 10, where 1 is the worst rating and 10 is the best rating). The number and exact definition of measurable variables for individual latent variables varies depending on the type of research level, i.e., in which industry, country, etc., research is being carried out.
This model is based on the use of a questionnaire survey among the customers of the given company or organization, which gives the primary input data (point ratings). In the questionnaire, questions are constructed as the type of the multi-step Likert scale, with 3–7 questions (depending on the number of suggested measurable variables) to model each latent variable. In addition, it is also necessary to determine the severity of the individual measurable variables [24].
Application of ECSI model within the research itself consisted of the following steps:
- Specification of measurable variables for ECSI model;
- Determining the importance of individual measurable variables;
- Converting measurable variables into questionnaire scale questions; and
- Calculation of ECSI index.
3.3.1. Calculation of ECSI index
Based on the values obtained from customers through a questionnaire survey, customer satisfaction index (CSI) according to Equation (1) was calculated for each latent variable. We calculated the CSI based on the general weighted arithmetic mean. Total satisfaction index values, calculated as the average of all customer indices, are expressed as a percentage. From these values, the overall value of the ECSI index was averaged [35].
where Ii is the satisfaction index of i-th customer; is the value of j-th measurable variable for i-th customer; n is the amount of measurable variables; X is the scale extent (typically 10); wj is the weight of j-th measurable variable.
The weights of measurable variables wj can be entered by the user or they are calculated as a covariance between the value of xji and yi, where yi is the sum of all measurable variables for the j-th latent variable that is divided by the number of these measurable variables [35].
where wj is the weight of j-th measurable variable; is the value of j-th measurable variable for i-th customer; n is the amount of measurable variables; Pj is the average of j-th measurable variable for all respondents; Ri is the average of values of all measurable variables for i-th respondent; and Rt is the average of values of all measurable variables for all respondents.
To calculate customer satisfaction indices for each latent variable, the “Customer Satisfaction Index Calculation Application” was used. XLStat is the leading data analysis and statistical solution for Microsoft Excel®. The XLStat statistical analysis offers a wide variety of functions to enhance the analytical capabilities of Excel, making it the ideal tool for data analysis and statistics requirements. The statistical software program XLStat was used to analyze the values of latent and measurable variables. This program contains a Partial Least Squares Path Modeling module (PLS-PM). PLS-PM is a statistical approach for modeling complex multivariable relationships (structural equation models) among measurable and latent variables. PLS-PM module was used to analyze the values of latent and measurable variables and for calculating correlations and regressions of individual variables.
Latent variable is the result of the interaction of several variables. Examining the impact of individual measurable variables allows us to better understand the nature of the phenomena. It investigates the dependence of latent variables and the relationships between measurable and latent variables by simple and multiple regression and correlation.
In ECSI model, corporate image is the main route to predict loyalty, while satisfaction, complaint handling and trust are also important. Although there is no direct effect of perceived quality, perceived value and expectation on loyalty, their total impact is considerable which is mediated through satisfaction [36]. The application of the ECSI model, which includes the implementation of the customer satisfaction survey with the mobile communications services of the company, has enabled us to find out what is the real satisfaction of Telekom customers. Based on this, primary research was carried out.
3.3.2. Selection Group Size and Quota Selection
The target audience consisted of Telekom customers using the mobile communications services the company provides. The core group was 2,226,000 mobile network customers, and it was used as a basis for the calculation of the sample and the exact number of respondents (the minimum sample). To ensure a sufficient level of reliability, professionalism and the report value of the conducted survey, the minimum sample size of the respondents at 95% confidence and the maximum error range of 8% is 151 respondents. For our sample to be as representative as possible, we have chosen to apply the quota selection method. We have based it on dividing the core group (Telekom mobile customers) into two customer groups. Flat-rate customers (Happy, “No-obligation”) and customers who use prepaid services (Easy, Easy Fix). To ensure the representativeness of the research results, it was necessary to address 112 respondents who use flat rates and 39 respondents who use prepaid services. Primary data for the satisfaction survey of customers with Telekom´s mobile communications services were collected by the query technique, namely through a questionnaire survey. This was an electronic questionnaire built on Google Docs. The questionnaire was distributed mostly via the hypertext link on the Facebook social network, but various discussion forums and dissemination portals were also used.
4. Results
Using the theoretical knowledge and results of customer satisfaction survey, we got information about determinants which have impact on the sustainability of the electronic communications service provider (Slovak Telekom, Bratislava, Slovakia). The application of ECSI model enabled better understanding the potentially complex relationships between customer loyalty and customer satisfaction and to determine their impact on the corporate sustainability of Slovak Telekom in electronic communications market.
The application of the ECSI model consisted of the identification of measurable variables determining quality of mobile communications services and its assessment of their relevance by Telekom’s customers. Two correlation matrices were created to evaluate relations between latent variables and measurable variables. Based on this, we could identify the relationship between customer satisfaction and customer loyalty as important elements of customer-based corporate sustainability. Based on the results, we took an opinion on the hypotheses.
4.1. Determining Measurable Variables and Assessing Their Relevance for ECSI Model
For the application of the ECSI model to the mobile communications market and the particular provider, it was first necessary to define the variables that we would monitor and measure at the provider. In Table 2, we present individual sets of measurable variables that we assigned to each of the seven areas (latent variables) that the ECSI model monitors.
The weights of measurable ECSI variables can be determined in two ways. The first option is to set up balances by experts from the electronic communications sector. The second option is to calculate the weights according to Equation (2). Table 2 lists the weights of the individual measurable variables of each latent variable. Based on these weights, we calculated customer satisfaction indices for each latent variable.
4.2. Interpretation of Outputs Acquired from XLStat Software
Evaluating the outputs with the primary data using the XLStat Software, two correlation matrices were processed. The first matrix (Table 3) contains correlation coefficients for each latent variable. The second matrix contains correlation coefficients for individual measurable variables (Table 4 and Table 5).
5. Discussion
Liberalization and fast growing demand, which translate to market opportunities, have led to many new and well-established companies entering the electronic communications market, resulting in a crowded, highly competitive business environment with numerous providers offering a wide range of electronic communications services. To keep one’s position in the electronic communications market, providers need to constantly monitor customers’ needs and requirements regarding the quality of the provided services. The customer satisfaction with the provided services as a feedback is also very important. Quality of services and customer satisfaction are becoming an important factor of customer-based corporate sustainability for all providers on the electronic communications market.
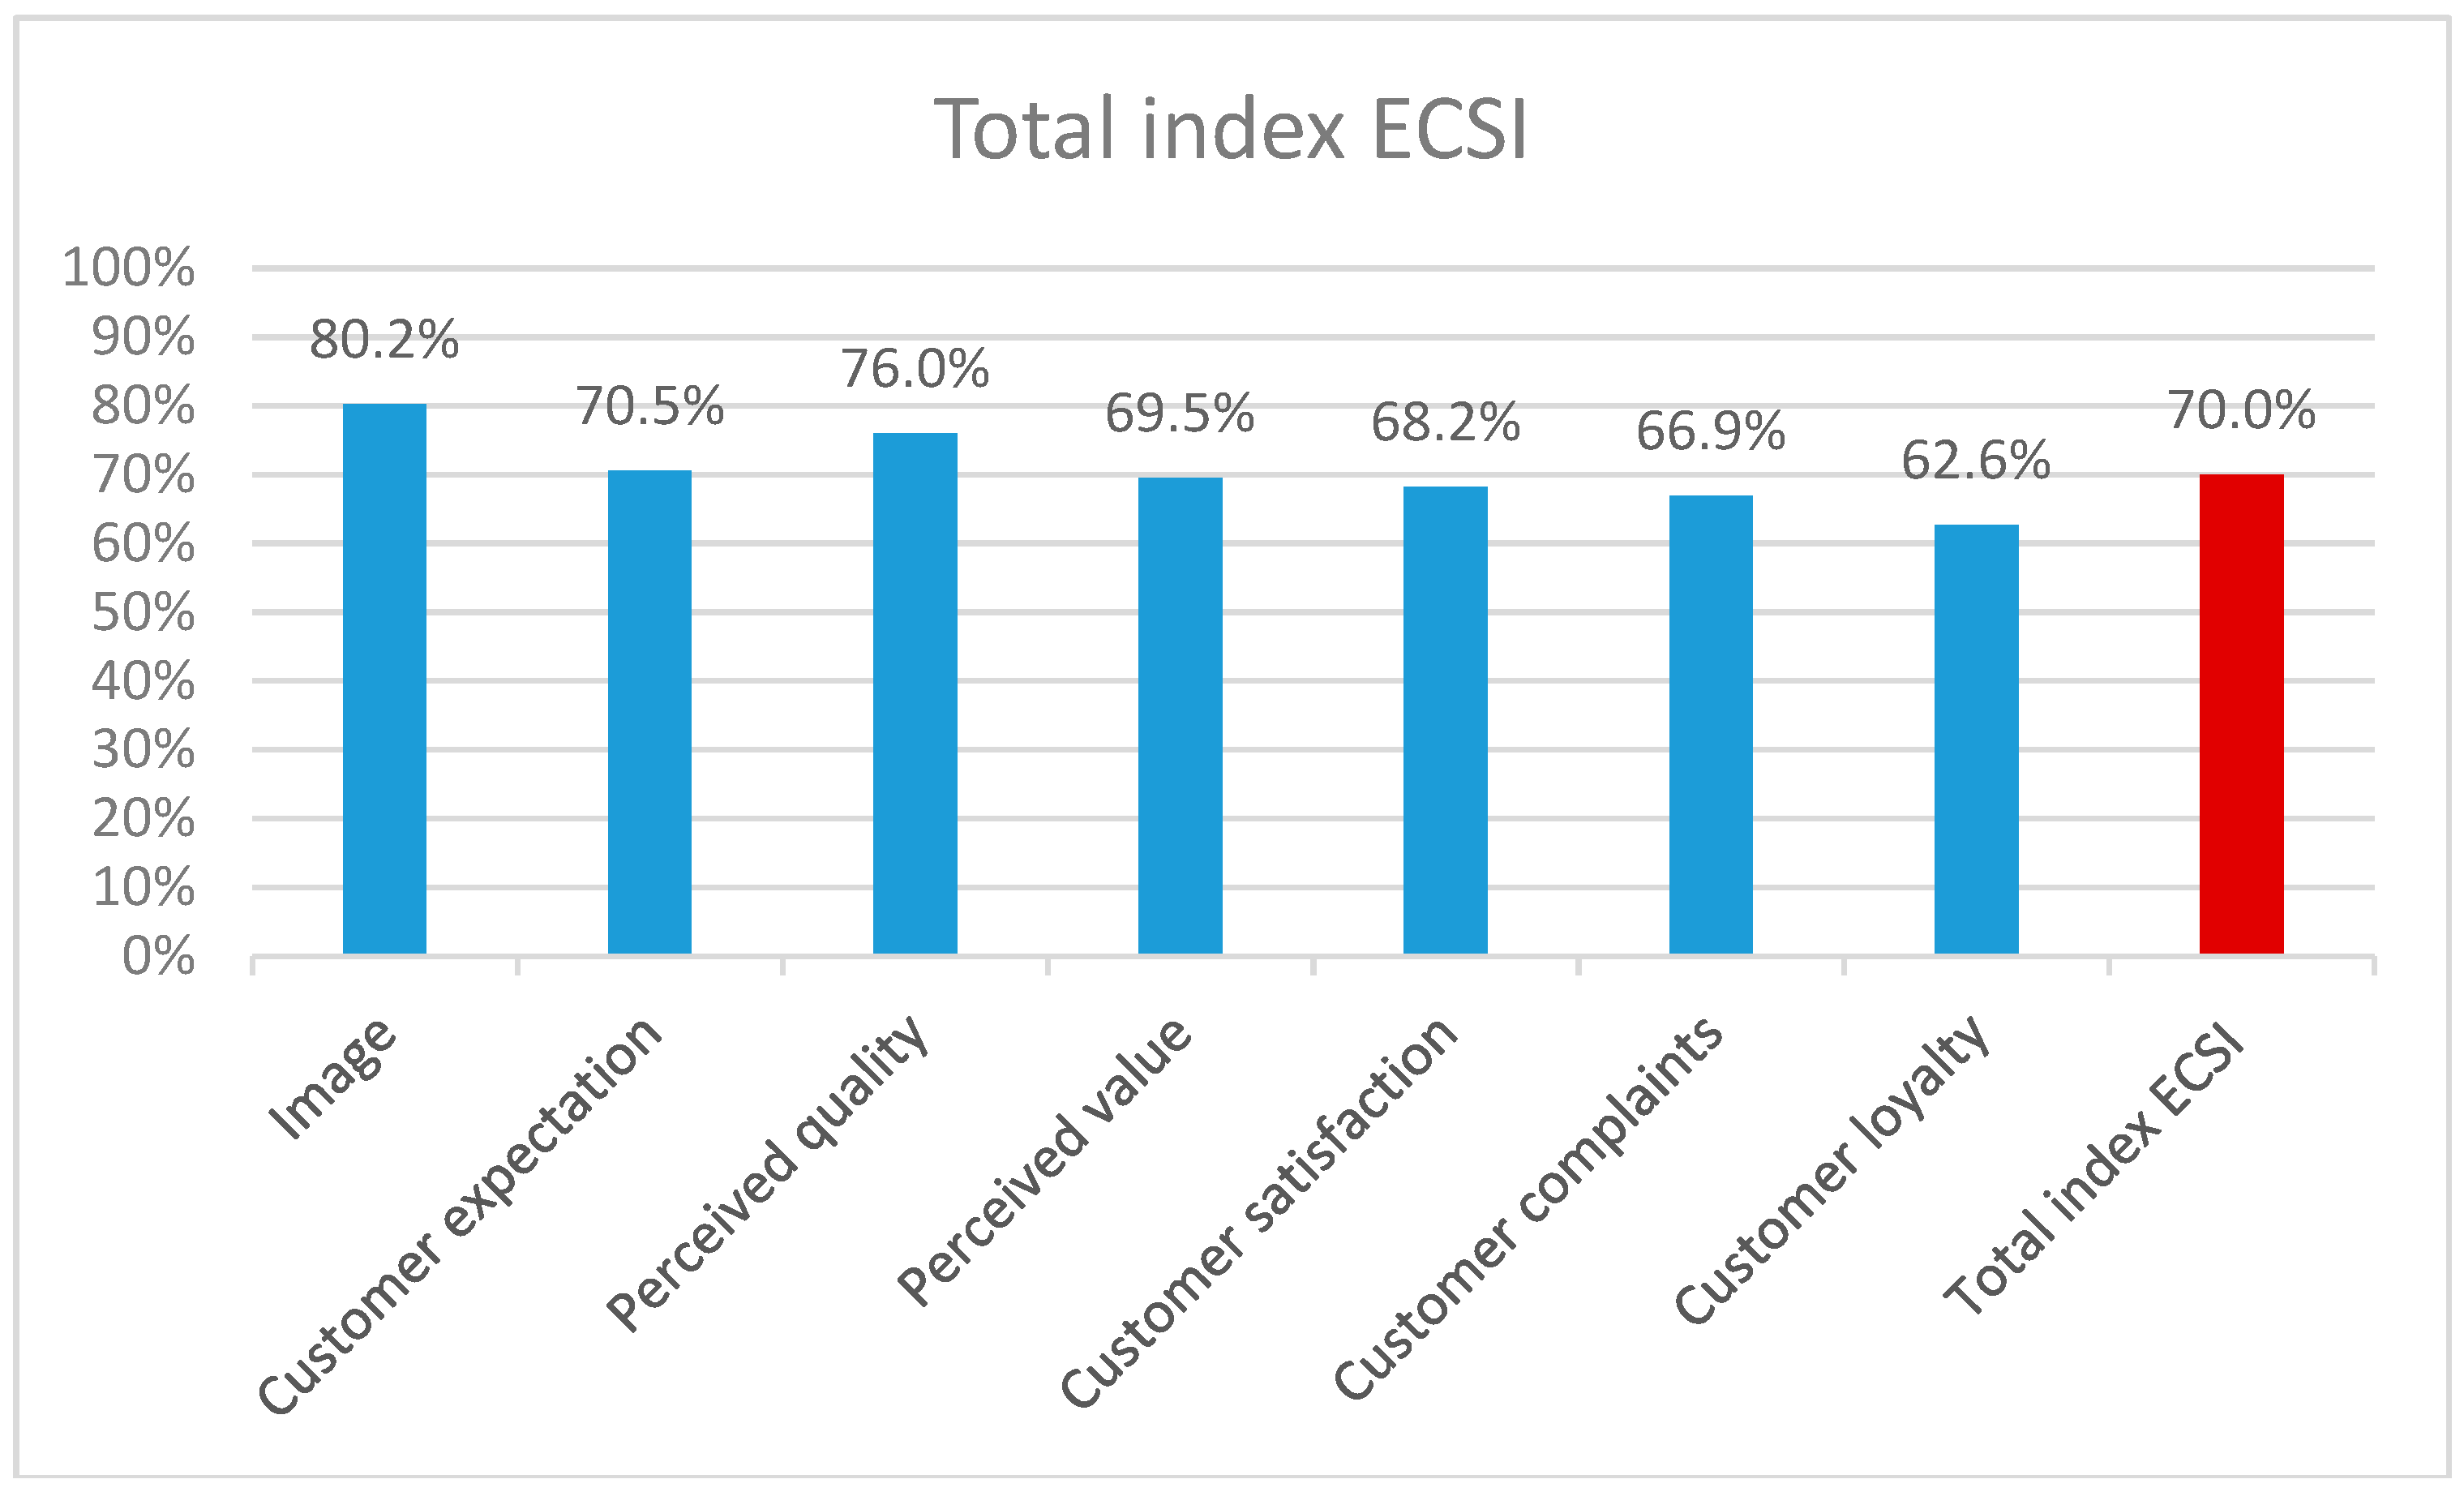
Customer value, customer satisfaction and customer loyalty are perceived as an element for sustainable business model and as the main indicator of success contributing to customer-based corporate sustainability [2]. Total customer satisfaction index reached 70.0%, which represents a positive result for the satisfaction of customers with Telekom’s mobile communications services. Customers rate the company’s mobile communications services rather positive, at the top half of the scale (Table 6).
Nevertheless, Telekom still has room to improve its services in all seven latent variables. It is necessary to eliminate negative customer experience with the services and prices offered and thus to improve the overall image of the company. This statement is also confirmed by the values of other related indices such as complaints, satisfaction and value perceived by customers.
Telekom should focus in particular on the area of customer loyalty, which represents the lowest value among all satisfaction indices, namely 62.6%. The lowest percentage of CSI suggests that customers feel low loyalty to the company. However, the loss of customer loyalty is only the result of company’s mistakes that begin with the service itself. The low value of customer loyalty towards the provider, in our opinion, stems from the orientation of providers towards new customers instead of focusing on the satisfaction of those who are their loyal customers.
When comparing the TRI*M customer index of Slovak Telekom mobile services (Figure 2) with the total customer satisfaction index (Figure 4), a certain difference is visible. According to regular Slovak Telekom measurements [34], satisfaction is at 80% for home customers, with ECSI model´s satisfaction being only 70%. However, this is still above the European average in companies providing mobile communications services, which is 67%.
He and Li [10] showed that customer loyalty has a positive influence on corporate sustainability. The impact is mediated by customer satisfaction and by image of company. We hypothesized that customer satisfaction regarding mobile services has a positive effect on loyalty to telecommunications company (Hypothesis 1). From the results of the correlations between the latent variables, it is clear that there is a positive influence between customer satisfaction and loyalty to Slovak Telekom, but the correlation coefficient of 0.308 only shows a mean correlation (Table 3). Customer loyalty is most affected by the perceived value (0.606). A comparable correlation was recorded on the perceived quality (0.372) and customer complaints (0.386). According to the principles of customer-based corporate sustainability, Slovak Telekom needs to focus on perceived value and perceived quality of service from the point of view of customers. The offer of services (in terms of technical dimension) of Slovak telecommunication providers is similar. Therefore, to support loyalty to Slovak Telekom, it is necessary to look at mainly the functional dimension of quality and perceived value [20,21]. Our results confirm (Table 3) that, in terms of loyalty, perceived value is very important (0.606). It is expressed by the ratio of quality and price, as well as by the benefits that the customer expects. The important variables that affect perceived value are the price level compared to competitors, the level of communication activities, the position of the Slovak Telekom on the electronic communications market compared to the competition, the quality of the staff (qualification, professionalism, willingness, and appearance), comfort, and environment. These variables should be the subject of our next research.
We hypothesized that the image of telecommunications company has an effect on customer loyalty (Hypothesis 2). From the results of the correlations between the latent variables, it is clear that there is a positive influence between company´s image and loyalty to Slovak Telekom. However, the correlation coefficient of 0.190 only shows a small correlation (Table 3). Correlation coefficients of individual measurable variables (Table 4 and Table 5) relating to customer loyalty in some cases even point to a negative correlation. Some indicators of the company’s image have a negative impact on company’s loyalty (e.g., unified appearance of provider’s personnel (uniform), comprehensibility of materials, brochures and webpages). The same applies to indicators of perceived quality (e.g., customer service and support: My Telekom, Telekom app, and Telekom forum) and indicators of customer expectation (e.g., the expectation of quality of services). These negative correlations again point to the need for increased attention to the functional dimension of quality [20,21] (confidence in Slovak Telekom’s activities, stability of Slovak Telekom, tradition, reputation, brand, flexibility and innovation).
In the area of electronic communications services, the Communications Customer Satisfaction Survey was conducted [37]. Oracle collaborated with the independent research firm Coleman Parkes. The survey was conducted worldwide, involving 4000 respondents—mobile users, users of fixed lines, broadband internet and prepaid television services. The survey showed:
- Only less than a tenth of respondents (9%) remain with their provider because they are satisfied with their services;
- 16% of the survey participants would change the provider, but they are bound by a long-term contract with the current provider; and
- Improving customer service would reduce their exit to competition by 18% [37].
Customers do not feel loyalty to electronic communications service providers today. In their approach, the main reason is the comfort and apathy, not the loyalty to electronic communications service provider. Oracle’s Communications Customer Satisfaction Survey results show that people feel that there are no better alternatives available. Their customer experience with electronic communications service providers is predominantly considered to be weak.
Customers feel that competing providers of electronic communications services do not offer better services, or they are not aware that there are better offers. They believe that all providers operate more or less the same way—39% of respondents said this in the survey.
The survey shows that electronic communications service providers who want to attract new customers and keep current ones have to break the apathy of users. Providers who manage to reach out to unsatisfied customers of their competitors can significantly increase market share. However, electronic communications service providers must offer a better experience and be fairly differentiated from competitors.
We offer some suggestions for electronic communications services providers in respect of strategy to enhance quality of services, which could help retain their customers´ loyalty. Electronic communications services providers should emphasize retaining existing subscribers as well as attracting defected customers from competitors through loyalty programs and word-of-mouth marketing. To achieve these strategies, we offer the following suggestions:
- Electronic communications services providers need to pay attention to developing distinguished and competitive value-added services to increase satisfaction of customers towards overall service quality.
- Electronic communications services providers should not only have competitive promotions but also make the best use of various channels in different campaigns to avoid imitation from competitors.
Today, the electronic communications market is experiencing rapid development. New technologies are emerging around the world, especially the 4G and LTE networks. People are using an ever wider range of devices for data communication. Providers must therefore reconsider their customer service strategy and ensure that they meet current user requirements and their new “digital” lifestyle.
Customer satisfaction and customer loyalty are recognized as an important part of corporate strategy and a key driver of firm long-term profitability, market value and corporate sustainability. The purpose of this study was to provide information about the customer satisfaction indices and show the results of ECSI study carried out in Slovak electronic communications sector. ECSI model provided better and in-depth understanding of the potential complex relationships of the determinants of customer loyalty and customer satisfaction and their impact to sustainability of Slovak telecom provider.
The results of the measurements presented in the study may contribute to improving the performance of the electronic communications provider. Based on the results, the company can adjust its competitive strategy, direct its activity to improve service quality and strengthen customer-based corporate sustainability. A key reason for the implementation of the ECSI model is to predict the future development on Slovak electronic communications market, customer behavior and support for marketing ideas in line with customer-based corporate sustainability.
6. Conclusions
Complexity in measuring company sustainability results from the multidimensional nature of the concept itself and from how it affects different corporate contexts. It is essential to consider overall sustainability (the aggregate of economic, environmental and social dimensions) to make the right strategic decisions. Many marketing and management studies [1,2,4,5,6,7] have focused on measuring the company’s sustainability. There are several measurement tools such as quality sustainability initiatives, benchmarking standards, and survey-based approaches. Although corporate sustainability attracts considerable attention among marketing scholars, its current measures do not sufficiently capture the perception of the most important stakeholder group—customers—and often overlook its relationship to important customers. Incorporating customer satisfaction indices into a sustainable business model would solve this problem in part. Customer relationship management should also be part of the concept of corporate sustainability and part of its development strategy. In this paper, we identify the dimensions of customer-based corporate sustainability. It is important that customers evaluate electronic communications service providers differently from other stakeholders (e.g., regulatory authority for electronic communications services). Their rating will affect electronic communications service providers’ behavior towards customers, quality of services and providers’ sustainability on the electronic communications market. Our future research will build on the results presented in this paper, focusing more on customer perceived value and perceived quality, customer care, and how factors other than customers satisfaction and image influence the customer loyalty.
Author Contributions
M.S. conceived and designed the experiments; M.S. performed the experiments and analyzed the data; J.G. contributed analysis tools; and M.S. and J.G. wrote the paper.
Acknowledgments
This contribution is a partial output of the project VEGA 1/0152/18 Business models and platforms in digital space.
Conflicts of Interest
The authors declare no conflict of interest.
References
- Behnam, S.; Cagliano, R. Be Sustainable to Be Innovate: An Analysis of Their Mutual Reinforcement. Sustainability 2017, 9, 17. [Google Scholar] [CrossRef]
- Dewan, M.N.A.; Chowdhury, M.M.H.; Quaddus, M.A. Three Dimensional Components of e-Business Sustainability. In E-Business and Telecommunications (ICETE); Book Series: Communications in Computer and Information Science; Springer: Berlin, Germany, 2012; Volume 455, pp. 55–71. [Google Scholar]
- Turkyilmaz, A.; Oztekin, A.; Zaim, S.; Demirel, O.F. Universal structure modeling approach to customer satisfaction index. Ind. Manag. Data Syst. 2013, 113, 932–949. [Google Scholar] [CrossRef]
- Moisescu, O.I. From perceptual corporate sustainability to customer loyalty: A multi-sectorial investigation in a developing country. Econ. Res. Ekon. Istraz. 2018, 31, 55–72. [Google Scholar] [CrossRef]
- Amini, M.; Bienstock, C.C. Corporate sustainability: An integrative definition and framework to evaluate corporate practice and guide academic research. J. Clean. Prod. 2014, 76, 12–19. [Google Scholar] [CrossRef]
- Baumgartner, R.J. Managing corporate sustainability and CSR: A conceptual framework combining values, strategies and instruments contributing to sustainable development. Corp. Soc. Responsib. Environ. Manag. 2014, 21, 258–271. [Google Scholar] [CrossRef]
- Van Marrewijk, M. Concepts and definitions of CSR and corporate sustainability: Between agency and communion. J. Bus. Ethics 2003, 44, 95–105. [Google Scholar] [CrossRef]
- De los Salmones, M.G.; Crespo, A.H.; del Bosque, I.R. Influence of corporate social responsibility on loyalty and valuation of services. J. Bus. Ethics 2005, 61, 369–385. [Google Scholar] [CrossRef]
- Vlachos, P.A.; Tsamakos, A.; Vrechopoulos, A.P.; Avramidis, P.K. Corporate social responsibility: Attributions, loyalty and the mediating role of trust. J. Acad. Mark. Sci. 2009, 37, 170–180. [Google Scholar] [CrossRef]
- He, H.; Li, Y. CSR and service brand: The mediating effect of brand identification and moderating effect of service quality. J. Bus. Ethics 2011, 100, 673–688. [Google Scholar] [CrossRef]
- Lee, S.; Park, E.; Kwon, S.J.; del Pobil, A.P. Antecedents of behavioral intention to use mobile telecommunication services: Effects of corporate social responsibility and technology acceptance. Sustainability 2015, 7, 11345–11359. [Google Scholar] [CrossRef]
- Johnson, W.C.; Anuchit, S. Service quality in the Thai telecommunications industry: A tool for achieving a sustainable competitive advantage. Manag. Decis. 2002, 40, 693–701. [Google Scholar] [CrossRef]
- Khan, M.A. Evaluating the Deming Management Model of Total Quality in Telecommunication Industry in Pakistan—An Empirical Study. Int. J. Bus. Manag. 2010, 5, 46–59. [Google Scholar]
- Hsu, C.-M.; Chao-Ton, S. Quality management practices in Taiwan’s telecommunications industry. Meas. Bus. Excell. 2002, 6, 42–46. [Google Scholar] [CrossRef]
- McCalla, C.; Whitt, W. A Time-Dependent Queueing-Network Model to Describe the Life-Cycle Dynamics of Private-Line Telecommunication Services. Telecommun. Syst. 2002, 19, 9–38. [Google Scholar] [CrossRef]
- Andrade, R.; Lisser, A.; Maculan, N.; Plateau, G. Telecommunication Network Capacity Design for Uncertain Demand. Comput. Optim. Appl. 2004, 29, 127–146. [Google Scholar] [CrossRef]
- Wedde, H.F.; Muddassar, F. A comprehensive review of nature inspired routing algorithms for fixed telecommunication networks. J. Syst. Archit. 2006, 52, 461. [Google Scholar] [CrossRef]
- Matias, J.C.O.; Reis, M.; Azevedo, S.G. Framework to analyse the Influence of Quality on Customer Satisfaction in the Mobile Telecommunication Sector. Qual. Access Success 2015, 16, 85–92. [Google Scholar]
- National Policy for Electronic Communications for 2020. Available online: https://www.mindop.sk/ministerstvo-1/elektronicke-komunikacie-8/strategicke-dokumenty/politika/narodna-politika-pre-elektronicke-komunikacie-do-roku-2020-uznesenie-vlady-sr-c-540-2015 (accessed on 30 April 2018).
- Jankalova, M. Service Quality—Object of Business Excellence Measuring. Rev. Eur. Stud. 2016, 8, 71–84. [Google Scholar] [CrossRef]
- Rostasova, M. Kvalita Služieb Vnímaná Zákazníkom; EDIS: Žilina, Slovakia, 2008; p. 74. ISBN 978-80-8070-894-8.
- Harris, M.; Harrington, H.J. Service quality in the knowledge age: Huge opportunities for the twenty-first century. Meas. Bus. Excell. 2000, 4, 31–36. [Google Scholar] [CrossRef]
- Mateides, A.; Dado, J. Manažérstvo Kvality; Epos: Bratislava, Slovakia, 2006; p. 751. ISBN 80-8057-656-4. [Google Scholar]
- Foret, M.; Stavkova, J. Marketingový Výzkum: Jak Poznávat Své Zákazníky, 1st ed.; Grada Publishing: Prague, Czech Republic, 2003; p. 160. ISBN 80-247-0385-8. [Google Scholar]
- Gasparini, M.; Pellerey, F.; Proietti, M. Bayesian hierarchical models to analyze customer satisfaction data for quality improvement: A case study. Appl. Stoch. Models Bus. Ind. 2012, 28, 571–584. [Google Scholar] [CrossRef]
- Vilares, M.; Coelho, P. The employee-customer satisfaction chain in the ECSI model. Eur. J. Mark. 2004, 37, 1703–1722. [Google Scholar] [CrossRef]
- Szwarc, P. Researching Customer Satisfaction & Loyalty: How to Find Out What People Really Think; Kogan Page: London, UK, 2005; p. 258. ISBN 978-0-7494-4336-8. [Google Scholar]
- Lam, S.Y.; Shankar, V.; Erramilli, M.K.; Murthy, B. Customer value, satisfaction, loyalty, and switching costs: An illustration from a business-to-business service context. J. Acad. Mark. Sci. 2004, 32, 293–311. [Google Scholar] [CrossRef]
- Helgesen, O. Are loyal customers profitable? Customer satisfaction, customer (action) loyalty and customer profitability at the individual level. J. Mark. Manag. 2006, 22, 245–266. [Google Scholar] [CrossRef]
- Mateides, A.; Dado, J. Služby: Teória Služieb, Marketing Služieb, Kvalita v Službách, Služby Zákazníkom a Meranie Spokojnosti s Nimi; EPOS: Bratislava, Slovakia, 2002; p. 725. ISBN 80-8057-452-9. [Google Scholar]
- Sarantidou, P. Enriching the ECSI model using brand strength in the retail setting. Eur. J. Manag. Bus. Econ. 2017, 26, 294–312. [Google Scholar] [CrossRef]
- Aksoy, L. How do you measure what you can’t define? The current state of loyalty measurement and management. J. Serv. Manag. 2013, 24, 356–381. [Google Scholar] [CrossRef]
- Ali, I. The Nexus between CSR, Corporate Image, Company Identification, Emotional Attachment and Small Equity Investors Behavior. Int. J. Appl. Behav. Econ. 2017, 6, 39–52. [Google Scholar] [CrossRef]
- Report on Responsible Business of Slovak Telekom for 2013, 2014, 2015. Available online: https://www.telekom.sk/o-spolocnosti-telekom/zodpovedne-podnikanie/sprava-o-zodpovednom-podnikani/ (accessed on 15 February 2018).
- Darena, F. Služba Výpočtu CSI pro PEF. Available online: https://akela.mendelu.cz/~darena/CSI/ (accessed on 15 January 2018).
- Askariazad, M.H.; Babakhani, N. An application of European Customer Satisfaction Index (ECSI) in business to business (B2B) context. J. Bus. Ind. Mark. 2015, 30, 17–31. [Google Scholar] [CrossRef]
- Prieskum: Poskytovatelia Komunikacnych Sluzieb Nedokazu Zaistit Spokojnost Svojich Zakaznikov. Available online: https://www.pcrevue.sk/en/community/article/detail/url/Prieskum--Poskytovatelia-komunikacnych-sluzieb-nedokazu-zaistit-spokojnost-svojich-zakaznikov (accessed on 12 April 2018).
Figure 1.
ECSI model (created by author).

Figure 2.
TRI*M customer index of Slovak Telekom mobile services for 2013–2015 (created by author).

Figure 3.
TRI*M customer index of Slovak Telekom fixed services for 2013–2015 (created by author).

Figure 4.
Total index of latent variables using specified weights.


Table 1.
Dimensions of quality in electronic communications services [21].
Table 1.
Dimensions of quality in electronic communications services [21].
| Dimension of Quality | Characteristics of Dimension |
|---|---|
| Technical dimension of quality | Includes the extent of the service, i.e., “what” is offered to the customer. In this case, quality is understood as the sum or level of the existing characteristics of a product. It is measured based on objective criteria. |
| Functional dimension of quality | It interprets “how” a particular service is offered. Thus, quality is defined as the characteristics of a product as perceived by the customer. Quality is measured based on subjective criteria. |
Table 2.
Group of latent and measurable variables used for ECSI model application.
| Latent Variables | Measurable Variables/Indicators | Weight of Importance | Average of Values | |
|---|---|---|---|---|
| Image | Imp1 | Appearance of provider’s stores | 3.0 | 7.9 |
| Imp2 | The unified appearance of provider’s personnel (uniform, …) | 2.6 | 8.2 | |
| Imp3 | Comprehensibility of materials, brochures and web pages (in terms of price specifications and technical parameters of services) | 2.5 | 8.4 | |
| Imp4 | Knowledge of the logo by the company’s customers | 2.7 | 7.6 | |
| Customer expectation | Exp1 | The expectation of quality of services provided by the company | 2.5 | 8.2 |
| Exp2 | The expectation of fast and ready to help personnel at the provider’s stores | 2.7 | 6.5 | |
| Exp3 | Expecting total customer satisfaction when leaving the store | 2.5 | 6.5 | |
| Perceived quality | Qua1 | Total perceived quality of services | 2.6 | 6.9 |
| Qua2 | Provider’s approach to new technologies | 2.8 | 7.0 | |
| Qua3 | Customer service and support (My Telekom, Telekom app, Telekom forum) | 3.1 | 6.1 | |
| Qua4 | Quality and availability of Telekom centers, customer line | 3.3 | 6.4 | |
| Qua5 | Selection of offered products and services | 3.1 | 6.5 | |
| Qua6 | Reliability and accuracy of provided services | 3.0 | 6.3 | |
| Qua7 | Clarity and transparency of provided information | 3.2 | 6.4 | |
| Qua8 | Professional competence of personnel | 2.2 | 7.3 | |
| Qua9 | Options for service modification | 2.2 | 7.1 | |
| Perceived value | Val1 | Evaluation of mobile calling services from the viewpoint of prices and parameters | 3.5 | 6.2 |
| Val2 | Evaluation of service quality in comparison with service prices | 3.2 | 5.9 | |
| Val3 | Evaluation of satisfaction with the amount and quality of offered benefits and discounts | 3.9 | 6.1 | |
| Val4 | Evaluating whether the company uses the appropriate form of marketing communication | 2.9 | 6.8 | |
| Customer satisfaction | Sat1 | Fulfilling expectations about the services the company provides to the customer | 3.8 | 6.7 |
| Sat2 | Overall satisfaction with the provider | 3.4 | 7.0 | |
| Customer complaints | Com1 | The provider always records complaints from the customer | 4.2 | 6.9 |
| Com2 | Provider’s approach to complaints handling | 4.1 | 6.7 | |
| Com3 | The speed of provider’s handling customer complaints/provider’s commenting on customer complaints | 3.7 | 6.4 | |
| Customer loyalty | Loy1 | Confirmation of Telekom’s re-selection as an provider | 3.1 | 6.3 |
| Loy2 | A customer‘s willingness to choose a competing provider if they offer a wider portfolio of services | 4.3 | 5.3 | |
| Loy3 | Evaluation of the customer’s willingness not to choose a competing provider if they offered the same services at significantly lower prices | 4.2 | 5.3 | |
| Loy4 | Evaluation of willingness to recommend one’s provider to a friend or family | 2.4 | 6.2 | |
| Loy5 | Evaluation of willingness to stay with the provider in the future | 2.7 | 5.4 | |
Table 3.
Correlation matrix of latent variables (Source: XLStat Software).
| Image | Customer Expectation | Perceived Quality | Perceived Value | Customer Satisfaction | Customer Complaints | Customer Loyalty | |
|---|---|---|---|---|---|---|---|
| Image | 1.000 | ||||||
| Customer expectation | 0.510 | 1.000 | |||||
| Perceived quality | 0.429 | 0.576 | 1.000 | ||||
| Perceived value | 0.282 | 0.398 | 0.502 | 1.000 | |||
| Customer satisfaction | 0.385 | 0.529 | 0.613 | 0.494 | 1.000 | ||
| Customer complaints | 0.339 | 0.581 | 0.666 | 0.469 | 0.508 | 1.000 | |
| Customer loyalty | 0.190 | 0.287 | 0.372 | 0.606 | 0.308 | 0.386 | 1.000 |
Table 4.
Correlation matrix of indicators I.
| Indicators | Imp1 | Imp2 | Imp3 | Imp4 | Exp1 | Exp2 | Exp3 | Qua1 | Qua2 | Qua3 | Qua4 | Qua5 | Qua6 | Qua7 | Qua8 | Qua9 |
|---|---|---|---|---|---|---|---|---|---|---|---|---|---|---|---|---|
| Imp1 | 1.00 | |||||||||||||||
| Imp2 | 0.43 | 1.00 | ||||||||||||||
| Imp3 | 0.41 | 0.50 | 1.00 | |||||||||||||
| Imp4 | 0.39 | 0.27 | 0.27 | 1.00 | ||||||||||||
| Exp1 | 0.47 | 0.38 | 0.61 | 0.40 | 1.00 | |||||||||||
| Exp2 | 0.14 | 0.21 | 0.02 | 0.04 | 0.03 | 1.00 | ||||||||||
| Exp3 | 0.25 | 0.22 | 0.07 | 0.07 | 0.10 | 0.39 | 1.00 | |||||||||
| Qua1 | 0.31 | 0.35 | 0.24 | 0.33 | 0.28 | 0.24 | 0.41 | 1.00 | ||||||||
| Qua2 | 0.38 | 0.36 | 0.33 | 0.29 | 0.32 | 0.32 | 0.25 | 0.39 | 1.00 | |||||||
| Qua3 | 0.29 | 0.34 | 0.37 | 0.32 | 0.37 | 0.21 | 0.28 | 0.45 | 0.67 | 1.00 | ||||||
| Qua4 | 0.24 | 0.34 | 0.18 | 0.16 | 0.22 | 0.14 | 0.35 | 0.40 | 0.54 | 0.61 | 1.00 | |||||
| Qua5 | 0.22 | 0.22 | 0.20 | 0.21 | 0.16 | 0.27 | 0.38 | 0.39 | 0.56 | 0.56 | 0.71 | 1.00 | ||||
| Qua6 | 0.18 | 0.19 | 0.10 | 0.32 | 0.19 | 0.27 | 0.31 | 0.36 | 0.53 | 0.64 | 0.56 | 0.57 | 1.00 | |||
| Qua7 | 0.13 | 0.25 | 0.27 | 0.10 | 0.18 | 0.34 | 0.32 | 0.32 | 0.59 | 0.64 | 0.66 | 0.61 | 0.62 | 1.00 | ||
| Qua8 | 0.14 | 0.22 | 0.00 | 0.08 | 0.15 | 0.47 | 0.38 | 0.38 | 0.37 | 0.37 | 0.44 | 0.34 | 0.32 | 0.42 | 1.00 | |
| Qua9 | 0.10 | 0.02 | 0.03 | 0.19 | 0.05 | 0.37 | 0.41 | 0.28 | 0.27 | 0.37 | 0.25 | 0.38 | 0.44 | 0.27 | 0.44 | 1.00 |
| Val1 | 0.19 | 0.20 | 0.10 | 0.17 | 0.09 | 0.41 | 0.25 | 0.38 | 0.21 | 0.27 | 0.20 | 0.37 | 0.32 | 0.27 | 0.24 | 0.40 |
| Val2 | 0.18 | 0.16 | 0.05 | 0.10 | 0.08 | 0.37 | 0.25 | 0.40 | 0.22 | 0.19 | 0.16 | 0.28 | 0.18 | 0.26 | 0.28 | 0.18 |
| Val3 | 0.12 | 0.14 | 0.02 | 0.29 | 0.09 | 0.26 | 0.18 | 0.24 | 0.31 | 0.30 | 0.29 | 0.18 | 0.34 | 0.33 | 0.42 | 0.41 |
| Val4 | 0.11 | 0.06 | 0.21 | 0.25 | 0.12 | 0.22 | 0.12 | 0.23 | 0.14 | 0.30 | 0.18 | 0.18 | 0.28 | 0.28 | 0.09 | 0.25 |
| Sat1 | 0.30 | 0.34 | 0.34 | 0.30 | 0.30 | 0.29 | 0.35 | 0.45 | 0.37 | 0.49 | 0.41 | 0.38 | 0.39 | 0.46 | 0.33 | 0.49 |
| Sat2 | 0.14 | 0.19 | 0.02 | 0.17 | 0.16 | 0.36 | 0.40 | 0.44 | 0.32 | 0.28 | 0.30 | 0.37 | 0.25 | 0.27 | 0.35 | 0.29 |
| Com1 | 0.37 | 0.28 | 0.16 | 0.30 | 0.39 | 0.22 | 0.38 | 0.48 | 0.38 | 0.44 | 0.40 | 0.37 | 0.41 | 0.23 | 0.40 | 0.45 |
| Com2 | 0.20 | 0.28 | 0.04 | 0.23 | 0.21 | 0.30 | 0.46 | 0.38 | 0.39 | 0.38 | 0.52 | 0.45 | 0.36 | 0.37 | 0.49 | 0.49 |
| Com3 | 0.06 | 0.22 | 0.03 | 0.09 | 0.06 | 0.45 | 0.43 | 0.29 | 0.27 | 0.26 | 0.33 | 0.49 | 0.37 | 0.37 | 0.40 | 0.45 |
| Loy1 | 0.15 | 0.21 | 0.04 | 0.32 | −0.01 | 0.25 | 0.28 | 0.41 | 0.27 | 0.28 | 0.20 | 0.24 | 0.34 | 0.22 | 0.31 | 0.37 |
| Loy2 | 0.04 | −0.08 | −0.12 | 0.13 | −0.08 | 0.21 | 0.25 | 0.11 | 0.08 | 0.05 | 0.07 | 0.18 | 0.21 | 0.15 | 0.22 | 0.22 |
| Loy3 | −0.13 | −0.11 | −0.16 | 0.11 | −0.13 | 0.29 | 0.15 | 0.03 | 0.08 | −0.01 | 0.02 | 0.09 | 0.24 | 0.18 | 0.29 | 0.17 |
| Loy4 | 0.11 | 0.05 | −0.02 | 0.08 | 0.05 | 0.13 | 0.11 | 0.14 | 0.08 | −0.01 | 0.12 | −0.02 | −0.01 | 0.13 | 0.06 | −0.07 |
| Loy5 | 0.13 | 0.03 | 0.10 | 0.12 | 0.14 | 0.16 | 0.11 | 0.01 | −0.02 | 0.02 | 0.04 | 0.01 | 0.06 | 0.03 | 0.03 | 0.08 |
(Source: XLStat Software).
Table 5.
Correlation matrix of indicators II.
| Indicators | Val1 | Val2 | Val3 | Val4 | Sat1 | Sat2 | Com1 | Com2 | Com3 | Loy1 | Loy2 | Loy3 | Loy4 | Loy5 |
|---|---|---|---|---|---|---|---|---|---|---|---|---|---|---|
| Val1 | 1.00 | |||||||||||||
| Val2 | 0.65 | 1.00 | ||||||||||||
| Val3 | 0.45 | 0.37 | 1.00 | |||||||||||
| Val4 | 0.32 | 0.15 | 0.49 | 1.00 | ||||||||||
| Sat1 | 0.36 | 0.22 | 0.37 | 0.36 | 1.0 | |||||||||
| Sat2 | 0.37 | 0.34 | 0.28 | 0.22 | 0.46 | 1.0 | ||||||||
| Com1 | 0.24 | 0.25 | 0.30 | 0.31 | 0.39 | 0.32 | 1.00 | |||||||
| Com2 | 0.29 | 0.23 | 0.37 | 0.20 | 0.36 | 0.46 | 0.60 | 1.00 | ||||||
| Com3 | 0.37 | 0.32 | 0.34 | 0.16 | 0.28 | 0.36 | 0.37 | 0.52 | 1.00 | |||||
| Loy1 | 0.48 | 0.47 | 0.46 | 0.25 | 0.30 | 0.27 | 0.37 | 0.31 | 0.34 | 1.00 | ||||
| Loy2 | 0.29 | 0.31 | 0.28 | 0.21 | 0.09 | 0.14 | 0.17 | 0.12 | 0.22 | 0.42 | 1.00 | |||
| Loy3 | 0.28 | 0.25 | 0.38 | 0.21 | 0.16 | 0.15 | 0.10 | 0.08 | 0.26 | 0.33 | 0.67 | 1.00 | ||
| Loy4 | 0.12 | 0.21 | 0.09 | 0.07 | 0.07 | 0.03 | 0.10 | 0.04 | 0.10 | 0.16 | 0.07 | 0.04 | 1.00 | |
| Loy5 | 0.15 | 0.05 | 0.17 | 0.25 | 0.12 | 0.03 | 0.08 | 0.04 | 0.01 | 0.04 | 0.11 | 0.06 | 0.58 | 1.00 |
(Source: XLStat Software).
Table 6.
Weights and values of customer satisfaction index for each latent variable.
| Latent Variables | Weights | CSI | CSI (%) |
|---|---|---|---|
| Image | 3.0; 2.6; 2.5; 2.7 | 0.8025 | 80.2% |
| Customer expectation | 2.5; 2.7; 2.5 | 0.7050 | 70.5% |
| Perceived quality | 2.6; 2.8; 3.1; 3.3; 3.2; 3.0; 3.2; 2.2; 2.2 | 0.7601 | 76.0% |
| Perceived value | 3.5; 3.2; 3.9; 2,9 | 0.6950 | 69.5% |
| Customer satisfaction | 3.8; 3.4 | 0.6824 | 68.2% |
| Customer complaints | 4.2; 4.1; 3.7 | 0.6694 | 66.9% |
| Customer loyalty | 3.1; 4.3; 4.2; 2.4; 2.7 | 0.6263 | 62.6% |
| Total customer satisfaction index | 0.7001 | 70.0% |
© 2018 by the authors. Licensee MDPI, Basel, Switzerland. This article is an open access article distributed under the terms and conditions of the Creative Commons Attribution (CC BY) license (http://creativecommons.org/licenses/by/4.0/).
Share and Cite
MDPI and ACS Style
Strenitzerová, M.; Gaňa, J. Customer Satisfaction and Loyalty as a Part of Customer-Based Corporate Sustainability in the Sector of Mobile Communications Services. Sustainability 2018, 10, 1657. https://doi.org/10.3390/su10051657
AMA Style
Strenitzerová M, Gaňa J. Customer Satisfaction and Loyalty as a Part of Customer-Based Corporate Sustainability in the Sector of Mobile Communications Services. Sustainability. 2018; 10(5):1657. https://doi.org/10.3390/su10051657
Chicago/Turabian StyleStrenitzerová, Mariana, and Ján Gaňa. 2018. "Customer Satisfaction and Loyalty as a Part of Customer-Based Corporate Sustainability in the Sector of Mobile Communications Services" Sustainability 10, no. 5: 1657. https://doi.org/10.3390/su10051657
Note that from the first issue of 2016, this journal uses article numbers instead of page numbers. See further details here.