Abstract
The purpose of this study is to evaluate the impact of employment in creative industries on the regional and national economic growth of Ecuador. The methodology used is a panel econometric model in which the temporary and structural dimensions considered to meet the proposed objective are addressed. The inputs of a basic production function were considered and the influence of creative employment was estimated as a proxy indicator of the work factor and of tax collections as a proxy of the capital factor on regional production for the years 2009 and 2014. Noteworthy is that in the main findings of this research, the analysis of the correspondence of the variables used and the growth show a significant influence of creative employment on regional production and development. The concentration and heterogeneity of employment indicators in the territory is also significant, with the most favoured regions being the same ones whose participation in national production is significant, where the three most important urban axes of the country are also found, which are the leading territories regarding these indicators. Special situations are shown for the rest of the provinces.
1. Introduction
The study of the determining and causal elements of the economic growth of countries is a subject of great interest for many academics, which is why there is an increasing number of studies at the international level [1,2,3]. These studies are also developed in the creative economy and creative industries subsector in order to determine how this new trend influences the economic development of the countries or sectors in which they have been introduced [4,5,6,7]. The concept of creative industries is defined as “those industries which have their origin in individual creativity, skill and talent and which have a potential for wealth and job creation through the generation and exploitation of intellectual property” [8] (p. 04).
Determining the elements that affect the economic growth of countries has been carried out following different approaches over the years. In the 19th century, it focused on the analysis of diminishing returns and the accumulation of physical or human capital [9]; after that, the analysis changed to the relationship between technological progress and labour specialisation [10,11,12,13], and in the following years severable variables were introduced to establish the most appropriate model for measuring economic growth [14,15,16,17,18].
Subsequently, in the 21st century, several economic models were developed which focused on selecting the most representative elements of all the previously proposed models, emphasising natural resources, fixed assets, and location [19,20,21]. In the last two decades of this century, creativity has been incorporated as a differentiating element of study [22,23,24,25,26]. In this sense, the incorporation of creativity as a driver for growth is attributed to Florida (2004), with the introduction of the creative class. This last model, which considers the creativity dimension, is taken into account as a reference in this research.
In the context of South America, particularly within Ecuador, it is observed that studies in relation to this subject are scarce and very limited [27,28,29,30]. This study is valuable because it has the potential to make an important contribution to the approach and knowledge of the dynamics and interactions of economic activities related to employment in the creative industry.
The document is structured as follows. After an initial review of the literature to set the conceptual framework, the research design is described. The presentation of the results follows, and the document finishes with a summary of the main conclusions.
2. Literature Review
2.1. Contribution to the Economy of the Creative Industry
By considering large-scale data that refer to the contribution of the creative industry to the economy, it is currently impossible to separate the role that this type of industry is developing within country economies, nor can highlighting its progress as a strategic sector within public policies generated by states be ignored [31]. The reports developed by the United Nations Conference on Trade and Development (UNCTAD) regarding the creative economy and its industries maintain that they are a growth area, which not only benefit developed countries, but can also generate benefits for “developing” economies [32].
According to UNCTAD, the world trade of creative goods and services for 2011 represented $624 billion, a value that doubled in the period from 2002 to 2011, showing an average annual growth rate of 8.8% during that period [33]. In addition, the figures reached in 2011 are shown to be higher than those obtained before the 2008 crisis, when they reached a maximum level of $620.4 billion.
In much more specific cases such as Argentina and Morocco, it can be seen that cultural and creative industries (CCI) generate employment for approximately 300,000 people and represent 3.5% of Argentina’s GDP [34]. In Morocco, they represent 1.8% of the active population and the market value of the music industry for 2009 reached $54 million [35]. Another representative case is the fashion industry in Bangkok, where the inclusion of nearly 20,000 businesses of different sizes has been observed, driven mainly by young people who position themselves as small-scale designers [34].
With all these scenarios described, the United Nations Conference on Trade and Development mentions that the level of contribution and growth of these industries is positive, based on the relationships that these industries have with contemporary lifestyles, strongly associated with social networks, innovation, connectivity, style, status, brands, cultural experiences, and cocreations [33].
Although their dispersion is broad, there are still countries where the concept of creative industries is relatively new. This process of uncertainty has caused some nations to continue relegating and limiting the injection of capital within this sector, due to their uncertainty as to whether they will provide the expected economic return [36].
Finally, it is important to mention that the definition of creative industry provided by the United Nations Educational, Scientific, and Cultural Organization (UNESCO), “those sectors of organised activity whose main purpose is production or reproduction, promotion, dissemination and/or the commercialization of goods, services and activities of cultural, artistic or heritage content” [37] provides a delimitation of the coverage space. However, its application within economic studies enables the observation of a series of ambiguities due to the somewhat complex task of establishing its actual coverage based on data available. The economic report that is obtained does not often show its total impact, as they are creative-cultural goods and services that are so dynamic and hardly standardised [38].
2.2. Relationship between the Creative Industry and Economic Development
There are many researchers who have established a link between creative industries and the economic development of the area where they are established [39,40,41,42]. According to Professor Florida [43], known for his work on the development of the concept of creative class and its ramifications in urban regeneration, creativity is seen as a driver for growth and is associated with a high level of economic development. In this sense, it is established that areas with a substantial concentration of creative class have been shown to have a competitive advantage [28].
Professor Florida’s theories are followed by other researchers, but they have also been widely criticised. His ideas are corroborated by other studies such as Figueira and Herrero [44], who through a territorial analysis of creative activities and their relationship with economic development in Portugal obtain results in which the cultural and creative sector represented 2.8% of GDP for 2006, showing more significant contributions than other sectors of the economy [28]. In addition, Marco-Serrano, Rausell-Koster, and Abeledo-Sanchis [45], in their study developed with European regional data from 1999 to 2008, observe the existence of significant feedback (bidirectional causality) between the GDP per capita and the employment intensity in CCI. They specifically point out that there is a “virtuous circle” that is fed by these industries. Another representative study is the development by the National Cultural Observatory of South Africa, which in its first analysis of cultural and creative industries in 2014, established that they have created between 162,809 and 192,410 jobs, between 1.08% and 1.28% of the employment in the country, which contribute 2.9% to the GDP. The study also showed that companies tend to be small, mainly composed of between two and five people [46].
However, other studies, although they note the positive link between creative industries and economic development, also see disadvantages. Thus, Stam, De Jong, and Marlet [47] observed the effect of creative industries on innovation and employment growth within the metropolitan city of Amsterdam, but in the surrounding area, it is not possible to identify spill-over effects produced by these industries. On the other hand, Oakley [48] mentions that the use of creative industries as a single tool to reactivate economically depressed regions can result in polarised economic development, which gradually becomes an unsustainable process. In the same line, Oakley [49] mentions that within the United Kingdom, which is a precursor in the introduction of these industries, they seek to contribute to “increasing employment and GDP, while improving social exclusion and old patterns of unequal economic development are counteracted” based on CCI. Although investigations, such as those by Evans and Shaw [50] and Leadbeater and Oakley [51], suggest and support the thought of Oakley (2006) by stating that the development of these sectors could exacerbate economic inequality patterns rather than generating relief effect.
In the literature reviewed on the relationship between CCI and economic development, it is observed that it is a subject that has been discussed by researchers, mainly in the last decade. However, the thought persists that its economic weight within mature and emerging economies is partially misunderstood and underestimated [52], and therefore, there is a need to continue studying it further.
With regard to employment, at present, it is more fragmented, unpredictable, and insecure within the global scenario than ever. According to the Inter-American Development Bank and Institute for the Future [53], there is the need for the development or transformation to new labour networks that help creative ones within creative industries.
Eikhof and Haunschild [54] mention that although creative industries are understood as part of the economy, their behaviour and development differ from the normal standard because their drive depends on artistic motivation as the main resource for production. In this sense, Rowan [55] says that one of the main problems of creative industries is their difficulty to grow in scale, a fact which leads to the majority of jobs being done under the form of self-employment or in companies with a reduced number of employees.
Despite all this, there is a considerably high participation of creative and artistic workers in countries’ labour statistics, although their working conditions are not the most optimum [56].
In the case of Ecuador, according to the National Economic Census (2010), cultural industries, which are part of creative industries, contribute to 1.8% of the gross domestic product, generating revenue of $2.7 million and including 46,162 jobs in 2009. The publishing industry accounts for 65.57% of cultural employment and the audiovisual industry accounts for 19.85%, while the phonographic industry and the visual and plastic arts industry account for 9.74% and 4.48% respectively. In the last study carried out by the International Confederation of Societies of Authors and Composers and EY [52], it can be seen that visual arts and television are the sectors with the highest importance within CCI, representing more than a third of the economic value generated. Radio and games represent smaller sectors, with only 6% of workers and 4% of sales of CCI, although they are evolving in dynamic markets. In a relationship between income intensity versus labour, the sectors with the highest income (38% of sales) in relation to the number of employees (only 22% of jobs in CCI) are advertising, newspapers, journals, and architecture. Although on the other hand, music, films, performing arts, and books are the leading generators of employment, with 46% of the jobs, but with only 17% of the income.
The study of these industries, as has been repeatedly mentioned, has literature that analyses in different latitudes, but within Latin America, this reality is reduced, and even more so within Ecuador. The most representative study so far was carried out by Prada and Jiménez [28], which established the existence of a trend of concentration of creative companies within the provincial capitals, thus adding a second spatial scale to the agglomeration capacity of urban areas [30]. However, it has not been possible to determine the employment distribution within each sector and province.
3. Methodology
The variables most commonly used to measure the dimension of the creative sector are production and occupation (UNCTAD, 2010 in [57]). Taking into account the limitations to calculate the production of creative industries in Ecuador, in this study, a calculation was made of the contribution of professions or occupations to creative activities of the people as the variable to consider in order to estimate the impact of the sector on the growth of the regions of Ecuador. This variable has already been used by other authors with similar purposes [58].
To determine the incidence and significance of creative occupations in regional growth, the basic production function was used, which estimates the quantity of a product based on the different combinations of productive factors. The independent variable was the nonoil gross value added provincial (GVAp) as a proxy variable of regional production, and for production inputs, creative employment was used as a proxy indicator of the “work” factor. Tax collections was used as a proxy of the “capital” factor, with the latter being the exogenous control variable in the proposed models. In the investigations and econometric models, the presence of these types of variables allows for the control of their influence in order to eliminate or neutralise their effects on the dependent variable. Also, it is necessary comment that the use of the GVA, which includes the oil contribution, can cause misinterpretations in provincial growth due to the fact that the exploitation of crude oil is concentrated in regions of eastern Ecuador, where in spite of recording high production figures, they are regions that are lagging behind in terms of growth and development.
This correspondence was made for the years 2009 and 2014. To complement this analysis: (i) Production elasticities were calculated related to creative employment and tax collections, which allowed us to know the behaviour of the regional GVA faced by work changes of creativity sectors and capital, provided by tax collections at regional level; (ii) The differences and similarities of the variables in time and space were addressed in cross-sectional panel models. In this section, grouped ordinary least squares were performed, as well as a panel with a dichotomous variable to establish heterogeneity among the provinces and the fixed and random effects to verify the existence of a general tendency through regression, giving each province a point of origin. The models obtained were subject to interpretation to demonstrate that the estimates were appropriate for the set of variables and data used.
In order to determine the degree of influence of creative employment on the variations of provincial production, the Spearman coefficient (rs) was obtained, which is a measure of the correlation between two continuous random variables:
where d = the difference in the positions or places assigned to the same individual or phenomenon and n = number of individuals or ordered phenomena.
Once the correlation between the dependent and independent variables had been verified, the logarithmic model that comes from the transformation of the linear production model was estimated:
where GVAp = gross value added provincial, CE = provincial creative employment, and T = provincial tax collections.
Once the elasticities were calculated, the following models were estimated:
- (a)
- Regression model with ordinary least squares (OLS), grouped or of constant coefficients.
- (b)
- Model of least squares of fixed effects.
- (c)
- Random effects model (REM)
4. Results
4.1. The Dependent Variable
In this study, the GVAp was considered as a proxy variable of economic growth. According to the System of National Accounts [59], this indicator is defined as the production value minus the intermediate consumption value, and it is a measure of the contribution to the GDP made by a production unit, industry, or sector. The GVAp values are taken from the Regional Accounts System of the Central Bank of Ecuador.
The concentration, economic, and structural polarisation in Ecuador can be seen in Table 1. According to the statistics for 2009, Pichincha and Guayas generate 56% of the total GVA. In 2014, the GVA concentration in these two provinces increased to 59%; that is, for every $100 that Ecuador produces, $60 originate in the two provinces cited. If Manabí is incorporated, it is observed that for that period, more than 65% of the GVA was collected in Guayas, Pichincha, and Manabí. The provinces of the Amazon, the Insular Region, and Bolivar, which constitute 41% of the national territory, are at the other extreme, with individual participation being less than 1%, and together, not exceeding 4%.

Table 1.
Gross Value Added—Provinces of Ecuador 2009–2014 (thousands of dollars).
4.2. Independent Variables
Due to the lack of systematic and periodic information, reliable statistics and methodologies in Ecuador that allow for the establishment of the identification of creative industries and people working in these sectors, it was decided to take as a reference the occupational data by sector of activity that is provided by the National Employment, Unemployment, and Underemployment Survey (ENEMDU) for 2009 and 2014 [60,61]. The people who, as of December of each year, are categorized within the “population with employment” category were taken as a common element. According to the National Statistics and Census Institute (INEC) of Ecuador, the employed population is made up of people aged 15 and over, who during the reference week, were engaged in some activity to produce goods or provide services in exchange for remuneration or benefits.
The creative jobs and occupations of the selected population are part of or are related to the productive chain in the following areas: architecture, handicrafts, visual arts, audiovisual, dance, design, education, photography, music, computer media, and theatre. All this corresponds to one of the definitions of the creative industry pointed out by Caves [62], as that which produces goods and services that we commonly associate with culture, art, or simply entertainment, producing also creative elements of a strongly symbolic nature. This also matches the definition provided by UNESCO [63], which mentions that creative industries involve a broader set of activities that include cultural industries plus all artistic or cultural production, either performances or individually produced goods. Creative industries are those in which the product or service contains a substantial artistic or creative element and includes sectors such as architecture and advertising. In this study, 106 subcategories of creative occupations extracted from the International Standard Industrial Classification of All Economic Activities (ISIC) have been considered.
In the first place, “occupations in creative industries” of the National Employment, Unemployment, and Underemployment Surveys-ENEMDU in the period 2010–2017, under the International Standard Industrial Classification of All Economic Activities (ISIC 4.0), were standardised with their equivalent in the National Classification of Economic Activities for Ecuador. After that, the employment situation was analysed for the different regions (provinces) of the country. It is important to mention that the category and subcategory standards of ISIC were used to identify the economic sector, which is the defined creative professions that are part of subcategories. However, for the years of study (2009 and 2014), for some of the occupations, there is no disaggregation at the subcategory level, so in these cases, the data of the corresponding upper immediate category data were used.
According to the data obtained, people with creative jobs and occupations in Ecuador tripled during the five-year period of analysis in Ecuador, going from 271,381 in 2009 to 646,452 in 2014. This issue corresponds to Luzardo, De Jesús, and Pérez [64], who in a report to the Inter-American Development Bank (IDB), point out that these types of enterprises and businesses have generated thousands of jobs in recent years in Latin America and the Caribbean. In addition, the significant contribution of this sector is shown by exacerbating its importance in the labour market, since if in 2009, 4 out of every 100 employed people performed their main activity in creative areas, up until the year 2014, there were 9 out of 100 people with creative-related jobs, according to data in Table 2.
Table 2.
Creative Employment—Provinces of Ecuador 2009–2014 (thousands of dollars).
Despite the fact that, in the economy as a whole, there is a notable presence of the weight and influence of creative employment, the largest increases in employment participation at regional level are recorded in four provinces of the Ecuadorian highlands: Tungurahua, Imbabura, Chimborazo, and Azuay. The same trend is observed for the case of Pichincha, although its preponderance is lower. These elements seem relevant to initially identifying creativity clusters because four of the five provinces mentioned are located in the northern highlands and share administrative boundaries.
Regional multipliers of creative employment are defined as the number of jobs generated per million dollars of gross value added. When estimating these indicators, a very strong structural change is observed that acquires a countertrend regarding the contribution of the creative economy to employment. A generalised decrease is indeed observed, while in 2009, this multiplier was 247 per million nonoil GVA, in 2014, there was a decrease that reached 133 jobs. This would allow one to infer that the lack of productive chains of these sectors and the high sensitivity of this sector to the economic problems of the country are due to the fall in state revenues caused by the fall in crude oil prices in 2014.
If the behaviour of creative employment multipliers is considered regionally, unequal behaviour is observed (Figure 1).
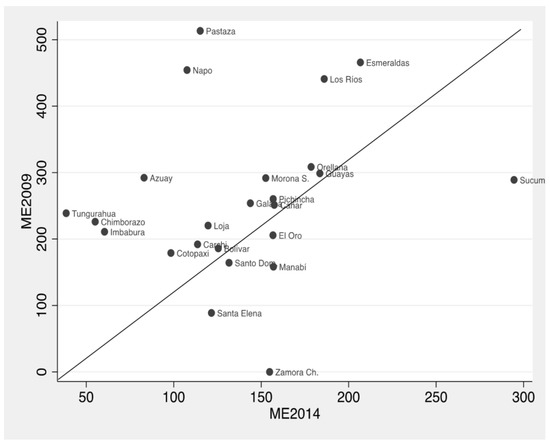
Figure 1.
Multipliers of creative employment, years 2009 and 2014. Source: Own elaboration. Survey Processing ENEMDU-December (2009 and 2014) [59,60].
The multiplier values were higher in the provinces with lower capital intensity in 2009, which were Pastaza, Esmeraldas, Napo, and Los Ríos. Only two of the regions are maintained in both periods—Esmeraldas and Los Ríos, in addition to Sucumbíos as a result of being one of the regions where the creative employment multiplier increased. On the other hand, Sucumbíos, Zamora Chinchipe, and Santa Elena, regions of lower capital intensity, are the only three regions that increased their multipliers.
The regions with lower creative multiplier values were provinces of the north-central highlands of Ecuador—Tungurahua, Chimborazo, and Imbabura—a finding that was not considered at the beginning of this study approach because footwear, leather, clothing, textiles, clothing, and furniture industries are important in these provinces, and they are also noted for their inhabitants’ manual skills (crafts), that is, creative activities and professions.
As a second variable of the factors that, from a theoretical point of view, have been proposed as determinants of regional economic growth and as a proxy of the capital factor is the amount of the total effective tax collection at the regional level. This variable has been consulted in the general statistics of tax collection of the Internal Revenue Service (IRS).
According to National Information System [65], the tax contribution consists of direct taxes (income tax levied, environmental vehicle pollution tax, motor vehicle tax, tax on currency outflows, taxes on foreign assets, RISE, royalties, mining conservation patent and profits, rural lands, contribution to comprehensive cancer care, deferred interest payment, tax fines) and indirect taxes (value added tax, special consumption tax, plastic bottles redeemable tax). Tax collection is a consistent indicator to measure the dynamics and structure of capital accumulation of regional systems (Table 3).
Table 3.
Tax Collections—Provinces of Ecuador 2009–2014 (thousands of dollars).
For a better description of tax collections at the regional level, the collection per inhabitant will be used as an indicator. According to the information in Table 3, at the per capita level, the Pichincha, Guayas, and Azuay regions, where the productive means and the population of the country are concentrated, will contribute the most to the tax rate collection. The tax contribution per inhabitant in its territorial dimension has a great variance, while in Pichincha and Guayas it exceeds $700, in Santa Elena and Bolívar it does not reach $70, that is, the difference is of 10 times.
Regarding an increase in tax collection, at national level it doubled. In 2007, the average collection per inhabitant was $177, and after 5 years, it was $302. Both in absolute terms and in proportion, the greatest increase takes place in the province of Zamora Chinchipe as a result of the increase in mining activity in this province. For the rest of the country, the behaviour of this indicator shows a varied typology, where tax collection increases in monetary units do not necessarily have a direct relationship with the increase in relative terms.
4.3. Regressions
Given the data of the variables that make up the proposed model, in the first place, the Spearman correlation coefficient was calculated to check the existence of a relationship of the independent variables with respect to the dependent one. The results affirm that in the case of Ecuador, creative employment predicts economic growth better in 2014 than in 2009. This in turn allows one to argue that it is possible to perform regressions and estimation of parameters between the aforementioned variables that enable the inference of information and the processing of the interrelation and interaction in the territories (Table 4).
Table 4.
Spearman correlation coefficients gross value added provincial (GVAp). Creative professions and tax collections.
For the logarithmic model proposed, in the economy of Ecuador in 2009, the production elasticities regarding creative employment and tax collections were 0.485 and 0.304, respectively. That is to say that in the provinces of Ecuador, maintaining input taxes constant, an increase of 1% in the creative employment input caused on average, an increase of about 0.48% in production. Similarly, keeping the employment variable constant, an increase of 1% in the capital input generated, on average, an increase of about 0.3% in production. The result of the sum of the two production elasticities is 0.78, which is proof of diminishing returns of scale. In 2014, the influence of independent variables on regional growth is greater, with decreasing returns to scale with a 0.87 elasticity of the two productive factors used (Table 5).
Table 5.
Results of OLS regressions and elasticities.
In the results of the first model of grouped ordinary least squares (OLS), the coefficients of the variables are very significant statistically, with a high R2 value, and coincide with the previous specifications approached in the study. In order to include a dimension that addresses space and time, a balanced panel regression was carried out. In this case, the same territorial unit (province) was studied for the years 2009 and 2014 as a whole, which allowed for the analysis of a greater quantity of data, with higher variability and greater efficiency.
One of the main problems and limitations of OLS is that it hides the heterogeneity (individuality or singularity) that could arise in the provinces of Ecuador, that is, it does not allow one to distinguish if the influence of creative employment and tax collections on provincial growth is the same over time among the different regions. To solve this problem, the panel model of fixed effects and random effects was estimated, the results of which are shown below. For both cases, the F test of individual effects was carried out, which allowed us to reject the null hypothesis that the individual effects are equal to 0 (Prob > F = 0.000), which justifies carrying out an analysis with individual effects. Thus, the grouped OLS model was rejected, since the panel model explains the behaviour and interaction of the variables better.
If the results of the regressions of fixed effects and random effects are compared, a considerable difference between them is observed. Therefore, after performing the Hausman test that determines a χ2 of 0.12 and a prob > equal to 0.9421 (greater than 0.05), the estimator for fixed effects was selected (Table 6).
Table 6.
Results of grouped OLS panel regressions, with fixed effects and random effects.
5. Discussion and Conclusions
Research and studies related to the contribution and influence of creative industries and creative employment on regional economies and countries demonstrate the growing interest of researchers in this field. However, the amount of specialised literature for the case of Ecuador is not enough to overcome the drawbacks and limitations for those who promote empirical studies on the relationships between creativity, employment, and growth. The lack of satellite accounts, the lack of clarity in the definitions, the subjectivity in the criteria to select who is creative or not, and the bias that causes the use of occupational standards (international) limit a rigorous analysis. It should be kept in mind that empirical approaches that are based simply on the study of creative industries or the analysis of creative occupations are not completely adequate for a quantification of the creative economy and a better understanding of these issues.
Despite the above, this article aims to characterise the correlation between creative jobs and regional growth in Ecuador. Correlation analyses between creative occupations and nonoil provincial GVA show that there is a close relationship between them, which justifies the representative influence of creativity on regional growth and development. Based on public policies, it is therefore necessary to consider the promotion of employment in industries and activities that cause synergies related to these activities. When verifying the relationship between occupations and regional growth, it is established that in regional growth and development models, it is necessary to take into account employment in creative industries for a better understanding of the interaction and interrelation in the production and the economy.
According to the data obtained, people with creative jobs and occupations in Ecuador tripled in Ecuador from 2009 to 2014. In 2009, 4 out of every 100 people with jobs performed their main activity in creative circles; as of 2014, there are 9 out of 100 people with creative-related jobs. However, there is a marked disparity in Ecuadorian regions regarding the percentage of creative employment with respect to total employment and multipliers of creative employment. The largest increases in the share of employment at the regional level are recorded in five provinces of the Ecuadorian highlands (Tungurahua, Imbabura, Chimborazo, Azuay, and Pichincha), where the formation of clusters is likely.
Regarding regional employment multipliers, in 2009, this multiplier at the country level was 247 per million nonoil GVA. In 2014, there was a decrease that reached 133 jobs. This was caused by the lack of productive chains in these sectors and the decrease in state revenues caused by the fall in the price of crude oil in 2014. At regional level, multiplier values were higher in provinces with lower capital intensity.
The contribution of industries and creative occupations to the economy in Ecuador, in the medium and long term, is evidenced in two significant manifestations. In the first place, it would not be linked to the international price of oil, a situation that is confirmed in this article by excluding the contribution of the oil sector from the dependent variable. A second factor shows that, despite the decreasing returns found when using creative employment as an input of production, the increase of these is from 0.78 in 2009 to 0.87 in 2014, and its tendency is towards a situation of constant returns to scale.
This study has several limitations and these can be addressed in future research. The limitation refers to the geographical area (Ecuador), so the results must be extrapolated with caution, and finally, its cross section.
Author Contributions
All authors contributed equally to this work. All authors wrote, reviewed and commented on the manuscript. All authors have read and approved the final manuscript.
Conflicts of Interest
The authors declare no conflict of interest.
References
- Pastén, R.; Saens, R.; Contreras Marin, R. Does energy use cause economic growth in Latin America? Appl. Econ. Lett. 2015, 22, 1399–1403. [Google Scholar] [CrossRef]
- Ruys, P. A development of the theory of the Ricardo effect. Q. J. Aust. Econ. 2017, 20, 297–335. [Google Scholar]
- Zhou, G.; Gong, K.; Luo, S.; Xu, G. Inclusive Finance, Human Capital and Regional Economic Growth in China. Sustainability 2018, 10, 1–16. [Google Scholar] [CrossRef]
- Phillips, R. Artful business: Using the arts for community economic development. Commun. Dev. J. 2004, 39, 112–122. [Google Scholar] [CrossRef]
- Scott, A.J. The cultural economy of landscape and prospects for peripheral development in the twenty-first century: The case of the English Lake District. Eur. Plan. Stud. 2010, 18, 1567–1589. [Google Scholar] [CrossRef]
- Aquino, J.; Phillips, R.; Sung, H. Tourism, Culture, and the Creative Industries: Reviving Distressed Neighborhoods with Arts-Based Community Tourism. Tour. Cult. Commun. 2012, 12, 5–18. [Google Scholar] [CrossRef]
- Donaldson, R.; Spocter, M.; Du Plessis, D.; Van Niekerk, A. Towards generic interventions to stimulate growth potential in small towns of the Western Cape Province, South Africa. S. Afr. Geogr. J. 2012, 94, 120–136. [Google Scholar] [CrossRef]
- Department of Culture, Media and Sport (DCMS). Creative Industries Mapping Document, 2nd ed.; DCMS: London, UK, 2001.
- Sala-i-Martin, X. Apuntes de Crecimiento Económico; Antoni Bosch Editor: Barcelona, Spain, 2000. [Google Scholar]
- Ramsey, F.P. A mathematical theory of saving. Econ. J. 1928, 38, 543–559. [Google Scholar] [CrossRef]
- Young, A.A. Increasing Returns and Economic Progress. Econ. J. 1928, 38, 527–542. [Google Scholar] [CrossRef]
- Knight, F.H. Diminishing returns from investment. J. Polit. Econ. 1944, 52, 26–47. [Google Scholar] [CrossRef]
- Schumpeter, J.A. The Theory of Economic Development; Cambridge University Press: Cambridge, MA, USA, 1934. [Google Scholar]
- Solow, R.M. A contribution to the theory of economic growth. Q. J. Econ. 1956, 70, 65–94. [Google Scholar] [CrossRef]
- Romer, P.M. Increasing returns and long-run growth. J. Polit. Econ. 1986, 94, 1002–1037. [Google Scholar] [CrossRef]
- Lucas, R.E. On the mechanics of economic development. J. Monet. Econ. 1988, 22, 3–42. [Google Scholar] [CrossRef]
- Barro, R.J. Economic growth in a cross section of countries. Q. J. Econ. 1991, 106, 407–443. [Google Scholar] [CrossRef]
- Rebelo, S. Long-run policy analysis and long-run growth. J. Polit. Econ. 1991, 99, 500–521. [Google Scholar] [CrossRef]
- North, D.C. Growth and Welfare in the American Past; Prentice-Hall: Upper Saddle River, NJ, USA, 1966. [Google Scholar]
- Porter, M.E. Location, competition, and economic development: Local clusters in a global economy. Econ. Dev. Q. 2000, 14, 15–34. [Google Scholar] [CrossRef]
- Berry, C.R.; Glaeser, E.L. The divergence of human capital levels across cities. Pap. Reg. Sci. 2005, 84, 407–444. [Google Scholar] [CrossRef]
- Montgomery, J. Beware ‘the creative class’. Creativity and wealth creation revisited. Local Econ. 2005, 20, 337–343. [Google Scholar] [CrossRef]
- Boyle, M. Culture in the rise of tiger economies: Scottish expatriates in Dublin and the ‘creative class’ thesis. Int. J. Urban Reg. Res. 2006, 30, 403–426. [Google Scholar] [CrossRef]
- Weick, C.W.; Martin, J.D. Full-time and part-time independent inventors: Rising with the creative class. Int. J. Entrep. Innov. 2006, 7, 5–12. [Google Scholar] [CrossRef]
- Lorenzen, M.; Andersen, K.V. Centrality and creativity: Does Richard Florida’s creative class offer new insights into urban hierarchy? Econ. Geogr. 2009, 85, 363–390. [Google Scholar] [CrossRef]
- Andersen, K.V.; Bugge, M.M.; Hansen, H.K.; Isaksen, A.; Raunio, M. One size fits all? Applying the creative class thesis onto a Nordic context. Eur. Plan. Stud. 2010, 18, 1591–1609. [Google Scholar] [CrossRef]
- Buitrago, F.; Duque, I. La Economía Naranja, una Oportunidad Infinita; Banco Interamericano de Desarrollo: Washington, DC, USA, 2013. [Google Scholar]
- Prada, J.; Jiménez, I. La economía creativa en Ecuador: Una aproximación a sus lógicas espaciales a partir del censo nacional económico de 2010. Entorno Geográfico 2015, 10, 110–135. [Google Scholar]
- Cardoso, P. The Economic Contribution of Copyright Industries in the Republic of Ecuador; World Intelectual Property Organisation: Geneva, Switzerland, 2017. [Google Scholar]
- Correa-Quezada, R.; Ochoa, F.; Quinche, P. Creatividad y clase creativa en Ecuador. In La Economía de las Actividades Creativas: Una Perspectiva Desde España y México (Págs. 435–490); Valdivia, M., Cuadrado-Roura, J., Eds.; Universidad Nacional Autónoma de México; Universidad de Alcalá: Cuernavaca, Mexico, 2017. [Google Scholar]
- Aguado Quintero, L. Estadísticas culturales: Una mirada desde la economía de la cultura. Cuadernos de Administración 2010, 23, 107–141. [Google Scholar]
- De Beukelaer, C. Creative industries in “developing” countries: Questioning country classifications in the UNCTAD creative economy reports. Cult. Trends 2014, 23, 232–251. [Google Scholar] [CrossRef]
- UNCTAD. Trade in Creative Products Reached New Peak in 2011, UNCTAD Figures Show. 2013. Available online: http://unctad.org/en/pages/newsdetails.aspx?OriginalVersionID=498 (accessed on 21 March 2018).
- UNESCO. Las Industrias Creativas Impulsan las Economías y el Desarrollo. 2013. Available online: http://www.unesco.org/new/es/media-services/in-focus-articles/creative-industries-boost-economies-and-development-shows-un-report/ (accessed on 21 March 2018).
- UNDP. United Nations Development Programme. Creative Economy Report 2013 Special Edition; Widening Local Development Pathways, PNUD: New York, NY, USA, 2013. [Google Scholar]
- Barcelona Activa. La Economía Creativa: Una Industria en Crecimiento. 2011. Available online: https://treball.barcelonactiva.cat/porta22/images/es/Barcelona_treball_Porta22_Capsula_sectorial_INDUSTRIAS_CREATIVAS_diciembre2011_CAST_tcm24-19695.pdf (accessed on 21 March 2018).
- UNESCO. Industrias Creativas. 2017. Available online: http://www.unesco.org/new/es/santiago/culture/creative-industries/ (accessed on 19 March 2018).
- Mujica Cominetti, F.; Parada, J.; Vergara, M.L. Diagnóstico y Caracterización de la Economía Creativa: Brechas y Drivers de los 4 Subsectores Priorizados y la Gobernanza de los Esfuerzos Públicos; Corfo, Acti & Estrategia: Santiago, Chile, 2015; Available online: https://www.goredelosrios.cl/cultura2/wp-content/uploads/2016/03/Diagn%C3%B3stico-y-Caracterizaci%C3%B3n-de-la-Econom%C3%ADa-Creativa.-Brechas-y-Drivers...-CORFO.pdf (accessed on 21 March 2018).
- Scott, A.J. The Cultural Economy of Cities: Essays on the Geography of Image-Producing Industries; Sage: London, UK, 2000. [Google Scholar]
- Lee, S.Y.; Florida, R.; Acs, Z. Creativity and entrepreneurship: A regional analysis of new firm formation. Reg. Stud. 2004, 38, 879–891. [Google Scholar] [CrossRef]
- Goodwin, C. Art and culture in the history of economic thought. Handb. Econ. Art Cult. 2006, 1, 25–68. [Google Scholar]
- De Jong, J.P.J.; Fris, P.; Stam, E. Creative industries. In Heterogeneity and Connect Ion with Regional Firm Entry, EIM Business and Policy Research; SCALES (Scientific Analysis of Entrepreneurship and SMEs): Zoetermeer, The Netherlands, 2007. [Google Scholar]
- Florida, R. Revenge of the Squelchers. The Next American City. 2004. Available online: http://www.americancity.org/article.php?id_article=39 (accessed on 21 March 2018).
- Figueira, J.; Herrero, L. Actividades Creativas y Desarrollo Económico en Portugal: Un Análisis Territorial; Ponencia Presentada en V Workshop en Economía y Gestión de la Cultura: Cádiz, Spain, 2013. [Google Scholar]
- Marco-Serrano, F.; Rausell-Koster, P.; Abeledo-Sanchis, R. Economic development and the creative industries: A tale of causality. Creat. Ind. J. 2014, 7, 81–91. [Google Scholar] [CrossRef]
- Snowball, J. Why Art and Culture Contribute more to an Economy than Growth and Jobs. 2016. Available online: http://theconversation.com/why-art-and-culture-contribute-more-to-an-economy-than-growth-and-jobs-52224 (accessed on 21 March 2018).
- Stam, E.; De Jong, J.P.; Marlet, G. Creative Industries in The Netherlands: Structure, depelopment, innovativenesand effects on urban growth. Geogr. Ann. Ser. B Hum. Geogr. 2008, 90, 119–132. [Google Scholar] [CrossRef]
- Oakley, K. Not So Cool Britannia: The Role of the Creative Industries in Economic Development. Int. J. Cult. Stud. 2004, 7, 67–77. [Google Scholar] [CrossRef]
- Oakley, K. Include Us Out—Economic Development and Social Policy in the Creative Industries. Cult. Trends 2006, 15, 255–273. [Google Scholar] [CrossRef]
- Evans, G.; Shaw, P. The Contribution of Culture to Regeneration in the UK: A Review of the Evidence; Department of Culture, Media and Sport: London, UK, 2004.
- Leadbeater, C.; Oakley, K. Surfing the Long Wave; Demos: London, UK, 2001. [Google Scholar]
- International Confederation of Societies of Authors and Composers and EY. Cultural Times: The First Global Map of Cultural and Creative Industries; UNESCO: Paris, France, 2015. [Google Scholar]
- Inter-American Development Bank and Institute for the Future. La Economía Naranja: Una Oportunidad Infinita; Banco Interamericano de Desarrollo (BID): Adelanto, CA, USA, 2017. [Google Scholar]
- Eikhof, D.R.; Haunschild, A. For art’s sake! Artistic and economic logics in creative production. J. Org. Behav. 2007, 28, 523–538. [Google Scholar] [CrossRef]
- Rowan, J. Industrias Creativas y Empleo: Reflexiones Desde la Crisis. 2011. Available online: http://www.demasiadosuperavit.net/wp-content/uploads/2012/03/industrias-creativas-empleo-rowan.pdf (accessed on 22 March 2018).
- Eikhof, D.R.; Haunschild, A. Lifestyle Meets Market: Bohemian Entrepreneurs in Creative Industries. Creat. Innov. Manag. 2006, 15, 234–241. [Google Scholar] [CrossRef]
- Boix, R.; Lazzaretti, L. Las industrias creativas en España: Una panorámica. Investig. Reg. 2011, 22, 181–206. [Google Scholar]
- Valdivia López, M. Presencia e impacto espacial de los sectores creativos en las zonas metropolitanas de México. Estud. Front. 2014, 15, 215–259. [Google Scholar]
- Comisión Europea, Fondo Monetario Internacional, Оrganización de Cooperación y Desarrollo Económicos, Naciones Unidas, Banco Mundial. Sistema de Cuentas Nacionales (2008). 2016. Available online: https://unstats.un.org/unsd/nationalaccount/docs/SNA2008Spanish.pdf (accessed on 12 March 2018).
- INEC. Encuesta Nacional de Empleo. Desempleo y Subempleo (ENEMDU). 2009. Available online: http://www.ecuadorencifras.gob.ec/empleo-encuesta-nacional-de-empleo-desempleo-y-subempleo-enemdu/ (accessed on 1 March 2018).
- INEC. Encuesta Nacional de Empleo. Desempleo y Subempleo (ENEMDU). 2014. Available online: http://www.ecuadorencifras.gob.ec/empleo-encuesta-nacional-de-empleo-desempleo-y-subempleo-enemdu/ (accessed on 1 March 2018).
- Caves, R.E. Creative Industries: Contracts between Art and Commerce; Harvard University Press: Cambridge, MA, USA, 2000. [Google Scholar]
- UNESCO. Comprender las Industrias Creativas: Las Estadísticas Como Apoyo a Las Políticas Públicas. Sección Cultura. Publicado: Sin fecha. 2006. Available online: portal.unesco.org (accessed on 1 March 2018).
- Luzardo, A.; De Jesús, D.; Pérez, M. Economía Naranja. Innovaciones que no Sabías Que Eran de América Latina y El Caribe; Banco Interamericano de Desarrollo (BID): Washington, DC, USA, 2017. [Google Scholar]
- National Information System. Methodological Sheets of PNBV Indicators 2013–2017; Tax Contribution; National Information System: Ecuador, 2014. [Google Scholar]
© 2018 by the authors. Licensee MDPI, Basel, Switzerland. This article is an open access article distributed under the terms and conditions of the Creative Commons Attribution (CC BY) license (http://creativecommons.org/licenses/by/4.0/).