Article

Mindfulness and Climate Change Action: A Feasibility Study

1
Department of Family Medicine and Community Health, University of Wisconsin-Madison, Madison, WI 53715, USA
2
Global Health Institute, University of Wisconsin-Madison, Madison, WI 53706, USA
3
Nelson Institute for Environmental Studies, University of Wisconsin-Madison, Madison, WI 53706, USA
4
Waisman Center, University of Wisconsin-Madison, Madison, WI 53705, USA
5
Cooperative Institute for Meteorological Satellite Studies, Space Science and Engineering Center, University of Wisconsin-Madison, Madison, WI 53706, USA
6
University of Mississippi Medical Center School of Nursing, Jackson, MI 39216, USA
*
Author to whom correspondence should be addressed.
Sustainability 2018, 10(5), 1508; https://doi.org/10.3390/su10051508
Submission received: 30 March 2018 / Revised: 29 April 2018 / Accepted: 7 May 2018 / Published: 10 May 2018
(This article belongs to the Special Issue Carbon Footprint: As an Environmental Sustainability Indicator)

Abstract

:
Pro-environmental behaviors and the cultural shifts that can accompany these may offer solutions to the consequences of a changing climate. Mindfulness has been proposed as a strategy to initiate these types of behaviors. In 2017, we pilot-tested Mindful Climate Action (MCA), an eight-week adult education program that delivers energy use, climate change, and sustainability content in combination with training in mindfulness meditation, among 16 individuals living in Madison, WI. We collected participant data at baseline and at different times across the study period regarding household energy use, transportation, diet, and health and happiness. This pilot study aimed to evaluate the feasibility of the various MCA study practices including measurement tools, outcome assessment, curriculum and related educational materials, and especially the mindfulness-based climate action trainings. MCA was well-received by participants as evidenced by high adherence rate, high measures of participant satisfaction, and high participant response rate for surveys. In addition, we successfully demonstrated feasibility of the MCA program, and have estimated participant’s individual carbon footprints related to diet, transportation, and household energy.

While climate change is truly a global phenomenon, most of the specific actions that lead to climate change and its impacts on nature and society take place at smaller scales.
Kates and Wilbanks, 2003

1. Background

As the consequences of a changing climate are both present and looming, it is becoming more apparent that the solutions exist not only within technological innovation and improved policies, but also within cultural and behavioral shifts by way of pro-environmental behavior [1,2]. Pro-environmental behaviors, also referred to as ecologically responsible or sustainable behaviors, consciously either minimize the negative impact or have a positive impact on the natural or built environment [3]. In the context of climate change, reducing one’s “carbon footprint” (CF) (the attributable greenhouse gas impact of a choice or behavior) has become a targeted goal of pro-environmental behavior and sustainability [4]. Recent research has highlighted the benefits of implementing programs focused on increasing environmental awareness and the development of a more pro-ecological view, which could enhance responsible environmental behavior [5]. Others are strongly encouraging the collaboration between researchers and practitioners to examine the effects of combining behavior-change interventions within environmental programs in influencing pro-environmental decisions [6].
Mindfulness has been proposed as a strategy to initiate pro-environmental behaviors; however, the research is sparse [7,8,9]. Mindfulness, or “full consciousness”, consists of paying attention to thoughts, feelings, emotions, and sensations at the present moment without judgment [10,11,12,13,14,15]. Some reason that mindfulness cultivates attention and increases awareness of our context, which could be essential for increasing pro-environmental behavior [7,13,14,16,17,18]. Because mindfulness-based practices have been shown to have beneficial effects such as reduced stress, improved psychological and physical well-being, reduced incidence of acute respiratory infections, and improved cognitive abilities [19,20,21,22,23,24,25,26,27], mindfulness-based practices may be effective in modifying behaviors that have ecological implications. These actions include, for example, eating a lower carbon and higher plant-based diet, bicycling or walking more often in place of driving, or wearing additional layers in the winter and turning the heat down.
Over the past few decades, a handful of observational studies have examined the connection between mindfulness and pro-environmental behavior. For example, one recent randomized controlled trial of 72 participants in either a mindfulness group or a “mindlessness group” revealed that mindful learning can influence pro-environmental behavior intentions [18]. Another 2017 study randomly assigned 103 university students to a mindfulness or mindlessness intervention with results showing that mindfulness significantly increased belief in climate change (mediated by an increased connectedness to nature) [28]. Similarly, others found that mindfulness intensifies experiences with the natural world, thereby cultivating environmental connectedness and increasing the propensity toward pro-environmental behaviors [14]. An earlier study conducted a survey among 829 people to find significant associations among mindfulness meditation, ecologically sustainable behavior, and subjective well-being, concluding “what’s good for personal well-being is also good for the planet” [17]. In the same year, a similar study with a survey of 100 people found that mindfulness was significantly positively correlated with sustainable behavior [16]. Lastly, several review articles have established the important role that mindfulness may play in fostering pro-environmental behaviors and sustainability at both individual and societal scales [7,9,12,13,29].
Hence, Mindful Climate Action (MCA) was created with a goal of evoking an “ecological consciousness” among participants [30] (More information on MCA can be found here: http://www.fammed.wisc.edu/mca/). Mindful Climate Action is an eight-week adult education program that delivers energy use, climate change, and sustainability content in combination with training in mindfulness meditation. In spring of 2017, MCA was piloted with 16 people living in Madison, WI. The purposes of this pilot study and current paper are to evaluate the feasibility of the various MCA study practices including the measurement tools, outcome assessment, curriculum and related educational materials, and especially the mindfulness-based climate action trainings.
As far as we know, the research thus far has relied more on self-reported environmental awareness or behavioral intentions due to increased mindfulness rather than on the estimation of objective changes in behaviors related to carbon footprint. MCA contributes to the field by: (1) quantifying individual carbon footprint from the different climate change domains (e.g., transportation, diet, and energy); and (2) developing a novel, coordinated mindfulness and sustainability training course curriculum.

2. Methods

2.1. Aim, Design, and Setting of Study

This study was approved and monitored by the University of Wisconsin—Madison’s Institutional Review Board (2016-1336). MCA participants were recruited in the greater Madison, WI area by email solicitations and flyers posted throughout the community. Prospective participants contacted research staff via email or phone and were screened by study personnel using scripted protocol.
Participants were eligible if they met these criteria:
  • Age 30–65 years old
  • Fluent in English
  • Willing to complete study-specific tasks
  • No substantial prior training in mindfulness or meditation
Participants were eligible if they met the majority (3/5) of these criteria:
  • Own (or co-own) a dwelling in Madison, WI and use Madison, Gas, & Electric for utilities
  • Own (or co-own/lease) an automobile and drive at least 5000 miles per year
  • Own a smart phone and willing to download activity monitoring application (app)
  • Not a vegetarian or vegan
  • Are participating with, at most, one other member of the household
Twenty-five people were screened. Once prospective participants passed phone screening, they met in person with study staff members to be consented and enrolled. Sixteen people were enrolled in this pilot study. At the baseline visit, participants completed several psychosocial questionnaires, downloaded a free activity monitoring app on their smart phones, and completed a climate change and energy knowledge pre-test, and completed three-day dietary recall.
MCA participation consisted of an eight-week course with weekly 2.5-h group sessions plus an additional six-hour weekend retreat scheduled toward the end of the program. This structure was based on the widely used Mindfulness Based Stress Reduction program [10]. MCA sessions primarily were led by two experienced mindfulness instructors; climate educators also contributed. Participants received about 26 h of contact time. Asked to practice daily for 45 min, participants were instructed to record their home practice on paper log sheets.

2.2. Characteristics of Participants/Description of Materials

The MCA pilot enrolled 16 participants. Nine indicated they were female and seven that they were male. The mean age was 39.7 years, with a range of 30–63 years. Of the 16 participants, seven were college graduates and nine had post-graduate degrees. Two pairs of participants were members of the same household. Two participants discontinued due to personal time constraints. One participant was no longer reachable after completing the MCA course to fulfill final study tasks, so was considered lost to follow-up. In addition to the 16 enrolled MCA participants, there were three participant observers, who also happened to be three of the climate educators.

2.3. Description of All Processes/Interventions

2.3.1. MCA Curriculum

Prior to the pilot study, the MCA team developed an educational curriculum that dovetailed fundamental climate literacy within eight weeks of mindfulness meditation training. The curriculum included sharing the book: EnAct, Steps to a Greener Living [31]. During the first seven weeks, the curriculum was centered around the topics of: (1) Climate change science; (2) Sustainable and healthy food choices; (3) Water conservation; (4) Active transport; (5) Energy conservation; (6) Ethical considerations and compassion for vulnerable populations and future generations; and (7) Reducing purchasing and consumption for personal and planetary well-being. The final session of the eight-week MCA class served as a capstone experience for discussion of the curriculum, allowing participants to explore what they learned and how they intended to incorporate learnings and practices into their daily lives. Additional information about the MCA Curriculum can be found in Barrett et al. (2016) [30].
Five science educators presented climate and energy content using multiple methods. One instructor simply spoke to the group and tried to spark conversation, others used power point slides and short videos, and one used tactile learning tools. Each week, the instructors met to share their content before delivery and incorporate feedback from the MCA team. The science education portion of the class usually took less than 30 min, so that at least two hours would be available for mindfulness practices.

2.3.2. Diet and Carbon Footprint Monitoring

Individuals can report their diets in many ways, including food frequency questionnaires, dietary history interviews, dietary records, and twenty-four diet hour recalls [32]. This study used the Automated Self-Administered 24-h Dietary Assessment Tool (ASA24) [33]. Validity of ASA24 has been tested multiple times [34,35]. Collectively, the validity studies conclude that diets recalled via ASA24 match true intake closely most of the time and that ASA24 performs equivalently to interviewer-administered methods of diet recall data collection.
In this study, participants recalled their dietary intake using ASA24 three times. The first, a pre-MCA course baseline, was in January and February. The second recall was eight weeks later, immediately following the MCA course in March and April. The third recall was six months later in August and September. During each follow-up period, participants recalled their dietary intake for two weekdays and one weekend day.
In 2015, Hallström, Carlsson-Kanyama, and Borjesson reviewed recent literature regarding dietary analyses for environmental impact [36]. Included studies were based on average or hypothetical diets. None were based on diets of individual human subjects. Tom Bryan, a member of the MCA pilot team, developed a new type of carbon footprint calculator based on individual diets from ASA24 data. The calculator retrieves carbon footprint data (kilogram (kg) of Carbon Dioxide Equivalents (CO2e) per kg product) from three existing databases: Agri-footprint 3.0, Eco-invent v3.4, and FoodCarbonScope [37,38,39]. The calculator then tags these CF values onto food and beverage products listed in the United States Department of Agriculture’s Food and Nutrient Database for Dietary Studies (USDA FNDDS), a database also used by ASA24. As a result, the calculator contains a relational database of CF data and USDA FNNDS entries. This relational database can be queried using ASA24 24 h data logged by participants. Using the dietary recall data recorded by ASA24, the calculator is automized to produce itemized carbon footprints.

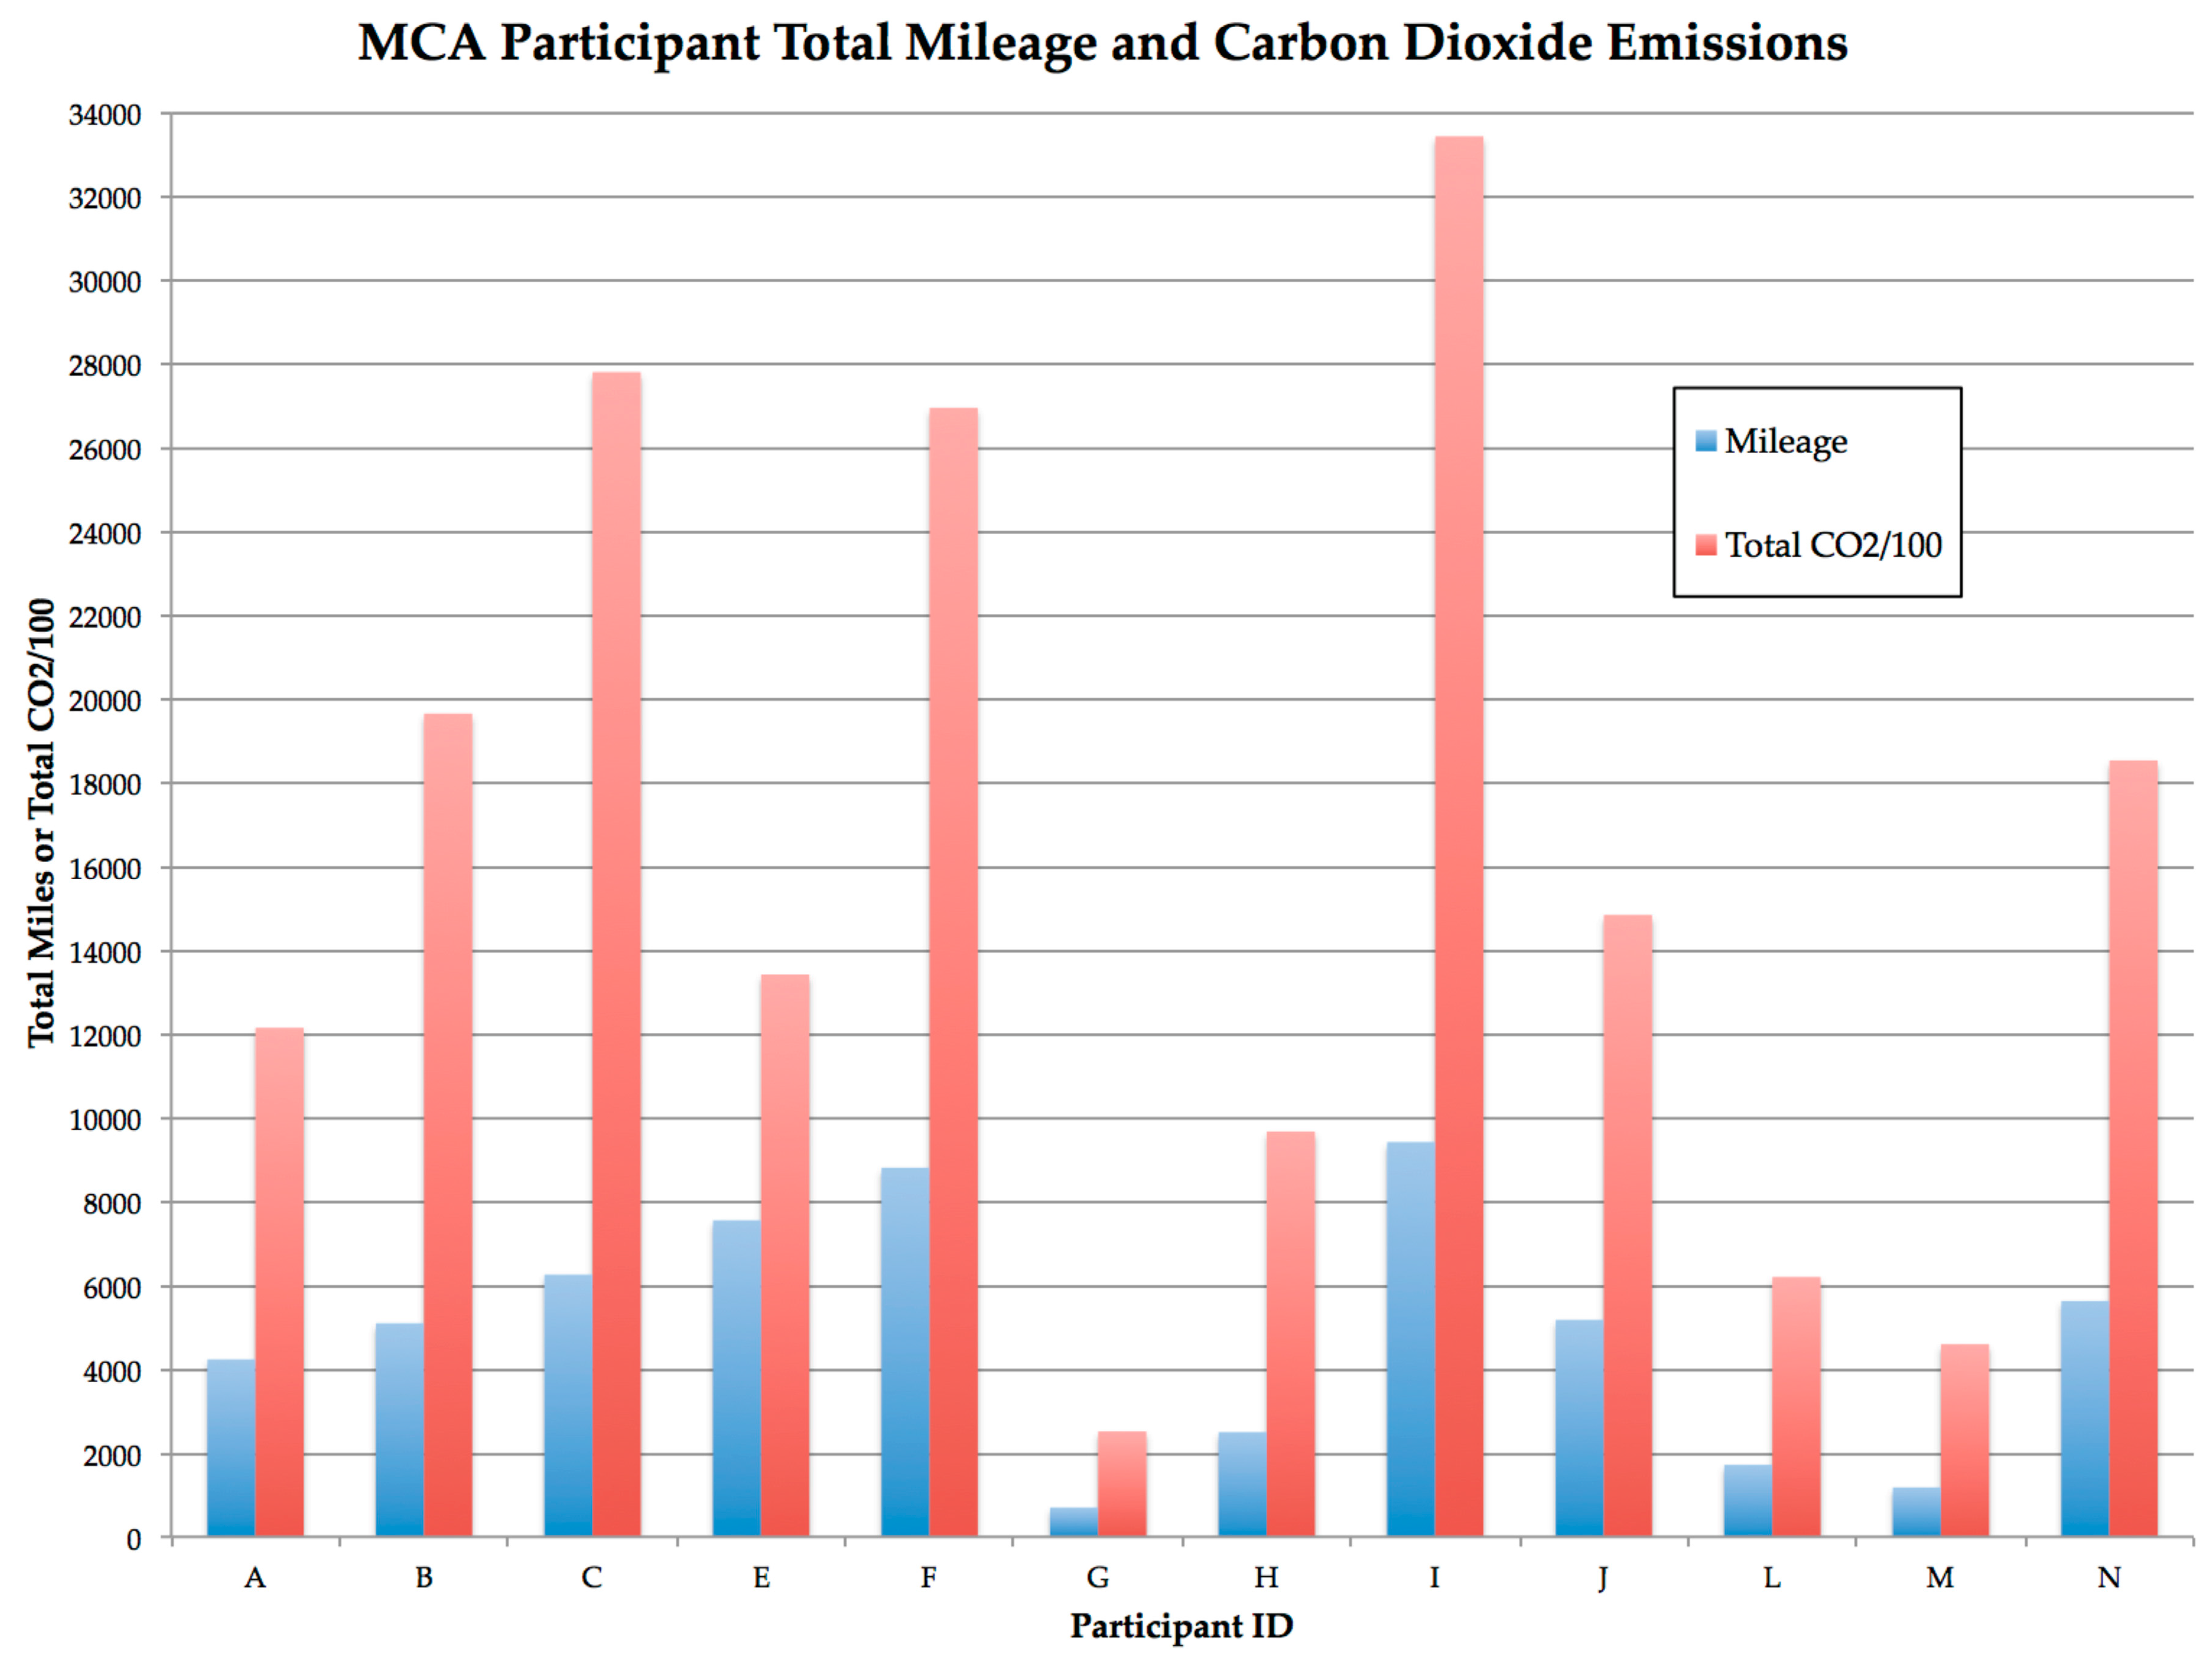
2.3.3. Transportation and Carbon Footprint Monitoring

Transportation was measured in two ways: (1) automobile travel in miles verified by pre/post odometer readings; and (2) use of a smart phone application named Moves [40]. Each participant was instructed to identify the make/model/year of their primary vehicle and disclose its odometer reading prior to the MCA course and again six months later. At enrollment, study participants installed the Moves app onto their smartphones to record activity throughout the entirety of the study. Moves is a free, GPS-based app that records daily activity of users. Running in the background of Apple iPhone or Android phones, Moves automatically records daily walking, running, cycling, and vehicle transport. The type of transport is not automatically determined, but participants were instructed to identify the specific type they used (e.g., personal car, taxi, and bus). Participants were tasked with carrying their smartphones on them at all times to monitor their modes of transportation. From these data, we could assess changes in minutes and distance of mode of transportation over time, whether carbon intensive (car) or better for planetary and human health (bicycle, walking, and public transportation).
Total mileage was translated into grams of carbon dioxide equivalents emitted using Fueleconomy.gov’s Find-a-Car app [41].

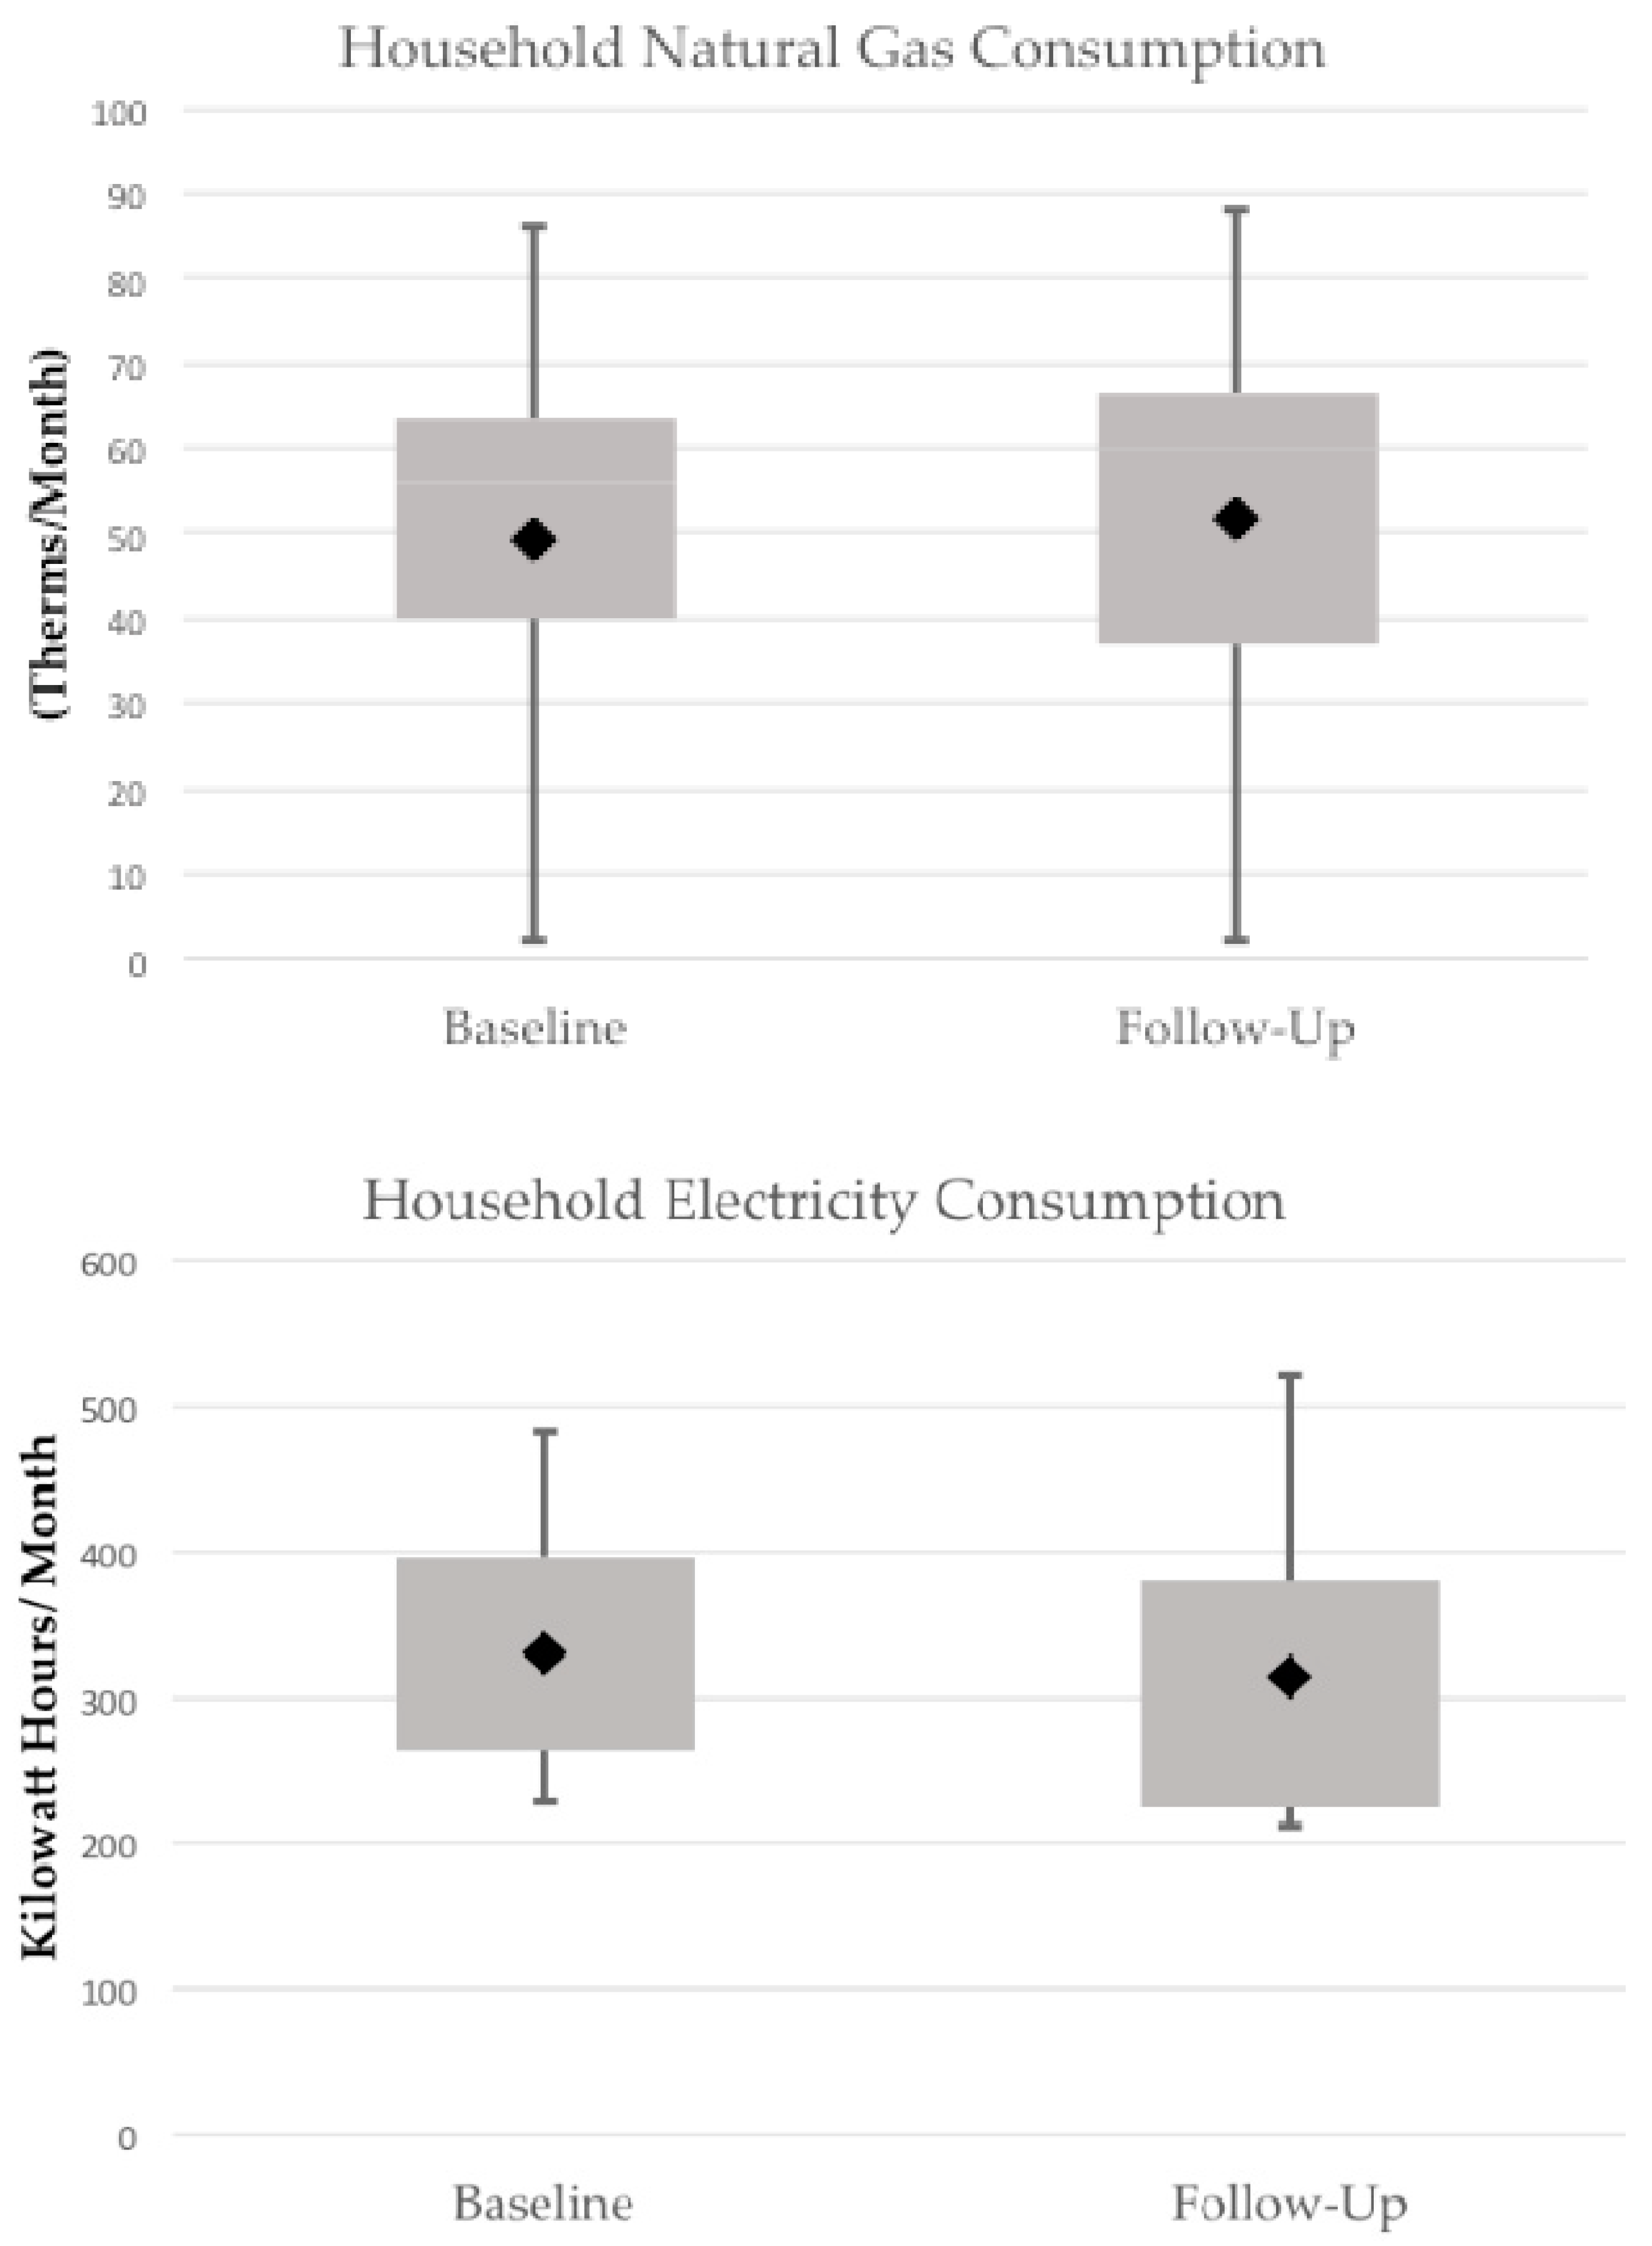
2.3.4. Energy Usage Monitoring

The local energy provider, Madison Gas & Electric’s publicly available utility database was queried to determine each participant’s household electricity and gas consumption [42]. Electricity consumption is reported in kilowatt/hours (kw/h) per month and natural gas consumption is reported in therms/month. Using the U.S. Environmental Protection Agency’s conversion calculator, we converted MCA participant electricity and gas consumption to metric tons of carbon dioxide equivalents (CO2e) per household per year [43].

2.3.5. Health/Happiness/Well-Being Assessment

To get a sense of MCA participant health, happiness, and well-being, we offered five different questionnaires at baseline, at two months (during the MCA course), at four months (shortly after the MCA course), and six months. The questionnaires offered to study participants included: (1) Center for Epidemiologic Studies Depression Scale (CES-D); (2) Pemberton Happiness Index (PHI); (3) Stanford Presenteeism Scale (SPS-6); (4) Perceived Stress Scale (PSS-10); and (5) 36-item Short Form Health Survey (SF-36). Answers from online questionnaire were entered by participants into a customized internet-accessible REDCap study database [44].
CES-D is a validated 20-item, self-report scale designed to measure depressive symptoms in the general population, focusing specifically on the following: depressed mood, feelings of guilt and worthlessness, feelings of helplessness and hopelessness, psychomotor retardation (slowing-down of thought and a reduction of physical movements in an individual), loss of appetite, and sleep disturbance [45,46]. The CES-D is scored 0–60 so that a higher score indicates more depressive symptoms. Individuals with a CES-D score of 16 or greater may be at greater risk of clinical depression. The PHI is a validated, integrative measure of well-being, which is scored by summing eleven items in the domain of remembered well-being and ten items related to experienced well-being with a higher score assuming greater happiness [47]. The SPS-6 is a validated survey instrument measuring worker productivity, and thereby “presenteeism” at work [48,49]. The SPS-6 consists of six items measuring workers’ perceptions of their ability to overcome the distraction of physical and/or psychological problems to handle job stress, complete tasks, achieve goals, and maintain sufficient focus and energy levels. The PSS-10 is a validated measure of perceived stress in study participants [50,51]. To interpret PSS-10, positively-worded survey questions are reverse scored and corresponding ratings are summed, with higher scores indicating more perceived stress (minimum score is 0, maximum score is 40). The SF-36 is a validated, multi-purpose healthy survey that measures quality of life in eight different domains relating to physical and emotional health: physical functioning (PF); role limitations due to physical health (RP); bodily pain (BP); general health (GH); energy/fatigue or vitality (V); social functioning (SF); role limitations due to emotional problems (RE); and emotional well-being/ mental health (MH) [52]. SF-36 domains are scored (0–100) so that a higher score indicates a better health state. SF-36 domains were scored based on the sum of certain SF-36 survey questions and then transformed to a 0–100 scale per instructions in the SF-36 User Manual [53].

2.3.6. Climate and Energy Knowledge Pre/Post Test

Climate change, energy, and carbon footprint knowledge were assessed by administering a college intro-level test (pre- and post-MCA training). The test questions were based on a test used for an online course at UW-Madison, developed by educators in the Cooperative Institute for Meteorological Satellite Studies Space Science and Engineering Center. The test questions are in the Appendix A.

2.3.7. Qualitative Assessment/Focus Group and Interviews

To refine the curriculum and project, all participants were invited to participate in a focus group or an interview after completion of the eight-week MCA. Study staff developed seven questions with suggested question probes. All questions were designed to be open-ended to elicit detailed responses from the participants. Participants in the focus group and the individual interview were asked the same questions. Box 1 lists the specific questions and probes asked to the participants.
Box 1. MCA focus group and interview questions.
  Please give your first name and, just for fun, tell us what your favorite season is.
Q1Introductory questions about MCA
Please describe reasons why you were initially interested in the Mindful Climate Action research study.
Probe as needed:
  • How did you first learn about the program?
  • Think back to when you first became involved with the research study. What were your first impressions?
Q2How much were you expected to know about climate knowledge and did you learn anything additional by the end of the program?
Probe as needed:
  • How much, would you say most people know about climate change and greenhouse gases?
  • Can you think of any topics that you would have liked to learn more about?
  • Were there any climate change related topics that didn’t resonate with you? Why/why not?
Q3Tell me what you thought about the combination of mindfulness with climate education as a way to foster personal change?
Probe as needed:
  • Was it disruptive to have different instructors each week for the climate education portion of the class?
  • Was it helpful to have consistent Mindfulness instructors?
  • Thinking back, what went particularly well within the MCA course? Would you say that the weekly topics meshed with the mindfulness instruction?
  • Some people chose not to fill out the detailed home practice log related to climate change (the back side)—why not?
Q4Can you tell us what you thought about the range of teaching methods (from traditional lecture to hands-on learning) used for MCA?
Probe as needed:
  • Were the instructors knowledgeable? Effective?
  • Were they good at explaining their subject?
  • What do you think about presenting the climate education by video (not in person) each week?
  • Suppose that you were in charge of the MCA Program and could make one change that would make the program better. What would you do?
Q5In what way is your life different because of your participation in the program?
Probe as needed:
  • How satisfied were you with your effort in this course?
  • What were some barriers you found to your participation?
  • Would you encourage your friends/associates to participate in this program?
Q6You have all had a lot of really important things to say. Now, thinking about all of the things we have just talked about, if you had 1 min to tell someone how to improve their carbon footprint, what would you tell him/her?
Wrap UpIs there anything we should have talked about, but didn’t?

3. Results

3.1. MCA Curriculum

The MCA curriculum was generally well received by the participants (see Section 3.7 for specific feedback). One useful finding was that the climate-related materials, especially those from EnAct, were out of date. Future MCA offerings will include short and easy-to-update essays similar to those in EnAct but tailored to address more current carbon footprint considerations.

3.2. Diet and Carbon Footprint Monitoring

Of the 16 participants, nine successfully logged their diets using ASA24 for all three time-points: before, immediately following, and several months after the MCA course. Those nine participants logged 1560 dietary items consumed in those nine days. Using Eco-invent v3.4 and Food Carbon Scope databases as sources [36,37], the calculator matched 807 (51.7% of 1560) of those items with carbon footprint data (Table 1). The dietary carbon footprint data presented in Table 1 are intended only to demonstrate the feasibility of such enumeration. Future improvements to the sophistication and fidelity of the calculator piloted in this study will allow for more useful data. Recognizing our small sample size for this measure (n = 9), we can only discuss the trends in MCA participant dietary carbon footprint. The mean and median carbon footprints for the group decreased from baseline (1.6 and 1.4 kg CO2e, respectively) to the MCA course (1.3 and 1.2 CO2e, respectively); however, both the mean and median carbon footprints for the group increased at follow-up (2.0 and 1.7 kg CO2e, respectively).

3.3. Transportation and Carbon Footprint Monitoring

3.3.1. Transportation Assessment: Moves Results

Eight MCA participants submitted data from the Moves app at the completion of the study period; however, not all of the datasets were complete. Five MCA participants provided complete Moves datasets that consisted of daily minutes and distance walked, bicycled, or driven in a motor vehicle from the months of January to December 2017. Three MCA participants did not have smartphones and so were unable to submit Moves data. Three smartphone-owning participants submitted incomplete Moves datasets. Lastly, three smartphone-owning participants did not submit their Moves app data. Thus, all of our Moves app analysis is based on data from five MCA participants.
Based on the Moves app data for these five complete datasets, during the study period MCA Participants’ mean walking distance was 1.55 miles per week (mean time was 1.81 h/week), mean cycling distance was 1.28 miles/week (mean time was 0.42 h/week), and mean driving (in a motor vehicle such as car, bus, or even carpool) distance was 94 miles per week (mean time was almost 6 h/week). Table 2 shows the descriptive statistics for weekly distance, time, and miles per hour per mode over the study period (n = 5). Since we did not have a sufficiently long baseline time frame before the MCA course commenced, we did not examine the data before and after the MCA course as we did with some other measures in this study.

3.3.2. Transportation Assessment: Odometer Readings

Thirteen MCA participants provided odometer readings at two timepoints: baseline and at follow-up. MCA participants’ total car mileage ranged from 710 to 9411 miles over the study period, for a group average of 4855 miles. MCA participants’ daily car mileage ranged from 3.5 to 43 miles daily over the study period, for a group average of 24 miles per day. Using the fueleconomy.gov app to calculate the corresponding carbon dioxide emissions, this translates into a total contribution of 1,580,438 g (1.6 metric tons) of additional carbon dioxide emissions from our study participants into the atmosphere during our study period. The daily contribution of carbon dioxide emissions from study participant driving ranged from 1260 to 15,396 g (1.3 to 15.4 kg), for a daily group average of 7974 g CO2 (about 8.0 kg). Figure 1 depicts the total mileage and total carbon dioxide emissions for participants with valid data across the entire study period. Figure 1 offers a visual juxtaposition of how total miles driven compares to the total CO2 equivalents emitted. It is important to note that the carbon dioxide emissions are based on the make, model, year of the car. MCA participant vehicles ranged 5–21 years old.

3.4. Energy Usage Monitoring

Electricity and gas consumption are depicted in Figure 2. The participants’ average household electricity consumption in the 12 months prior to baseline assessment was 331 ± 87 kilowatt hours/month (kWh/month) (mean ± s.d., n = 12). Natural gas consumption was 50 ± 25 therms/month. These correspond to emissions of approximately 3.0 and 3.5 metric tons CO2e/household/year, respectively for electricity and natural gas, based on national average greenhouse gas equivalencies [43]. This equates to approximately 8.2 kg CO2e/household/day from electricity consumption and 8.8 kg CO2e/household/day from natural gas consumption for MCA participants at baseline. The participants’ average household electricity consumption in the 12 months after baseline assessment was 314 ± 104 kWh/month (n = 11). Natural gas consumption was 52 ± 27 therms/month. These correspond to emissions of approximately 7.8 kg CO2e/household/day from electricity consumption and 9.0 kg CO2e/household/day from natural gas consumption for MCA participants at follow-up.

3.5. Health/Happiness/Well-Being Assessment

Table 3 provides the results of the surveys distributed to the MCA participants. Between 12 and 16 MCA participants completed the surveys at any given timepoint. Since our sample size is small (n = 16), we are reporting trends over the study period and not drawing any conclusions about causal influences or effects.
For CES-D, a score equal to or above 16 indicates a person at risk for clinical depression. CES-D scores were lowest after the MCA training and at six months post-intervention, which also corresponded with the peak of summer (August). For the SPS-6, the higher the score, the more “present” a person is. In general, all MCA participants became slightly more present over the course of the study period. For PHI, higher scores assume greater happiness, and PHI scores progressively got higher during the study period, with average PHI scores highest at the completion of the study. For PSS-10, scores ranging 0–13 are considered low stress, scores ranging 14–26 are considered moderate stress, and scores ranging 27–40 are considered high perceived stress [50]. Most MCA participants reported a lower perceived stress score after their eight-week class and this continued at six months post-intervention, again corresponding with the peak of summer (August).
Table 4 shows that the majority of participant SF-36 scores either remained approximately the same or slightly improved over the course of the study period. Role physical and vitality went up substantively, with general mental and physical health also trending positively. The vitality score was the lowest average at baseline (49.4%), but improved greatly throughout the study period with an average score of 60.8% at the six-month timepoint. The physical functioning score was the highest average at baseline (91%), and improved slightly over the study period with an average score of 94.2% at the six-month timepoint. The physical component summary, a combined measure of physical health, improved from an average score of 73.6% at baseline to 82% at six month. The mental component summary, a combined measure of mental health, bettered from an average score of 65.6% at baseline to 69.5% at six month. Figure 3 is a graph of the participant average SF-36 percentage scores for each health category at each timepoint.

3.6. Climate and Energy Knowledge Pre/Post Test

The average score for the climate and energy knowledge pre-test taken at baseline was 60%. The average score for the post-test taken after MCA trainings was 65%. Overall, one dropped out, three participants scored worse, one participant scored the same, and ten scored better in the post-test. The test asks a variety of multiple choice, fill in the blank, and true/false questions. While there was a correct answer for most of the questions, the participants were also asked to assess their own climate and energy knowledge. The MCA climate educators did not sufficiently review the questions in advance so the presentation content was not adequately aligned with the test questions.

3.7. Qualitative Assessment/Focus Group and Interviews

Effectiveness of Program
In the focus group, one study participant found the MCA program to be especially meaningful:
“I think it’s effective. I’m not entirely certain what the designers of this study foresaw the effects of this, how they would define the effectiveness of their methods, but yeah, for me it’s kind of like just the experiences kind of stay with you.”
Another study participant in the focus group found the MCA program to be particularly influential in the short-term:
“The key thing is kind of how that translates to a long-term behavior adjustment but at least in the short term I can say that I think that it did have a very effective impact, yes.”
Ability to expand the MCA Program
One study participant suggested in the focus group that there is a great opportunity to scale-up the MCA program by stating:
“We talked a lot in [our MCA] group of like ‘wow if we could just get everyone to know this or believe this then it would just be like a big wave.’”
Example of Specific Behavior Changes
In the focus group, one study participant highlighted how the MCA program has distinctly changed a specific ecologically-related behavior:
“The thing I’ve changed the most in my behavior is I go around relentlessly now turning off lights that my other housemates leave on because it’s like I remember the electricity lesson that he gave us. TURN OFF THESE LIGHTS”
Class Feedback from both interviews and focus groups
Overall most participants spoke about the MCA classes with high regard:
“The class was well-constructed and organized.”
“It was just really welcoming and warm.”
“The format of the teaching was very nice.”
“I thought the mindfulness instructors were amazing. I loved them.”
Critique of MCA
In an interview, one participant was hoping to receive more information on what action strategies he/she could take:
“I expected more about the difference between adaptation and mitigation. [Future MCA classes] could focus more on mitigation strategies.”
In both the focus group and interview, several participants suggested that improvements be made linking mindfulness and climate change:
“[There was] an attempt to bridge mindfulness and climate, but sometimes there just wasn’t a natural way to tie climate change into mindfulness.”
“I didn’t necessarily see the interweaving [of mindfulness and climate change] all the way through it [MCA].”
Collective Insights from Participant Observation
One participant observer saw how mindfulness may improve the MCA learning environment:
“Personally fascinated by learning in state of open awareness.”
Another participant observer saw how MCA impacted the participants:
“MCA appeared to change how participants view their world. They seemed to be more in-tune with nature, more aware of their relationship with food, and more present in their decisions that affect the environment.”
Another participant observer saw how the curriculum could be improved to assist with behavior change:
“MCA Participants kept asking for more direction and example actions in order to be better stewards of the earth. MCA Climate Educators offered a lot of facts and figures, but didn’t give enough instruction on how to change.”

3.8. Feasibility Assessment

Thirteen participants completed the study, for an overall adherence rate of 81%. One dropped out after consenting (participant said he/she was intimidated by the extent of study-related activities), one dropped out after the second MCA session, and one was lost to follow-up. On average, participants attended eight of the nine MCA sessions, one of which was a day-long retreat. Most of the participants completed weekly logs highlighting and describing their mindfulness practice outside of class. However, the majority of the participants failed to log their weekly climate-change related actions.
MCA participant response rate was quite high for all study related tasks. The well-being survey response rate for MCA participants was 86.7% (208/240) (see Table 2 for more information). For dietary recall, the participants collectively recalled their dietary consumption for 144 different 24-h periods. In those recalls, approximately 1500 meal items were identified by ASA24. All participants who remained in the study submitted their car odometer readings. Of the ten participants with smartphones, eight submitted their Moves data, and six of those were complete for analysis.

4. Discussion

4.1. Outcome Assessment

We discuss the results of a feasibility pilot study of an eight-week education program that delivers energy use, climate change, and sustainability content in combination with training in mindfulness meditation.

4.1.1. Curriculum and Climate and Energy Knowledge Test

While the curriculum used for the MCA pilot received mostly positive feedback, opportunities for improvement were noted, and are now being implemented. Through interviews, focus groups, and insights from our participant observers, we gathered invaluable feedback from the pilot study providing clear pathways for improvement.
We determined that having five different in-person science instructors sometimes was disruptive, both for the participants and for the instructors. Moving forward, a climate educator will be present only at the introductory session, and weekly science content will be delivered via MCA videos that the mindfulness instructors can play at appropriate times.
Because there was such little improvement from pre-test to post-test in the pilot study, curriculum revisions will ensure that relevant climate and energy facts queried will be emphasized throughout the course. In the future, the MCA climate educators will better align the lecture content with the pre/post test questions to better establish validity and reliability.
Finally, the participants clearly challenged us to better link mindfulness practice and climate change knowledge throughout the course. For example, one suggestion was to modify the weekly practice logs to place mindfulness practice and climate-related behaviors on the same side of a page, rather than front and back, so participants could reflect and act more often in unison. Future MCA offerings will set this tone during the introductory class, making it clear that participants will be working towards developing a capacity for mindful awareness while simultaneously applying mindful awareness to climate change and carbon footprint considerations. See Appendix A for Revised Curriculum.

4.1.2. Diet and Carbon Footprint Monitoring

Given the small sample sizes, the conclusions drawn from the carbon footprint data presented here are limited. First, the nine-day sample of ASA24 data may not be representative of participant’s diets as a whole. Second, the nine-participant sample precludes generalizations about the demographics represented in the MCA cohort. Third, the nine-participant sample and the nine-day sample of ASA24 together prevent conclusions being drawn regarding the differences in carbon footprints measured in the pre, during, and post time points (Figure 1).
Even so, logging the itemized diets of participants with ASA24 and subsequent carbon footprint enumeration is feasible. Future improvements to the sophistication and fidelity of the calculator piloted in this study will allow for more useful data. The carbon footprints estimated are reasonable given that the calculator analyzed just over 50% of the items logged (almost half of items did not have CO2 equivalents in any of the databases used). The participants’ recalled diets ranged 0.13–1.2 kg CO2e/person/day. The EPIC-Oxford cohort ranged 2.89–7.19 kg CO2e/person/day using a food-frequency questionnaire [54]. In addition, in 2014, Heller and Keoleian estimated the average U.S. diet consumed to have a footprint of 3.6 kg CO2e/person/day based on nationwide loss-adjusted food availability data [55]. Neither used the itemized dietary recalls of individuals. As more studies are added to the databases used by the calculator the validity and comprehensiveness of the calculator will increase.
We hypothesize that, with ASA24 experience and mindfulness training, participants may have become more mindful of what they ate, and more complete in logging and entering that data. As participants gained awareness of what they were eating and each food items’ respective carbon footprints, there was also a potential co-benefit of healthier eating; items with a lower carbon footprint are generally more plant based, which are considered more heart healthy.

4.1.3. Energy Usage Monitoring

The participants in this study at both baseline and follow-up exhibited typical natural gas consumption, but below average electricity consumption. MCA participant household energy consumption did not change substantially from baseline to after the MCA course. Our participants consumed on average 331 and 314 kWh/month of electricity and 50 and 52 therms/month of natural gas at baseline and follow-up, respectively. For comparison, the average consumption of all MG&E customers was 531 kWh/month and 55 therms/month respectively in 2016 [56]. This may reflect higher energy conservation concerns in this sample, which are more readily implemented in electricity consumption. In addition, anecdotally, several the participants lived in apartments where gas consumption is shared between multiple units. In future work, we intend to ask participants about such details as well as participation in MG&E’s “Green Power Tomorrow” option to direct payments towards wind power contributions to the utility’s electricity portfolio [57].

4.1.4. Transportation and Carbon Footprint Monitoring

According to the U.S. Department of Transportation, the average American drives 13,476 miles per year or approximately 37 miles per day [58]. According to their odometers, MCA participants averaged less than the national average with 24 miles per day over the study period; however, one study participant exceeded the national average with an average of 43 daily miles driven.
Per capita bicycle distance in the United States is estimated to be 0.46 miles per week (5.2 min/week) [59]. Based on the Moves app data, MCA participants bicycled an average of 1.28 miles per week, over twice as far as the average distance for Americans. This is probably because Madison, WI is a bicycle friendly community with extensive bike paths and lanes, so much so that it is one of five cities in the U.S. to achieve Platinum status according to the League of American Bicyclists [60]. Per capita walking distance in the United States is about 2.2 miles per week (43.4 min/week) [59]. Based on Moves app data, MCA participants averaged walking about 1.55 miles per week (just shy of 2 h). MCA participants walked less than the average American, and also walked at a pace that was slower.
We were only able to collect valid Moves app data for 5 MCA participants, so this information is not generalizable. Participant feedback revealed that use of the Moves app on Android devices was tricky, and they were unable to differentiate mode of motor vehicle (e.g., car, bus, and rideshare) unlike iPhone users who could do so. This is a limitation of the Moves app because the differentiation between car use and bus use is important for considering carbon footprint and active transportation. Since Americans who use public transportation spend a median of 19 min daily walking to and from public transportation, riding the bus is one opportunity to promote personal health while also reducing individual greenhouse gas emissions [61].
In a recent review of activity monitoring systems applications, the reliability and validity of the Moves app for walking in laboratory and free-living conditions was low; however, this was only for Android phone users and was only tested for measuring step count and no other modes [62]. Evidence is scarce on the validity and reliability of activity apps, including Moves. For future pilot studies, we may consider use of alternative activity trackers, or may test the validity and reliability of the Moves app.
In the MCA session on transportation, participants contemplated the carbon footprint of different modes of transportation, and also considered feasible options for potentially making climate-wise shifts in their personal transportation habits. MCA participants were made aware of the potential co-benefits of switching to more active modes of transportation (e.g., walking, bicycling, and taking public transportation), such as improved personal health from increasing physical activity and improved local air quality [63,64,65]. We cannot presume that the walking and cycling minutes recorded from the Moves app replaced car trips; however, we can view these as increased opportunities for improving physical health. In addition, mindfulness has the potential to instill long-term positive physical activity behaviors. For example, recent research has shown an association between mindfulness and a greater satisfaction with exercise, and those who have a greater satisfaction in exercise, tend to exercise more [66]. In future versions of MCA, we aim to have a longer baseline period where we can track participant transportation behaviors before the intervention. We plan to have more data timepoints to look at the data longitudinally to really assess if participant transportation behavior changes, especially if they had not chosen active transportation as an option before.

4.1.5. Health Assessment

In general, all health and well-being survey responses trended in the positive direction over the course of our study period. MCA participants indicated slightly less depressive symptoms by the end of the study period, slightly more “presence” at work, modest improvements in happiness, minimal reductions in perceived stress, more vitality, and better overall health. While we cannot make any sweeping conclusions about the relationship between Mindful Climate Action trainings and these measures of well-being, we are encouraged that all of the measures improved, even if marginally. Previous studies already have determined a link between mindfulness and positive emotional and physical health outcomes [23,26]. Our findings concur with these studies, indicating that there are potential well-being benefits of MCA participants.

4.1.6. Calculating Carbon Footprint

We were able to calculate approximate daily carbon dioxide emission equivalents for MCA participants in three domains: household energy use (MCA participant household averages of approximately 8 kg CO2e/household/day from electricity consumption and approximately 9 kg CO2e/household/day from natural gas consumption), diet (MCA participant average ranging from 0.13–1.2 kg CO2e/person/day), and motor vehicle transportation (MCA average almost eight kilograms CO2e/person/day). Summing these three domains gives us an average of about 26 kg (57 pounds) CO2e/person/day from our MCA participants (about 9.49 kg or 9.5 metric tons CO2e/(person year)). On average, Americans contribute approximately 17 metric tons/CO2e/(person year) [67].
Our methods for estimating carbon footprint are an innovative and perhaps valid way of assessing carbon-footprint on an individual level, but are not yet comprehensive. For example, almost half of food items do not yet have carbon footprint data, and cannot be included. Other domains not considered for this pilot, which would also contribute to an individual’s carbon footprint, include the purchasing of goods (e.g., clothes, furniture, and electronics), household waste, and travel (flights and hotels). We have thought about ways of measuring and incorporating these other domains into the MCA carbon footprint calculation, and intend to include them in future MCA pilot studies. This will improve the validity and comprehensiveness of our carbon footprint calculation.

4.1.7. Focus Groups and Interviews

Feedback from MCA participant focus groups was notably positive. Most participants reported enjoying the experience and were glad they participated. Several agreed that the program was effective and had a lot of potential to expand. Some participants pin-pointed specific behaviors related to climate change action that they had already changed or intended to change.
One resounding critique of the MCA pilot was the desire for more interweaving of mindfulness and climate change-related teachings. In response, the MCA team will strive for improvement in this area, focusing on making the connections between mindfulness and climate change action more apparent. One simple improvement will be to merge the daily home practice log for mindfulness practice and climate-related behaviors. Another more challenging solution will be for the mindfulness instructors to incorporate climate knowledge directly in the discussion and practice during each session.

4.2. Other Limitations

Results from the MCA pilot study must be considered in light of certain limitations. As this was a feasibility study with a small sample size, the study findings have limited generalizability. This pilot was aimed at testing out procedures, and it was not designed to be able to look at causal influence, which will require a control group and a much larger sample size. In addition, this study did not have a long baseline timeframe before the intervention began, and we only followed participants for six months. In future studies, we would like to obtain baseline characteristics for at least one month prior to MCA trainings, and to follow participants for a full year afterward, which is especially important because of the seasonal nature of active transportation. Additionally, this pilot study was subject to volunteer bias as recruitment was limited to email listservs and community groups with people who are generally already environmentally conscious. It should be noted as well that the education level of participants in this pilot study was unusually high, which could skew results, especially in the psychometric questionnaires. Finally, this study was quasi-experimental and did not have a comparison group. In future studies, we will plan to implement MCA as a waitlisted, randomized controlled trial in which we will be able to better test the effectiveness of MCA on personal health and climate-related behavior change.

5. Conclusions

Overall, the results of this pilot study demonstrate and support the feasibility of an eight-week adult education program that delivers energy use, climate change, and sustainability content in combination with training in mindfulness meditation. MCA was well-received by participants as evidenced by high adherence rate, high measures of participant satisfaction, and high participant response rate for surveys and other study tasks. While our methods of quantifying carbon footprint are still being improved and upgraded, especially in regards to dietary carbon footprint, we have taken great strides in quantifying estimates of our MCA participants’ individual carbon footprints related to diet, transportation, and household energy. To the best of our knowledge, this is the first time an approach such as this has been tested, and it represents a new paradigm for instilling pro-environmental behaviors that reduce individual carbon footprints, while at the same time supporting personal health and happiness.

Author Contributions

B.B., M.M.C., C.M., M.M., A.C., and M.G. conceived, designed, and performed the study. All authors analyzed and interpreted the data. All authors contributed to revisions. M.G. wrote the paper with contributions from all.

Funding

This research was funded by several different sources. Maggie Grabow was supported by a research training grant from the National Center for Complementary and Integrative Health (NCCIH) of the National Institutes of Health, grant number T32AT006956. Bruce Barrett is supported by a mid-career research and mentoring grant from NCCIH of NIH, grant number K24AT006543. Elisa Torres is partially supported by the National Institute of General Medical Sciences of the NIH, grant number 1U54GM115428 and National Center for Advancing Translational Sciences of the NIH, grant numbers UL1TR000427 and KL2TR000428. The content is solely the responsibility of the authors and does not necessarily represent the official views of the National Institutes of Health.

Acknowledgments

We are especially grateful for our mindfulness instructors, Carmen Alonso and Kristi Rietz. We also would like to acknowledge the climate educators: Alex K. Converse, Bruce Barrett, Maggie Grabow, Cathy Middlecamp, and Margaret Mooney.

Conflicts of Interest

The authors declare no conflict of interests.

Appendix A

Climate and Energy Knowledge Test
  • Personally, how well informed do you feel about how Earth’s climate system works?
    (a)
    Very well informed
    (b)
    Fairly well informed
    (c)
    Not very well informed
    (d)
    No clue
  • How well informed do you feel about the different causes of global warming?
    (a)
    Very well informed
    (b)
    Fairly well informed
    (c)
    Not very well informed
    (d)
    No clue
  • How well informed do you feel about the consequences of global warming
    (a)
    Very well informed
    (b)
    Fairly well informed
    (c)
    Not very well informed
    (d)
    No clue
  • What comes closest to your own view on climate change?
    (a)
    Most scientists think the main cause of global warming is human activity and burning fossil fuels
    (b)
    Most scientists think global warming is mostly due to natural causes
    (c)
    There is a lot of disagreement among scientists about the causes of global warming
  • Roughly how much carbon dioxide is in the atmosphere today?
    (a)
    290 ppm
    (b)
    300 ppm
    (c)
    350 ppm
    (d)
    390 ppm
    (e)
    400 ppm
    (f)
    450 ppm
    (g)
    Don’t know
  • Which nation contributes the most carbon dioxide to the atmosphere today?
    (a)
    UK
    (b)
    India
    (c)
    China
    (d)
    U.S.
    (e)
    Russia
    (f)
    Germany
    (g)
    Japan
    (h)
    Don’t know
  • Annual energy savings from replacing an incandescent light bulb with an equivalent LED bulb are:
    (a)
    about the same
    (b)
    about 2 times greater
    (c)
    about 5 times greater
    (d)
    about 8 times greater
    (e)
    about 10 times greater
  • The average American drives about how many miles annually?
    (a)
    3500 miles
    (b)
    7500 miles
    (c)
    10,000 miles
    (d)
    13,500 miles
    (e)
    15,000 miles
  • Which change could affect my annual CO2 emissions the most?
    (a)
    Use a clothes line or drying rack instead of dryer for at least 50% of my laundry.
    (b)
    Wash all my clothes in cold water.
    (c)
    Turn up A/C thermostat in summer by 2 degrees F.
    (d)
    Turn down heating thermostat on winter nights by 1 degree F.
  • Which of the following foods has the greatest carbon footprint per kg of food?
    (a)
    lamb
    (b)
    potato
    (c)
    soybeans
    (d)
    pork
    (e)
    tomato
  • The typical US household has a carbon footprint of:
    (a)
    18 tons/CO2 per year
    (b)
    28 tons/CO2 per year
    (c)
    48 tons/CO2 per year
    (d)
    68 tons/CO2 per year
    (e)
    108 tons/CO2 per year
  • The typical bath uses how many gallons of water?
    (a)
    25 gallons
    (b)
    50 gallons
    (c)
    100 gallons
    (d)
    200 gallons
    (e)
    500 gallons
  • Define greenhouse gas?
  • What is the most abundant greenhouse gas?
  • Which greenhouse gas is of most concern to climate scientist studying warming?
  • What element constitutes the bulk of the mass in any single tree
  • What was the first creature added to the endangered species list because of human-induced global warming?
  • The transportation sector is the greatest contributor to greenhouse gas emissions. (True/False)
  • Global warming is accelerated by the melting of snow and ice cover surfaces. (True/False)
  • Melting of the Arctic ice cap will likely result in rising sea levels. (True/False)
  • Melting of snow and ice in Antarctica and Greenland will likely result in rising sea levels. (True/False)
  • Meals from beef cattle generates more than double the greenhouse gas pollution than other meals. (True/False)
  • Heavy precipitation events have been increasing due to climate change. (True/False)
  • Heavy precipitation in urban areas makes it harder for water to replenish groundwater aquifers. (True/False)
  • Populations and regions least likely to respond to climate change impacts are the most likely to suffer harm. (True/False)
  • Replacing driving to work with active transport (walking or bike riding) 3 days a week or more significantly reduces chances for stroke and/or heart attack. (True/False)

References

  1. Kates, R.W.; Wilbanks, T.J. Making the global local responding to climate change concerns from the ground. Environ. Sci. Policy Sustain. Dev. 2003, 45, 12–23. [Google Scholar] [CrossRef]
  2. Stern, P.C.; Sovacool, B.K.; Dietz, T. Towards a science of climate and energy choices. Nat. Clim. Chang. 2016, 6, 547. [Google Scholar] [CrossRef]
  3. Kollmuss, A.; Agyeman, J. Mind the gap: Why do people act environmentally and what are the barriers to pro-environmental behavior? Environ. Educ. Res. 2002, 8, 239–260. [Google Scholar] [CrossRef]
  4. Berners-Lee, M. How Bad Are Bananas? The Carbon Footprint of Everything; Greystone Books: Vancouver, BC, Canada, 2011; ISBN 978-1-55365-832-0. [Google Scholar]
  5. Pavalache-Ilie, M.; Cazan, A.-M. Personality correlates of pro-environmental attitudes. Int. J. Environ. Health Res. 2018, 28, 71–78. [Google Scholar] [CrossRef] [PubMed]
  6. Byerly, H.; Balmford, A.; Ferraro, P.J.; Wagner, C.H.; Palchak, E.; Polasky, S.; Ricketts, T.H.; Schwartz, A.J.; Fisher, B. Nudging pro-environmental behavior: Evidence and opportunities. Front. Ecol. Environ. 2018, 16, 159–168. [Google Scholar] [CrossRef]
  7. Wamsler, C. Mind the gap: The role of mindfulness in adapting to increasing risk and climate change. Sustainability Science; Springer: New York, NY, USA, 2018; pp. 1–15. [Google Scholar]
  8. Sol, J.; Wals, A. Strengthening ecological mindfulness through hybrid learning in vital coalitions. Cult. Stud. Sci. Educ. 2014, 10, 203–214. [Google Scholar] [CrossRef]
  9. Patel, T.; Holm, M. Practicing mindfulness as a means for enhancing workplace pro-environmental behaviors among managers. J. Environ. Plan. Manag. 2017, 1–26. [Google Scholar] [CrossRef]
  10. Kabat-Zinn, J. Mindfulness-based interventions in context: Past, present, and future. Clin. Psychol. Sci. Pract. 2003, 10, 144–156. [Google Scholar] [CrossRef]
  11. Kabat-Zinn, J. Mindfulness Meditation; Nightingale-Conant Corporation: New York, NY, USA, 1995. [Google Scholar]
  12. Fischer, D.; Stanszus, L.; Geiger, S.; Grossman, P.; Schrader, U. Mindfulness and sustainable consumption: A systematic literature review of research approaches and findings. J. Clean. Prod. 2017, 162, 544–558. [Google Scholar] [CrossRef]
  13. Wamsler, C.; Brossmann, J.; Hendersson, H.; Kristjansdottir, R.; McDonald, C.; Scarampi, P. Mindfulness in sustainability science, practice, and teaching. Sustain. Sci. 2018, 13, 143–162. [Google Scholar] [CrossRef]
  14. Barbaro, N.; Pickett, S.M. Mindfully green: Examining the effect of connectedness to nature on the relationship between mindfulness and engagement in pro-environmental behavior. Personal. Individ. Differ. 2016, 93, 137–142. [Google Scholar] [CrossRef]
  15. Panno, A.; Giacomantonio, M.; Carrus, G.; Maricchiolo, F.; Pirchio, S.; Mannetti, L. Mindfulness, Pro-environmental Behavior, and Belief in Climate Change: The Mediating Role of Social Dominance. Environ. Behav. 2017. [Google Scholar] [CrossRef]
  16. Amel, E.L.; Manning, C.M.; Scott, B.A. Mindfulness and Sustainable Behavior: Pondering Attention and Awareness as Means for Increasing Green Behavior. Ecopsychology 2009, 1, 14–25. [Google Scholar] [CrossRef]
  17. Jacob, J.; Jovic, E.; Brinkerhoff, M.B. Personal and Planetary Well-being: Mindfulness Meditation, Pro-environmental Behavior and Personal Quality of Life in a Survey from the Social Justice and Ecological Sustainability Movement. Soc. Indic. Res. 2009, 93, 275–294. [Google Scholar] [CrossRef]
  18. Tang, Y.; Geng, L.; Schultz, P.W.; Zhou, K.; Xiang, P. The effects of mindful learning on pro-environmental behavior: A self-expansion perspective. Conscious. Cogn. 2017, 51, 140–148. [Google Scholar] [CrossRef] [PubMed]
  19. Barrett, B.; Hayney, M.S.; Muller, D.; Rakel, D.; Ward, A.; Obasi, C.N.; Brown, R.; Zhang, Z.; Zgierska, A.; Gern, J. Meditation or exercise for preventing acute respiratory infection: A randomized controlled trial. Ann. Fam. Med. 2012, 10, 337–346. [Google Scholar] [CrossRef] [PubMed]
  20. Black, D.S. Mindfulness-based interventions: An antidote to suffering in the context of substance use, misuse, and addiction. Subst. Use Misuse 2014, 49, 487–491. [Google Scholar] [CrossRef] [PubMed]
  21. Goyal, M.; Singh, S.; Sibinga, E.M.; Gould, N.F.; Rowland-Seymour, A.; Sharma, R.; Berger, Z.; Sleicher, D.; Maron, D.D.; Shihab, H.M. Meditation programs for psychological stress and well-being: A systematic review and meta-analysis. JAMA Intern. Med. 2014, 174, 357–368. [Google Scholar] [CrossRef] [PubMed]
  22. Lauche, R.; Cramer, H.; Dobos, G.; Langhorst, J.; Schmidt, S. A systematic review and meta-analysis of mindfulness-based stress reduction for the fibromyalgia syndrome. J. Psychosom. Res. 2013, 75, 500–510. [Google Scholar] [CrossRef] [PubMed]
  23. Grossman, P.; Niemann, L.; Schmidt, S.; Walach, H. Mindfulness-based stress reduction and health benefits: A meta-analysis. J. Psychosom. Res. 2004, 57, 35–43. [Google Scholar] [CrossRef]
  24. Obasi, C.N.; Brown, R.; Ewers, T.; Barlow, S.; Gassman, M.; Zgierska, A.; Coe, C.L.; Barrett, B. Advantage of meditation over exercise in reducing cold and flu illness is related to improved function and quality of life. Influenza Other Respir. Viruses 2013, 7, 938–944. [Google Scholar] [CrossRef] [PubMed]
  25. Garland, E.L.; Gaylord, S.A.; Fredrickson, B.L. Positive Reappraisal Mediates the Stress-Reductive Effects of Mindfulness: An Upward Spiral Process. Mindfulness 2011, 2, 59–67. [Google Scholar] [CrossRef]
  26. Brown, K.W.; Ryan, R.M. The benefits of being present: Mindfulness and its role in psychological well-being. J. Pers. Soc. Psychol. 2003, 84, 822. [Google Scholar] [CrossRef] [PubMed]
  27. Chiesa, A.; Calati, R.; Serretti, A. Does mindfulness training improve cognitive abilities? A systematic review of neuropsychological findings. Clin. Psychol. Rev. 2011, 31, 449–464. [Google Scholar] [CrossRef] [PubMed]
  28. Wang, J.; Geng, L.; Schultz, P.W.; Zhou, K. Mindfulness Increases the Belief in Climate Change: The Mediating Role of Connectedness with Nature. Environ. Behav. 2017. [Google Scholar] [CrossRef]
  29. Kasser, T. Living both well and sustainably: A review of the literature, with some reflections on future research, interventions and policy. Philos. Trans. R. Soc. A 2017, 375. [Google Scholar] [CrossRef] [PubMed]
  30. Barrett, B.; Grabow, M.; Middlecamp, C.; Mooney, M.; Checovich, M.M.; Converse, A.K.; Gillespie, B.; Yates, J. Mindful climate action: Health and environmental co-benefits from mindfulness-based behavioral training. Sustainability 2016, 8, 1040. [Google Scholar] [CrossRef] [PubMed]
  31. Newenhouse, S.C. Enact Steps to Greener Living; Madison Environmental Group: Madison, WI, USA, 2008; ISBN 978-0-615-26607-7. [Google Scholar]
  32. Shim, J.-S.; Oh, K.; Kim, H.C. Dietary assessment methods in epidemiologic studies. Epidemiol. Health 2014, 36, e2014009. [Google Scholar] [CrossRef] [PubMed]
  33. Subar, A.F.; Kirkpatrick, S.I.; Mittl, B.; Zimmerman, T.P.; Thompson, F.E.; Bingley, C.; Willis, G.; Islam, N.G.; Baranowski, T.; McNutt, S. The Automated Self-Administered 24-hour dietary recall (ASA24): A resource for researchers, clinicians, and educators from the National Cancer Institute. J. Acad. Nutr. Diet. 2012, 112, 1134–1137. [Google Scholar] [CrossRef] [PubMed]
  34. Kirkpatrick, S.I.; Subar, A.F.; Douglass, D.; Zimmerman, T.P.; Thompson, F.E.; Kahle, L.L.; George, S.M.; Dodd, K.W.; Potischman, N. Performance of the Automated Self-Administered 24-hour Recall relative to a measure of true intakes and to an interviewer-administered 24-h recall. Am. J. Clin. Nutr. 2014, 100, 233–240. [Google Scholar] [CrossRef] [PubMed]
  35. Diep, C.S.; Hingle, M.; Chen, T.-A.; Dadabhoy, H.R.; Beltran, A.; Baranowski, J.; Subar, A.F.; Baranowski, T. The automated self-administered 24-hour dietary recall for children, 2012 version, for youth aged 9 to 11 years: A validation study. J. Acad. Nutr. Diet. 2015, 115, 1591–1598. [Google Scholar] [CrossRef] [PubMed]
  36. Hallström, E.; Carlsson-Kanyama, A.; Börjesson, P. Environmental impact of dietary change: A systematic review. J. Clean. Prod. 2015, 91, 1–11. [Google Scholar] [CrossRef]
  37. Agri-footprint®|LCA Food Database. Available online: http://www.agri-footprint.com/ (accessed on 7 January 2018).
  38. Ecoinvent. Available online: http://www.ecoinvent.org/ (accessed on 7 January 2018).
  39. CleanMetrics—FoodCarbonScope. Available online: http://www.cleanmetrics.com/html/foodcarbonscope.htm (accessed on 7 January 2018).
  40. Moves—Activity Diary for iPhone and Android. Available online: https://moves-app.com/ (accessed on 16 March 2018).
  41. FuelEconomy.gov—The Official U.S. Government Source for Fuel Economy Information. Available online: http://www.fueleconomy.gov (accessed on 24 January 2018).
  42. Average Energy Use and Cost for Residential Addresses—Madison Gas and Electric—Madison, Wisconsin. Available online: https://www.mge.com/customer-service/home/average-use-cost/ (accessed on 28 March 2018).
  43. US EPA. Greenhouse Gases Equivalencies Calculator—Calculations and References. Available online: https://www.epa.gov/energy/greenhouse-gases-equivalencies-calculator-calculations-and-references (accessed on 16 March 2018).
  44. Harris, P.A.; Taylor, R.; Thielke, R.; Payne, J.; Gonzalez, N.; Conde, J.G. Research electronic data capture (REDCap)—A metadata-driven methodology and workflow process for providing translational research informatics support. J. Biomed. Inform. 2009, 42, 377–381. [Google Scholar] [CrossRef] [PubMed]
  45. Radloff, L.S. The CES-D scale: A self-report depression scale for research in the general population. Appl. Psychol. Meas. 1977, 1, 385–401. [Google Scholar] [CrossRef]
  46. Lewinsohn, P.M.; Seeley, J.R.; Roberts, R.E.; Allen, N.B. Center for Epidemiologic Studies Depression Scale (CES-D) as a screening instrument for depression among community-residing older adults. Psychol. Aging 1997, 12, 277. [Google Scholar] [CrossRef] [PubMed]
  47. Hervás, G.; Vázquez, C. Construction and validation of a measure of integrative well-being in seven languages: The Pemberton Happiness Index. Health Qual. Life Outcomes 2013, 11, 66. [Google Scholar] [CrossRef] [PubMed]
  48. Koopman, C.; Pelletier, K.R.; Murray, J.F.; Sharda, C.E.; Berger, M.L.; Turpin, R.S.; Hackleman, P.; Gibson, P.; Holmes, D.M.; Bendel, T. Stanford presenteeism scale: Health status and employee productivity. J. Occup. Environ. Med. 2002, 44, 14–20. [Google Scholar] [CrossRef] [PubMed]
  49. Turpin, R.S.; Ozminkowski, R.J.; Sharda, C.E.; Collins, J.J.; Berger, M.L.; Billotti, G.M.; Baase, C.M.; Olson, M.J.; Nicholson, S. Reliability and validity of the Stanford Presenteeism Scale. J. Occup. Environ. Med. 2004, 46, 1123–1133. [Google Scholar] [CrossRef] [PubMed]
  50. Cohen, S.; Kamarck, T.; Mermelstein, R. A global measure of perceived stress. J. Health Soc. Behav. 1983, 24, 385–396. [Google Scholar] [CrossRef] [PubMed]
  51. Cohen, S.; Janicki-Deverts, D. Who’s stressed? Distributions of psychological stress in the United States in probability samples from 1983, 2006, and 2009. J. Appl. Soc. Psychol. 2012, 42, 1320–1334. [Google Scholar] [CrossRef]
  52. Sullivan, M.; Karlsson, J.; Ware, J.E., Jr. The Swedish SF-36 Health Survey—I. Evaluation of data quality, scaling assumptions, reliability and construct validity across general populations in Sweden. Soc. Sci. Med. 1995, 41, 1349–1358. [Google Scholar] [CrossRef]
  53. Ware, J.; Snoww, K.; MA, K.; BG, G. SF36 Health Survey: Manual and Interpretation Guide; The Health Institute, New England Medical Center: Boston, MA, USA, 1993; p. 30. [Google Scholar]
  54. Scarborough, P.; Appleby, P.N.; Mizdrak, A.; Briggs, A.D.M.; Travis, R.C.; Bradbury, K.E.; Key, T.J. Dietary greenhouse gas emissions of meat-eaters, fish-eaters, vegetarians and vegans in the UK. Clim. Chang. 2014, 125, 179–192. [Google Scholar] [CrossRef] [PubMed]
  55. Heller, M.C.; Keoleian, G.A. Greenhouse gas emission estimates of US dietary choices and food loss. J. Ind. Ecol. 2015, 19, 391–401. [Google Scholar] [CrossRef]
  56. Alex, K. (University of Wisconsin-Madison, Madison, WI, USA). Personal Communication, 2018. [Google Scholar]
  57. Green Power Tomorrow—Madison Gas and Electric—Madison, Wisconsin. Available online: https://www.mge.com/environment/green-power/gpt/index.htm?redirect=greenpower (accessed on 26 March 2018).
  58. U.S. Department of Transportation Federal Highway Administration Average Annual Miles per Driver by Age Group. Available online: https://www.fhwa.dot.gov/ohim/onh00/bar8.htm (accessed on 1 February 2018).
  59. Pucher, J.; Buehler, R.; Merom, D.; Bauman, A. Walking and cycling in the United States, 2001–2009: Evidence from the National Household Travel Surveys. Am. J. Public Health 2011, 101, S310–S317. [Google Scholar] [CrossRef] [PubMed]
  60. Scott New Platinum, New Gold Bicycle Friendly Communities. Available online: http://www.bikeleague.org/content/new-platinum-new-gold-bicycle-friendly-communities (accessed on 27 March 2018).
  61. Besser, L.M.; Dannenberg, A.L. Walking to Public Transit: Steps to Help Meet Physical Activity Recommendations. Am. J. Prev. Med. 2005, 29, 273–280. [Google Scholar] [CrossRef] [PubMed]
  62. Kooiman, T.J.; Dontje, M.L.; Sprenger, S.R.; Krijnen, W.P.; van der Schans, C.P.; de Groot, M. Reliability and validity of ten consumer activity trackers. BMC Sports Sci. Med. Rehabil. 2015, 7, 24. [Google Scholar] [CrossRef] [PubMed]
  63. Grabow, M.L.; Spak, S.N.; Holloway, T.; Stone, B., Jr.; Mednick, A.C.; Patz, J.A. Air quality and exercise-related health benefits from reduced car travel in the midwestern United States. Environ. Health Perspect. 2012, 120, 68. [Google Scholar] [CrossRef] [PubMed]
  64. Maizlish, N.; Woodcock, J.; Co, S.; Ostro, B.; Fanai, A.; Fairley, D. Health cobenefits and transportation-related reductions in greenhouse gas emissions in the San Francisco Bay area. Am. J. Public Health 2013, 103, 703–709. [Google Scholar] [CrossRef] [PubMed]
  65. Woodcock, J.; Edwards, P.; Tonne, C.; Armstrong, B.G.; Ashiru, O.; Banister, D.; Beevers, S.; Chalabi, Z.; Chowdhury, Z.; Cohen, A.; et al. Public health benefits of strategies to reduce greenhouse-gas emissions: Urban land transport. Lancet 2009, 374, 1930–1943. [Google Scholar] [CrossRef]
  66. Tsafou, K.-E.; De Ridder, D.T.; van Ee, R.; Lacroix, J.P. Mindfulness and satisfaction in physical activity: A cross-sectional study in the Dutch population. J. Health Psychol. 2016, 21, 1817–1827. [Google Scholar] [CrossRef] [PubMed]
  67. Boden, T.; Andres, R.; Marland, G. Global, Regional, and National Fossil-Fuel CO2 Emissions (1751–2014) (V. 2017); Carbon Dioxide Information Analysis Center (CDIAC), Oak Ridge National Laboratory (ORNL): Oak Ridge, TN, USA, 2017. [Google Scholar]
Figure 1. MCA participant total personal motor vehicle mileage and subsequent carbon dioxide emissions/100 over the study period.
Sustainability 10 01508 g001
Figure 2. MCA participant natural gas (therms/month) and electricity consumption (kilowatt hours/month) during the twelve months prior to baseline (baseline) and the twelve months after the beginning of MCA (follow-up).
Sustainability 10 01508 g002
Figure 3. MCA participant score percentages for each SF-36 category at each timepoint across the study.
Sustainability 10 01508 g003
Table 1. Summary of the carbon footprints (kg CO2e) of the nine participants with pre, during, and post ASA24 logs. The calculator used eco-invent and FoodCarbonScope as the data sources.
ParticipantBaseline CF
(kg CO2e)
During MCA CF
(kg CO2e)
Follow-Up CF
(kg CO2e)
# of Items Logged
B3.01.33.7204
C0.90.91.6121
D1.51.21.789
E2.20.71.0148
F1.11.21.8198
G1.01.31.1197
I1.41.92.2230
J0.40.81.6186
L2.72.83.7187
Group Sum14.112.118.3
Group Mean1.61.32.0
Group Median1.41.21.7
Group Range2.62.12.6
Table 2. MCA participant Moves app data (n = 5) descriptive statistics for the entire study period.
ModeUnitMeanMedianSDMin.Max.
WalkHours/week1.812.180.950.612.87
Miles/week1.551.750.860.482.42
Average mph0.840.800.070.790.95
RunHours/week0.010.010.010.000.02
Miles/week0.020.020.020.010.04
Average mph2.012.010.421.712.32
CycleHours/week0.420.290.510.001.09
Miles/week1.281.141.450.012.82
Average mph3.112.930.612.603.97
Motor VehicleHours/week5.853.853.782.8511.50
Miles/week93.9682.8962.7434.72185.17
Average mph19.3313.4516.357.2148.05
Table 3. Descriptive statistics for surveys (* = survey not completed for this timepoint).
Timepoint
Month 0Month 2Month 4Month 6
CES-Dn16131213
Mean11.110.813.39.7
SD5.78.611.38.4
Minimum4.00.02.00.0
Median8.09.010.06.0
Maximum21.026.035.023.0
SPS-6n16131313
Mean21.523.523.224.1
SD3.73.84.24.2
Minimum15.014.015.014.0
Median22.024.024.025.0
Maximum27.029.028.030.0
PHIn16141313
Mean87.688.486.890.0
SD13.619.220.220.5
Minimum58.050.053.049.0
Median91.592.594.098.0
Maximum103.0111.0117.0113.0
PSS-10n1514*14
Mean16.213.8*12.0
SD5.36.1*5.2
Minimum8.05.0*3.0
Median16.013.0*13.5
Maximum27.025.0*20.0
Table 4. Average scores for SF-36 out of 100% for each category; * PCS includes PF, RP, BP, GH, and V. ** MCS includes GH, V, RE, SF, and MH.
% Physical Functioning (PF)% Role Physical (RP)% Bodily Pain (BP)% General Health (GH)% Vitality (V)% Social Functioning (SF)% Role Emotional (RE)% Mental Health (MH)Physical Component Summary (PCS) *Mental Component Summary (MCS) **
Baseline91.081.378.863.749.482.075.068.075.665.6
2 months93.392.986.666.157.582.176.267.781.268.1
4 months97.190.483.167.853.583.766.768.381.366.3
6 months94.296.279.465.960.881.774.471.78269.5

