Establishing Design Strategies and an Assessment Tool of Home Appliances to Promote Sustainable Behavior for the New Poor


1
Graduate School of Design, National Yunlin University of Science and Technology, Yunlin 64002, Taiwan
2
School of Knowledge Science, Advanced Institute of Science and Technology, Nomi, Ishikawa 923-1292, Japan
*
Author to whom correspondence should be addressed.
Sustainability 2018, 10(5), 1507; https://doi.org/10.3390/su10051507
Submission received: 25 March 2018
/
Revised: 21 April 2018
/
Accepted: 8 May 2018
/
Published: 10 May 2018
(This article belongs to the Section Economic and Business Aspects of Sustainability)
Abstract
:Environmental benefits related to home appliance life cycles depend on how these products are used. Designing home appliances that promote sustainable behavior is an effective way to reduce environmental impacts. This study aimed to increase relevant opportunities for promoting sustainable behavior practices on the new poor through home appliances, which is rarely discussed in the fields of design for sustainable behavior (DfSB) and product design. In particular, relevant assessment tools or indicators are lacking in DfSB, and people’s use of home appliances is generally unsustainable. Therefore, repertory grid technology was used to understand the perceptions of the new poor, develop an assessment tool, and construct design strategies for home appliances that promote sustainable behavior. Data were collected from the new poor and from designers. Through cluster and principal component analyses, three strategy types were proposed that corresponded to different product features, suggestions, and guidance. In addition, the effectiveness and potential of an assessment tool were demonstrated using the Wilcoxon rank test. The findings could be used by designers, retailers, and green marketers to propose effective product design programs that promote sustainable behavior of the new poor during product use.
1. Introduction
In sustainable development, the relationships among poverty, the environment, and the economy are a key area of interest [1,2]. Historically, and until now, support for relevant policies, theories, and methods has come from diverse disciplines, such as economics [3], environmental science [4], design [5], and ecosystems [6]. However, balancing these three aspects remains a challenge, based on emerging issues and existing contexts that have not yet been fully explored.
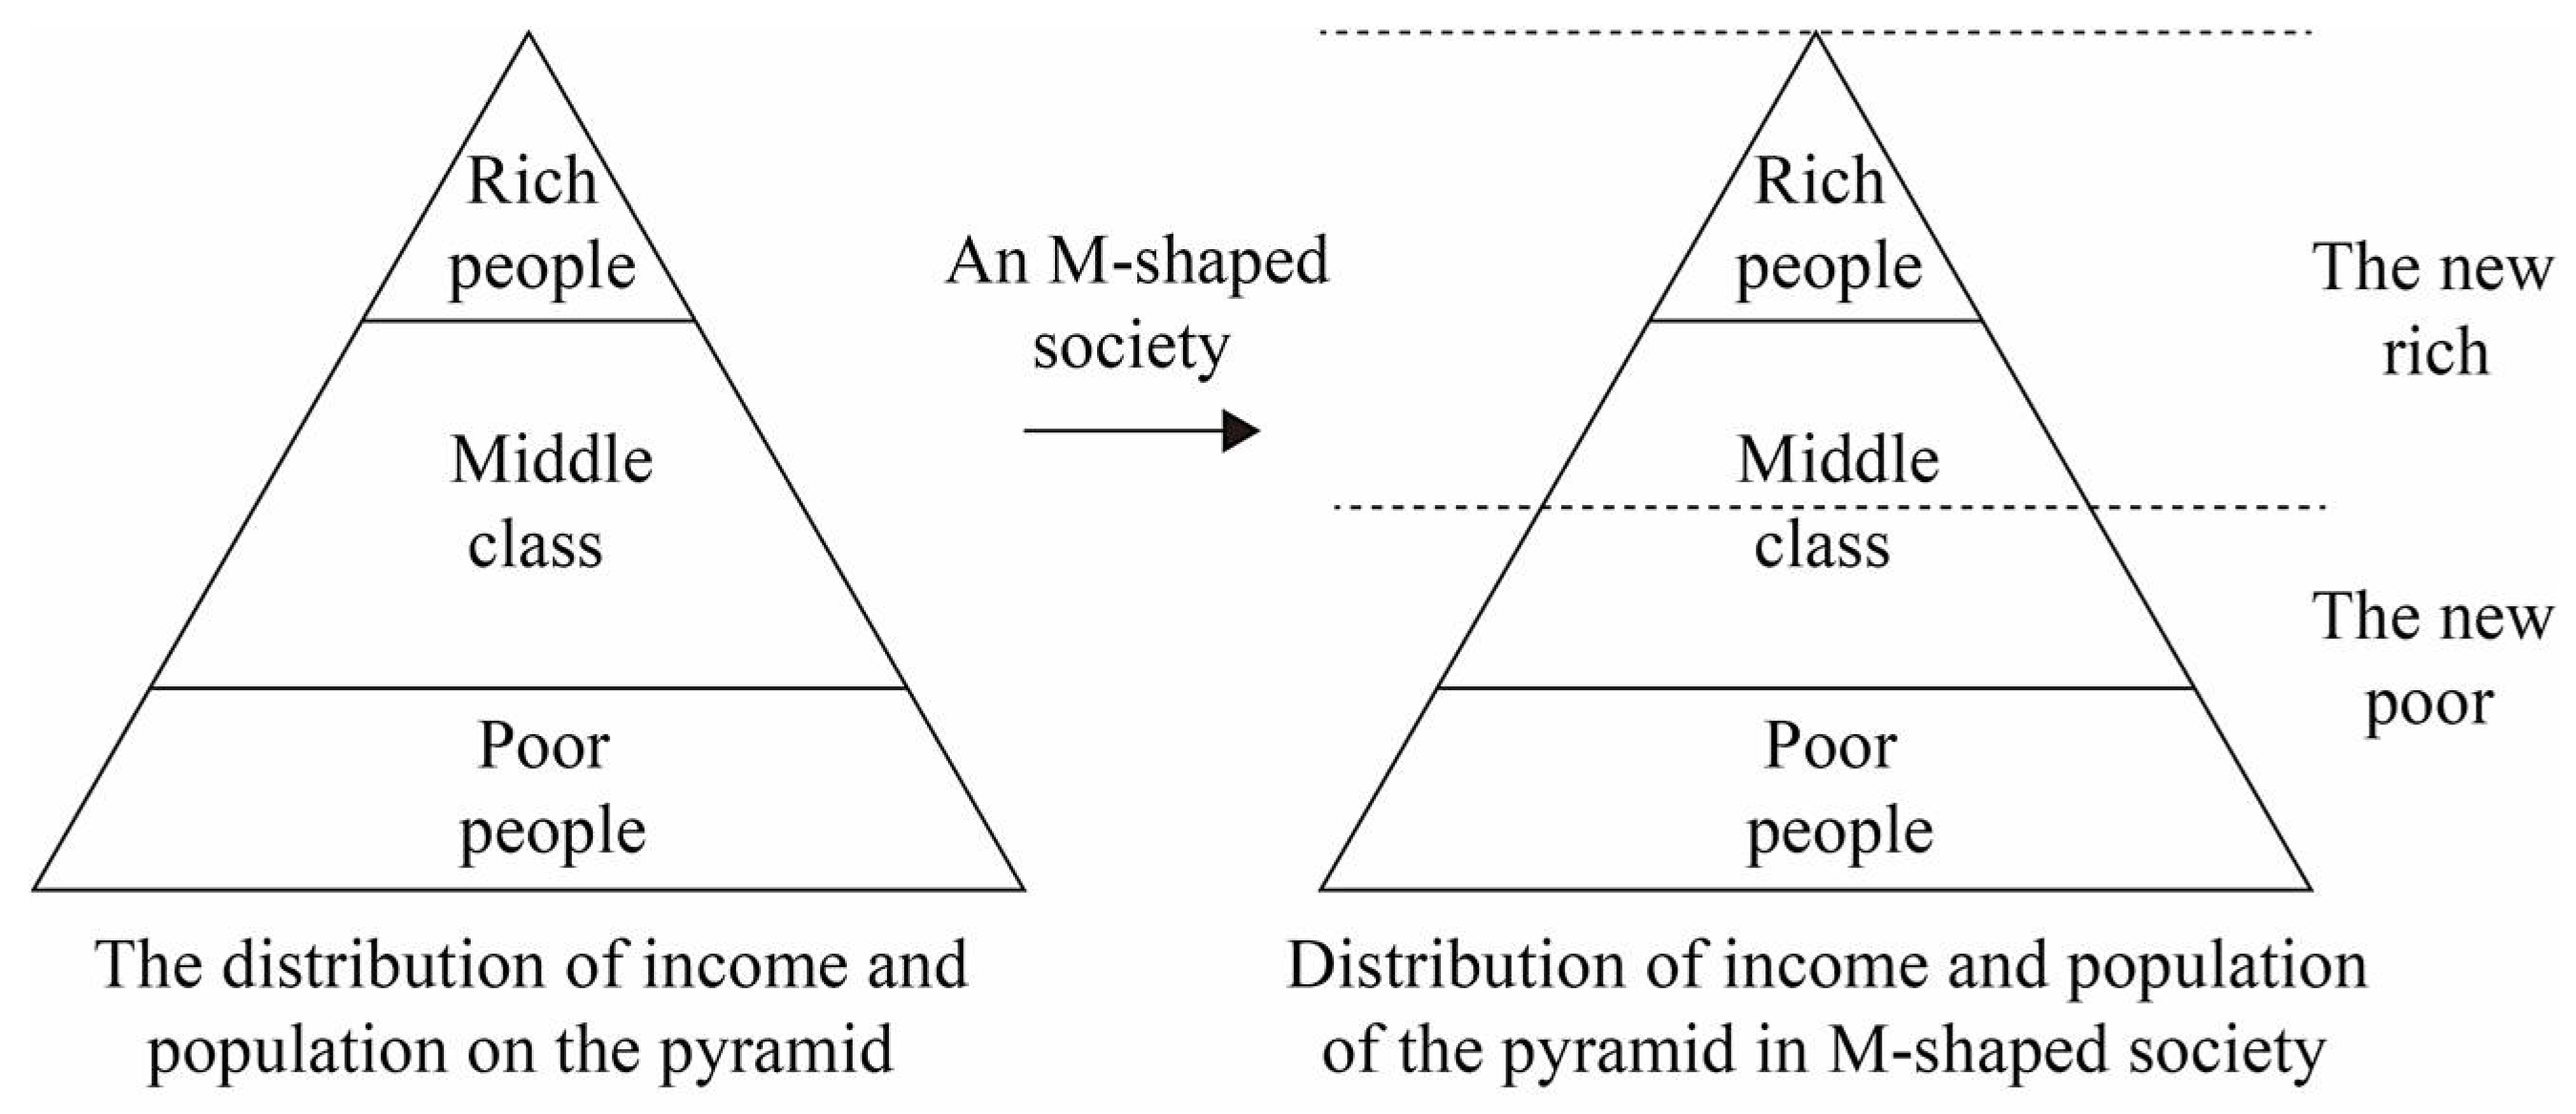
Recent evidence shows that due to globalization, economic growth in Asia has increased the occurrence of relative poverty or income inequality [3]. The emergence of an M-type society is growing more apparent based on the implementation of a free economic market system, resulting in the disappearance of a good part of the middle class and the polarization of classes. Changes in social demography have produced many invisible, new poor people (Figure 1) [7,8,9]. In particular, the new poor is different from the traditional poor. In a broad sense, the new poor have working and spending power [10], but fall into poverty because they do not meet the socially-recognized basic standard of living [9,11,12]. Therefore, most current studies explore the causes [13], benefits [14], policies [15], social assistance [16], and employment [17] for the new poor, but neglect economic and ecological factors relevant to this group. For example, the new poor have a unique view of consumption [10,18]. The main patterns of their consumption include impulsiveness, good consumer intentions, moderate spending power, and ease in buying discounted products [10]. This is a blue ocean market that has yet to be fully exploited; while enterprises can continue to develop new business opportunities and models [8], the relevant literature is limited. Secondly, the new poor have a good grasp of green perceptions and concepts, but consumer behavior is relatively diminished in this area due to the lack of awareness of green products [8]. Fortunately, scholars have pointed out that product design strategy can affect the purchase intent of green products by the new poor [19], suggesting a clear direction for future research.
Design strategy is crucial in the early stages of product development. Many businesses have used sustainable methods and strategies to reduce negative environmental impacts throughout the lifecycle of a product, and have achieved many concrete results [20,21,22]. However, some green design studies show that, in some respects, whether the expected benefits in terms of overall environmental performance and resource consumption are achieved is unclear [23,24]. The substantial environmental impact of the interaction between user behavior and the product may not be appropriately accounted for [21,25]. As an example, the energy-saving effect of home appliances depends on human behavior [23,26]. If the user lacks good use behavior, it will increase the energy consumption of home appliances despite underlying high-efficiency energy-saving technologies. Some evidence points out that inappropriate product design strategies may cause the consumer’s sustainable behavior to reduce over time or occur only temporarily [27], that the use phase of the product lifecycle is often overlooked in sustainable design [28], or that the product does not meet consumer requirements or expectations [29]. These situations have led designers to realize that they must create products that meet the needs of users and encourage users to utilize resources more efficiently [24]. Based on the above background, there is a dimension of sustainable design that has not yet been fully discussed for the new poor.
Design for sustainable behavior (DfSB) is an emerging area of research, enabling designers to influence user behavior through purposeful product design [30,31]. The interaction between the user and the product is strongly influenced by design [25,32]. The implementation approach can be practiced through user-centric design, in order to explore the user’s intrinsic needs and perceptions of the product [21]. This product design process is viewed as a chain of exploration, generation, and evaluation [33]. In spite of the fact that a framework for the design of a sustainable behavior-related product has been proposed [30], there is a need to develop assessment metrics for DfSB [34] and evaluate case studies [21], thereby further building design strategies and guidance. Based on the above factors, at present, many design and research methods exist for exploring and evaluating users’ intrinsic cognitive needs. Among these, repertory grid technology (RGT) is an effective exploration technology that can collect personal cognitive information within an appropriate timeframe, and construct grid assessment tools to formulate relevant strategies [35,36,37]. RGT is suitable for this research direction. Overall, this study proposes new insights based on the new poor, exploring design strategies and an assessment tools regarding home appliances and the encouragement of the new poor to exercise sustainable behavior.
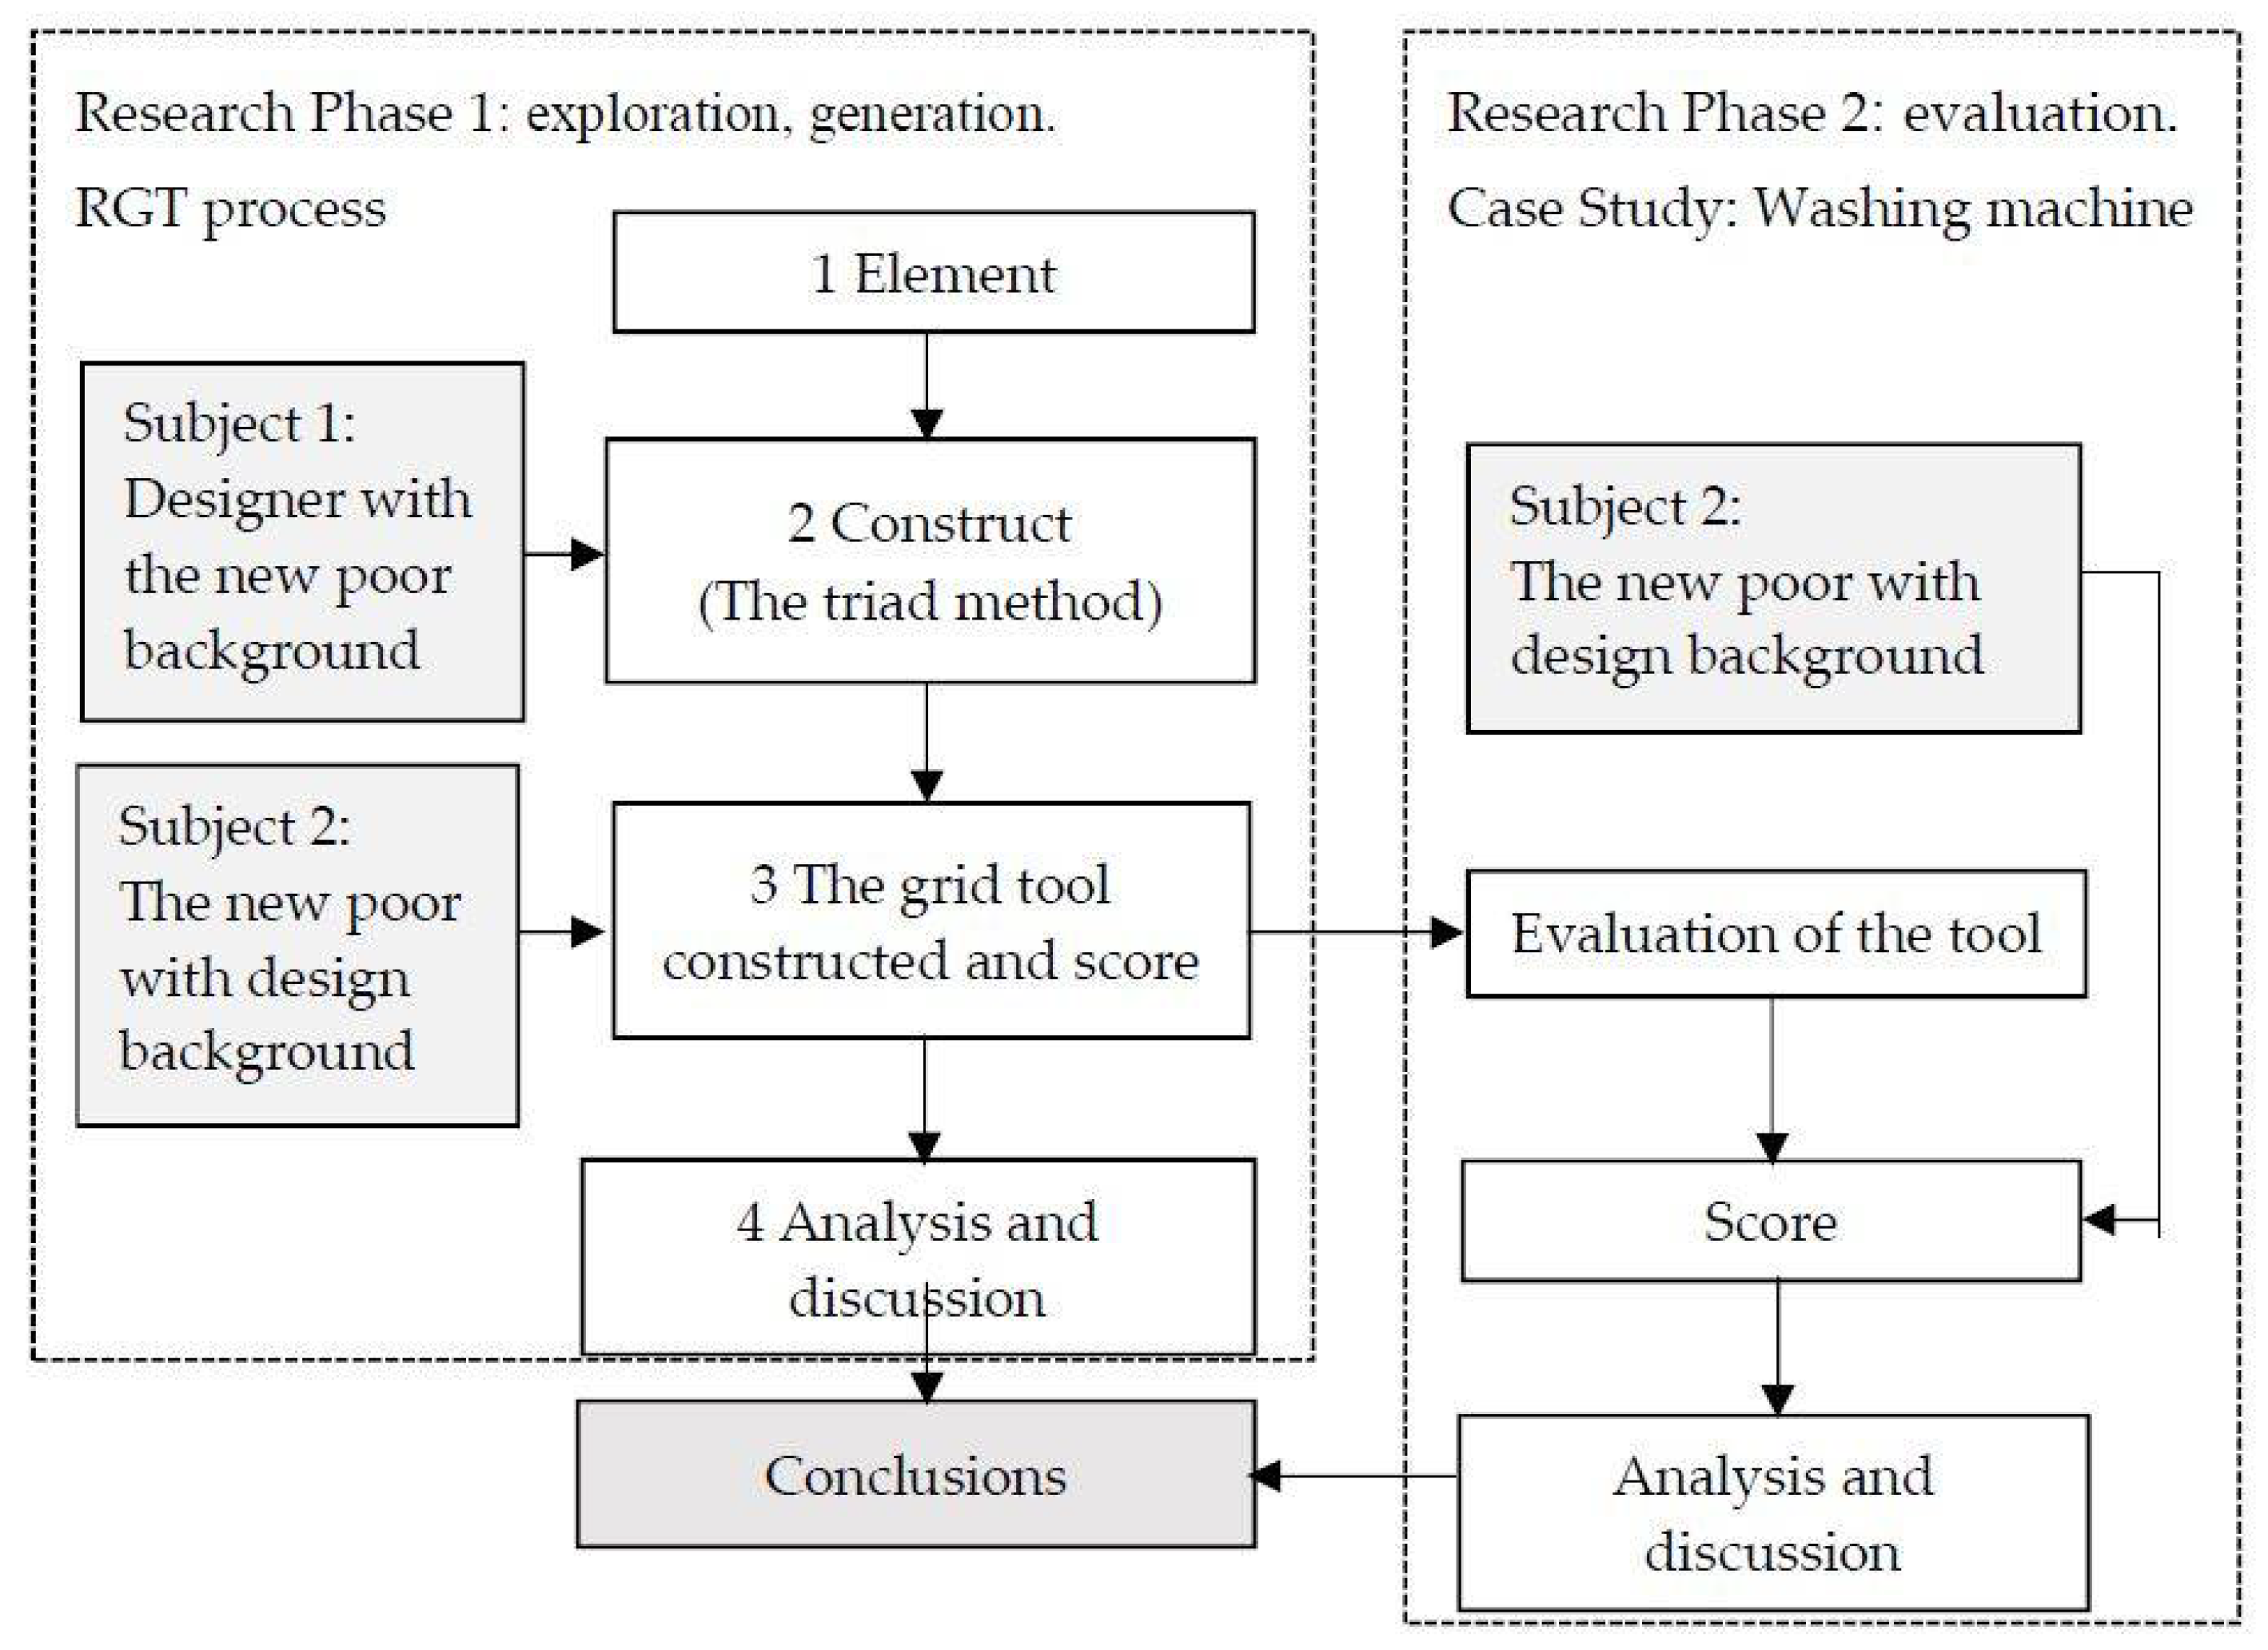
The purposes of this study are to use RGT to understand the psychological cognition of the new poor regarding the products that can promote sustainable behavior, in order to develop an assessment tool and to create product design strategies that promote sustainable behavior. Furthermore, a case study was used to clarify the utility and potential of this tool according to the scholars’ suggestions [21,34]. Based on the research results, designers, retailers, and green marketing can plan and implement effective sustainable design programs to increase the triggering and practicing of sustainable behavior on the part of the new poor during the product use phase. The research framework is shown in Figure 2. After Section 1 is introduced, Section 2 discusses the literature related to the new poor, and DfSB and RGT are used as the basis to support this research. Section 3 introduces the research materials, methods, and analysis tools to achieve the research purpose according to the research direction and data attributes. Section 4 is the analysis and discussion. The data analysis results are mainly considered to put forward the overall planning and guidance, in order to guide the research argument. Finally, the conclusion of this research is offered in Section 5, including the research achievements, contribution, suggestions, and prospects. Detailed descriptions will be presented in the following sections.
2. Background
2.1. New Poor Selection and Exploration of Green Behavior
Under the evolution of free trade and economic globalization, new impoverished populations have emerged from within existing social structures [10] and are characterized by certain demographics [38]. Among them, the working poor work long hours, and either their wage growth cannot keep pace with price inflation or their wages are insufficient to maintain a reasonable quality of life [12]. Young workers are at high risk of becoming working poor [38,39,40] because of atypical and unstable work [39]. Many studies in Taiwan have explored the relationship between young workers and the working poor [17,41]. For example, according to the Directorate General of Budget, Accounting and Statistics (DGBAS) survey, 1.95 million young people under the age of 30 were employed in 2015, with 206,000 people (10.56%) earning less than TWD 20,000 per month and 1.134 million people (58.15%) earning less than TWD 30,000 per month [42]. In 2014, the average monthly salary for a major work recurrent income per person was TWD 35,986, and those employed who earned less than TWD 30,000 accounted for more than 40% of the total. Among them, the average monthly income of young workers (TWD 28,925) is less than the expenditure per person per month (TWD 30,472) [43,44]. According to a youth survey conducted in Taiwan, 58.4% of young individuals earn less than TWD 300,000 per year, 23.9% of them between TWD 310,000 to 500,000, and 14.4% of them between TWD 510,000 to 800,000. Within this group, 70.5% of youth think they are the “young poor” [45]. However, as the young working poor receive an income and are simultaneously affected by the global economy, they are likely to harbor materialistic and hedonistic views of consumption under the interaction of internal psychological and external environmental factors [46]. Despite not being well-paid, the new poor have some spending power with which to alleviate the stress of long working hours [47]. Thus, economic globalization not only widens the income gap, but also changes the consumer market and affects consumer behavior [10]. Under such circumstances, ecological Marxism predicts that the capitalist process of production and consumption will combine with the factor of social class, leading to resource consumption and unsustainable development, and thereby creating an ecological crisis [48].
Many studies have shown that while young consumers pay more attention to current and emerging environmental problems [49], the environmental behavior of youth is not ideal [50]. Compared to older adults, young people lack incentives to “do things for the environment” [51]. When young people are forced to make a choice between product quality and environmental protection, most are unwilling to compromise their own needs in favor of the environment [52]. In other words, the youth age groups lack sustainable practices. Exploring the perceptions and understanding of young people regarding home appliances that promote sustainable behavior will help advance research into related product strategies. It is estimated that 70–80% of national energy use and greenhouse gas (GHG) emissions may be directly related to family activities, which affect energy consumption both directly and indirectly. The electricity consumption of home appliances has increased by 70% [28]. Therefore, considering economic and environmental factors leads this study to clarify and explore the design of home appliance products that promote sustainable behavior among the new poor.
2.2. Design for Sustainable Behavior
Since 1990, green design has developed in a different direction [21], moving towards the encouragement of more sustainable behavior. This has evolved from the subject of design to broader issues of DfSB [53]. DfSB research areas originated in design, sociology, environmental psychology, behavioral psychology, and sustainability [53]. Its purpose is to use design strategies to reduce the impact on the environment by influencing users to practice sustainable behaviors during the product use phase [30,31]. However, sustainable design has faced many challenges, such as in the case of technically-optimized products which are often expected to change user behavior, but are not used enough to result in permanent behavior change [54]. Human behavior is difficult to predict and can be affected by many factors [33]. As a result, it has been suggested that design interventions are effective coping strategies [54,55,56].
Design interventions can affect user behavior with or without their conscious awareness [30,54]. The goal of DfSB is to use design strategy to influence users to practice sustainable behavior during the product use phase, in order to reduce environmental impacts [30,31]. Seven DfSB product design approaches have been proposed [57]: (1) eco-information, which makes product loss messages visible in order to motivate consumer responses to resource usage; (2) eco-feedback, which is the provision of instant feedback to help consumers make decisions that are compatible with environmental protection and social responsibility; (3) eco-steer, promoting feasibility and binding design orientation; (4) eco-spur, whereby incentives and penalties are used; (5) eco-choice, where consumers are encouraged to think about their own behavior and take responsibility for their own choices; (6) eco-technology, where existing usage habits are suppressed by advanced technological design that changes or controls user behavior; and (7) clever design, where user habits are changed without their awareness through innovative product design, resulting in environmental or societal benefits. As a result, designers can develop products that impact user behavior through strategic decision-making in the early design stage [30]; however, a question remains regarding what design strategies are most relevant to a wide range of family practices and behaviors, and the importance of various factors in adopting and properly using DfSB strategies. This demonstrates that peoples’ behavior during the use phase should be of concern [58]. More sustainable practices should be encouraged so that sustainability can be achieved during product use [59].
In the empirical research on DfSB, a case-based approach was proposed to establish the DfSB product type that would convince users to engage in more physical activity, leading to lifestyles of health and sustainability [59]. This refrigerator is designed via eco-information and eco-technology. It successfully reduced food waste by one-quarter to one-half by leveraging the ability to print expiry date alerts, print shopping lists and send them by text or email, and engage in color-coding for food [60]. In addition, plate size was reduced by a clever design; this small intervention reduces food waste by 20% [61]. Mobile phones have been used in a case study to positively enhance consumer sustainability through DfSB [57]. Electric kettles that reduce resource consumption through DfSB or, in other words, that positively affect sustainable consumer behavior, have been developed [62]. The above results are in line with Shih’s [59] study, which may be easier to establish by narrowing the scope and focusing on the DfSB design for a particular type of product. DfSB is a useful approach that enables designers to understand and address behavioral problems and guide consumers toward product practices that improve product environmental performance.
2.3. Repertory Grid Technology
RGT originated in Kelly’s theory of personal construction, the main purpose of which was to explore and understand personal psychological perspectives. Individuals use their self-concept to evaluate and explain their surroundings and possess the rationality to belong to the cognitive environment that they construct [35]. The personal structure system is the foundation for people to develop their personality, attitudes, and perceptions of reality [63]. RGT assumes that when people try to shape their world, they need to understand meaning through the polarization assessment of a personal construct [35]. However, the relative poles do not necessarily oppose each other, but rather lie within a range of weights [64]. Therefore, the construct is composed of a set of bi-polar words, such as male-female and happy-sad [65,66]. By measuring the polarity of the structure, subjects demonstrate their inner level of perception [35,65]. RGT has given researchers the opportunity to explore individual development patterns at the implicit level [63]; it is applicable to the study of qualitative and explanatory phenomena [67] and has been widely used in design-related research. The study points out that RGT is a common method and technology employed in consumer research; it uses a structured approach to ascertain consumer perceptions, and links product characteristics to form consumer messages about perceptions, preferences, and values [68]. Later, design researchers analyzed users’ mental models through consumer messages to understand how those users think about the product [36]. RGT helps designers understand and analyze various design options to meet user expectations [36]. Huang et al. [69] explored product attributes related to consumer sentiment and proposed a method of product configuration analysis based on personal construction theory. Keynan et al. [37] assessed the impact of the development of systematic thinking skills among junior high school students and supported the use of a grid scale as an effective tool for assessing learner conceptual models. Yan et al. [70] studied the initial stages of product conceptualization and proposed the Sustainable Product Conceptualization System (SPCS).
In summary, RGT can be used to explore the cognitive structure of the subject, and then to understand and predict the subject’s preference regarding the relevant direction and pattern. In this study, RGT is a mental model used to explore and understand the implicit knowledge of the new poor towards the DfSB products, which could be helpful for product designers when designing sustainable products. The specific implementation steps for the RGT are described in detail in Section 3.
3. Materials and Methods
3.1. Research Process
This research aims to explore the perceptions of the new poor, and opportunities related to promoting practices of sustainable behavior in Taiwan. According to the introduction and literature review, RGT is effective at capturing user-generated perspectives when applied to design studies [36]. DfSB is intended primarily to lead to increased sustainable behavior [30]. Personal needs and perceptions play an important role in product design development [36], which is consistent with user-centered design patterns [33]. Therefore, this study follows the design process of sustainable development behavior that includes exploration, generation, and evaluation [71]. The research process is divided into two phases and is shown in Figure 3. Study phase 1 follows the steps of the RGT research method to understand the subjects’ views of the DfSB design approaches, develop a grid assessment tool, and propose design strategies that enhance the sustainable behavior of household appliances. Research Phase 2, based on various scholars’ advice [21,34] and taking the washing machine as a case study, mainly aims to verify the utility of the tool via questionnaires in order to prove its potential as an assessment tool of DfSB. Finally, the two results are compiled to put forward the conclusions of this study.
3.2. Research Subjects
This study seeks to explore the new poor in Taiwan; that is, the young working poor of Taiwan. The government has failed to provide a definition of this new group [17], and RGT is a type of qualitative research [67] which adopts purposive sampling to select the research subject [72]. Therefore, this study adopts the scholars’ suggestions [43,73] for classifying young workers as aged 15–29, whose monthly income is less than NTD 30,000, and who work more than 35 h a week, as possible members of the new poor group. Phase 1 was divided into two parts in the study design. The first part was the construction of the grid tool. Designers with a new poor background were chosen as subjects, based on the design spindle of user-centered DfSB, the indicator of a tool, and the constant gap between user needs surveys and designers’ design practices in general product design studies [74]. Therefore, in this study, the roles of the designer and user overlap. These young designers are selected from among college design students who currently have full-time employment, fit into the category of the new poor, have designer roles, and have achieved sufficient learning in the area of design (design learning performance correlates with thinking ability [75]). Four people agreed to participate in the study. The second part deals with the scoring. Members of the young new poor with a design background were chosen as subjects based on their ability to provide reliable information and improve research validity as a basis for product design strategies; 38 young new poor were selected who studied at the college design department. Research Phase 2 uses a case study to evaluate the grid tool. The same 38 young new poor were selected in this phase.
3.3. Research Design
3.3.1. Research Phase 1: The RGT Process
Basic implementation of RGT includes elements, constructs, the grid tool construction and scoring, and analysis and discussion [76,77]. The main purpose of the RGT is to acquire the mental constructs through perceptions of the elements, and then to develop the grid tool using the mental constructs and, finally, to establish design strategies through use of the grid tool to promote decision-making.
(1) Elements
The element is the subject to be recognized and constructed based on self-experience [37,78]. In order to effectively understand the research subject’s perceptions of DfSB design approaches used to establish the product strategy to promote the practice of sustainable behavior in the use phase, this study uses six DfSB design approaches which influence the purchase of green products by the new poor as elements [19]. These include: (1) eco-choice; (2) eco-information; (3) eco-spur; (4) eco-steer; (5) eco-technology; and (6) clever design. These six approaches can be used to explore the experience of DfSB design approaches on this group to extract their mental constructs. Constructs can show aspects of why and how important elements work.
(2) Constructs
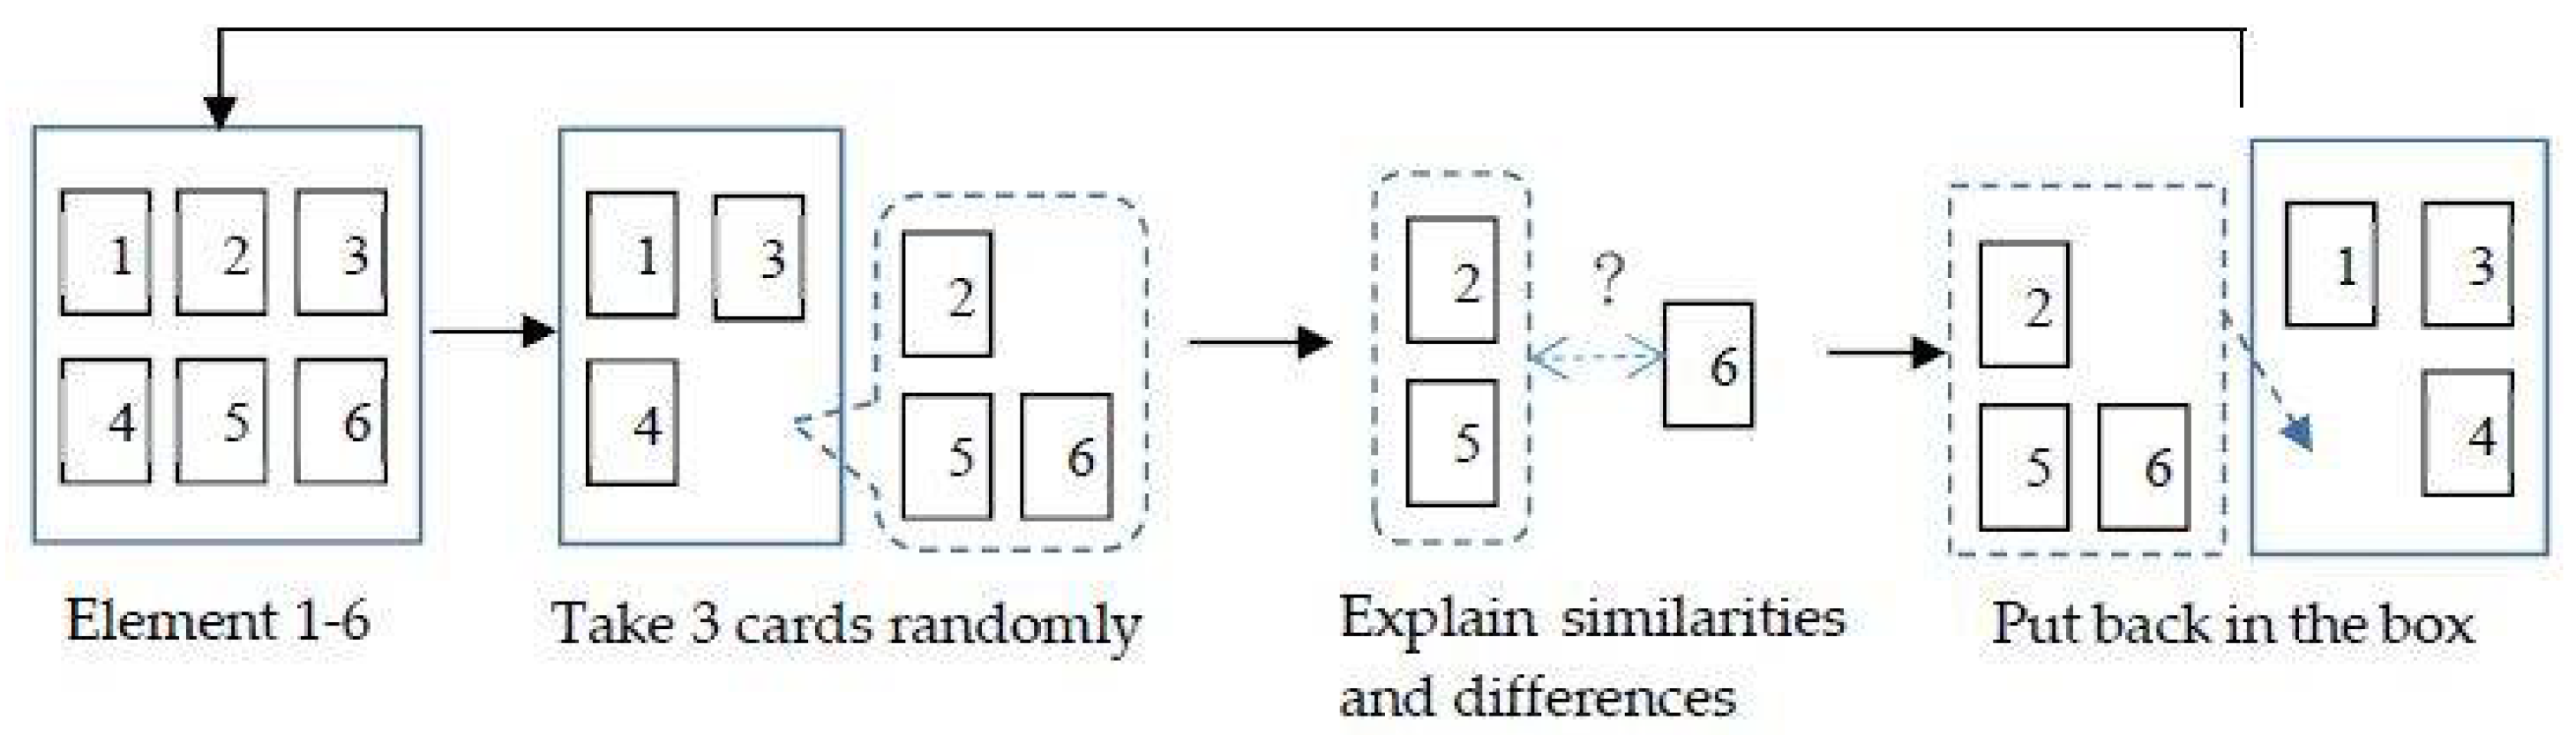
Various ways of comparing elements may lead to personal mental constructs. The triad method is considered the most suitable to explore the construct of a subject [35]. The six elements (DfSB design approaches) were written on a small card and put in a box; then, the subject randomly extracted three cards. During this process, when the subject explains the similarities of the two cards (elements) as the positive nature of the construct, they also explain the difference between the third card and the first two, which is expressed as the negative pole of the construct. After the explanation, these cards were put back into the box; the subject then extracted three cards again and repeated the same process. This process is not completed until a specified amount of time has passed, or new constructs are no longer mentioned, as shown in Figure 4. Before the experiment, the four designers were asked to read a short essay on elemental descriptions in order to establish the basic concepts of DfSB design approaches. Where ambiguities occurred, the researcher explained the elements until all the designers clearly understood. During the experiment, the researcher recorded the words of each subject to facilitate the construction of the grid tools and mental constructs. Each subject was assessed for 45 min. In total, 187 constructs falling into 23 types were obtained from the four designers (cf. Appendix A). Research suggests that the optimal number of constructs is 10 [79]. Accordingly, we retained the 10 most common constructs.
(3) The grid tool construction and score
The third step is to build the grid tool. Elements are placed above a checkered grid, with the constructor on the left side creating a 6 × 10 grid (Table 1). In order to clarify information pertaining to the perceptions and experiences of the young new poor of the DfSB design approaches, a five-point Likert scale was used, with each question item given the choices of “strongly agree”, “agree”, “neither agree nor disagree”, “disagree”, and “strongly disagree”, from five points (positive) to one point (negative), respectively. This step in the study included 38 young new poor, with a design background, as subjects. The 38 young new poor subjects were asked to read a short essay on elemental descriptions before the experiment in order to establish basic concepts. After rating was completed, the reliability was analyzed. Reliability analysis measures the degree of internal consistency. Cronbach’s alpha was 0.820, which is greater than 0.8 and, therefore, indicates that the scale has good consistency [80]. Analysis and discussion of the RGT process are described in detail in Section 4.
3.3.2. Research Phase 2
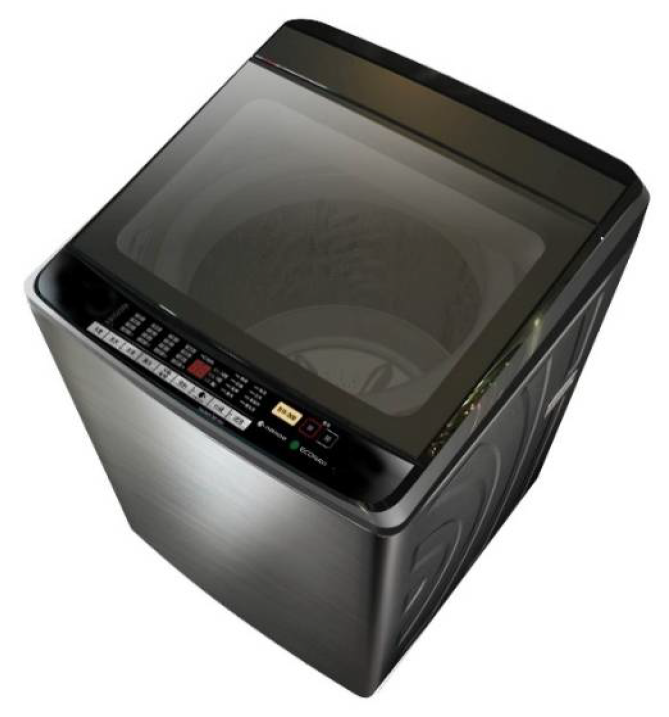
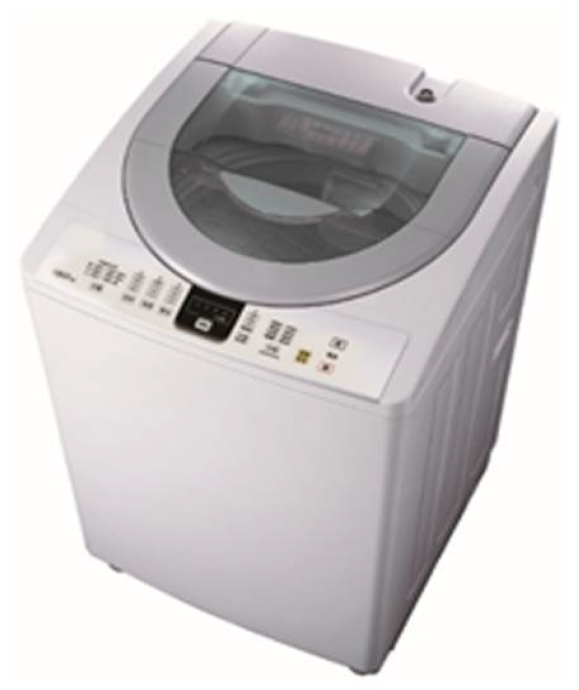
In order to test whether this tool can effectively interpret differences between products we selected the washing machine as a case study, comparing machines of the same brand and capacity, but with varying power consumption levels (highest vs. lowest), as shown in Table 2. This means that the degrees of DfSB of the washing machine differ because the washing machine design use can affect the energy consumption when doing the laundry [81], and the laundry process involves social and technical considerations [82]. Based on the above, washing machines were selected from the official website of green products in Taiwan [83], thus ensuring environmental credibility and compliance with eco-design principles. In addition, this study edited the picture of the washing machine (removed the brand and adjusted the ratio) in order to meet the objective criteria. The study process involved participants (38 young new poor from Research Phase 1) entering the experimental situation after they had watched advertisements for research objects A and B. The tool was then scored and the data analyzed. More details are shown in Appendix B.
4. Analysis and Discussion
RepIV is widely used in RGT. Principal component analysis (PCA) and cluster analysis-based FOCUS programs are the two main analytical processes for RepIV [84]. RepIV aimed to find new axes perpendicular to each other in two-dimensional space, and to explain the distribution and aggregation of elements through PCA. Cluster analysis was used to understand the context of the grouping of the elements and constructs, as well as to identify the cross-arrangement between elements and the configuration construct.
4.1. Cluster Analysis
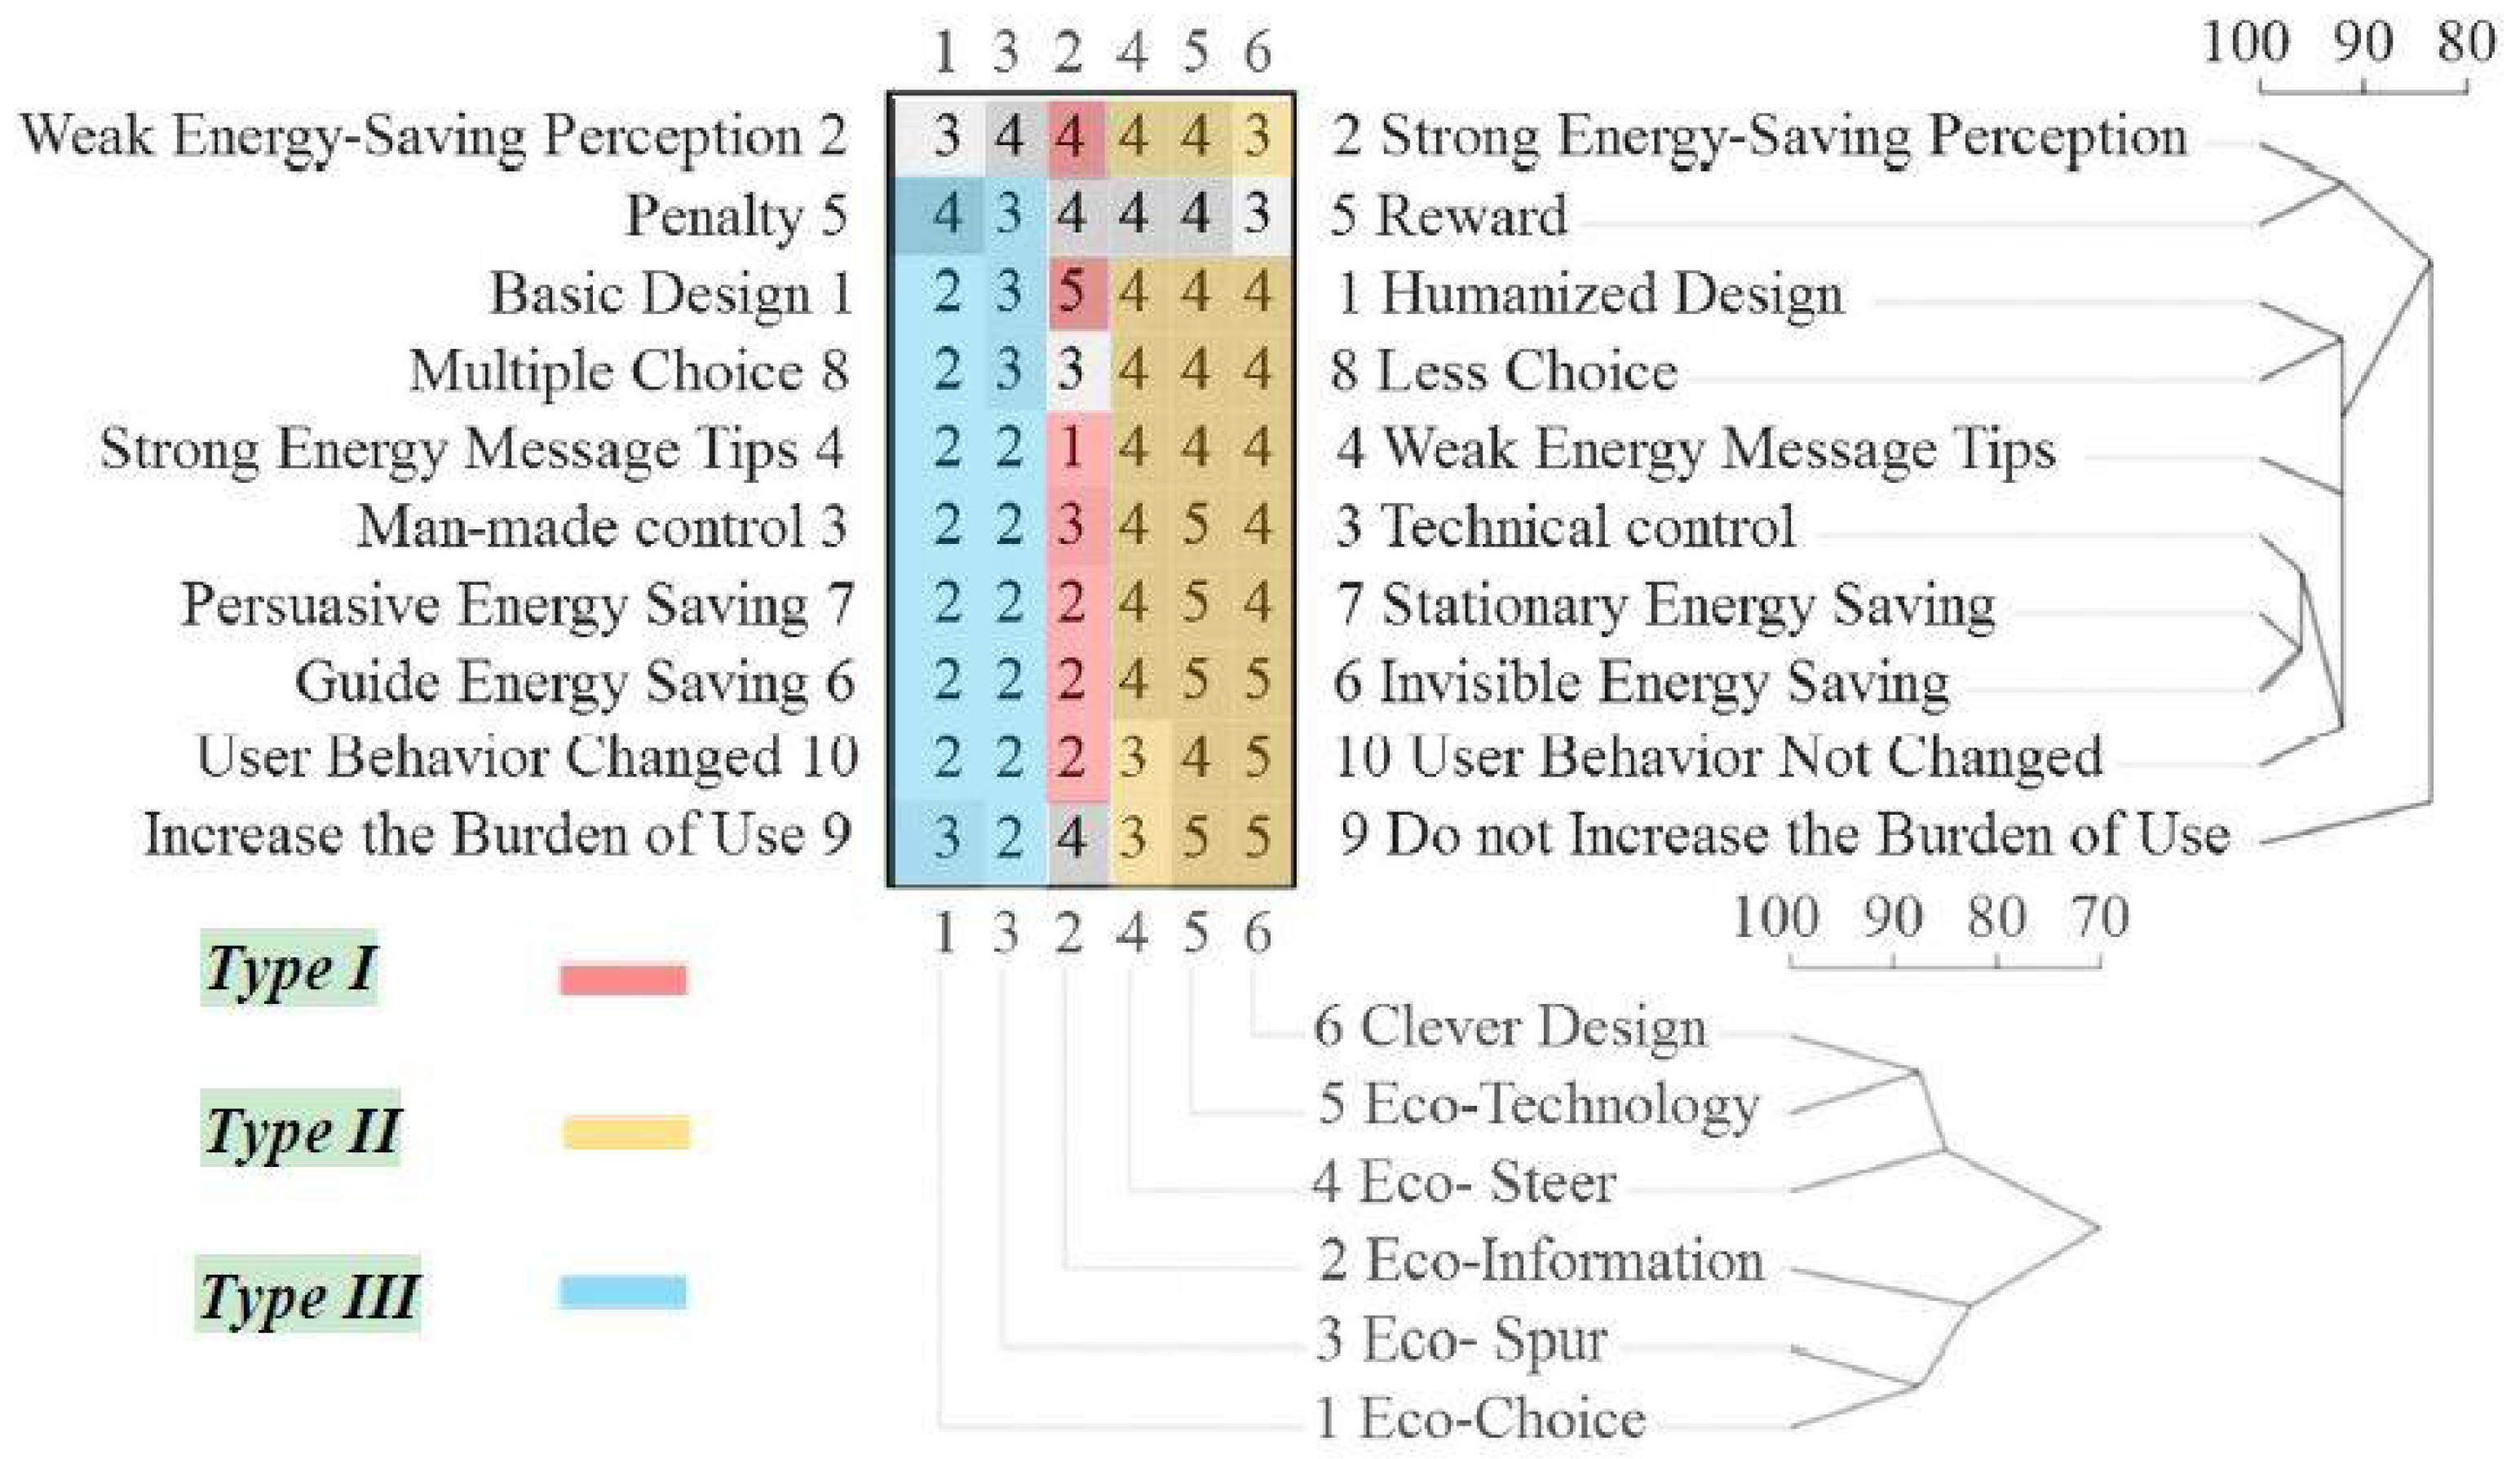
The cluster analysis is an exploratory analysis that divides data into groups of the most disagreement based on attributes with the highest degree of similarity among the groups. The distance between observations or the error between within-groups was calculated to show the grouping and arrangement of the elements and constructs [85]. Cluster analysis results are shown in Figure 5. The matrices of element and construct matching scores are produced from the city block metric. The mathematical formula is as follows:
The major criterion for forming clusters is that linear reorderings of the constructs and elements, respectively, will result in the final grid displaying a minimum total difference between all adjacent pairs of rows and columns [86]. This study divides elements and constructs into three groups based on a grouping principle, corresponding to three strategic directions: Type I, Type II, and Type III. We take Eco-Information as an example. The numbers 4 and 5 in the figure are explained by the constructs on the right of the grid. The numbers 1 and 2 are interpreted by the construct to the left of the grid. The number 3 stands for neutrality [86].
(1) Type I
The characteristics of this strategy include a high degree of prompt messaging, attention to, and awareness of, resource use, gradual persuasion of users to exercise sustainable behavior, and humanized design. This result is consistent with those found by Sherwin, Bhamra, and Evan [87], and Thompson and Sherwin [88]; that is, feedback is used to improve user environmental awareness. Resource consumption can only be understood when the user perceives it [28]. Feedback can be visual (display), auditory (sound), and tactile (material and temperature). With tools that instantly monitor their own use of energy, people can reduce their energy consumption by 5–15% [89]. Humanized design serves to acquire and apply knowledge about the interaction between people and the environment and to create products or services that meet emotional and rational demands under design norms [90,91]; this is manifested through form design, elements, and research and development, while considering security, practicality, effectiveness, and emotions [92]. The design and production of home appliances must consider the development and application of technologies that are consistent with the principles and strategies of current eco-design [93,94]. In addition, eco-design accords the same status to environmental concerns as it does to traditional industrial values, such as profit, function, aesthetics, ergonomics, image, and overall quality [95].
Therefore, this strategy mainly depends on self-awareness of the environment, technical persuasion, or operation prompts, and does not require excessive technical intervention. It is a non-mandatory method [30]; however, it relies on the user’s perception and the correct matching of value and message [28].
(2) Type II
Strategic features include automation technology that unconsciously reduces energy consumption. There is no attempt to change user behavior, but there is a certain degree of human design. Unlike in Type I, product design is not the focus. The main focus are embedded control functions or material technologies, favoring object restriction. This means that user behavior can be restrained and usage standardized through the availability and restriction of the products, thereby ensuring environmental protection [28]. However, this may result in higher product technical requirements and production costs, as more advanced technology is required than in the other two strategies.
The advantages of this strategy are that it does not increase the user’s product cognitive load, it can be applied to users whose habits are difficult to change, it maintains the user’s current behavior as much as possible, it does not require environmental awareness, it can produce immediate results, it emphasizes the certainty and effectiveness of sustainable improvement, and it compensates for the inadequacy of other strategies [96]. However, it is unlikely to trigger an amendment to existing beliefs, values, and preferences [28]; it does not automatically trigger a permanent change in user behavior [25]. The use of this strategy should take into account the user’s economic, cognitive, and behavioral factors to segment the market.
(3) Type III
Parts of this strategy overlap with Type I. Analysis shows that strategy Type III is basic and includes human-controlled design. Message prompts guide users to increase their sustainable behavior by experiencing the impact of environmental protection via feedback. Secondly, the concept of reward and punishment tends to be neutral; this may be due to less automated technical support and more operational choices that, together, increase cognitive load [97] and indirectly increase resource waste, which is a penalty for users.
However, these characteristics can also lead to other results. For example, products with lower technical support demands may meet the user’s basic functional requirements of a product, and users may readily accept the use burden. Secondly, enterprises in the product design phase result in lower design costs, leading to a more attractive product price. Thirdly, although cost reduction leads to increased consumption [28], the likelihood of permanent consumer behavior change may also increase. For example, the cost of resources consumed may be reflected in household expenditures, but another form of reward is embodied in energy cost reductions, which in turn prompts people to save energy. Therefore, rewards and punishments can help to increase participation and interest in pro-environmental behaviors [98].
Persuading, inducing, and relying on user behavior is more important in Type III than in Type I due to reduced technical support in Type III. The strategy relies instead on increasing user perception and setting the goal of environmental protection; however, a relative reduction in the availability and functionality of the product as limits increase will make it less attractive to most consumers [28].
4.2. Principal Component Analysis
Principal component analysis is a dimensional reducing technique. In the field of behavior and social science, most studies try to extract the new variables (principal components, , , …) from the original variables (, … ) through a linear combination for data simplification. This can explain the maximum variance of the original variables [85]. The mathematical formula is as follows:
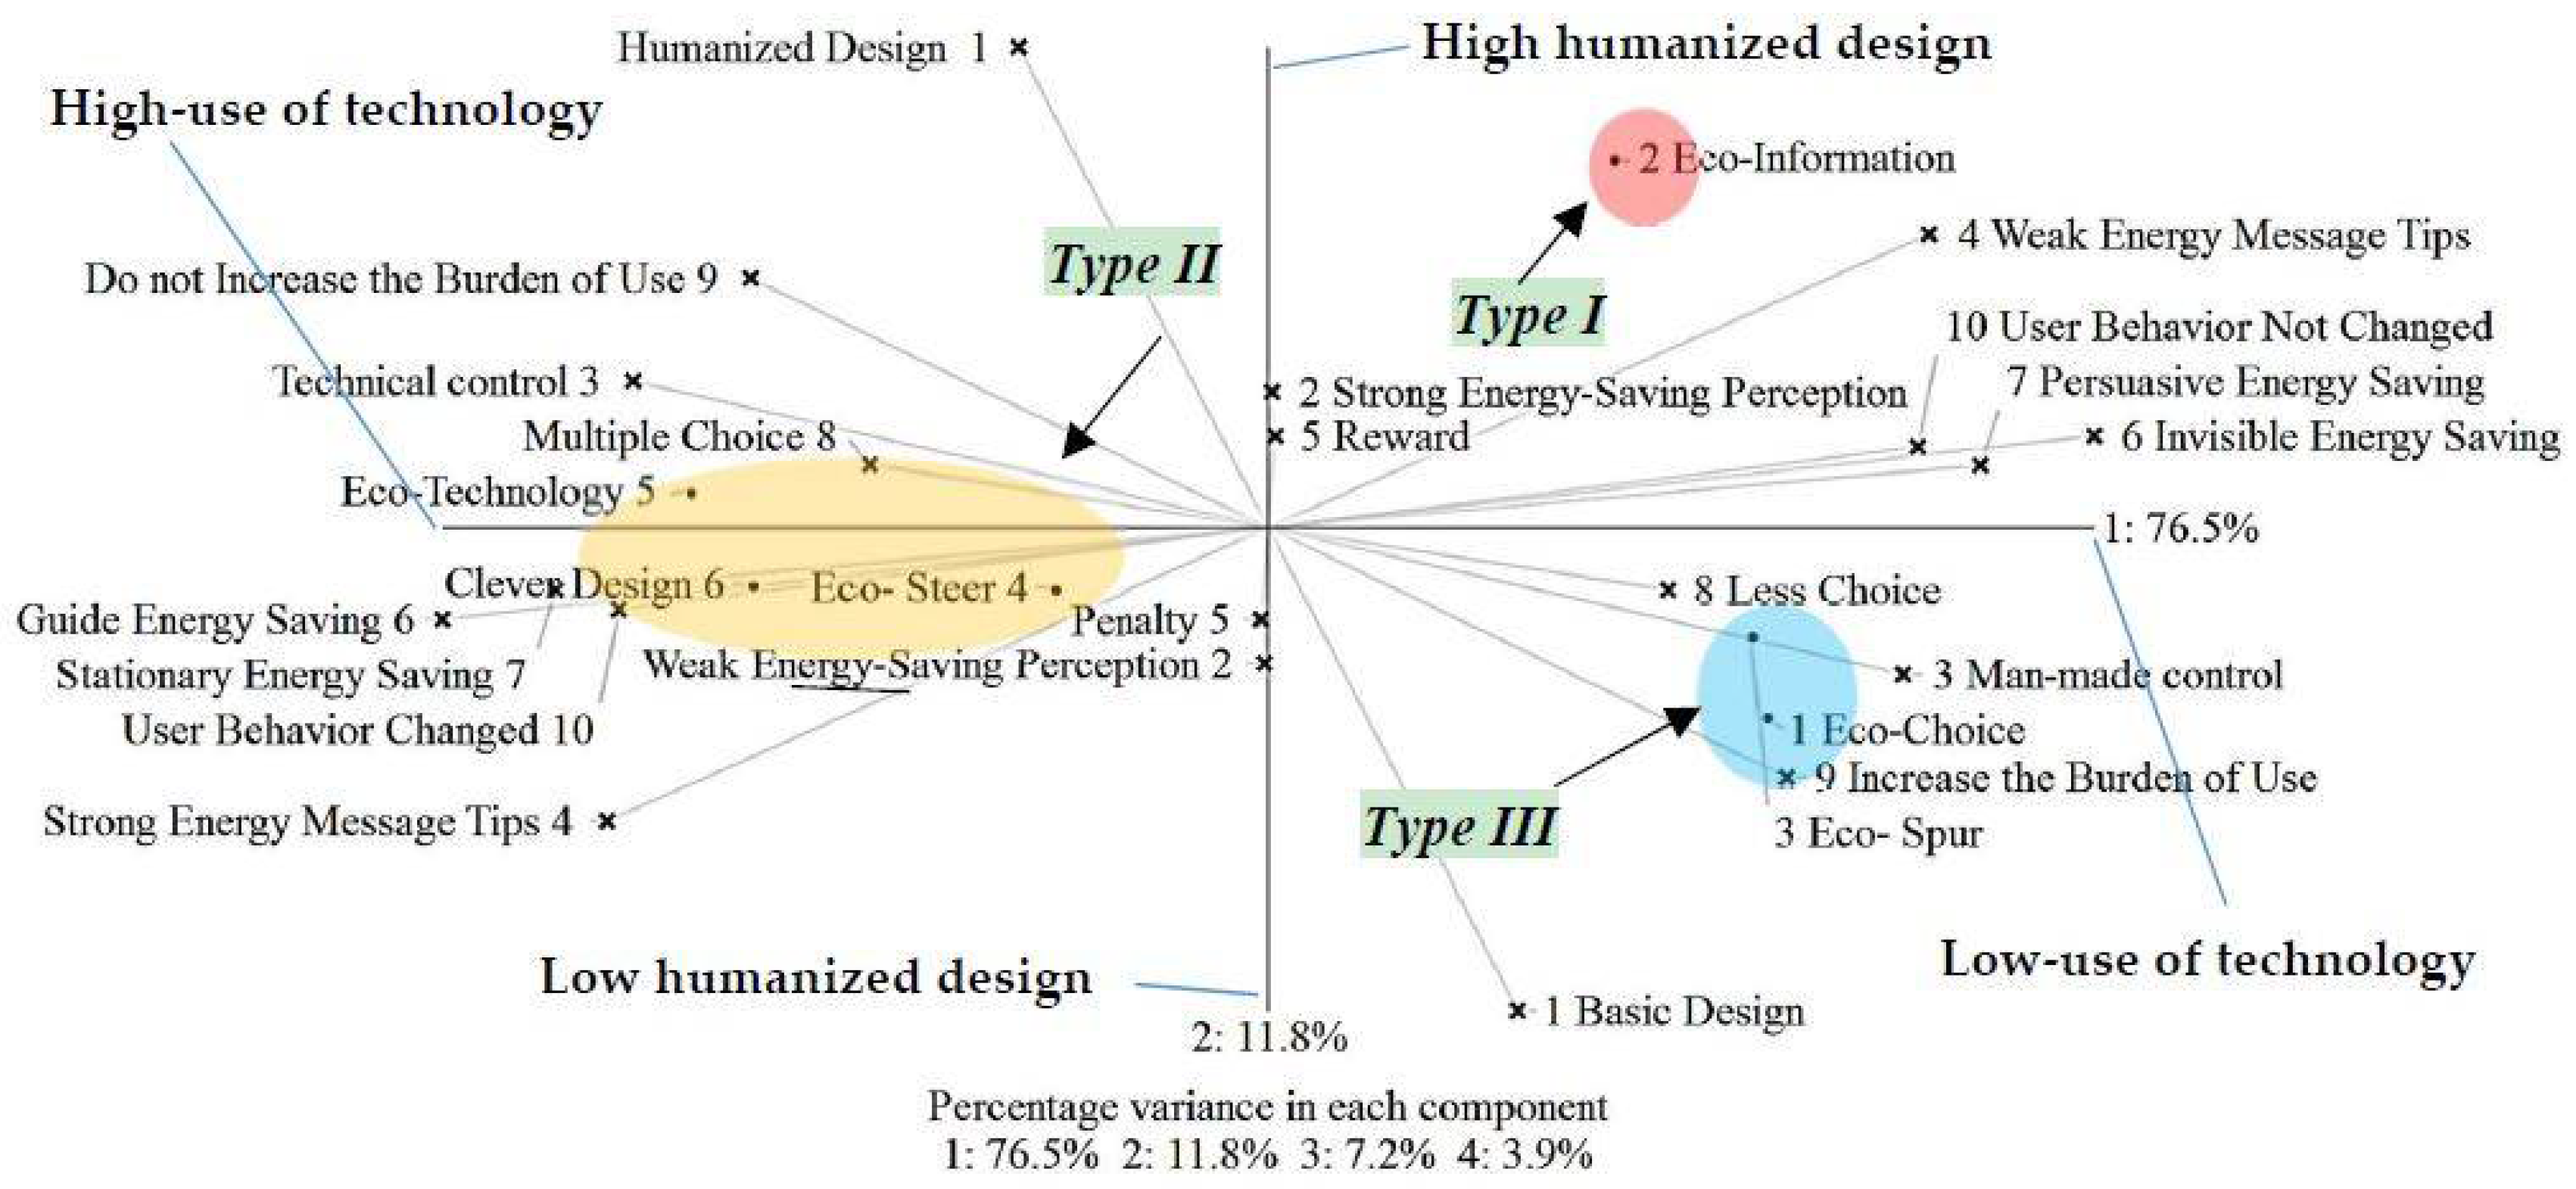
where is the linear correlation coefficient between the ith principal component and the original jth variable . Therefore, PCA produces two main components in this study: the first denotes the degree to which utilization of technology affects the energy-saving mode (x axis). The variation explained by the first component is 76.5%. The second principal component denotes the degree to which humanization design affects usability (y axis), explaining 11.8% of the variation. The cumulative explanatory variable of these two principal components is 88.3%, which exceeds the 80% threshold [99]. This means that scaling down the dimensions to interpret the source material is appropriate [85].
However, PCA is based on the distribution of elements in the two-dimensional vector axis (principal component), to understand the correlation between the elements and between the constructs. The further away from the center point of the two-dimensional vector axis the element is, the higher the explained variation and the closer the point-to-point cluster, indicating better consistency. Figure 6 shows that the classification of Type I and Type III strategies is reasonable, but the elements within Type II strategies are slightly dispersed and can be included in one group as they are closely clustered. In addition, we observe that the concept of these three groups of elements is consistent with the results of cluster analysis. According to the distance between the three strategies and the two principal components, the strategies are described as follows: the Type I strategy (human-oriented and energy-saving) includes a medium degree of technical use and a high degree of humanized design; the Type II strategy (higher technical use) necessitates a high degree of technical use and a medium degree of human design; and the Type III strategy (basic design) includes low-level technical use and a low degree of user-friendly design.
4.3. Evaluation of the Tool (Research Phase 2)
Before conducting statistical tests, it is necessary to ascertain whether data are normally distributed. If the assumption of normality is violated, the statistical test results will be biased [100,101]. As it was not possible to verify whether our data were normally distributed, we used the Wilcoxon signed rank test to compare differences in the product design that can promote sustainable behavior among different research objects [99]. There are two hypotheses:
Alternative Hypothesis H1:
The positive pole of research object A is superior to the positive pole of research object B.
Null Hypothesis H0:
The relationship between the positive pole of research object A and the positive pole of research object B is neither good nor bad.
First, the reliability of research objects A and B was tested. The data show that the α-value of research object A is 0.800, and that of B is 0.697, both of which are higher than the reliability standard of 0.6 [99]. Therefore, the data can be further analyzed.
Table 3 shows the descriptive statistics of the scores assigned by 38 subjects for research objects A and B. For research object A, the highest score is 8: multiple choice vs. less choice (M = 3.82, SD = 0.766); the next highest is 1: humanized design vs. basic design (M = 3.61, SD = 0.755), and the lowest score is 6: guided energy saving vs. invisible energy saving (M = 2.66, SD = 1.072). For research object B, the highest score is 10: user behavior changed vs. user behavior not changed (M = 3.42, SD = 0.976); the next highest is 3: technical control vs. man-made control (M = 3.24, SD = 0.852). The lowest score is 6: invisible energy saving vs. guided energy saving (M = 2.84, SD = 0.973).
Table 4 shows the results of the Wilcoxon test (more details are available in Appendix C). Items 1(Z = −3.266, p = 0.001), 2(Z = −2.010, p = 0.022), 7(Z = −2.646, p = 0.004), 8(Z = −3.293, p = 0.001), and 9 (Z = −1.942, p = 0.026) were all less than 0.05. There are statistically significant differences in these five items between research objects A and B. In addition, the Z-values of the mean difference of each class are all negative; on the positive level, the value of research object A is higher than that of research object B. The alternative hypothesis should be accepted. The positive construct of research object A is higher than that of research object B. This means that research object A is superior to research object B in terms of humanized design, energy-saving perception, persuasive energy saving, multiple choice, and reduction of the use burden. This case study proves that the design approach used in research object A has higher energy-saving potential than that of research object B. This is consistent with the result that the energy consumption of research object A is smaller than that of B in the description of Section 3.3.2. Based on above, this tool can be used to measure the degree of product DfSB design and present the weight of each indicator, and it can be used to collect data for analysis and comparison. These results can be used as a basis for improving the energy-saving effect and evaluating the DfSB degrees. In addition, this assessment method is consistent with many studies on the evaluation tool developed through RGT. For example, the constructs that affect a student’s systemic thinking ability are established, which is developed as a key indicator in an ecological research tool [37]. The constructs that influence students’ learning attitudes are explored, which has become an important item on the attitudes questionnaire [102]. Reliable tools for measuring cognitive complexity have been developed in the field of consumer behavior [103]. On the whole, RGT can effectively explore the subject’s experience and knowledge of specific groups to establish principles or indicators. It has significant benefits for the assessment of related fields.
5. Conclusions
Using design methods to reduce the environmental impacts of products is very important [21]. Products should be better designed to communicate with users, providing feedback on appropriate behaviors rather than simply meeting the needs and desires of the users [28]. From a theoretical and practical point of view, this study aimed to increase relevant opportunities for promoting sustainable behavior practices on the new poor through home appliances. Product design strategies and an assessment tool were established, and the relevant knowledge systems of the new poor, DfSB, and product design were expanded for discussion. This study presented a number of important findings in these areas. An assessment tool and three design strategies that promote sustainable behavior for home appliances were presented through RGT from the perspectives of the new poor and designers. In the study, key evaluation indicators were developed for the tool, which can measure the degree of product DfSB design and present the weight of each indicator. This tool illustrates effective assessment potential through case studies. The evaluation weights of the DfSB designs for two washing machines, A and B, were presented. Some of the evaluation indicators for the two washing machines showed significant differences through statistical analysis. This result could be used as a basis for product analysis and improvement to promote sustainable behavior of the new poor. The tool can be flexible in order to be applied by designers, retailers, and green marketers based on the purpose of the tool development. For example, taking into account the needs of various research studies and investigations, it can evaluate products on the current market as a method of data collection or be used in the planning stage of developing new products.
Secondly, design interventions are an effective way to change behavior through the product. Therefore, three home appliance design strategies that can promote the sustainable behavior of the new poor were proposed according to the research purposes: (1) The Type I strategy: a medium degree of technical use and a high degree of humanized design. Strategic features include a high level of message alerts, perception and encouragement of environmental performance, guiding or persuading users to practice sustainable behavior, changing user behavior, and professional humanized design; (2) The Type II strategy: a high degree of technical use and a moderate degree of human design. This strategic principle focuses on automatic control technology without increasing the use burden and reducing energy consumption unconsciously, and does not to change user behavior as much as possible. Current behavior may be maintained; (3) The Type III strategy: a low degree of technical use and of humanized design. This strategy covers basic and artificial control design, with message prompt functions guiding and persuading users towards sustainable behavior, as well as selective energy-saving functions. In Section 4.1, these strategies also initially propose appropriate demographic characteristics and detailed design recommendations to reduce the unsustainable behavior of the new poor at the product use stage. In view of the above, designers can design a product, and green marketing and retailers can plan product and marketing costs or programs according to the guidance of these strategies to match the appropriate groups. Taking the Type III strategy as an example, such products are more in line with the characteristics of environmental practitioners of the new poor, although this product still has some basic triggering perpetual behavior. That is, environmental protection practitioners already have environmental protection behavior, and whether or not the product functionality is strong is not a major concern. This shows that this strategy can produce smaller production costs and contribute to maximizing the level of eco-efficiency. However, the new poor who are not interested in general environmental behavior may be unlikely to have a significant impact, while products of the Type 2 strategy may be more suitable for this group, but its production costs may be higher.
On the other hand, while a single strategy may not produce user's long-term behavioral changes, combinations of strategies are likely to have more significant impacts in those situations [53]. We consider that Type I may be appropriate to attract new poor to practice sustainable behaviors in the early stages because of feedback. When their behaviors have exercised, the Type II strategy could be used to maintain those behaviors. This process is translated from the self-directed phase to habitual new behavior [53]. In the end, Type III could be considered to reduce unsustainable or additional costs associated with manufacturing and reduce environmental impact. Concretely speaking, to influence user’s behaviors through design is a dynamic process. The new poor’s behavioral changes must be constantly evaluated and explored to propose more appropriate methods, although we have proposed some design strategies. Consequently, in order to more accurately market mechanisms for the new poor, it is still necessary to study and investigate a wider range of user psychosocial factors, such as the use of motivation, habits, behaviors, psychological cognition, and other related factors. The correct match between the strategy and the user can make the product more meaningful to the user.
In fact, exposed to global economic conditions, the young working poor reflect changes in the modern social structure, consumer attitudes, and consumer markets, despite holding differing opinions and experiencing differing factors influencing their purchasing decisions regarding green products. Companies must adopt sustainable business practices to raise awareness of environmental protection and to create opportunities for sustainable behavior, and user’s purchases should also be considered. Research has pointed out that subjective norms and lifestyle are factors that affect the purchase of green products by the new poor [19]. Consumers are susceptible to advertising and product images when making consumer decisions, according to the green marketing research [104]. Marketing theory shows that 4P (product, price, place, and promotion) is the main method by which enterprises carry out marketing activities. 4C (customer, convenience, cost, and communication) strengthens the marketing mix centered on consumer needs. 4S (Satisfaction, service, speed, and sincerity) increases the company’s ability to weather market risks and achieve management innovation and sustained and stable efficiency [105]. This study suggests that the effective use of the 4PCS marketing strategy in advertising, product image selection, subjective norms, and lifestyle will help retailers and green marketing promote consumption and segment markets of the new poor.
Overall, changing the sustainable behavior of the new poor from a design aspect can confer a significant advantage to the sustainable development of the economy, society, and the environment, while opening up new business opportunities and models for retailers and enterprises.
Author Contributions
M.S. developed the concept and drafted the manuscript. J.T. revised the manuscript and supervised the overall work. Y.N. reviewed the manuscript. All authors read and approved the manuscript.
Acknowledgments
The authors would like to thank the Japan Advanced Institute of Science and Technology and the Southern Taiwan University of Science and Technology for resources and relevant personnel which have aided this article.
Conflicts of Interest
The authors declare no conflict of interest.
Appendix A

Table A1.
Statistics table of the mentioned construct.
| Type | Construct (+) | Construct (−) | Frequency | Weights % |
|---|---|---|---|---|
| 1 | User Behavior Changed | User Behavior Not Changed | 16 | 0.086 |
| 2 | Strong Energy Message Tips | Weak Energy Message Tips | 15 | 0.080 |
| 3 | Guided Energy Saving | Invisible Energy Saving | 14 | 0.075 |
| 4 | Strong Energy-Saving Perception | Weak Energy-Saving Perception | 13 | 0.070 |
| 5 | Multiple Choice | Less Choice | 13 | 0.070 |
| 6 | Don’t Increase the Burden of Use | Increase the Burden of Use | 13 | 0.070 |
| 7 | Technical Control | Man-made Control | 12 | 0.064 |
| 8 | Reward | Penalty | 11 | 0.059 |
| 9 | Persuasive Energy Saving | Stationary Energy Saving | 10 | 0.053 |
| 10 | Humanized Design | Basic Design | 9 | 0.048 |
| 11 | Social Responsibility | Personal Responsibility | 9 | 0.048 |
| 12 | Technology-Oriented | Trigger-Oriented | 8 | 0.043 |
| 13 | Intuitive Green Design | General Green Design | 7 | 0.037 |
| 14 | Can Remind User | Cannot Remind User | 6 | 0.032 |
| 15 | Innovative Design | General Design | 6 | 0.032 |
| 16 | Long-Term Control | Short-Term Impact | 5 | 0.027 |
| 17 | Positive reinforcement of Behavior | Negative reinforcement of Behavior | 4 | 0.021 |
| 18 | Strong Stimulation for User | Weak Stimulation for User | 4 | 0.021 |
| 19 | Sustainable Design | Traditional Design | 3 | 0.016 |
| 20 | Mandatory | Non-Mandatory | 3 | 0.016 |
| 21 | High-Perceived Energy Use | Low-Perceived Energy Use | 2 | 0.011 |
| 22 | High-Contributed to Environment | Low-Contributed to Environment | 2 | 0.011 |
| 23 | Usage Restricted | Usage Unrestricted | 2 | 0.011 |
| Total | 187 | 100 | ||
Appendix B
Figure A1.
Washing machine A.

Table A2.
The specification of washing machine A.
| Item | Description | Item | Description |
|---|---|---|---|
| Laundry process | 13 kinds of laundry processes | Motor type | Variable-frequency motor |
| weight | 50 kg | size | Width 640 × depth 667 × height 1042 (mm) |
| Voltage/frequency | 110 V/60 Hz | Warranty | The whole machine for 1 year, the main parts for 3 years, the motor for 5 years |
| Material | Stainless steel | Installation Notes | Standard installation service, delivery to the home, old machine recycling |
| Laundry capacity (kg) | 13 KG | Mark certification | Provincial water mark, energy mark, environmental mark, MIT smile mark |
| Laundry tub | Single slot | ||
| Technology | Washing tank cleaning automatically, special flush, safety glass, cold air drying, strengthening the laundry process, NEW foam wash, water-saving laundry, ECONAVI (weight, water temperature, soil induction), Touch Key touch panel, slowdown cover, large window modeling investment, appointment time, child safety devices. | ||
Figure A2.
Washing machine B.

Table A3.
The specification of washing machine B.
| Item | Description | Item | Description |
|---|---|---|---|
| Laundry process | 8 kinds of laundry processes | Motor type | Fixed-frequency motor |
| weight | 60 kg | size | Width 640 × depth 667 × height 1020 (mm) |
| Voltage/frequency | 110 V/60 Hz | Warranty | The whole machine for 1 year, the motor for 5 years |
| Material | Stainless steel | Installation Notes | Standard installation service, delivery to the home |
| Laundry capacity (kg) | 13 KG | Mark certification | Provincial water mark, energy mark, MIT smile mark |
| Laundry tub | Single slot | ||
| Technology | Standby without energy consumption, cold air drying, soaking, special laundry tray, appointment time, washing tank washing automatically, child safety device, foam wash. | ||
Appendix C
Table A4.
Wilcoxon signed rank test.
| Item | N | Mean Rank | Sum of Ranks | Explanation | |
|---|---|---|---|---|---|
| 1 | Negative Ranks | 18 | 11.17 | 201.00 | B1 < A1 B1 > A1 B1 = A1 |
| Positive Ranks | 3 | 10.00 | 30.00 | ||
| Ties | 17 | ||||
| 2 | Negative Ranks | 13 | 10.92 | 142.00 | B2 < A2 B2 > A2 B2 = A2 |
| Positive Ranks | 6 | 8.00 | 48.00 | ||
| Ties | 19 | ||||
| 3 | Negative Ranks | 15 | 12.83 | 192.50 | B3 < A3 B3 > A3 B3 = A3 |
| Positive Ranks | 11 | 14.41 | 158.50 | ||
| Ties | 12 | ||||
| 4 | Negative Ranks | 15 | 13.60 | 204.00 | B4 < A4 B4 > A4 B4 = A4 |
| Positive Ranks | 11 | 13.36 | 147.00 | ||
| Ties | 12 | ||||
| 5 | Negative Ranks | 12 | 8.58 | 103.00 | B5 < A5 B5 > A5 B5 = A5 |
| Positive Ranks | 7 | 12.43 | 87.00 | ||
| Ties | 19 | ||||
| 6 | Negative Ranks | 8 | 9.25 | 74.00 | B6 < A6 B6 > A6 B6 = A6 |
| Positive Ranks | 11 | 10.55 | 116.00 | ||
| Ties | 19 | ||||
| 7 | Negative Ranks | 18 | 10.56 | 190.00 | B7 < A7 B7 > A7 B7 = A7 |
| Positive Ranks | 3 | 13.67 | 41.00 | ||
| Ties | 17 | ||||
| 8 | Negative Ranks | 21 | 15.29 | 321.00 | B8 < A8 B8 > A8 B8 = A8 |
| Positive Ranks | 6 | 9.50 | 57.00 | ||
| Ties | 11 | ||||
| 9 | Negative Ranks | 17 | 10.76 | 183.00 | B9< A9 B9 > A9 B9 = A9 |
| Positive Ranks | 5 | 14.00 | 70.00 | ||
| Ties | 16 | ||||
| 10 | Negative Ranks | 11 | 12.68 | 139.50 | B10 < A10 B10 > A10 B10 = A10 |
| Positive Ranks | 13 | 12.35 | 160.50 | ||
| Ties | 14 | ||||
References
- Broad, R.; Cavanagh, J. Poorer countries and the environment: Friends or foes? World Dev. 2015, 72, 419–431. [Google Scholar] [CrossRef]
- Zulu, L.C.; Richardson, R.B. Charcoal, livelihoods, and poverty reduction: Evidence from sub-Saharan Africa. Energy Sustain. Dev. 2013, 17, 127–137. [Google Scholar] [CrossRef]
- Perera, L.D.H.; Lee, G.H.Y. Have economic growth and institutional quality contributed to poverty and inequality reduction in Asia? J. Asian Econ. 2013, 27, 71–86. [Google Scholar] [CrossRef]
- Zhang, K.; Dearing, J.A.; Dawson, T.P.; Dong, X.; Yang, X.; Zhang, W. Poverty alleviation strategies in eastern China lead to critical ecological dynamics. Sci. Total Environ. 2015, 506–507, 164–181. [Google Scholar] [CrossRef] [PubMed]
- Liu, F. Sustainable Design for Poor People. Master’s Thesis, Wuhan University of Technology, Wuhan, China, 2013. [Google Scholar]
- Ingram, J.C.; Wilkie, D.; Clements, T.; McNab, R.B.; Nelson, F.; Baur, E.H.; Sachedina, H.T.; Peterson, D.D.; Foley, C.A.H. Evidence of payments for ecosystem services as a mechanism for supporting biodiversity conservation and rural livelihoods. Ecosyst. Serv. 2014, 7, 10–21. [Google Scholar] [CrossRef]
- DiFazio, W. Poverty, the postmodern and the jobless future. Crit. Perspect. Account. 1998, 9, 57–74. [Google Scholar] [CrossRef]
- Tu, J.C.; Shih, M.C.; Hsu, C.Y.; Lin, J.H. Developing blue ocean strategy of sustainable product design and development for business opportunities of BOP groups in Taiwan. Math. Probl. Eng. 2014, 2014, 297524. [Google Scholar] [CrossRef]
- Li, S.J. New poverty in Taiwan: The phenomenon and policies. Soochow J. Soc. Work 2007, 17, 193–219. [Google Scholar]
- Ohmae, K. M-Type Social Crisis and the Disappearance of the Middle Class Opportunities; Liu, C.H., Chiang, Y.C., Eds.; Shangzhou Chuban: Taipei, Taiwan, 2006; ISBN 9861247319. [Google Scholar]
- Huang, S.H.; Lin, C.H.; Lin, C.Y. New poverty and social welfare policy-science vs. value and the elite vs. the proletariat. Natl. Policy Quart. 2003, 2, 83–124. [Google Scholar]
- Lo, W.Y. A Profile of the Working Poor in Taiwan. Master’s Thesis, Soochow University, Taipei, Taiwan, 2007. [Google Scholar]
- Guo, Y.L. Ninety-nine thousand new poor people—The new poor ice storm. Bus. Week 2003, 801, 102–106. [Google Scholar]
- Chen, H.H. On the planning of new poverty phenomenon and social welfare policy. Subsid. Scheme Work Reward. Mon. Bull. 2009, 638, 13–18. [Google Scholar]
- Lu, C.X. Significance, policy and limited of the new poor. Community Dev. Bull. 2007, 119, 20–39. [Google Scholar]
- Wang, D.Q. New poverty and activation policy: The contemporary society rescues the policy development direction and ability orientation explanation. Community Dev. Bull. 2007, 116, 123–141. [Google Scholar]
- Chang, F.N. A Review of Employment Policies: Examples of The New Poor. Master’s Thesis, Feng Chia University, Taichung, Taiwan, 2009. [Google Scholar]
- Prahalad, C.K. The Fortune at the Bottom of the Pyramid: Eradicating Poverty through Profits; Wharton School Publishing: Upper Saddle River, NJ, USA, 2004; ISBN 0137009275. [Google Scholar]
- Tu, J.C.; Shih, M.C. The study of sustainable behavior intention and product design strategy for the new Poor. J. Des. Stud. 2017, 2, 34–50. [Google Scholar]
- Domingo, L.; Rio, M. Linking use stage life cycle inventories with product design models of usage. Procedia CIRP 2016, 48, 342–347. [Google Scholar] [CrossRef] [Green Version]
- Ceschin, F.; Gaziulusoy, I. Evolution of design for sustainability: From product design to design for system innovations and transitions. Des. Stud. 2016, 47, 118–163. [Google Scholar] [CrossRef]
- Bereketli, I.; Genevois, M.E. An integrated QFDE approach for identifying improvement strategies in sustainable product development. J. Clean. Prod. 2013, 54, 188–198. [Google Scholar] [CrossRef]
- Tang, T.; Bhamra, T.A. Putting consumers first in design for sustainable behaviour: A case study of reducing environmental impacts of cold appliance use. Int. J. Sustain. Eng. 2012, 5, 1–16. [Google Scholar] [CrossRef]
- Lai, S.L.; Shu, L.H. Do-it-yourselfers as lead users for environmentally conscious behavior. Procedia CIRP 2014, 15, 431–436. [Google Scholar] [CrossRef]
- Wever, R.; Kuijk, J.; Boks, C. User-centered design for sustainable behavior. Int. J. Sustain. Eng. 2008, 1, 9–20. [Google Scholar] [CrossRef]
- Tukker, A.; Jansen, B. Environmental impacts of products: A detailed review of studies. J. Ind. Ecol. 2006, 10, 159–182. [Google Scholar] [CrossRef]
- Scott, F. Behavior Change—Believing you can make a difference. In Proceedings of the BTCV, Global Action Plan and the Environment Council Workshop, London, UK, 20 July 2004. [Google Scholar]
- Tang, T. Towards Sustainable Use: Design Behaviour Intervention to Reduce Household Environment Impact. Ph.D. Thesis, Loughborough University, Leicestershire, UK, 2010. [Google Scholar]
- Den, O.E.; Yuan, L.; Sonnemans, P.J.M.A.; Brombacher, C. Quality and reliability problems from a consumer’s perspective: An increasing problem overlooked by businesses? Qual. Reliab. Eng. Int. 2006, 22, 821–838. [Google Scholar] [CrossRef]
- Lilley, D. Design for sustainable behaviour: Strategies and perceptions. Des. Stud. 2009, 30, 704–720. [Google Scholar] [CrossRef] [Green Version]
- Wilson, G.T. Design for Sustainable Behaviour: Feedback Interventions to Reduce Domestic Energy Consumption. Ph.D. Thesis, Loughborough University, Leicestershire, UK, 2013. [Google Scholar]
- Norman, D.A. The Design of Everyday Things; First MIT Press: New York, NY, USA, 1988; ISBN 100-465-06710-7. [Google Scholar]
- Daae, J.; Boks, C. A classification of user research methods for design for sustainable behavior. J. Clean. Prod. 2015, 106, 680–689. [Google Scholar] [CrossRef]
- Niedderer, K.; Mackril, J.; Clune, S.; Lockton, D.; Ludden, G.; Morris, A.; Cain, R.; Gardiner, E.; Gutteridge, R.; Evans, M.; et al. Creating Sustainable Innovation through Design for Behaviour Change: Full Project Report; University of Wolverhampton, Project Partners & AHRC, AHRC: Hong Kong, China, 2014. [Google Scholar]
- Kelly, G.A. The Psychology of Personal Constructs: Volume Two: Clinical Diagnosis and Psychotherapy; Routledge: New York, NY, USA, 2003; ISBN 1134957351. [Google Scholar]
- Dey, S.; Lee, S.W. Reassure: Requirements elicitation for adaptive sociotechnical systems using repertory grid. Inf. Softw. Technol. 2017, 87, 160–179. [Google Scholar] [CrossRef]
- Keynan, A.; Assaraf, O.B.Z.; Goldman, D. The repertory grid as a tool for evaluating the development of students’ ecological system thinking abilities. Stud. Educ. Eval. 2014, 41, 90–105. [Google Scholar] [CrossRef]
- Harrington, M. The new American poverty. Natl. Black Law J. 1985, 9, 199–212. [Google Scholar]
- Jau, C.Y. The Phenomenon of the Taiwanese Youth Working Poverty. Master’s Thesis, National Taipei University, Taipei, Taiwan, 2013. [Google Scholar]
- Ramón, P.C.; Mia, L. Working Poor in the European Union; European Foundation for the Improvement of Living and Working Conditions: Dublin, Ireland, 2004; ISBN 92-897-0258-3. [Google Scholar]
- Yei, S.J. The Factor of Working Poor in Taiwan. Master’s Thesis, National Chung Cheng University, Tainan, Taiwan, 2011. [Google Scholar]
- DGBAS. Report on the Manpower Utilization Survey; Manpower Survey Section, Department of Census, The Directorate General of Budget, Accounting and Statistics (DGBAS) of Executive Yuan: Taipei, Taiwan, 2016; ISBN 30018729. [Google Scholar]
- Jau, C.Y. Looking to adjustment policies of the future minimum wage from Taiwan youth working poor. Community Dev. Bull. 2015, 151, 218–225. [Google Scholar]
- DGBAS. Report on the Manpower Utilization Survey; Manpower Survey Section, Department of Census, The Directorate General of Budget, Accounting and Statistics (DGBAS) of Executive Yuan: Taipei, Taiwan, 2015; ISBN 30016648. [Google Scholar]
- 70.5% of Taiwan’s Young People Think They Are Poor. Available online: https://www.nownews.com/news/20140122/1098177 (accessed on 7 November 2017).
- Li, X.F. The consumption aspects of new poverty. Clan. Soc. 2002, 10, 36–37. [Google Scholar]
- Tai, P.F. The underclass, deficient consumers and flâneurs: Notes on homeless people in Taipei. Taiwanese J. Sociol. 2014, 54, 233–265. [Google Scholar]
- Lu, H. Interpretation of Ecological Dimension of Historical Materialism—Ecological Marxist Historical Materialism Theory Research. Master’s Thesis, Guangxi Normal University, Guilin, China, 2009. [Google Scholar]
- Franzen, A.; Meyer, R. Environmental attitudes in cross-national perspective: A multilevel analysis of the ISSP 1993 and 2000. Eur. Sociol. Rev. 2000, 26, 219–234. [Google Scholar] [CrossRef]
- Huang, K.T. Measurement of Green Lifestyle and Market Segmentation in the Promotion Strategy for Environmental Protection: An Empirical Analysis of Kaohsiung Metropolitan. Master’s Thesis, National Sun Yat-sen University, Kaohsiung, Taiwan, 2011. [Google Scholar]
- Alice, G.; John, T. Why young people do things for the environment: The role of parenting for adolescents’ motivation to engage in pro-environmental behaviour. J. Environ. Psychol. 2017, 54, 11–19. [Google Scholar]
- Chu, P.Y.; Lin, Y.L.; Chi, W.N. A study of consumers’ willingness to pay for environmentally friendly clothing for generation Y: The influences of shopping orientation, fashion orientation and green consumption style. Mark. Rev. 2013, 10, 19–42. [Google Scholar]
- Coskun, A.; Zimmerman, J.; Erbug, C. Promoting sustainability through behavior change: A review. Des. Stud. 2015, 41, 183–204. [Google Scholar] [CrossRef]
- Cash, P.J.; Hartlev, C.G.; Durazo, C.B. Behavioural design: A process for integrating behaviour change and design. Des. Stud. 2017, 48, 96–128. [Google Scholar] [CrossRef]
- Steg, L.; Vlek, C. Encouraging pro-environmental behavior: An integrative review and research agenda. J. Environ. Psychol. 2009, 29, 309–317. [Google Scholar] [CrossRef]
- Abrahamse, W.; Steg, L.; Vlek, C.; Rothengatter, T. A review of intervention studies aimed at household energy conservation. J. Environ. Psychol. 2005, 25, 273–291. [Google Scholar] [CrossRef]
- Bhamra, T.; Lilley, D.; Tang, T. Design for sustainable behaviour: Using products to change consumer behaviour. Des. J. 2011, 14, 427–445. [Google Scholar] [CrossRef]
- Boks, C.; Lilley, D.; Pettersen, I. The future of design for sustainable behaviour revisited. In Proceedings of the 2015 9th EcoDesign International Symposium on Environmentally Conscious Design and Inverse Manufacturing, Tokyo, Japan, 2–4 December 2015. [Google Scholar]
- Shih, L.H. Persuasive Design for Products Leading to Health and Sustainability Using Case-Based Reasoning. Sustainability 2016, 8, 318. [Google Scholar] [CrossRef]
- Hebrok, M.; Boks, C. Household food waste: Drivers and potential intervention points for design—An extensive review. J. Clean. Prod. 2017, 151, 380–392. [Google Scholar] [CrossRef]
- Kallbekken, S.; Sælen, H. ‘Nudging’ hotel guests to reduce food waste as a win–win environmental measure. Econ. Lett. 2013, 119, 325–327. [Google Scholar] [CrossRef]
- Oğur, D. Sustainability Considerations on Effective Use of Resources for Small House-Hold Appliances. Master’s Thesis, Middle East Technical University, Ankara, Turkey, 2014. [Google Scholar]
- Prediger, S.; Lengnink, K. Development of personal constructs about mathematical tasks—A qualitative study using Repertory Grid Methodology. In Proceedings of the 27th Annual Meeting of the International Group for the Psychology of Mathematics Education (PME), Honolulu, HI, USA, 13–18 July 2003; Volume 4, pp. 39–46. [Google Scholar]
- Skippon, S.M. How consumer drivers construe vehicle performance: Implications for electric vehicles. Transp. Res. F 2014, 23, 15–31. [Google Scholar] [CrossRef]
- Bannister, D.; Fransella, F. Inquiring Man: The Psychology of Personal Constructs; Croom Helm: London, UK, 1986; ISBN 0709939507. [Google Scholar]
- Kelly, G.A. A Theory of Personality: The Psychology of Personal Constructs; Norton: New York, NY, USA, 1963; ISBN 0393001520. [Google Scholar]
- Edwards, H.M.; McDonald, S.; Young, S.M. The repertory grid technique: Its place in empirical software engineering research. Inf. Softw. Technol. 2009, 51, 785–798. [Google Scholar] [CrossRef]
- Kleef, E.; Trijp, H.C.M.; Luning, P.P. Consumer research in the early stages of new product development: A critical review of methods and techniques. Food Qual. Prefer. 2005, 16, 181–201. [Google Scholar] [CrossRef]
- Huang, Y.; Chen, C.H.; Wang, I.H.C.; Khoo, L.P. A product configuration analysis method for emotional design using a personal construct theory. Int. J. Ind. Ergon. 2014, 44, 120–130. [Google Scholar] [CrossRef]
- Yan, W.; Chen, C.H.; Chang, W. An investigation into sustainable product conceptualization using a design knowledge hierarchy and Hopfield network. Comput. Ind. Eng. 2009, 56, 1617–1626. [Google Scholar] [CrossRef]
- Selvefors, A.; Pedersen, K.B.; Rahe, U. Design for sustainable consumption behavior: Systematizing the use of behavioral intervention strategies. In Proceedings of the 2011 Conference on Designing Pleasurable Products and Interfaces, Milano, Italy, 22–25 June 2011; Alessandro, D., Francesco, Z., Eds.; ACM Press: New York, NY, USA, 2011; pp. 3/1–8. [Google Scholar]
- Creswell, J.W. Research Design: Qualitative, Quantitative, and Mixed Methods Approaches; Sage Publications Inc.: Thousand Oaks, CA, USA, 2009; ISBN 9781452226095. [Google Scholar]
- Huang, S.H. The Trend and Derterminants of the Working Poor Youth in Taiwan. Master’s Thesis, National Taipei University, Taipei, Taiwan, 2015. [Google Scholar]
- Norman, D.A. The research-practice gap: The need for translational developers. Interactions 2010, 17, 9–12. [Google Scholar] [CrossRef]
- Shin, L.; Ya, C.T.; Lu, C.L. The Relation of Imagination and Learning Performance of the Advertising Design Students toward Project Study Courses in Vocational High School. J. CAGST 2014, 2014, 468–482. [Google Scholar]
- McGeorge, P.; Rugg, G. The use of ‘contrived’ knowledge elicitation technique. Expert Syst. 1992, 9, 149–154. [Google Scholar] [CrossRef]
- Chen, C.H.; Chong, Y.T.; Chang, W.; Yan, W. A quality–time–cost-oriented strategy for product conceptualization. Adv. Eng. Inform. 2012, 26, 16–25. [Google Scholar] [CrossRef]
- Kelly, G.A. Clinical Diagnosis and Psychotherapy; Norton: New York, NY, USA, 1955; ISBN 9780415037983. [Google Scholar]
- Easterby-Smith, M. The design, analysis and interpretation of repertory grids. Int. J. Man-Mach. Stud. 1980, 13, 3–24. [Google Scholar] [CrossRef]
- Hair, J.F.; Anderson, R.E.; Tatham, R.L.; Black, W.C. Multivariate Data Analysis, 5th ed.; Prentice-Hall: Englewood Cliffs, NJ, USA, 1998; ISBN 0138948585. [Google Scholar]
- Laitala, K.; Boks, C.; Klepp, I.G. Potential for environmental improvements in laundering. Int. J. Consumer Stud. 2011, 35, 254–264. [Google Scholar] [CrossRef]
- Shove, E. Comfort, Cleanliness and Convenience; Berg: Oxford, UK; New York, NY, USA, 2003; ISBN 1859736300. [Google Scholar]
- Bureau of Energy, Ministry of Economic Affairs. Washing Machine. Available online: http://www.energylabel.org.tw/englishlabel/index.aspx (accessed on 12 November 2017).
- Abdul Rahman, H.; Wang, C.; Eng, K.S. Repertory grid technique in the development of Tacit-based Decision Support System (TDSS) for sustainable site lay-out planning. Autom. Constr. 2011, 20, 818–829. [Google Scholar] [CrossRef]
- Wu, M.L. SPSS Statistics Applied Learning Practice: Multivariate Analysis Practice; Wu Nan Culture Enterprise: Taipei, Taiwan, 2008; ISBN 9789571153414. [Google Scholar]
- Shaw, M.L.G. On Becoming a Personal Scientist: Interactive Computer Elicitation of Personal Models of the World; Academic Press: London, UK, 1980; ISBN 9780126392807. [Google Scholar]
- Sherwin, C.; Bhamra, T.; Evans, S. Using eco-design to innovate—The ‘Ecokitchen’ Project. Eng. Des. 2000, 26, 4–7. [Google Scholar]
- Thompson, P.; Sherwin, C. Awareness: Sustainability by industrial design. In Sustainable Solutions: Developing Products and Services for the Future; Charter, M., Tischner, U., Eds.; Greenleaf: Sheffield, UK, 2001. [Google Scholar]
- Darby, S. The Effectiveness of Feedback on Energy Consumption; Environmental Change Institute, University of Oxford: Oxford, UK, 2006. [Google Scholar]
- Bijl Brouwer, M.; Dorst, K. Advancing the strategic impact of human-centred design. Des. Stud. 2017, 53, 1–23. [Google Scholar] [CrossRef]
- Keates, S.; Clarkson, J. Countering Design Exclusion—An Introduction to Inclusive Design; Springer: London, UK, 2004; ISBN 9781447100133. [Google Scholar]
- Wu, Q. On the human product design. J. Putang. Vocat. Tech. Coll. 2007, 20, 73–74. [Google Scholar]
- MacDonald, E.F.; She, J. Seven cognitive concepts for successful eco-design. J. Clean. Prod. 2015, 92, 23–36. [Google Scholar] [CrossRef]
- Romli, A.; Prickett, P.; Setchi, R.; Soe, S. Integrated eco-design decision-making for sustainable product development. Int. J. Prod. Res. 2015, 53, 549–571. [Google Scholar] [CrossRef]
- Binswanger, M. Technological progress and sustainable development: What about the rebound effect? Ecol. Econ. 2001, 36, 119–132. [Google Scholar] [CrossRef]
- Lilley, D.; Lofthouse, V.; Bhamra, T. Towards instinctive sustainable product use. In Proceedings of the 2nd International Conference: Sustainability Creating the Culture. Sustainable Development Research, Aberdeen Forres, Moray, UK, 2–4 November 2005. [Google Scholar]
- Zachrisson, J.; Storrø, G.; Boks, C. Using a guide to select design strategies for behaviour change: Theory vs. practice. In Proceedings of the Eco-Design 2011—7th International Symposium on Environmentally Conscious Design and Inverse Manufacturing, Kyoto, Japan, 30 November—2 December 2011. [Google Scholar]
- McKenzie-Mhor, D.; Smith, W. Fostering Sustainable Behavior: An Introduction to Community-Based Social Marketing; New Society Publishers: Gabriola Island, BC, Canada, 1999; ISBN 0865714061. [Google Scholar]
- Wu, M.L. SPSS Statistics Applied Learning Practice: Questionnaire Analysis and Application Statistics; Easy Book: Taipei, Taiwan, 2013; ISBN 9789865835583. [Google Scholar]
- Nasipuri, A.; Tantaratana, S. Nonparamteric distributed detector using Wilcoxon statistics. Signal Process. 1997, 57, 139–146. [Google Scholar] [CrossRef]
- Dixon, W.J. Power under normality of several non-parametric tests. Ann. Math. Stat. 1954, 25, 610–614. [Google Scholar] [CrossRef]
- Hu, R.; Chang, W.H.; Lin, C.Y. Science curriculum components favored by high school students in Taiwan. J. Biol. Educ. 2003, 37, 171–175. [Google Scholar] [CrossRef]
- Zinkhan, G.M.; Braunsberger, K. The complexity of consumers’ cognitive structures and its relevance to consumer behavior. J. Bus. Res. 2004, 57, 575–582. [Google Scholar] [CrossRef]
- Tu, J.C.; Kao, T.F.; Tu, Y.C.; Chen, H.Y. Influences of Product Involvement, Environmental Message and Green Advertising Appeals on Consumers’ Attitudes towards Advertising. J. Bus. Res. 2011, 5, 1–18. [Google Scholar]
- Fu, K.C. Analysis on the Combination of 4P, 4C and 4S and Its Application. East China Econ. Manag. 2004, 4, 153–154. [Google Scholar]
Figure 1.
The pyramid of society showing the new poor group at its base.

Figure 2.
Research framework.

Figure 3.
Research process.

Figure 4.
The implementation steps of the triad method.

Figure 5.
Repertory grid technology (RGT) analysis chart.

Figure 6.
Principal component analysis chart.

Table 1.
The grid assessment tool of DfSB design approaches for the new poor.
| Item | Construct +/− | Eco-Information | Eco-Steer | Eco-Spur | Eco-Choice | Eco-Technology | Clever Design |
|---|---|---|---|---|---|---|---|
| 1 | Humanized Design/Basic Design | ||||||
| 2 | Strong Energy-Saving Perception/Weak Energy-Saving Perception | ||||||
| 3 | Technical Control/Man-made Control | ||||||
| 4 | Strong Energy Message Tips/Weak Energy Message Tips | ||||||
| 5 | Reward/Penalty | ||||||
| 6 | Guided Energy Saving/Invisible Energy Saving | ||||||
| 7 | Persuasive Energy Saving/Stationary Energy Saving | ||||||
| 8 | Multiple Choice/Less Choice | ||||||
| 9 | Do not Increase the Burden of Use/Increase the Burden of Use | ||||||
| 10 | User Behavior Changed/User Behavior Not Changed |
Table 2.
Instructions for energy use of washing machines A and B.
| Washing Machine | Energy Efficiency (kWh/kg) | Energy Consumption/Year (KWH) | Energy Saving/Year (KWH) | Reduce Carbon Emissions (KG) | Amount of Save Electricity (TWD) |
|---|---|---|---|---|---|
| A | 0.004 | 10 | 21 | 12 | 59 |
| B | 0.009 | 23 | 8 | 4 | 23 |
Table 3.
Descriptive statistics for an assessment tool.
| Item | Research Object A | Research Object B | ||
|---|---|---|---|---|
| M | SD | M | SD | |
| 1 | 3.61 | 0.755 | 3.16 | 0.754 |
| 2 | 3.34 | 0.994 | 3.03 | 1.102 |
| 3 | 3.32 | 1.016 | 3.24 | 0.852 |
| 4 | 3.11 | 1.134 | 2.92 | 1.239 |
| 5 | 3.13 | 1.119 | 3.05 | 1.064 |
| 6 | 2.66 | 1.072 | 2.84 | 0.973 |
| 7 | 3.71 | 1.063 | 3.13 | 0.875 |
| 8 | 3.82 | 0.766 | 3.08 | 0.912 |
| 9 | 3.32 | 0.989 | 3.03 | 0.854 |
| 10 | 3.32 | 1.068 | 3.42 | 0.976 |
Table 4.
Wilcoxon test differential rating checklist.
| Item | 1 | 2 | 3 | 4 | 5 | 6 | 7 | 8 | 9 | 10 |
|---|---|---|---|---|---|---|---|---|---|---|
| Z | −3.266 a | −2.010 a | −0.451 a | −0.737 a | −0.336 a | −0.880 b | −2.646 a | −3.293 a | −1.942 a | −0.312 b |
| Significance (one-tailed) | 0.001 | 0.022 | 0.326 | 0.231 | 0.369 | 0.190 | 0.004 | 0.001 | 0.026 | 0.378 |
a On the positive level. b On the negative level.
© 2018 by the authors. Licensee MDPI, Basel, Switzerland. This article is an open access article distributed under the terms and conditions of the Creative Commons Attribution (CC BY) license (http://creativecommons.org/licenses/by/4.0/).
Share and Cite
MDPI and ACS Style
Tu, J.-C.; Nagai, Y.; Shih, M.-C. Establishing Design Strategies and an Assessment Tool of Home Appliances to Promote Sustainable Behavior for the New Poor. Sustainability 2018, 10, 1507. https://doi.org/10.3390/su10051507
AMA Style
Tu J-C, Nagai Y, Shih M-C. Establishing Design Strategies and an Assessment Tool of Home Appliances to Promote Sustainable Behavior for the New Poor. Sustainability. 2018; 10(5):1507. https://doi.org/10.3390/su10051507
Chicago/Turabian StyleTu, Jui-Che, Yukari Nagai, and Min-Chieh Shih. 2018. "Establishing Design Strategies and an Assessment Tool of Home Appliances to Promote Sustainable Behavior for the New Poor" Sustainability 10, no. 5: 1507. https://doi.org/10.3390/su10051507
Note that from the first issue of 2016, this journal uses article numbers instead of page numbers. See further details here.