Article

Domestic Wheat Trade and Its Associated Virtual Cropland Flow in China, 2010–2015

1
College of Resources and Environmental Sciences, China Agricultural University, Beijing 100193, China
2
Key Laboratory of Agricultural Land Quality, Monitoring and Control, Ministry of Land and Resources, Beijing 100193, China
3
Institute of Geographic Sciences and Natural Resources Research, CAS, Beijing 100101, China
*
Authors to whom correspondence should be addressed.
Sustainability 2018, 10(5), 1459; https://doi.org/10.3390/su10051459
Submission received: 2 April 2018 / Revised: 22 April 2018 / Accepted: 27 April 2018 / Published: 7 May 2018
(This article belongs to the Section Sustainable Agriculture)

Abstract

:
How to meet food demands with limited cropland has become a serious problem worldwide, especially in China. Global and national food trade can alleviate regional food unbalance among different countries or regions to some extent. The embedded virtual land also flows with food trade, and reasonable food trade can save global croplands and protect local ecosystems. Therefore, it is of great importance to study how trade influences land use as well as its associated environmental consequences. Recent studies have mainly focused on global food trade and its associated virtual land flow; however, only a few have focused on national food trade and its associated virtual land flow. Thus, this study aims to explore the domestic wheat trade and its associated virtual land flows in China during the period 2010–2015, based on the CHINAGRO model and previous studies. The Huang-Huai-Hai Plain and its surrounding regions were the main producers and consumers of wheat and virtual wheat. Without wheat stocks and international wheat trade, the annual domestic wheat trade accounted for 16.43% of the total national wheat production in China. Anhui was the largest net exporter of wheat, followed by Henan, while the developed areas such as Beijing, Guangdong, and Shanghai were the main net importers. Additionally, as an important transfer region, Jiangsu was the largest exporter and importer of wheat virtual cropland, but it finally presented as a net exporter of wheat cropland. During this period, domestic wheat trade led to a total land savings of 2.62 Mha/a, accounting for 10.80% of Chinese wheat cropland. However, compared with the year 2010, Shandong, Hebei, and Sichuan turned into wheat net importers in 2015, which was due to different reasons such as national agriculture polices and economic development. In addition, the net virtual cropland per capita has been greatly influenced by local economic development.

1. Introduction

Land is the fundamental and limited natural resource of human existence and social development. Due to urbanization, land use change, and population increase, ensuring food security with limited cropland has become an urgent global issue [1]. At present, there is 1545.51 Mha of cropland in the world, presenting considerable spatial differences globally [2]. Some countries such as Uganda are facing serious cropland shortages, where limited croplands have led to local food shortages and have severely restricted their sustainable development. Mitigating food shortages due to limited croplands is a key issue in the world.
International trade plays an important role in making up for the scarcity of croplands in some countries [3]. For example, the international cereal trade can effectively ease pressures on domestic food production in some island countries such as Japan and some arid countries such as Syria [1]. China, the largest developing country, has been under rapid urbanization and social development; meanwhile, China has also faced some serious challenges posed by limited croplands due to a massive population, poor cropland quality, potential cropland shortage, and serous pollution [4,5,6]. In 2014, China has 135 Mha of arable land, equal to approximately 0.098 ha per capita, which is only 55.87% of the global level [2,7]. More seriously, the arable croplands have been declining in China, with serious soil and water loss [8,9]. These problems have already become key issues in China to balance cropland protection and urbanization and to balance food production and environment protection.
Food trade, to some extent, can alleviate the restriction of food production in some regions with limited cropland in China. Such trade is also highly important for more effectively balancing the relationship between humans and land [10]. During the period 2010–2015, China annually imported 87.12 Mt of cereals, with an increasing trend [11]. Embodied natural resources flow with food trade, suggesting that there are environmental consequences associated with food trade. Therefore, some researchers have focused on how food trade influences resource utilization and its associated environmental consequences, especially for water and land resources [12,13]. The concepts of virtual water and virtual land were proposed to estimate water and land flows embodied in food trade as well as their environmental consequences [1,14,15,16,17,18,19].
Virtual land was defined as the nontransferable land resources dependent on agricultural trade across regions; in other words, land resources flow with the agricultural products traded from one region to another [1,20,21]. Food trade can strengthen relationships between import countries and export countries, including economy, natural resources, environment, and so on. It is hard to directly estimate how food trade influences natural resources and local environment. Virtual land, as well as its virtual flow, can effectively solve these problems, which can provide some useful information for both countries. Although virtual land is highly important and helpful, there are still some disadvantages. For example, virtual land does not consider differences between two regions, such as land quality, radiation, water, and so on. Therefore, further studies on virtual land are required in the future. By now, two distinctive methods, the environmentally extended input-output analysis model (IOA) and the bottom-up direct trade analysis, are employed to estimate virtual land trade and its associated environmental consequences caused by international trade [21,22,23] and domestic trade [24,25]. It was found that international and national trade can effectively alleviate the land pressures from food production [1,3,26,27,28]. In China, some scholars have also focused on virtual land flows due to food trade. Zhang et al. [1] explored the great potential of international cereal trade for land conservation. Chen & Han [21] studied how international trade influenced virtual land during the period 2002–2010, based on the IOA model. Qiang et al. [3] evaluated and quantified the virtual land flows between China and other countries as well as their land use efficiency. However, most recent studies focused on international virtual land flows, and only a few studies focused on virtual lands and their associated environmental consequences due to domestic food trade [16,24,29]. Furthermore, there are still some gaps in virtual land flows caused by specific cereal trade in China.
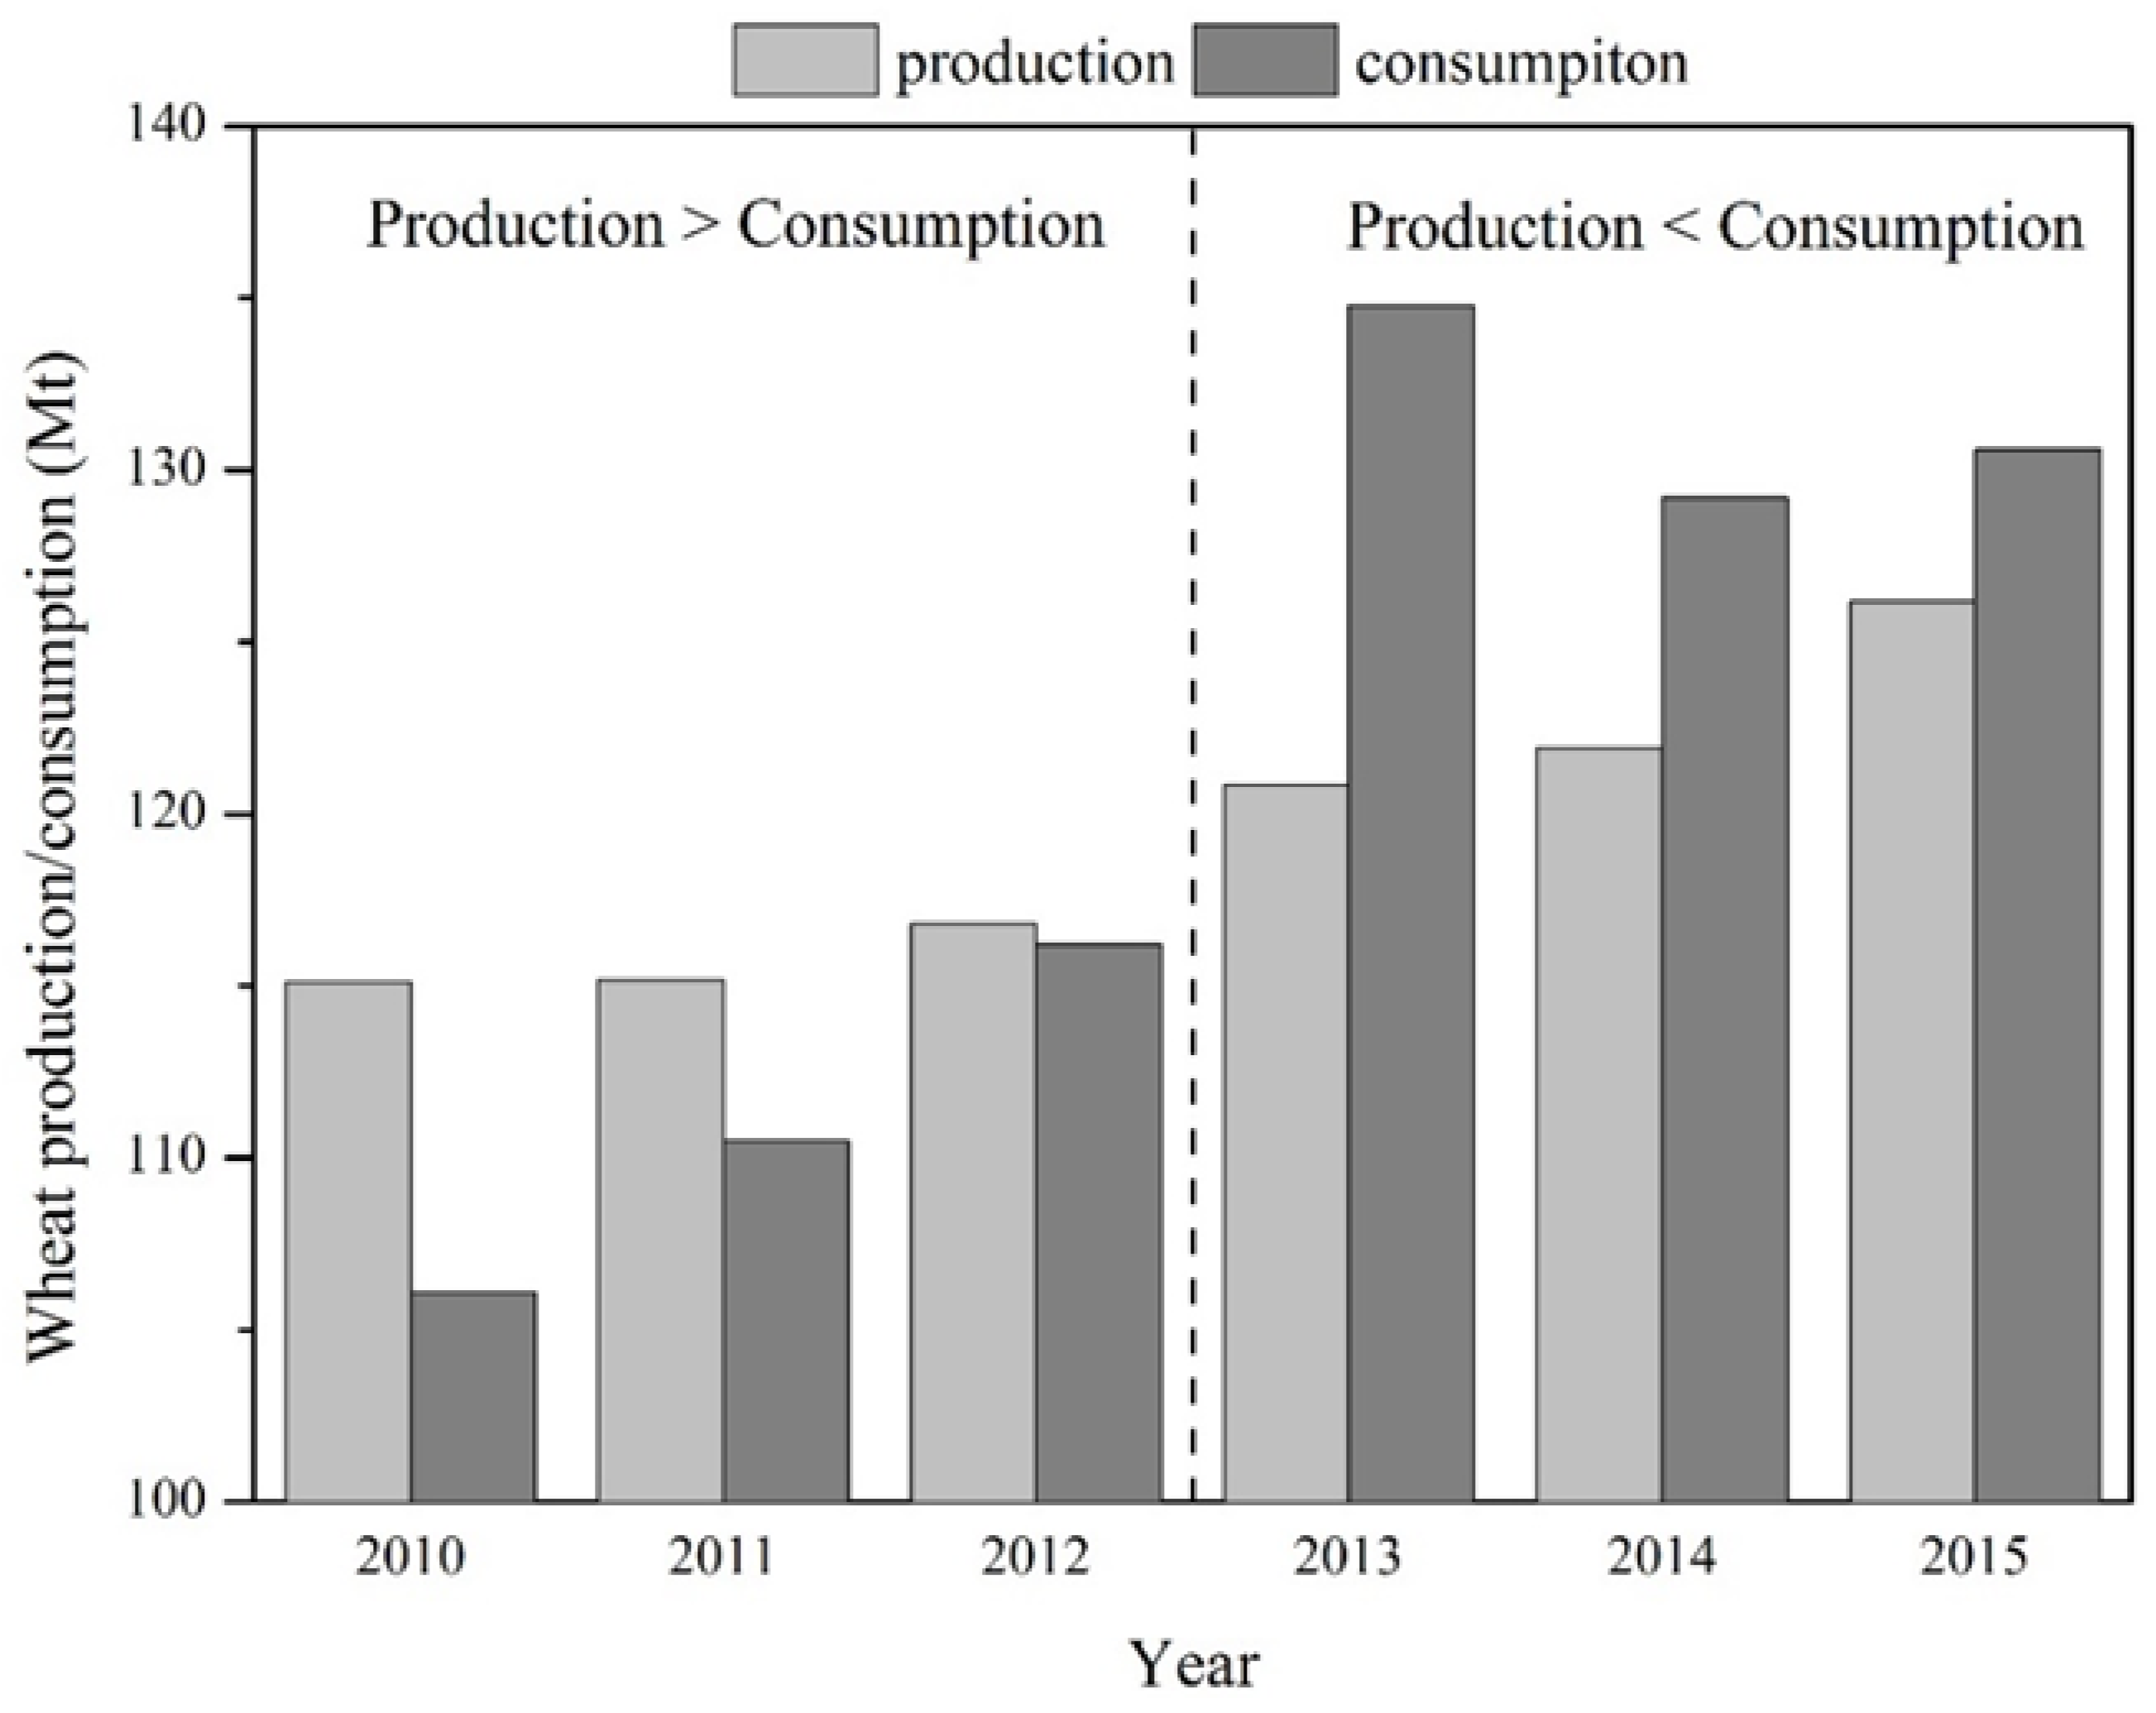
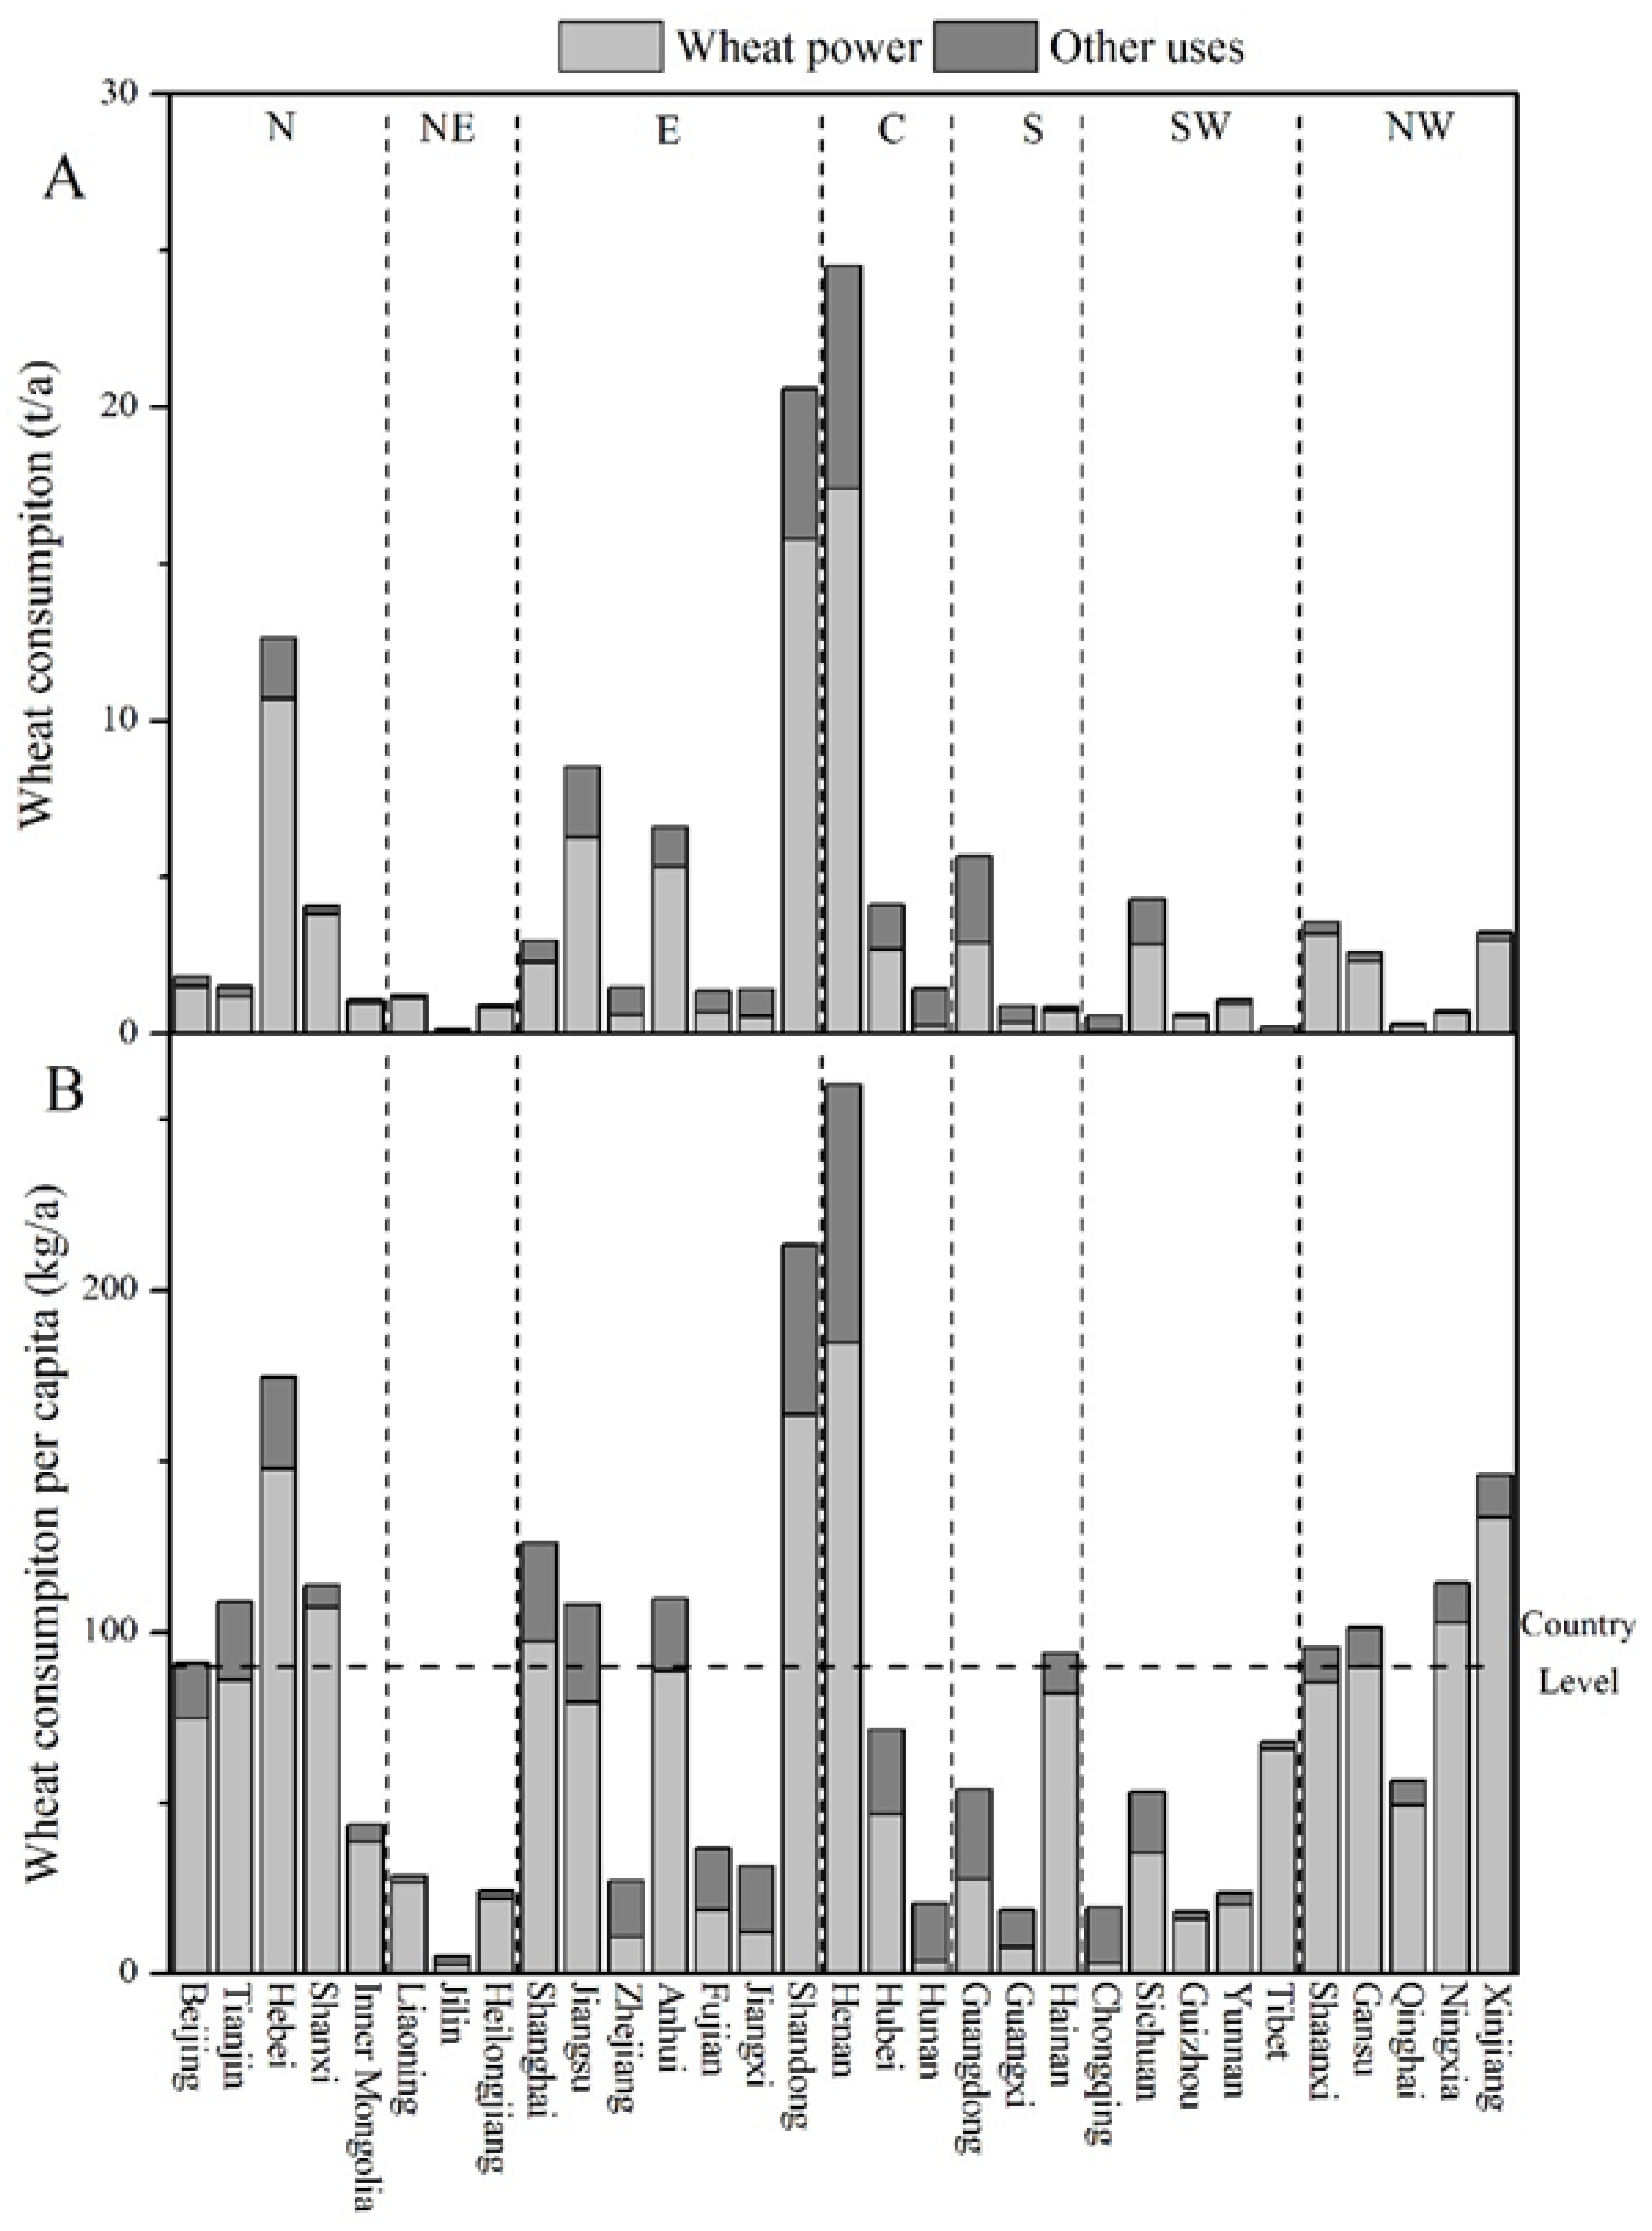
Wheat is one of main staple foods in China, used for producing steamed bread, noodles, dumplings, etc. As the largest producer and consumer, wheat consumption in China increased significantly from 4.24 Mt in 1961 to 131 Mt in 2015, 1.56% of which in 2015 was imported from other countries [11]. Meanwhile, there are considerable spatial differences of wheat production and consumption in China, and most wheat is produced and consumed in North China. The domestic wheat trade is of great significance in balancing these spatial differences of wheat croplands in China. However, an analysis of interprovincial flows of wheat croplands, as well as their associated consequences on the national wheat cropland balance, is still lacking. Therefore, in order to bridge these gaps, this study made full use of the CHINAGRO model to examine domestic wheat trade among 31 provinces in China. Taiwan, Hong Kong, and Macau were excluded considering the wheat trade cost described by Guo et al. [30]. We then estimated flows of virtual wheat cropland for the period 2010–2015. In addition, we also discussed how domestic wheat trade influenced national wheat cropland balance in China, from both production and consumption perspectives. This paper aims to find out how domestic wheat trade changed for the period 2010–2015, as well as its environmental consequences, based on the viewpoint of virtual land. Then, we also aim to provide some useful information for national agricultural policies for future wheat production, land use, and environmental protection in China.

2. Methods and Data

The detailed bottom-up method and the input-output method can be used to estimate the embodied resource flows due to regional trade, such as virtual water and virtual land. The detailed bottom-up method was applied in this study for estimating virtual land flows due to the domestic interprovincial wheat trade in China during the period 2010–2015. The study area includes 31 provinces in China, except Taiwan, Hong Kong, and Macau. The detailed methods were as follows.

2.1. Domestic Wheat Trade

The CHINAGRO model (Decision Support System for China’s Agricultural Sustainable Development) is a multiregional agriculture-based spatial equilibrium model to estimate the national trade of agricultural products in China, such as rice, wheat, maize, and so on. Then, it divides China into seven large regions, including North China, Northwest China, East China, Central China, South China, Southwest China, and Northwest China [31]. Based on local natural conditions, population, and economic level, crop production and consumption for each region can be estimated by the CHINAGRO model, as well as crop trade in China. Welfare optimization was the principal economic tool applied to evaluate a range of scenarios and policy options to assess the technological feasibility, economic costs, and environmental effects of food policy changes in China, as well as other problems (http://webarchive.iiasa.ac.at/Research/LUC/External-Chinagro/index.html). Fischer et al. [31] used this model to estimate the prospects and challenges of Chinese agriculture by 2030 under different scenarios. Qiu et al. [32] used this model to analyze the effects of different fuel ethanol development policies on agricultural prices. Based on the principle of the CHINAGRO model, Ben et al. [24] estimated domestic crop trade among different provinces. Using costs of different trade, Guo et al. [30] established a road-network model to obtain trade routes and costs considering the shortest distance and the lowest cost, respectively.
Therefore, based on the principle of the CHINAGRO model and previous studies [24,30], we quantified interprovincial wheat trades in China for the period 2010–2015, considering their production and consumption. Like the CHINAGRO model, we took wheat production and consumption into account, based on a multiregional spatial equilibrium model as well as their transport costs. In our study, we considered domestic wheat production and consumption in 31 provinces (excluding Taiwan, Hong Kong, and Macau), and we considered wheat stocks and wheat international trade in a black box that was treated as the 32nd province. When wheat production was larger than its consumption in one province, this province exported surplus wheat to other provinces; otherwise, one province would import wheat from other provinces when consumption was much larger. When the total wheat production was larger than the total wheat consumption of these 31 provinces, the surplus wheat was stocked or exported to other countries, as the 32nd province in our study. In contrast, the deficit of wheat consumption would be supplied by previous wheat stocks or international imports, considered as imported from the 32nd province.
Based on the minimum trade cost, domestic wheat trade could be estimated by wheat production and wheat consumption for each province using the CHINAGRO model and linear optimization models. For the linear optimization model, wheat production and wheat consumption for each province were considered as the constraints, and wheat trade from province i to province j was presented as Zij. The wheat trade cost Cij referred to the wheat trade cost from province i to province j, and the minimum national wheat trade cost was considered to be the objective function. The linear optimization model of linprog = (f, A, b, Aeq, beq, lb, [ ]) function was used to calculate domestic wheat trade. The detailed method was as follows:
{ min ( f = i = 1 , j = 1 i = 32 , j = 32 C i j × Z i j ) j = 1 32 Z i j S i ,   i = 1 , 2 , ,   32 i = 1 32 Z i j = D j ,   j = 1 , 2 , ,   32 Z i j 0
where S i represented the total wheat production in province i, D i represented the total wheat consumption in province i, Z i j represented the wheat trade from province i to province j, and C i j represented the cost of wheat trade from province i to province j.
We obtained some data from China National Grain & Oil Information Center, including the annual wheat production, wheat consumption, and their distribution for 31 provinces in China (except Taiwan, Hong Kong, and Macau). The economic information was obtained from the Chinese Statistics Yearbook for 2011–2016.

2.2. Virtual Wheat Cropland

The virtual land flow due to domestic wheat trade could be calculated from perspectives of producers or consumers, depending on the wheat cropland footprint of producers or consumers [24]. The detailed information was as follows: Tij referred to the net wheat trade between province i and province j and was calculated by subtracting Zij from Zji and taking the absolute value; if Zij was larger than Zji, Tij meant the net wheat trade from province i to province j; otherwise, Tij meant the net wheat trade from province j to province i. Wheat cropland footprint was defined as the amount of land needed to produce 1 kg of wheat in a province and could be estimated by the total wheat cropland Li and wheat production Pi in province i. Thus, L S i represented the land footprint in the net export province i, and L D j represented the land footprint in the net export province j. VLTSij and VLTDij represented the area of the virtual wheat cropland with the wheat trade from province i to province j from the perspectives of producer i and consumer j, respectively. The detailed methods were as follows:
V L T S i j = T i j × L S i = T i j × L i P i
V L T D i j = T i j × L D j = T i j × L j P j
For wheat trade between two provinces, if the production of virtual wheat cropland (VLTSij) was larger than the consumption of virtual wheat cropland (VLTDij), it indicated that the wheat trade would waste the wheat cropland; otherwise, the wheat trade would save wheat cropland. Therefore, the consequences of national wheat cropland balance due to domestic wheat trade (TLB) could be estimated as follows:
T L B = V L T S i j V L T D i j
where when the TLB was less than 0, it indicated that the domestic wheat trade would help to save wheat cropland in China; otherwise, the domestic wheat trade would result in wheat cropland waste.
Furthermore, wheat cropland refers to the annual wheat sown area, but not the wheat arable land. In China, some provinces such as Hainan do not cultivate wheat, and thus it is difficult to estimate their wheat land footprint as well as their virtual land from the consumption viewpoint. In our study, we assumed that wheat cropland saving was the consequence of the wheat trade, with its amount equal to the virtual land from the production viewpoint.

3. Results

3.1. Wheat Production and Consumption in China

3.1.1. Wheat Production in China

Figure 1 illustrates the total wheat production and consumption in China for the period 2010–2015. The annual wheat production presented an increasing trend from 115.11 Mt/a in 2010 to 126.17 Mt/a in 2015, with an annual yield of 4.92 t/(ha·a). The Huang-Huai-Hai Plain in North China was the main wheat-producing area in China, including Shandong, Anhui, and Jiangsu in East China (E), Henan in Central China (C), and Hebei in North China (N). These five provinces accounted for approximately three-quarters of the total wheat production in China, with an annual yield of more than 10 Mt/a. The remaining provinces produced only one-quarter of the total wheat, mainly in Northeast China, Northwest China, South China, and Southwest China. The wheat yield was only slightly different among provinces in China (Figure 2). For provinces in the Huang-Huai-Hai Plain, their wheat yields were larger than the national average of 4.92 t/(ha·a). However, the wheat yield in Northeast China was much lower than the national average, especially for Heilongjiang (2.51 t/(ha·a)) and Jilin (1.80 t/(ha·a)). The low yield led to lower income there, and consequently, local farmers shifted to planting paddy rice for higher income. Compared with 2010, in 2015, wheat croplands in Heilongjiang and Jilin decreased by 63.50% and 90.24%, respectively.

3.1.2. Wheat Consumption in China

The annual wheat consumption amounted to 121.23 Mt/a during the period 2010–2015, approximately 89.90 kg/a per capita. Approximately 90.28 Mt of wheat was consumed annually for producing wheat flour, accounting for 74.47% of total wheat consumption, and the remaining was consumed for other uses (Figure 3). Henan, Shandong, and Hebei were large wheat producers and large wheat consumers in China. For these three provinces, their annual wheat consumption was more than 10 Mt/a, totaling 47.65% of total wheat consumption in China, with more than 70% of wheat consumption being used for wheat flour. Wheat consumption was also large in Jiangsu, Anhui, Guangdong, Sichuan, and Hubei. More specifically, although Guangdong produced only a small amount of wheat, it consumed a great deal of wheat traded from other provinces. There were great differences in wheat uses among 31 provinces due to their distinct geography, climate, culture, and economic level. More than 55% of wheat consumption was used for producing wheat flour in all provinces in North China and Northwest China as well as some provinces in Northeast China and Southwest China. However, more than one-half of the wheat consumption was used for purposes other than wheat flour in Jilin, Zhejiang, Jiangxi, Hunan, Guangdong, Guangxi, and Chongqing. In particular, only 18.41% and 15.47% of wheat consumption was used for producing wheat flour in Hunan and Chongqing, respectively. Due to different cultures, wheat consumption per capita in China presented great spatial differences. Wheat consumption per capita was higher than the national average for all provinces in North China and Northwest China. However, wheat consumption per capita was the largest in Henan, approximately 2.89 times higher than the national average, followed by Shandong (2.37 times higher) and Hebei (1.94 times higher). However, wheat consumption per capita was much lower than the national level in Northeast China, South China, East China (except Shandong), and Central China (except Henan), where rice was the main staple. Therefore, both location and culture have great influences on cereal consumption in China.

3.2. The Domestic Wheat Trade in China

Figure 1 illustrates that both wheat production and wheat consumption presented increasing trends during the period 2010–2015. During the first 3 years of 2010–2012, wheat production exceeded wheat consumption in China, but the net wheat surplus decreased. For the last 3 years, the national wheat consumption was larger than its production, and the deficit of wheat consumption was met by previous wheat stocks or imports from other countries. In 2013, the deficit of wheat consumption amounted to 13.96 Mt/a, accounting for 5.6% of the total national wheat consumption. Based on the CHINAGRO model, we estimated the domestic wheat trade in China for the years 2010 and 2015 (Figure 4). Without wheat stocks and international wheat trade, the annual domestic wheat trade was approximately 19.60 Mt/a in China during the period 2010–2015, accounting for 16.43% of the total national wheat production. In addition, total wheat exports and stocks amounted to 4.77 Mt/a in the first 3 years. However, China annually consumed 8.55 Mt of wheat exported from other countries or from previous stocks for the last 3 years. We compared domestic wheat trade in 2010 and 2015 for more details.

3.2.1. Domestic Wheat Trade in 2010

In 2010, the main net exporters of wheat included Henan, Anhui, Xinjiang, Shandong, Hebei, and Jiangsu, with the largest wheat export of 9.50 Mt/a in Henan (approximately 31.07% of its wheat production) (Figure 4A). Meanwhile, Guangdong, Shanghai, Shanxi, Beijing, Liaoning, and Hunan imported large amounts of wheat from other provinces; in particular, 90% of wheat consumption in Shanghai and Guangdong came from other provinces. In North China, the domestic wheat trade mainly occurred in its own region, largely from Hebei to Shanxi, Beijing, and Tianjin. Northwest China presented as a net export region of wheat (approximately 3.19 Mt/a), mainly flowing into stocks. The domestic wheat trade in East China was highly complex, including interregional wheat trade and internal wheat trade. For internal trade, Jiangsu imported wheat from Anhui, while Jiangsu exported wheat to Zhejiang and Fujian. For interregional trade, the wheat trade was from Shandong to the North China provinces (such as Beijing and Tianjin) and from Jiangsu to the South China provinces (such as Guangdong and Hainan). For domestic wheat trade in Central China, wheat was traded from Henan to both Central China (Hunan and Hubei) and other regions, and the interregional wheat trade (including domestic wheat stocks) amounted to 4.48 Mt/a. South China was a large wheat importer from other regions, similar to Northeast China and Southwest China. In 2010, the largest provincial wheat trade was from Anhui to Jiangsu, with a trade amount of approximately 5.95 Mt/a, followed by 4.66 Mt/a from Jiangsu to Guangdong.

3.2.2. Domestic Wheat Trade in 2015

Compared with 2010, some provinces changed from wheat net exporters to wheat net importers in 2015, including Shandong, Hebei, Sichuan, Gansu, and Ningxia. In 2015, China announced a reduction in cereal stocks, and thus many factories were established to process wheat in Shandong and Hebei, which were the main wheat producers and consumers in China. The interregional wheat trade in 2015 was also different from that in 2010. North China consumed more wheat than its local wheat production in 2015, and thus it imported wheat from Xinjiang and Henan. Central China was still a main wheat exporter in 2015, but its wheat was mainly traded to Shandong and Hebei. East China remained nearly unchanged, except Shandong, which changed from a wheat exporter to a wheat importer. Wheat consumed in South China was traded not only from East China provinces such as Jiangsu but also from other countries or previous stocks. Wheat consumption from international wheat trade and previous wheat stocks was approximately 1.99 Mt/a for Guangdong and 0.77 Mt/a for Guangxi in 2015, respectively. Southwest China and Northeast China also imported wheat from other regions. In 2015, Jiangsu also presented as the main freight station of the wheat trade. Anhui sold approximately 6.75 Mt/a of wheat to Jiangsu, while Jiangsu traded more wheat to other provinces, such as Guangdong (3.84 Mt/a), Shanghai (2.40 Mt/a), and Zhejiang (1.05 Mt/a).

3.3. Virtual Wheat Cropland Transfer and Its Environmental Consequences

3.3.1. Virtual Wheat Cropland Transfer in 2010

From the production viewpoint, the virtual wheat cropland amounted to 5.70 Mha/a in 2010 due to the domestic wheat trade (Figure 5). Jiangsu, Anhui, Henan, Hebei, and Shandong were the 5 largest provinces of wheat cropland exporters, and their total exported virtual wheat cropland amounted to 5.34 Mha/a, approximately 93.68% of the total virtual wheat cropland flow. Different from the wheat trade, Jiangsu was the largest wheat-cropland exporter, which mainly flowed to Guangdong, Fujian, and Zhejiang. The virtual wheat cropland exported from Jiangsu was 1.73 Mha/a, accounting for approximately 30.40% of the total virtual wheat cropland transfer in 2010. Furthermore, the largest wheat cropland transfer occurred when wheat was traded from Anhui to Jiangsu, amounting to 1.19 Mha/a. Taking wheat consumption into account, the virtual wheat cropland amounted to 8.48 Mha/a, larger than that obtained from the production viewpoint. Jiangsu was also the largest wheat cropland exporter (3.03 Mha/a), while Guangdong was the largest wheat cropland importer, amounting to 1.96 Mha/a. Wheat trade from Anhui to Jiangsu also led to the largest transfer of virtual wheat cropland of 1.23 Mha/a in 2010, accounting for 14.50% of the total domestic transfer of virtual wheat cropland in China. Domestic wheat trade in China saved approximately 3.19 Mha/a of wheat cropland in 2010, accounting for 13.13% of wheat cultivation cropland in China. Wheat trade from Jiangsu to Guangdong saved the largest virtual wheat cropland of 0.99 Mha/a in 2010; additionally, wheat trade from Henan to Jiangxi, Hubei, and Hunan also presented large wheat cropland savings. However, some interprovincial wheat trade resulted in a loss of virtual wheat cropland, totaling 0.067 Mha/a in China, including Hubei–Shanghai, Heilongjiang–Liaoning, Jilin–Liaoning and Shanghai. The wheat trade from Hubei to Shanghai led to the largest loss of wheat cropland, at a rate of approximately 0.061 Mha/a.

3.3.2. Virtual Wheat Cropland Transfer in 2015

The domestic wheat trade was much more complicated in 2015 due to changes of wheat production and wheat consumption (Figure 6). From the viewpoint of wheat production, the total virtual wheat cropland was approximately 5.45 Mha/a in 2015 due to the domestic wheat trade, higher than that in 2010. Jiangsu also presented as the largest importer (1.18 Mha/a) and largest exporter (1.75 Mha/a). In addition, Anhui, Henan, Inner Mongolia, and Xinjiang were also wheat cropland exporters. Specifically, Xinjiang exported 0.54 Mha/a of virtual wheat cropland to Shanxi, Inner Mongolia, Ningxia, Beijing, and Tianjin, accounting for 9.91% of the total virtual wheat cropland. In addition, 20 provinces imported virtual wheat cropland in 2015. From the wheat consumption standpoint, the virtual wheat cropland transfer was 6.66 Mha/a in 2015. As the largest exporter, Jiangsu exported 2.26 Mha/a of virtual wheat cropland to Guangdong, Shanghai, Fujian, and other provinces; meanwhile, Jiangsu was also the largest virtual cropland importer and imported mainly from Anhui. In addition, Shanxi was also a large virtual wheat cropland importer and imported mainly from Xinjiang. Sichuan, Shandong, and Hebei turned from virtual wheat cropland exporters in 2010 to virtual cropland importers in 2015. Furthermore, Hebei imported approximately 0.20 Mha/a of virtual wheat cropland from Henan. The domestic wheat trade in China saved a total virtual wheat cropland of 1.52 Mha in 2015, which was lower than in 2010, and accounted for 6.35% of the total wheat cropland in China. Wheat trade from Henan to Jiangxi saved the largest wheat cropland of 0.37 Mha/a, while the largest virtual wheat cropland loss occurred when approximately 0.29 Mha/a of wheat was traded from Inner Mongolia to Beijing.

3.3.3. The Consequence of Domestic Wheat Trade in China

During the period 2010–2015, the domestic wheat trade in China led to great wheat cropland savings, totaling 15.71 Mha (approximately 2.62 Mha/a) (see Table 1). The wheat cropland savings reached 4.56 Mha/a in 2012 and was greater than 3.0 Mha/a in 2010 and in 2011. However, wheat cropland savings due to domestic wheat trade were much lower during the period 2013–2015 (1.3–1.6 Mha/a). This trend occurred because provinces with high wheat yields, such as Hebei and Shandong, turned from net wheat exporters to net importers and imported a great deal of wheat from provinces with relatively low yields of wheat in 2015. However, the domestic wheat trade in China can effectively save Chinese wheat croplands. In addition, wheat cropland is very limited in Beijing, Tianjin, and Shanghai, where wheat consumption should be imported from other provinces in China. Meanwhile, for some provinces (such as Hainan) for which the local natural conditions are not very suitable for wheat cultivation, they also should import wheat from other provinces. Therefore, domestic wheat trade is beneficial to resource utilization and societal development in China.

4. Discussion

4.1. Virtual Land Change and National Policy

Domestic wheat trade has changed in some provinces, such as Shandong, Hebei, and Sichuan. These provinces were main wheat producers and exporters in the past but became net wheat importers in 2015. However, these changes were caused by different reasons. For Sichuan, the net income for planting wheat was −6100 Yuan/(ha·a), and thus local farmers preferred to work outside and abandoned their wheat croplands. Therefore, the area of wheat cropland has declined from 1.22 Mha/a in 2010 to 1.17 Mha/a in 2015, which only accounted for 4.1% of the total wheat cropland in Sichuan. Meanwhile, the total population in Sichuan increased from 80.45 million to 82.04 million, and wheat consumption also increased from 4.02 Mt to 4.26 Mt. Although wheat demands increased in Sichuan, the negative wheat cropland income led to cropland abandonment. Therefore, Sichuan turned from a net exporter in 2010 to a net importer in 2015. However, Shandong and Hebei presented different situations. Taking Shandong, for example, during the period between 2010 and 2015, wheat cropland increased from 3.55 Mha to 3.74 Mha, and wheat production also increased from 20.47 Mt/a to 22.64 Mt/a. Meanwhile, wheat consumption increased more significantly and amounted to 23.71 Mt/a in 2015, larger than its wheat production. Wheat production and wheat consumption in Shandong were highly influenced by national polices. The Chinese government has announced the minimum purchase price since 2004 in order to protect cereal production. However, this policy led to a large amount of cereal stocks in China due to a higher cereal price in China than in other countries. Cereal processing has been encouraged to reduce cereal stocks since 2014. Shandong is a large producer and consumer of wheat, and many large wheat processing factories are located in Shandong. After the announcement of these policies, more wheat processing plants were established there. Thus, wheat consumption increased by 6.01 Mt/a from 2010 to 2015, including 3.20 Mt/a from wheat flour production and 2.79 Mt/a from other wheat consumption. These changes turned Shandong to a net wheat importer, which also influences national virtual wheat cropland transfer. Therefore, national policies cannot only directly influence wheat production and consumption but also affect the associated environmental consequences. Thus, more attention should be paid to future policies.

4.2. Virtual Cropland Transfer and Economic Development

Land use change occurs with economic development [33]. Land prices have been increasing with economic development, and local inhabitants have had to turn to jobs with higher incomes, such as manufacturing. Therefore, cropland may be used for industry. Meanwhile, food consumption may also increase with economic development [34]. However, local food production cannot meet food consumption in these regions, and food must be imported from other regions, leading to virtual cropland transfer. Therefore, it is necessary to determine how virtual cropland transfer is associated with economic development. In China, virtual wheat cropland also presented a similar trend with economic development (Figure 7). With economic development, provinces such as Xinjiang, Henan, and Anhui turned from net virtual wheat cropland exporters to net virtual wheat cropland importers, similar to Beijing, Tianjin, and Shanghai. More specifically, when GDP per capita amounted to more than 50,000 Yuan/a, most provinces presented as net virtual wheat cropland importers, except the main wheat producers such as Jiangsu and Shandong. Although Jiangsu still presented as a net virtual wheat cropland exporter, its export amount showed a decreasing trend with economic development. When GDP per capita was lower than 50,000 Yuan/a, most provinces with wheat production presented as net virtual wheat cropland exporters, but the net import decreased with economic development. The net virtual wheat cropland per capita in Ningxia changed significantly with economic development, from a net exporter to a net importer. Therefore, the net virtual cropland per capita has been greatly influenced by local economic development. Future research should be conducted on how to balance economic development and food production.

4.3. Comparison with Previous Studies

Many studies have already focused on virtual resource transfer for different cereals based on different methods. Yan et al. [16] studied the consequences of the maize trade from the North to the South in China, and they noted that it amounted to 40 Mt/a, leading to a virtual maize cropland of 5.9–9.5 Mha/a. Like Yan et al. [16], Li et al. [29] also focused on the trend of cereal trade from the North to the South in China, and they noted that this domestic cereal trade led to a net virtual cropland transfer of 9.95 Mha/a in 2008. Based on the input-output method, Zhang & Li et al. [35] estimated domestic trade and their embodied natural resource flows, noting that GDP had larger influences than did distance. Ben et al. (24) estimated virtual cereal cropland flows and noted the consequences of this trade. In our research, we also focused on domestic cereal trade as well as its associated resource flows in China. However, previous studies mostly focused on all cereals, including maize, wheat, rice, and other cereals, and they did not pay sufficient attention to wheat trade flow. Our study focused on wheat trade and its associated virtual cropland flows, which can lead to a better understanding of how domestic trade influences national resource consumption. Different from maize or other cereals, the domestic wheat trade was mainly from areas in Central China or East China, such as Henan and Anhui, to areas in South China, such as Guangdong and Jiangxi, because Henan and Anhui were main wheat producers in China. In addition, using the same method, Ben et al. [24] noted that the total domestic cereal trade led to cropland loss in China, but our study found that domestic wheat trade resulted in net cropland savings. Therefore, it is more important to focus on specific cereal trade than the total cereal trade, the former of which can provide more detailed information for virtual cropland flows. Although our study has presented some new information, it still has some constraints. In particular, our study did not consider the influences of GDP on domestic trade. Therefore, more factors should be considered in future studies to better estimate domestic trade.
As estimated above, national policy in China can strongly influence wheat production, wheat consumption, and wheat domestic trade. Taking this country into account, suitable wheat trade can effectively save wheat cropland, and thus future national agricultural policy should take its associated influences into accounts. Our following studies will combine our model and the input-output model and will also compare their differences. Besides, our future virtual land studies will take cropland quality and environmental pollution into account, in order to better understand the environmental consequences due to domestic and international food trade.

5. Conclusions

Based on the CHINAGRO model and previous studies, we estimated domestic wheat trade and its associated virtual cropland in China. Although we only focused on the transportation costs and did not consider the level of economic development, the estimation still presented some important and interesting information here. The Chinese domestic wheat trade is very complex, and different regions presented different patterns. The Huang-Huai-Hai Plain and its surrounding areas are main wheat producers and consumers. However, Henan and Anhui provinces were the top two exporters of wheat and its virtual cropland, while Guangdong, Shanghai, and Hainan were main importers of wheat and its virtual cropland. Without wheat stocks and international wheat trade, the annual domestic wheat trade was approximately 19.60 Mt/a in China during the period 2010–2015, accounting for 16.43% of the total national wheat production. Additionally, China presented a net wheat surplus during the previous 3 years, but it annually consumed 8.55 Mt/a of wheat imported from other countries or previous stocks for the last 3 years. Considering the import and export of wheat, the domestic wheat trade in China resulted in cropland savings during the period 2010–2015. However, some domestic trades led to virtual wheat cropland loss, such as the wheat trade from Hubei to Shanghai. Some provinces such as Shandong, Hebei, and Sichuan turned from wheat net exporters in 2010 to wheat net importers in 2015, resulting in a decrease in virtual cropland saving. National agricultural policies and regional economic development can influence the domestic wheat trade and its associated virtual cropland flows. Therefore, further research should be conducted on how to balance economic development and food production in the future.

Author Contributions

The study was designed and performed by F.L. The data were collected by L.L., Y.Z., J.G., and L.W. The data was analyzed by X.C., J.H., M.Z., Y.Z. and L.Y. The paper was written by X.C., F.L. and X.L. The final checked and revised by X.C., F.L. and X.L. All authors read and approved the final manuscript.

Acknowledgments

This research was supported by the Key Project of China Academic of Sciences (CAS) (ZDBS-SSW-DQC) and the National Key Research and Development Program of China (2018YFA060061).

Conflicts of Interest

The authors declare no conflicts of interest.

References

  1. Zhang, J.; Zhao, N.; Liu, X.; Liu, Y. Global virtual-land flow and saving through international cereal trade. J. Geogr. Sci. 2016, 26, 619–639. [Google Scholar] [CrossRef]
  2. FAO DATASTAT. Available online: http://www.fao.org (accessed on 11 October 2017).
  3. Qiang, W.; Liu, A.; Cheng, S.; Kastner, T.; Xie, G. Agricultural trade and virtual land use: The case of China’s crop trade. Land Use Policy 2013, 33, 141–150. [Google Scholar] [CrossRef]
  4. Fan, Z.; Li, J.; Yue, T. Land-cover changes of biome transition zones in Loess Plateau of China. Ecol. Model. 2013, 252, 129–140. [Google Scholar] [CrossRef]
  5. Chen, H. Current situation of cultivated land protection in China. Leg. Vis. 2016, 7, 97–98. [Google Scholar]
  6. Liu, T.; Yang, D.; Xie, X.; Jiao, Y.; Mao, J. The arable land pollution in China: status, causes and countermeasures. Environ. Sustain. Dev. 2017, 42, 129–132. [Google Scholar]
  7. China Statistical Yearbook; Chinese Statistical Bureau: Beijing, China, 2014.
  8. Gao, F. Soil and water loss: The pain of the earth in China. Environ. Prot. Recycl. Econ. 2010, 30, 32–33. [Google Scholar]
  9. Ouyang, C.; Wu, B. A Review of Soil Conservation Practices on Uplands. J. Yunnan Agric. Univ. (Nat. Sci.) 2017, 32, 718–726. [Google Scholar]
  10. Ma, B.; Zhang, B. Analysis of quantity and contribution of virtual cultivated land in China’s grain foreign trade. Northwest J. Int. Law Bus. 2010, 38, 115–126. [Google Scholar]
  11. State Administration of Grain. China Grain Yearbook; Economy & Management Publishing House: Beijing, China, 2016.
  12. Chapagain, A.K.; Hoekstra, A.Y.; Savenije, H.H.G. Water saving through international trade of agricultural productions. Hydrol. Earth Syst. Sci. Discuss. 2006, 10, 455–468. [Google Scholar] [CrossRef]
  13. Hoekstra, A.Y.; Chapagain, A.K. Globalization of water: Sharing the planet’s freshwater resources. Water Encycl. 2008. [Google Scholar] [CrossRef]
  14. Fader, M.; Gerten, D.; Thammer, M.; Heinke, J.; Lotze-Campen, H.; Lucht, W.; Cramer, W. Internal and external green-blue agricultural water footprints of nations, and related water and land savings through trade. Hydrol. Earth Syst. Sci. 2011, 15, 1641–1660. [Google Scholar] [CrossRef] [Green Version]
  15. Chapagain, A.K.; Hoekstra, A.Y. Virtual water trade: A quantification of virtual water flows between nations in relation to international crop trade. J. Org. Chem. 2002, 11, 835–855. [Google Scholar]
  16. Yan, L.; Cheng, S.; Min, Q.W. Virtual farmland resources flow and its impact on south corn transportation. J. Grad. Sch. Chin. Acad. Sci. 2006, 23, 342–348. [Google Scholar]
  17. Würtenberger, L.; Koellner, T.; Binder, C.R. Virtual land use and agricultural trade: Estimating environmental and socio-economic impacts. Ecol. Econ. 2006, 57, 679–697. [Google Scholar] [CrossRef]
  18. Kastner, T.; Kastner, M.; Nonhebel, S. Tracing distant environmental impacts of agricultural products from a consumer perspective. Ecol. Econ. 2011, 70, 1032–1040. [Google Scholar] [CrossRef]
  19. Zhuo, L.; Mekonnen, M.M.; Hoekstra, A.Y. The effect of inter-annual variability of consumption, production, trade and climate on crop-related green and blue water footprints and inter-regional virtual water trade: A study for China (1978–2008). Water Res. 2016, 94, 73–85. [Google Scholar] [CrossRef] [PubMed]
  20. Qu, S.; Yang, Z. Dynamic readjustments to the relations between grain security and China’s farmland: Based on studies of China’s virtual farmland and its trade from 1980 to 2004. Contemp. China Hist. Stud. 2009, 16, 69–75. [Google Scholar]
  21. Chen, G.; Han, M. Virtual land use change in China 2002–2010: Internal transition and trade imbalance. Land Use Policy 2015, 47, 55–65. [Google Scholar] [CrossRef]
  22. Ali, T.; Huang, J.; Wang, J.; Xie, W. Global footprints of water and land resources through China’s food trade. Glob. Food Secur.-Agric. 2017, 12, 139–145. [Google Scholar] [CrossRef]
  23. Han, M.; Chen, G. Global arable land transfers embodied in Mainland China’s foreign trade. Land Use Policy 2018, 70, 521–534. [Google Scholar] [CrossRef]
  24. Ben, P.; Wu, S.; Li, X.; Zhou, S. China’s inter-provincial grain trade and its virtual cultivated land flow simulation. Geogr. Res. 2016, 35, 1447–1456. [Google Scholar]
  25. Harchaoui, S.; Chatzimpiros, P. Reconstructing production efficiency, land use and trade for livestock systems in historical perspective. The case of France, 1961–2010. Land Use Policy 2017, 67, 378–386. [Google Scholar] [CrossRef]
  26. Marselis, S.M.; Feng, K.; Liu, Y.; Teodoro, J.D.; Hubacek, K. Agricultural land displacement and undernourishment. J. Clean. Prod. 2017, 161, 619–628. [Google Scholar] [CrossRef]
  27. Tian, J.; Zhao, N.; Samson, E.L.; He, X.; Wang, S. Circular visualization of virtual-land flows along with international cereal trade. Environ. Plan. A 2017, 49, 2695–2697. [Google Scholar] [CrossRef]
  28. Fu, Z.; Wang, R.; Tang, H. Virtual Land Trade in China’s Grain Trade. Agric. Outlook 2014, 10, 53–57. [Google Scholar]
  29. Li, H.; Hu, Y.; Zou, J.; Yang, Y. Regional grain production and consumption of farmland balance of virtual in China. Resour. Dev. Mark. 2012, 28, 434–437. [Google Scholar]
  30. Gao, S.; Guo, G.; Dai, X. Research of inter-provincial grain transport costs based on GIS network analyst. Logist. Sci-Tech 2014, 37, 135–139. [Google Scholar]
  31. Fischer, G.; Huang, J.; Keyzer, M.A.; Qiu, H.; Sun, L.; Van Veen, W.C.M. China’s Agricultural Prospects and Challenges Report on Scenario Simulations until 2030 with the Chinagro Welfare Model Covering National, Regional and County Level; VU University Amsterdam: Amsterdam, The Netherlands, 2007. [Google Scholar]
  32. Qiu, H.; Huang, J.; Keyzer, M.A.; Van Veen, W.; Rozelle, S.; Fisher, G.; Ermolieeva, T. Biofuel development, food security and the use of marginal land in China. J. Environ. Qual. 2011, 40, 1058–1067. [Google Scholar] [CrossRef] [PubMed]
  33. Xue, S. Study on the Coupling Relationship between Land Use Change and Social Economic-Development in Harbin City. Ph.D. Thesis, Northeast Agricultural University, Harbin, China, 2012. [Google Scholar]
  34. Xie, C.; Zhao, W.; Xu, H.; An, Y. The relationship between world food consumption and economic development. World Agric. 2012, 10, 1–7. [Google Scholar]
  35. Zhang, S.; Li, S. Evolution trend, characteristics and outlook of the inter-provincial trade in China: From 1987 to 2007. Financ. Trade Econ. 2013, 10, 100–107. [Google Scholar]
Figure 1. Wheat production and consumption in China for the period 2010–2015.
Sustainability 10 01459 g001
Figure 2. The annual wheat production and yields for 31 provinces during the period 2010–2015.
Sustainability 10 01459 g002
Figure 3. The annual average of wheat consumption for 31 provinces during the period 2010–2015.
Sustainability 10 01459 g003
Figure 4. The domestic wheat consumption in China for the years 2010 and 2015.
Sustainability 10 01459 g004
Figure 5. Domestic transfer of virtual wheat cropland in 2010 (unit: 103 ha/a).
Sustainability 10 01459 g005
Figure 6. Domestic transfer of virtual wheat cropland in 2015 (unit: 103 ha/a).
Sustainability 10 01459 g006
Figure 7. The relationship between GDP per capita and the net virtual wheat cropland transfer.
Sustainability 10 01459 g007
Table 1. The wheat cropland savings due to domestic wheat trade in China (unit: Mha/a).
Year201020112012201320142015Average
Wheat cropland saving3.193.594.561.281.571.522.62

