1. Introduction
Eco-friendly products consist of safe materials and non-toxic ingredients that can be reused and have no negative effect on the ecology or the environment during production, manufacture, installation, and post usage [
1]. Companies are motivated to produce the eco-friendly product because of the arising global environmental issues in recent decades. Many business processes produce pollutants and consume natural resources. This situation is pernicious and damaging to the earth [
2]. Eco-products usually have an identifying label. This label shows that the products were made with respect to the environmental sustainability aspects. This label helps consumers to recognize the environmentally friendly products [
3]. The concept of ecolabel program was firstly initiated by Germany in 1977 [
4], followed by Canada, Japan, Nordic regions (Sweden, Norway, Finland, Denmark, and Iceland), the United States, New Zealand, Austria, and, more recently, China, India, Thailand, Africa, and Indonesia [
5,
6].
Research created environmentally friendly products as an attempt to solve environmental problems. Some studies about waste treatment technology [
7,
8], recycling technology [
9,
10], or alternatives to non-renewable raw materials [
1,
11] involved environmentally friendly products. It is critical for consumers to recognize the environmentally friendly product using ecolabel. Thus, they will be able to participate in the attempt to support the environment. In particular, this research utilized the behavioral theory for analysis.
The theory of planned behavior (TPB) is a widely used theory to predict intention and behavior over the past twenty years [
12]. TPB has been applied to study environmentally friendly behavior across countries. Gao et al. [
13] studied 26 articles of hospitality journals to identify the relationship of consumers’ perceptions and their green behaviors. They found that there is strong positive correlation between both factors. Scalco et al. [
14] reviewed 23 different studies that applied the TPB to identify the sustainable purchase of consumer towards the organic food. They concluded that the attitude of the individual has the most critical influence to shape the buying intention. Lanzini and Khan [
15] reviewed 58 primary studies to identify the relevant predictor on the consumer preference on cars or other alternative environmentally-friendly mode of transport. They found that there is a relevant role of environmental variable to shape the intention toward the behavior of choosing the travel mode. The previously mentioned studies proved that TPB is applicable to identify the consumers’ intention to use the green products.
Meike and Grinstein [
16] reviewed 66 articles from 28 countries about the application of TPB in studying the environmental behavior. They found that developed countries have more tendency for the intention to behave environmentally and to materialize the actual behavior, compared to the less developed countries. Mancha and Yoder [
17] used bi-national sample to evaluate the environmental TPB. They suggested the cultural affluence as important consideration in environmental TPB. Moreover, according to Rahbar and Wahid [
18], the cultural difference influences the consumer understanding of the ecolabel product. Culture is a critical factor that determines people behavior [
19,
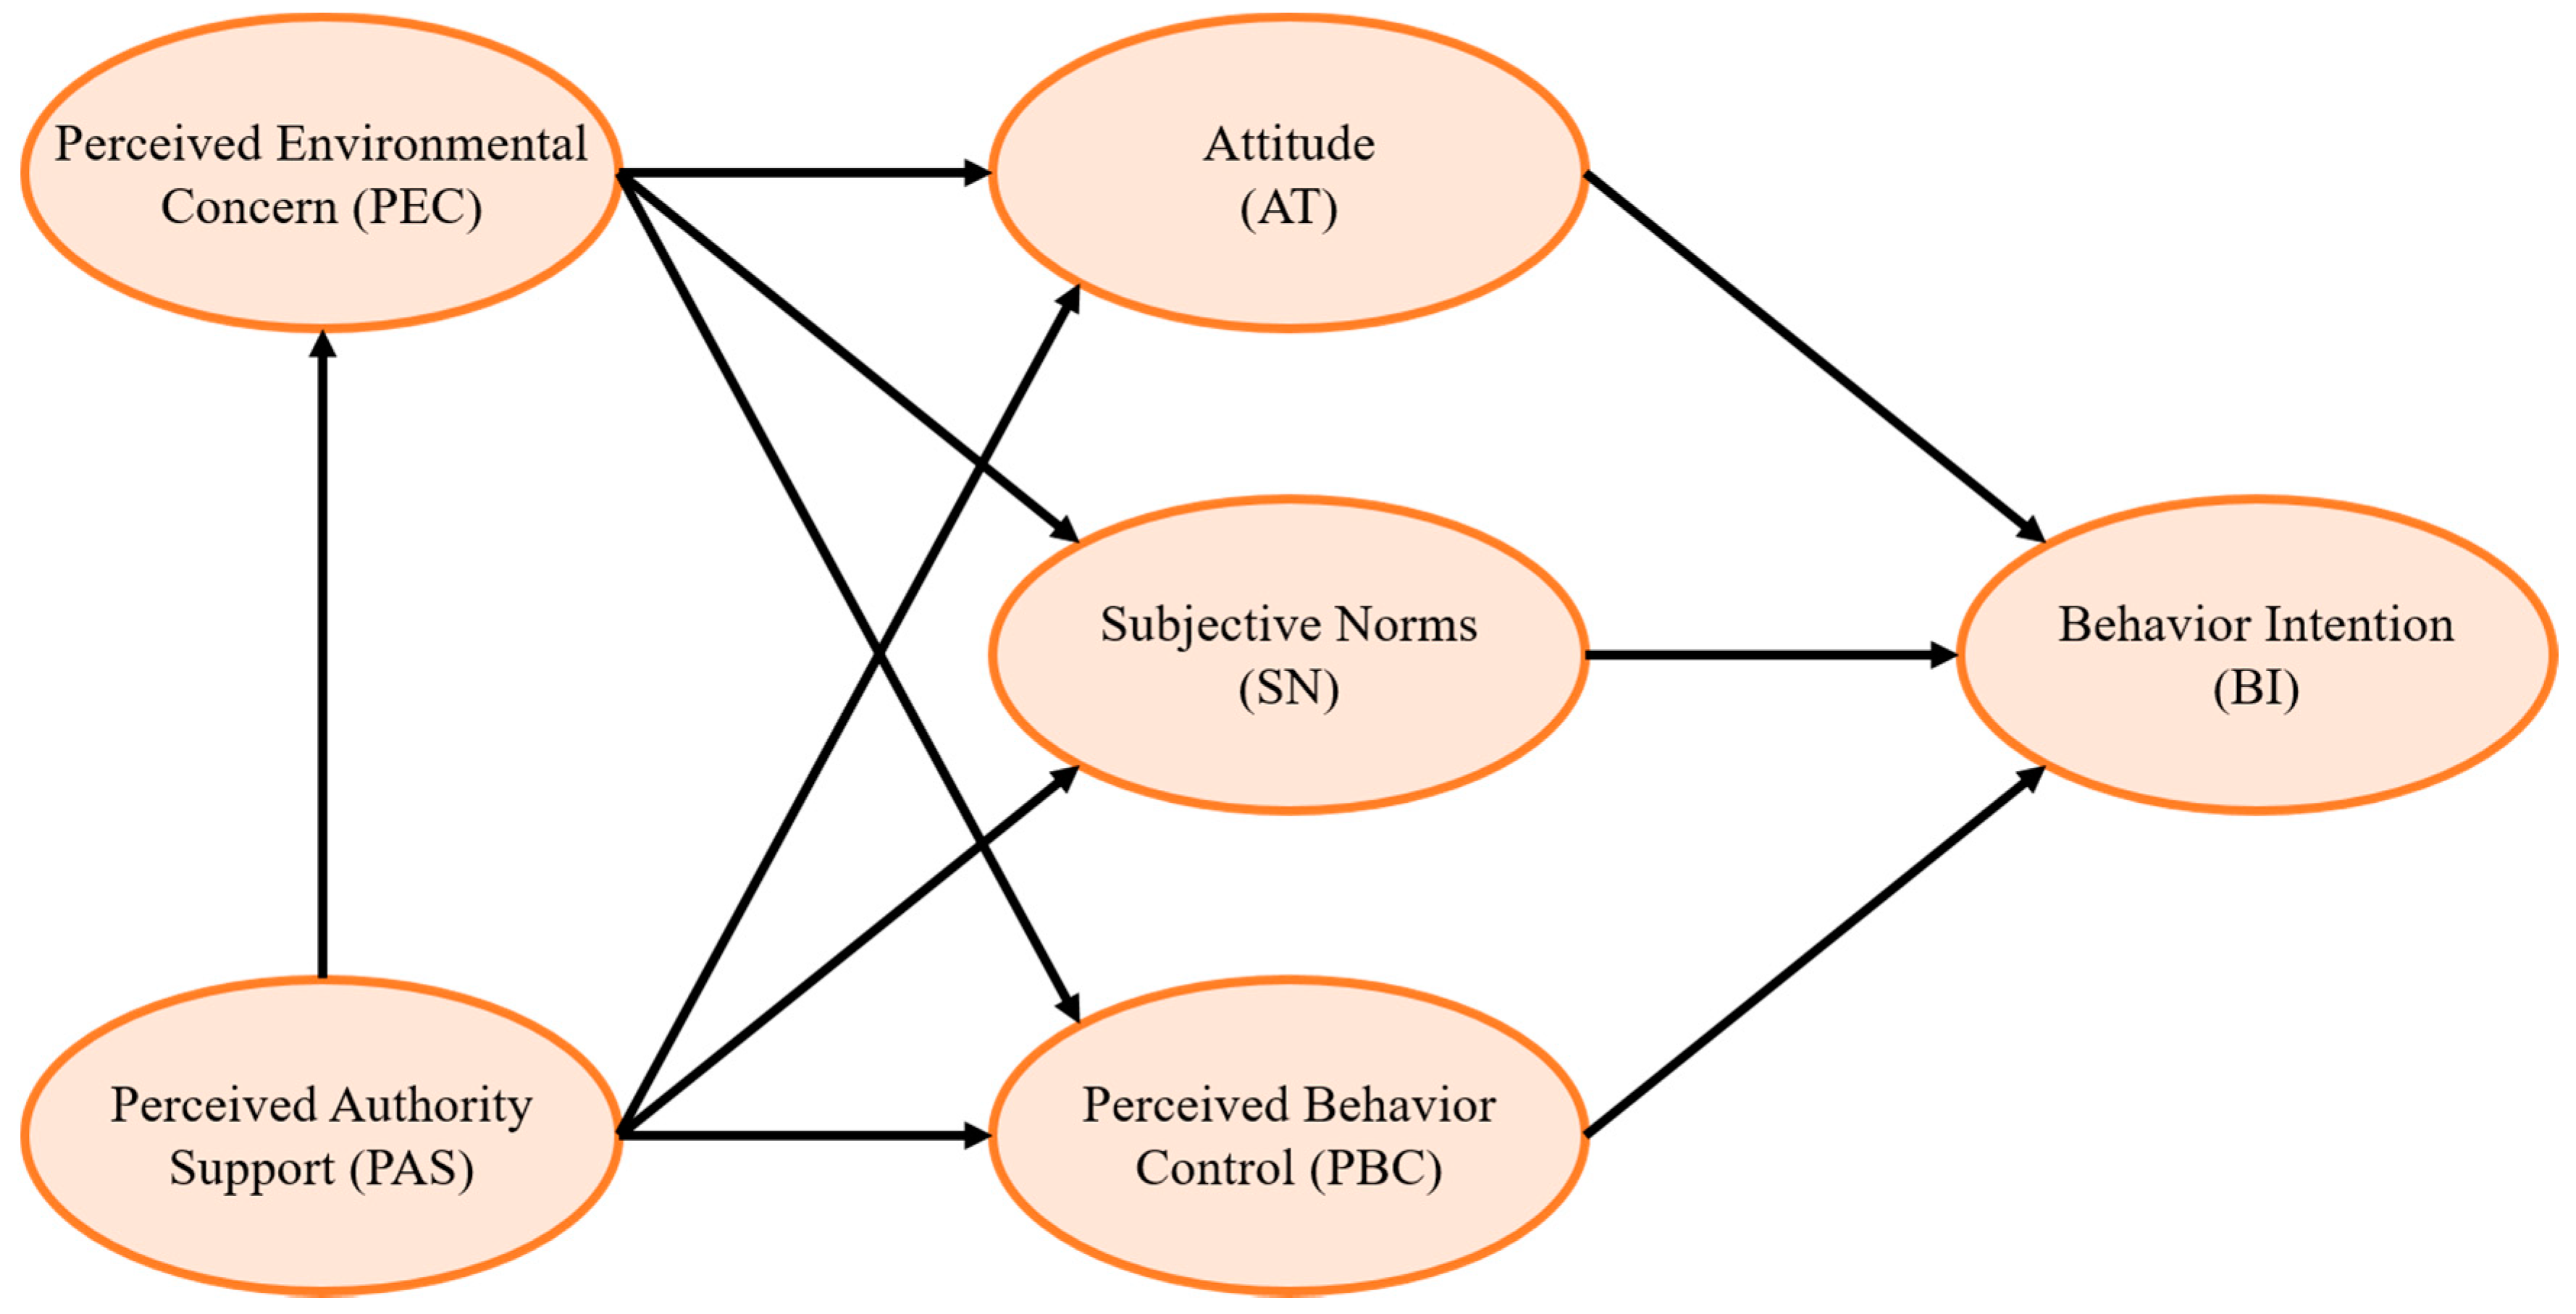
20]. Previously mentioned studies motivated this present study to use two different regions (developed region and developing region) as the study object to further compare the model result of those two regions. This was the first attempt to investigate the use of ecolabel for citizens’ behavior intention in developed and developing regions using Pro Environmental Planned Behavior (PEPB) model. PEPB is a model developed by Persada [
21], originated from Theory of Planned Behavior (TPB). This research was also a continuation of the research by Nadlifatin et al. [
22], which suggested to explore more on the behavior intention of ecolabel usage with different model as well as to explore a developed region.
Two regions were investigated as the case studies: Taiwan and Indonesia. As a developing region, Indonesia sent many of their workers to Taiwan as developing region. This relation makes the research on both regions quite interesting. Furthermore, the importance of cultural consideration in identifying the consumer behavior [
18,
19,
20] strengthen the criticality of the comparison study between Taiwan and Indonesia on the consumer behavioral intention to use an ecolabel product. The comparison between both regions on the consumer behavioral intention to use the ecolabel product helps both regions conduct cross evaluation towards each other. Thus, they can create more sustained and better cooperation though the ecolabel program to support the environment.
The outcomes of this research are expected to lead to the assessment of the ecolabel from both regions’ consumers point of view and to propose some recommendations to attract consumers to use ecolabel products. Increasing the citizen intention to use ecolabel products is beneficial to increase the target market. It motivates the manufacturers to develop more eco-friendly products to support the environment.
The structure of this article is arranged as follows.
Section 2 explains the theoretical PEPB model, and the ecolabel programs in Taiwan and Indonesia. Several hypotheses are made in this section.
Section 3 describes the research methodology, including how the data were gathered and analyzed.
Section 4 covers the data analysis, result, and discussion.
Section 5 concludes the study with some recommendations and limitations for further research consideration.
3. Methodology
The design of this research was the Confirmatory Factor Analysis (CFA) to justify the correlation in PEPB model. The covariance-based (CB) Structural Equation modeling was conducted using AMOS (Analysis of Moment Structure) software [
55]. In CFA, a model that has been developed based on theory or the findings of the past can be tested against empirical data [
56]. The correlation proposed in this study was based on six factors: PAS, PEC, AT, SN, PBC, and BI. In the model, BI is a representation as well as target of analysis to understand the characteristics of intention in ecolabel product usage. The questionnaire contained two parts. In the first part, 18 questions were prepared, where three questions were designed for each factor (
Table 2). The questions used a five-point Likert scale, ranging from “I strongly disagree” to “I strongly agree”. The second part of the questionnaire consisted of background information such as age and gender. Online and paper-based questionnaires were used to collect the data. The questionnaire was distributed over twelve months, from January to December 2016. The sampling methods used was the non-probability sampling, specifically the purposive sampling and the convenience sampling, by determining the specific sample on the basis of relevance (the full right contribute as citizen) and the first to hand respondent during the time span [
57]. The citizens of Indonesia, which have a minimum age of 17, were targeted as a respondent. This age is considered by the law and the constitution as citizens who have full rights to aspirate and contribute to legal action. To compare using the same conditions, we also applied this minimum age to respondents in Taiwan. SPSS and AMOS 20 were utilized as the tool for analysis.
4. Analysis Result
4.1. Data Analysis
Our questionnaire was distributed from January to December 2016. During the time, 172 questionnaires from Taiwan and 210 questionnaires from Indonesia were collected and used for analysis. An illustration representing the respondent demographic percentages is shown in
Table 3.
Table 3 illustrates the working status, the range of age, and the gender of the respondents in Taiwan and Indonesia. The majority of respondents were non-working. In terms of their age, most respondents were 20–30 years old. Most respondent from Taiwan were male (55 percent). On the other hand, most respondent from Indonesia were females (62 percent). The data from Taiwanese questionnaires have an average range of 3.113–4.121, which is the range of neutral answer to agreement answer. On the other hand, the data from Indonesian questionnaires have an average range of 2.995–4.252. It reveals that respondents agree about the importance of seven factors in ecolabel product usage. Respondent’s descriptive and reliability statistics are shown in
Table 4.
The foremost step that must be performed prior to Structural Equation Modeling (SEM) is a reliability analysis. In the analysis about the behavioral model, Cronbach’s α is the most widely used index of the internal consistency reliability of a set of scale or test items [
58,
59,
60]. Meanwhile, to analyze the reliability and convergent validity, Factor Loading (FL), Composite Reliability (CR) [
61,
62] and Average Variance Extracted (AVE) [
63] were used. Factor loadings are a way to understand the role of each item in defining a factor [
64]. CR is a measure of the overall reliability of a collection of items that form the latent variables by considering factor loading perspective [
62]. AVE measures the degree of variance captured by construct or versus the level due to measurement error. For Factor Loading, CR, and Cronbach’s α, a value above 0.7 is acceptable [
65,
66,
67,
68]. For AVE, a value above 0.7 is considered very good, whereas the value of 0.5 is acceptable [
69] (
Table 4).
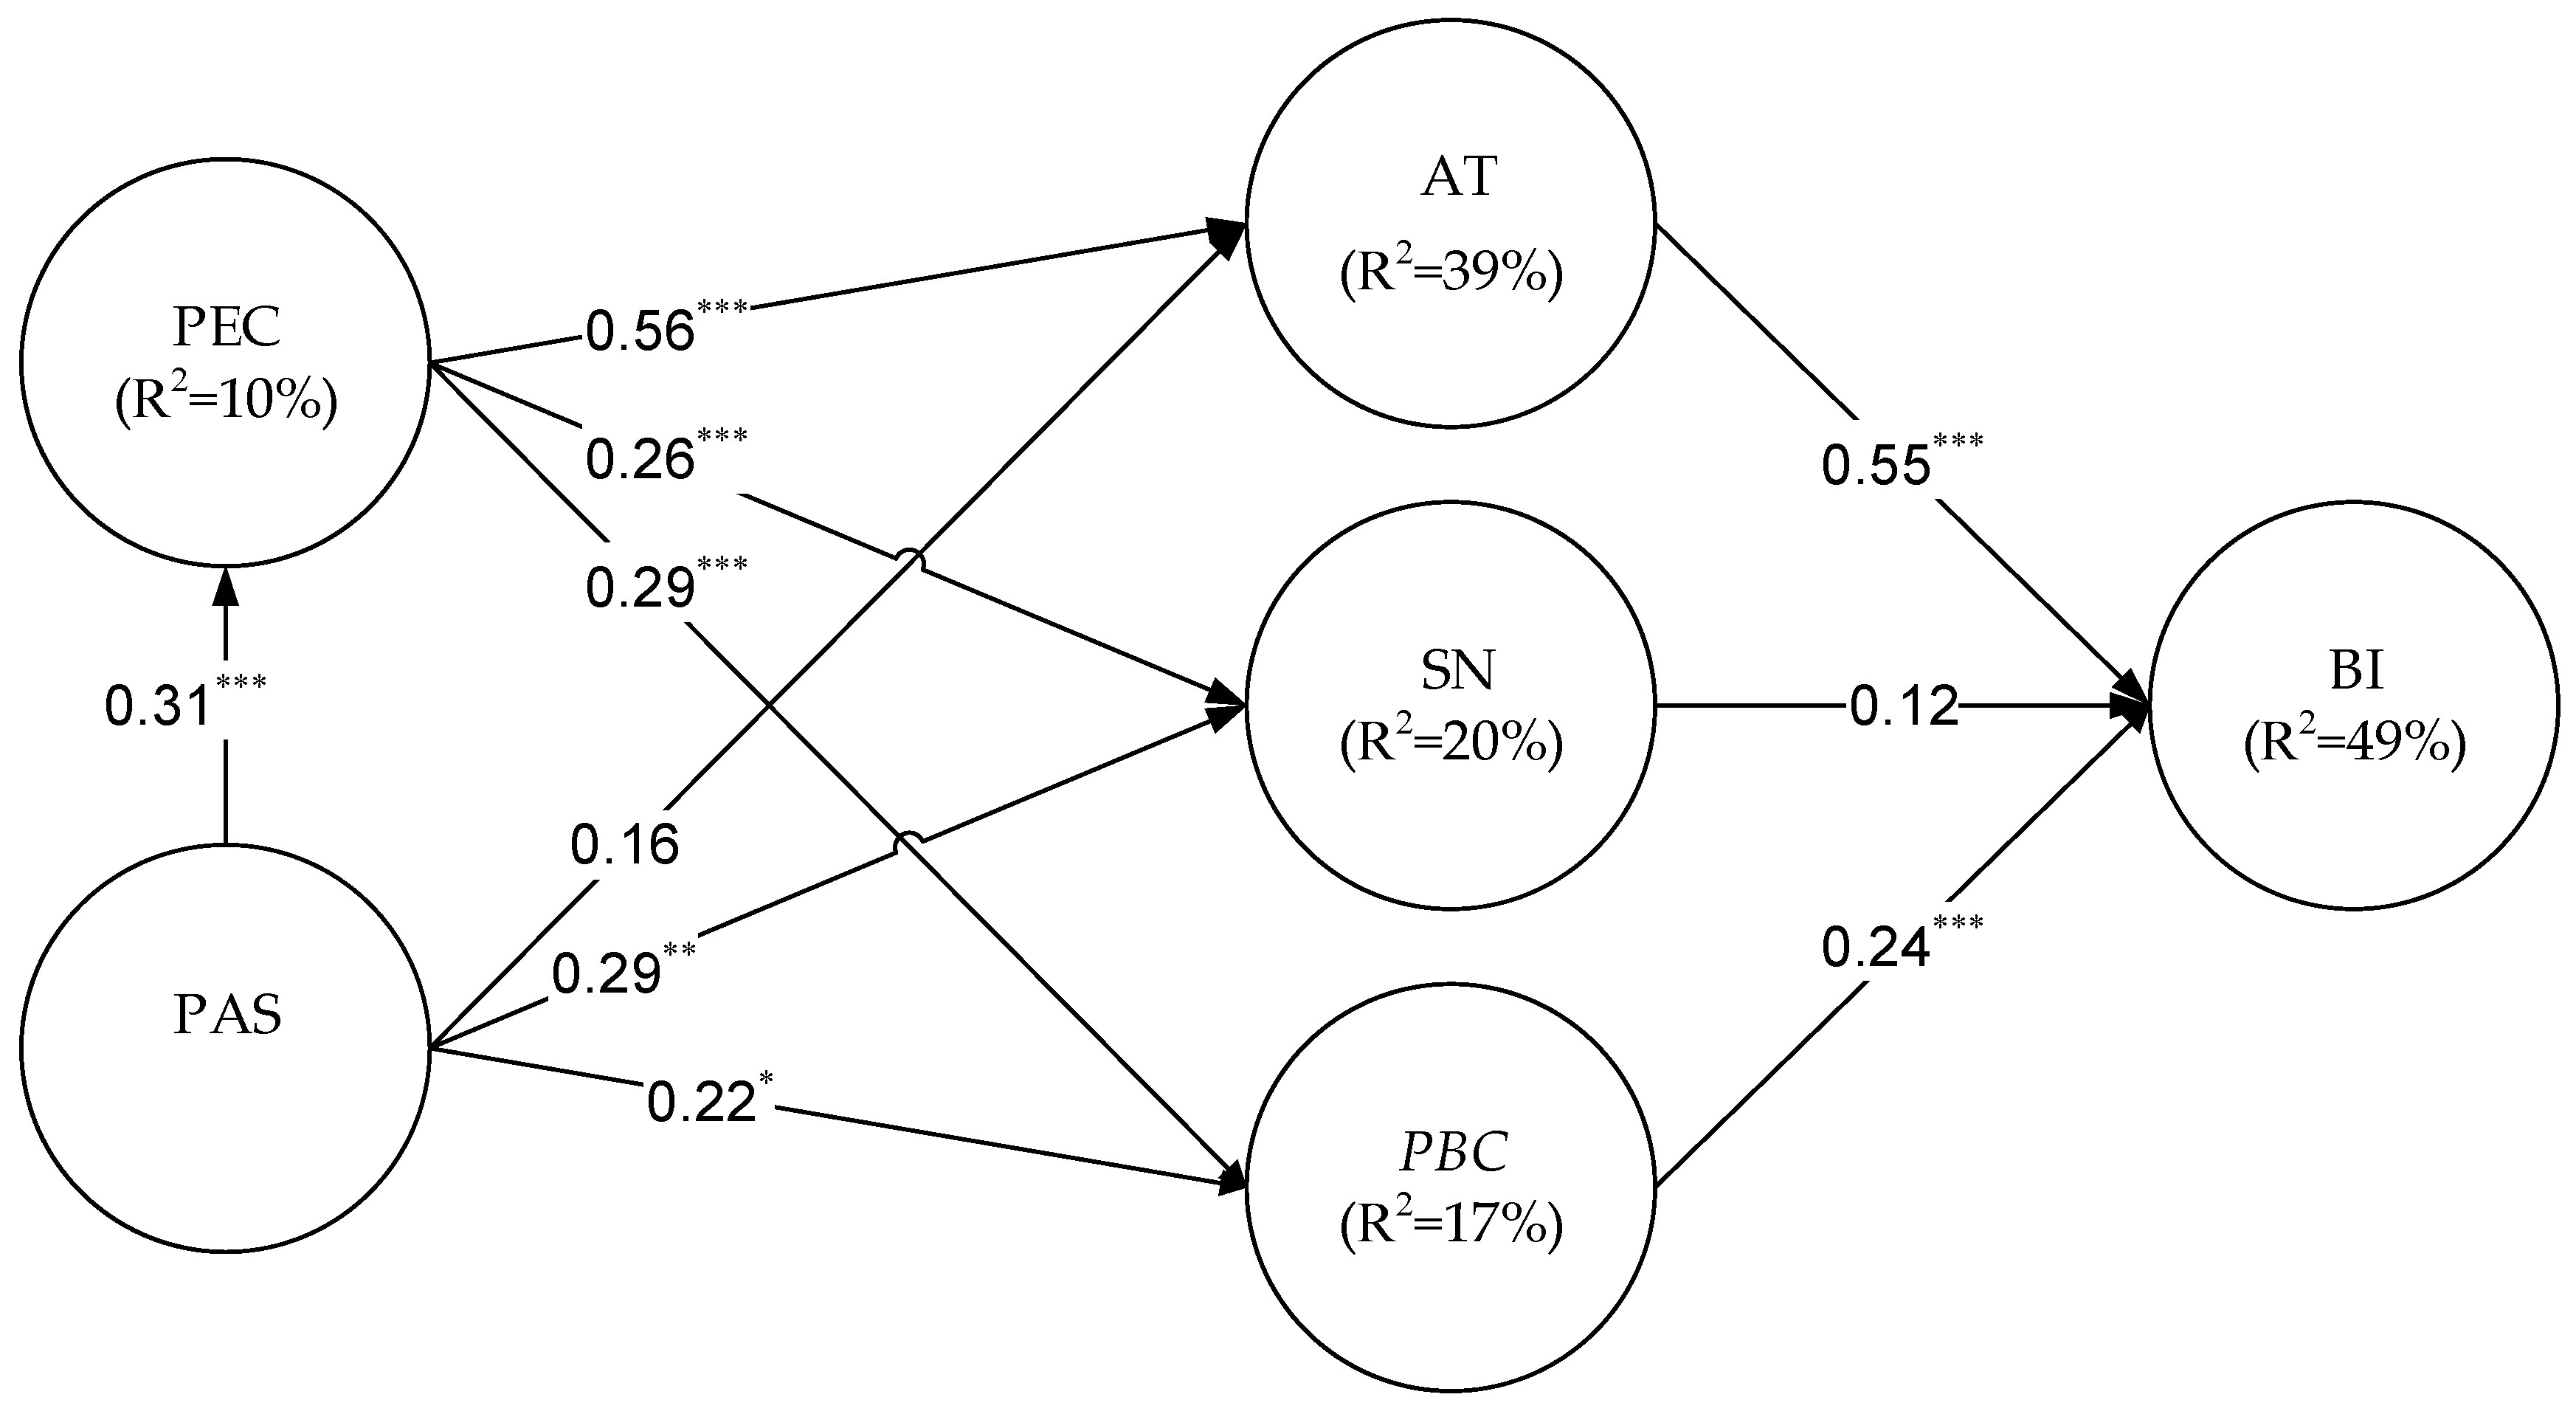
SEM was performed to test the proposed hypotheses with AMOS 20, and the results are presented in
Figure 3 and
Figure 4. Twenty correlation lines are determined for both regions based on the proposed hypotheses. The results of the validation of the hypotheses are shown in
Table 5.
In
Table 5, we can see that our hypotheses were proven to have positive path correlations. Based on
Figure 3 (Taiwan) and
Figure 4 (Indonesia), the key determinant factor is given to AT because it has the highest direct correlation value towards BI. To know the significant correlation between each factor, direct significance measurements were performed.
Table 5 shows that sixteen hypotheses have been proven to have positive and significant path correlation. The table also shows that there are four insignificant correlation factors. The significance correlation indicates that our proposed model is robust [
70] and has appropriate inter correlation within each factor. To prove the validity of our proposed conceptual model, we performed a model fit analysis. The model fit is an assessment based on several parameters to assess that the model is strong. In this study, the fit model used refers to Hair et al. [
71] consisting of the
X2 value and the associated df; one absolute fit index (i.e., GFI, RMSEA, or SRMR); one incremental fit index (i.e., CFI or TLI); one goodness-of-fit index (GFI, CFI, TLI, etc.); and one badness-of-fit index (RMSEA, SRMR, etc.). We performed a model fit test by following the model fit parameters from previous similar studies. All of the model fit parameters exceed the value of the minimum threshold (
Table 6). These findings confirmed that the proposed model is appropriate (fit model). In our study, BI has 49% value for Taiwan case (
Figure 3) and 72% for Indonesia case (
Figure 4), which means that the predictors of Behavior Intention explain 49% of its variance for Taiwan case and explain 72% of its variance for Indonesia case. In other words, the error variance or unidentified factors is approximately 51% for Taiwan and 28% for Indonesia case.
4.2. Discussion
The results of this research show that the Pro-Environmental Planned Behavior (PEPB) model validates most of the proposed positive correlation, except the correlation between PAS (Taiwan) and AT (Taiwan); SN (Taiwan) and BI (Taiwan); PAS (Indonesia) and AT (Indonesia); and SN (Indonesia) to BI (Indonesia). Sixteen of twenty correlations have positive and significant values.
The first correlation between PAS and PEC (βPAS(T) → PEC = 0.312) and (βPAS(I) → PEC = 0.562) describes the degree of authority and related agencies role in affecting citizens’ environmental concern. Both Taiwanese and Indonesian authorities realize that it is important to encourage citizens’ environmental concern. Consequently, both Taiwanese and Indonesian citizens perceived support from the authority. The result of Taiwan case shows medium influence given by the government, while Indonesia shows strong influence. For Taiwan case, because Taiwan has been adopting the ecolabel concept for more two decades, many companies change their product into ecofriendly products. Therefore, supports such as subsidy or reward are used by many companies, which reduced the proportion for each company and it affect the total production cost that is charged to customer. The customer consequently does not get much benefit from it. This situation can be seen as the challenge for Taiwan authority support to develop a proper strategy to ensure citizens get more benefit. For Indonesia case, since the implementation of ecolabel product is less than a decade old, the application is relatively new. Few companies use the support from the authority to their business process, and supports are used only for few manufacturing companies. The manufacturing companies, who made the ecofriendly product, charge a little because of the support from the authority holder. Thus, citizens get much more benefit from the authority support.
The next correlation is between PAS and AT (βPAS(T) → AT = 0.162) and (βPAS(I) → AT = 0.057). Both Taiwanese and Indonesian citizens, in this exploration study, felt that there is no significant effect. They felt that the authority support is not providing a significant contribution in this part. From PAS to SN (βPAS(T) → SN = 0.292; βPAS(I) → SN = 0.383) and from PAS to PBC (βPAS(T) → PBC = 0.223; βPAS(I) → PBC= 0.475), the citizens get moderate influence. This condition can be seen by the policy maker to prepare some strategies that can increase positive influence of citizens AT, SN and PBC. The strategies can be informed as direct reward or appreciation to customer.
In the global world, people are perceived positively on their attitude matters from environmental concern. Thus, it can be seen in both Taiwan and Indonesia cases that they have significant correlations between PEC and AT (βPEC(T) → AT = 0.557; βPEC(I) → AT = 0.742). This research found that there is a significant influence between PEC and SN in both Taiwan and Indonesia (βPEC(T) → SN = 0.259; βPEC(I) → SN = 0.329). Many reasons can cause this situation, such as different culture and degree of education. The culture of individualism tends to affect the SN value. The degree of education shows a similar result. The following correlation between PEC and PBC (βPEC(T) → PBC = 0.287; βPEC(I) → PBC = 0.289) represents the degree of environmental concern between developed and developing regions.
For the next correlation, AT, SN, PBC and BI are the representation of famous Theory of Planned Behavior (TPB) factor. Many researchers show positive and significant correlations among these factors (βAT(T) → BI = 0.554; βAT(I) → BI = 0.664); (βPBC(T) → BI = 0.243; βPBC(I) → BI = 0.298). Surprisingly, there was an uncommon situation between SN and BI in this research (βSN(T) → BI = 0.117; βSN(I) → BI = 0.014). Apparently, the people who are important to citizens did not contribute a good influence. The SN correlations were not significant. This situation can be seen as an input for policy maker in both developed and developing regions in preparing a proper strategy to encounter this issue. This study found AT as the strongest factor that influences the BI directly in both Taiwan and Indonesia (βAT(T) → BI = 0.554; βAT(I) → BI = 0.664). This situation can be seen as an advantage for the policy maker in both regions. Maintaining and improving the recent strategy can help citizens get a positive perception and use the ecolabel product. Finally, this study found out that the Indonesian respondents show greater behavior intention in using the ecolabel products than Taiwanese respondents. This result is quite surprising because, based on the GDP per capita [
72] Taiwan is better compared to Indonesia. However, this unexpected result was understandable. Although in developed regions the actual pro-environmental behaviors have more tendency to occur compared to less developed regions, in developing regions, the pressure to be “green” grows as the dominant force and becomes as meaningful as social norms [
16]. A possible reason is because the relatively new program attracts the citizens’ intention to know more about the usage of ecolabel products. Taiwan respondents, who perceived the intention to use the ecolabel products longer, may feel less excited than those who newly implemented it. Responding both strongest and weakest factors in this research can help the policy maker as well as the manufacturing companies to better understand the citizens of both regions.
5. Conclusions
The present research used PEPB model to investigate the citizens’ Behavior Intention (BI) regarding the usage of ecolabel products in both developed and developing regions. The PEPB model consists of six factors namely Perceived Authority Support (PAS), Perceived Environmental Concern (PEC), Attitude (AT), Subjective Norms (SN), Perceived Behavior Control (PBC), and Behavioral Intention (BI). The result indicates that AT is the strongest factor and SN is the weakest factor that fundamentally affect the individual BI. The study suggests that maintaining and improving the current strategy can help to impose positive perception about ecolabel products to the public, resulting in increasing consumption on those products.
In summary, the present research confirmed 16 out of 20 hypotheses to have significant and positive values. The present study found that Indonesia respondents show greater behavior intention in using the ecolabel products than Taiwan respondents. Indonesia has greater behavioral intention in using the ecolabel products compared to Taiwan because, as a developing region, Indonesia has more force to go “green”. This is a good chance to promote pro-environmental activity as well as encourage the use of ecolabel products. Increasing citizen’s intentions to use ecolabel products will persuade policy makers and companies to manage a sustainable environment. The end goal for this situation is to minimize or eliminate the negative impacts to the environment. This study, however, has a limitation, which is the number of regions involved. Adding more regions into the equation will produce a more objective result, and this should be considered in further research. Future research should also explore the rest of the population, i.e., the 51% of Taiwanese cases and 28% of Indonesian cases, as to what factors might affect or influence their decisions.


