Trend Analyses of Extreme Precipitation Events in the Yarlung Zangbo River Basin, China Using a High-Resolution Precipitation Product

 , ,
, ,
Abstract
:1. Introduction
2. Data and Methods
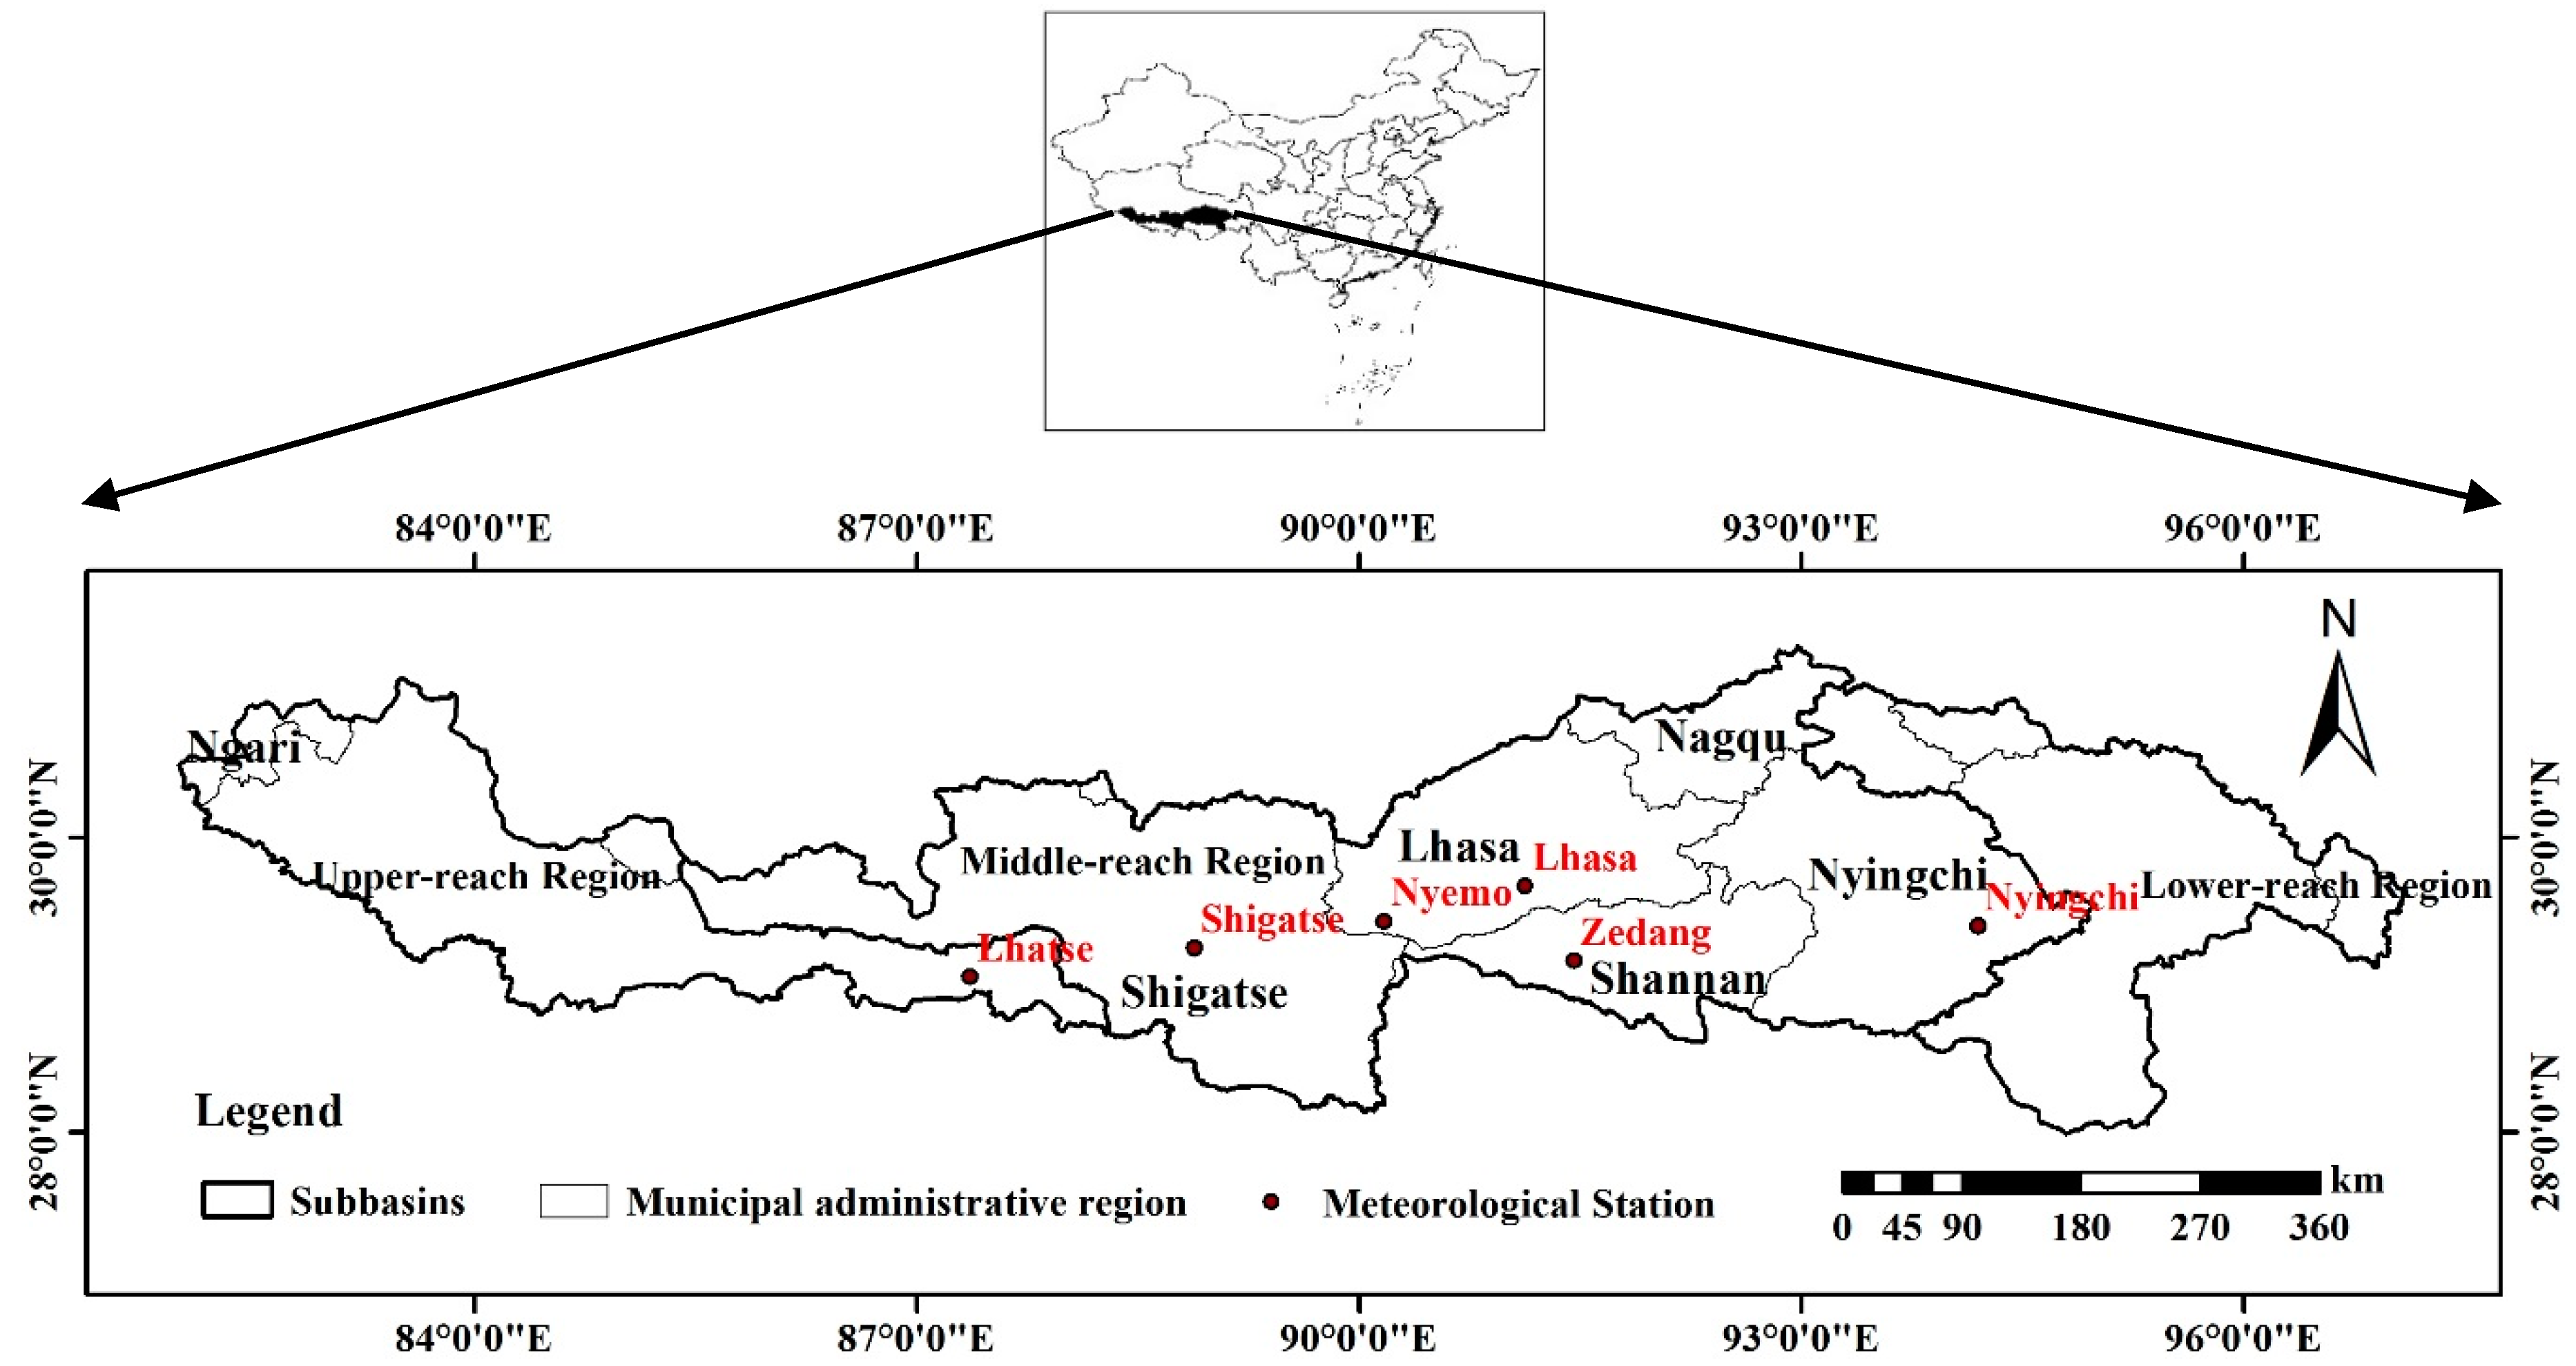
2.1. Study Area
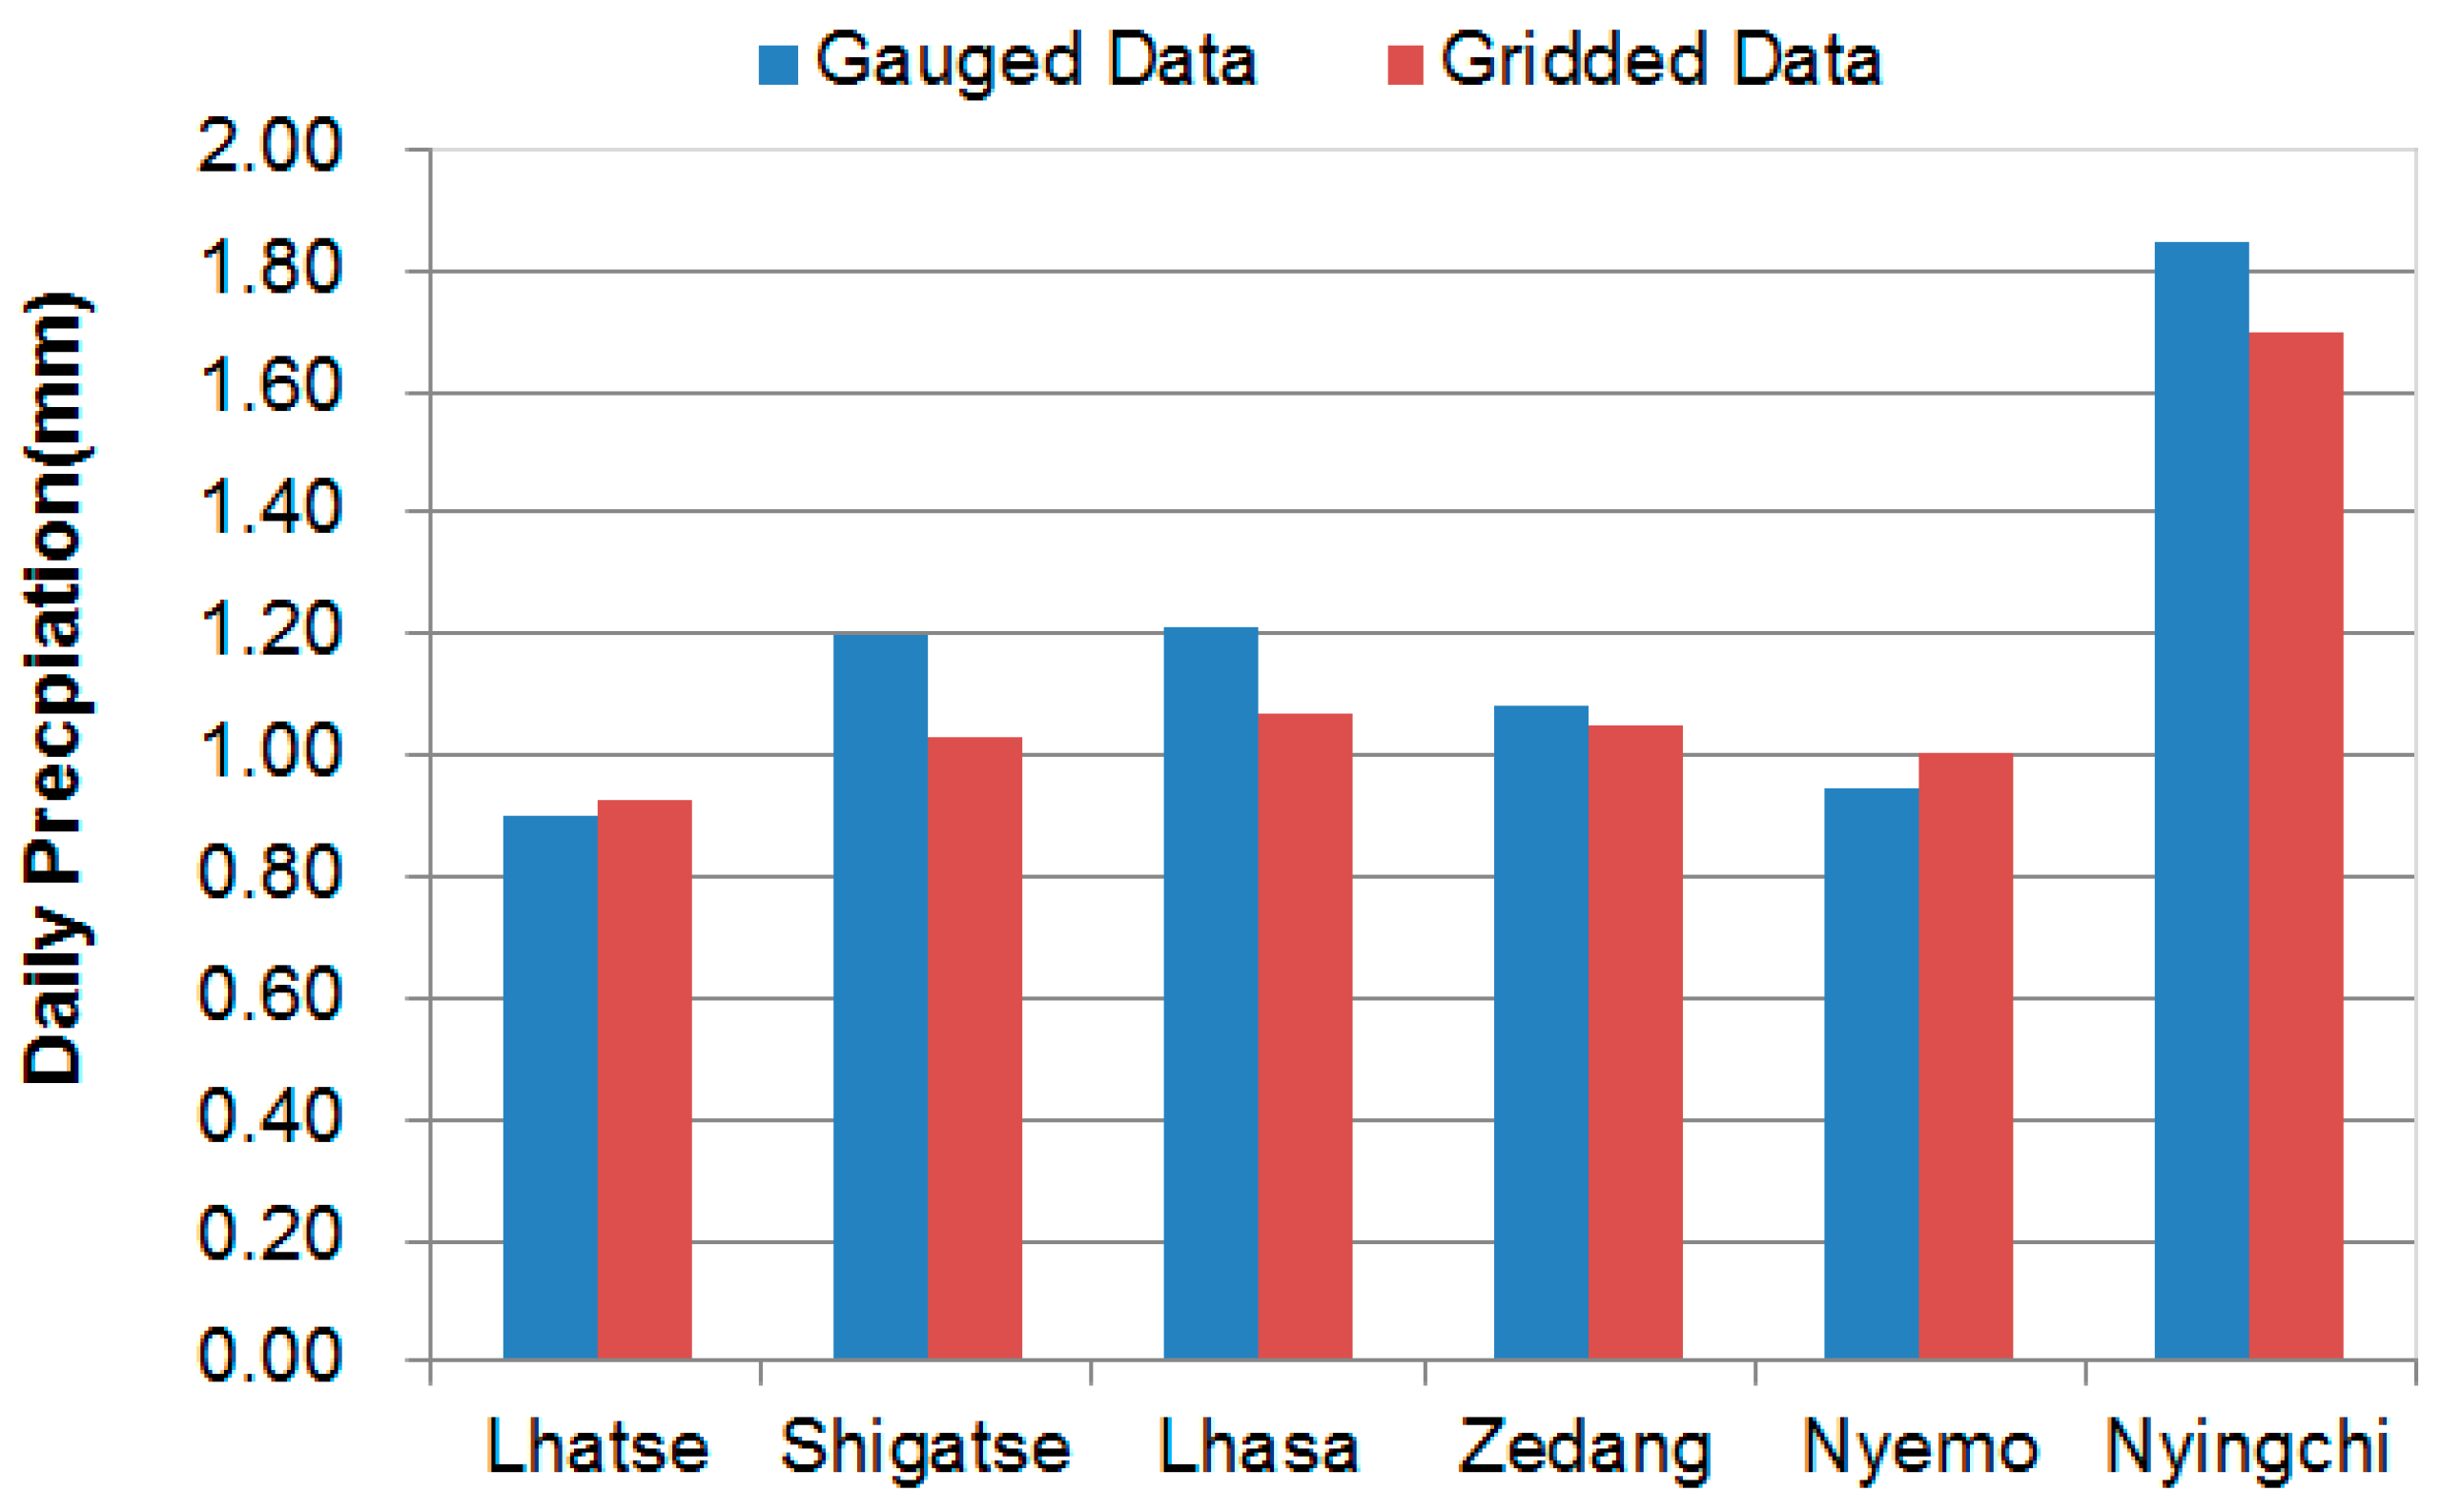
2.2. Data
2.3. General and Extreme Precipitation Indexes
2.4. Methodology
3. Results
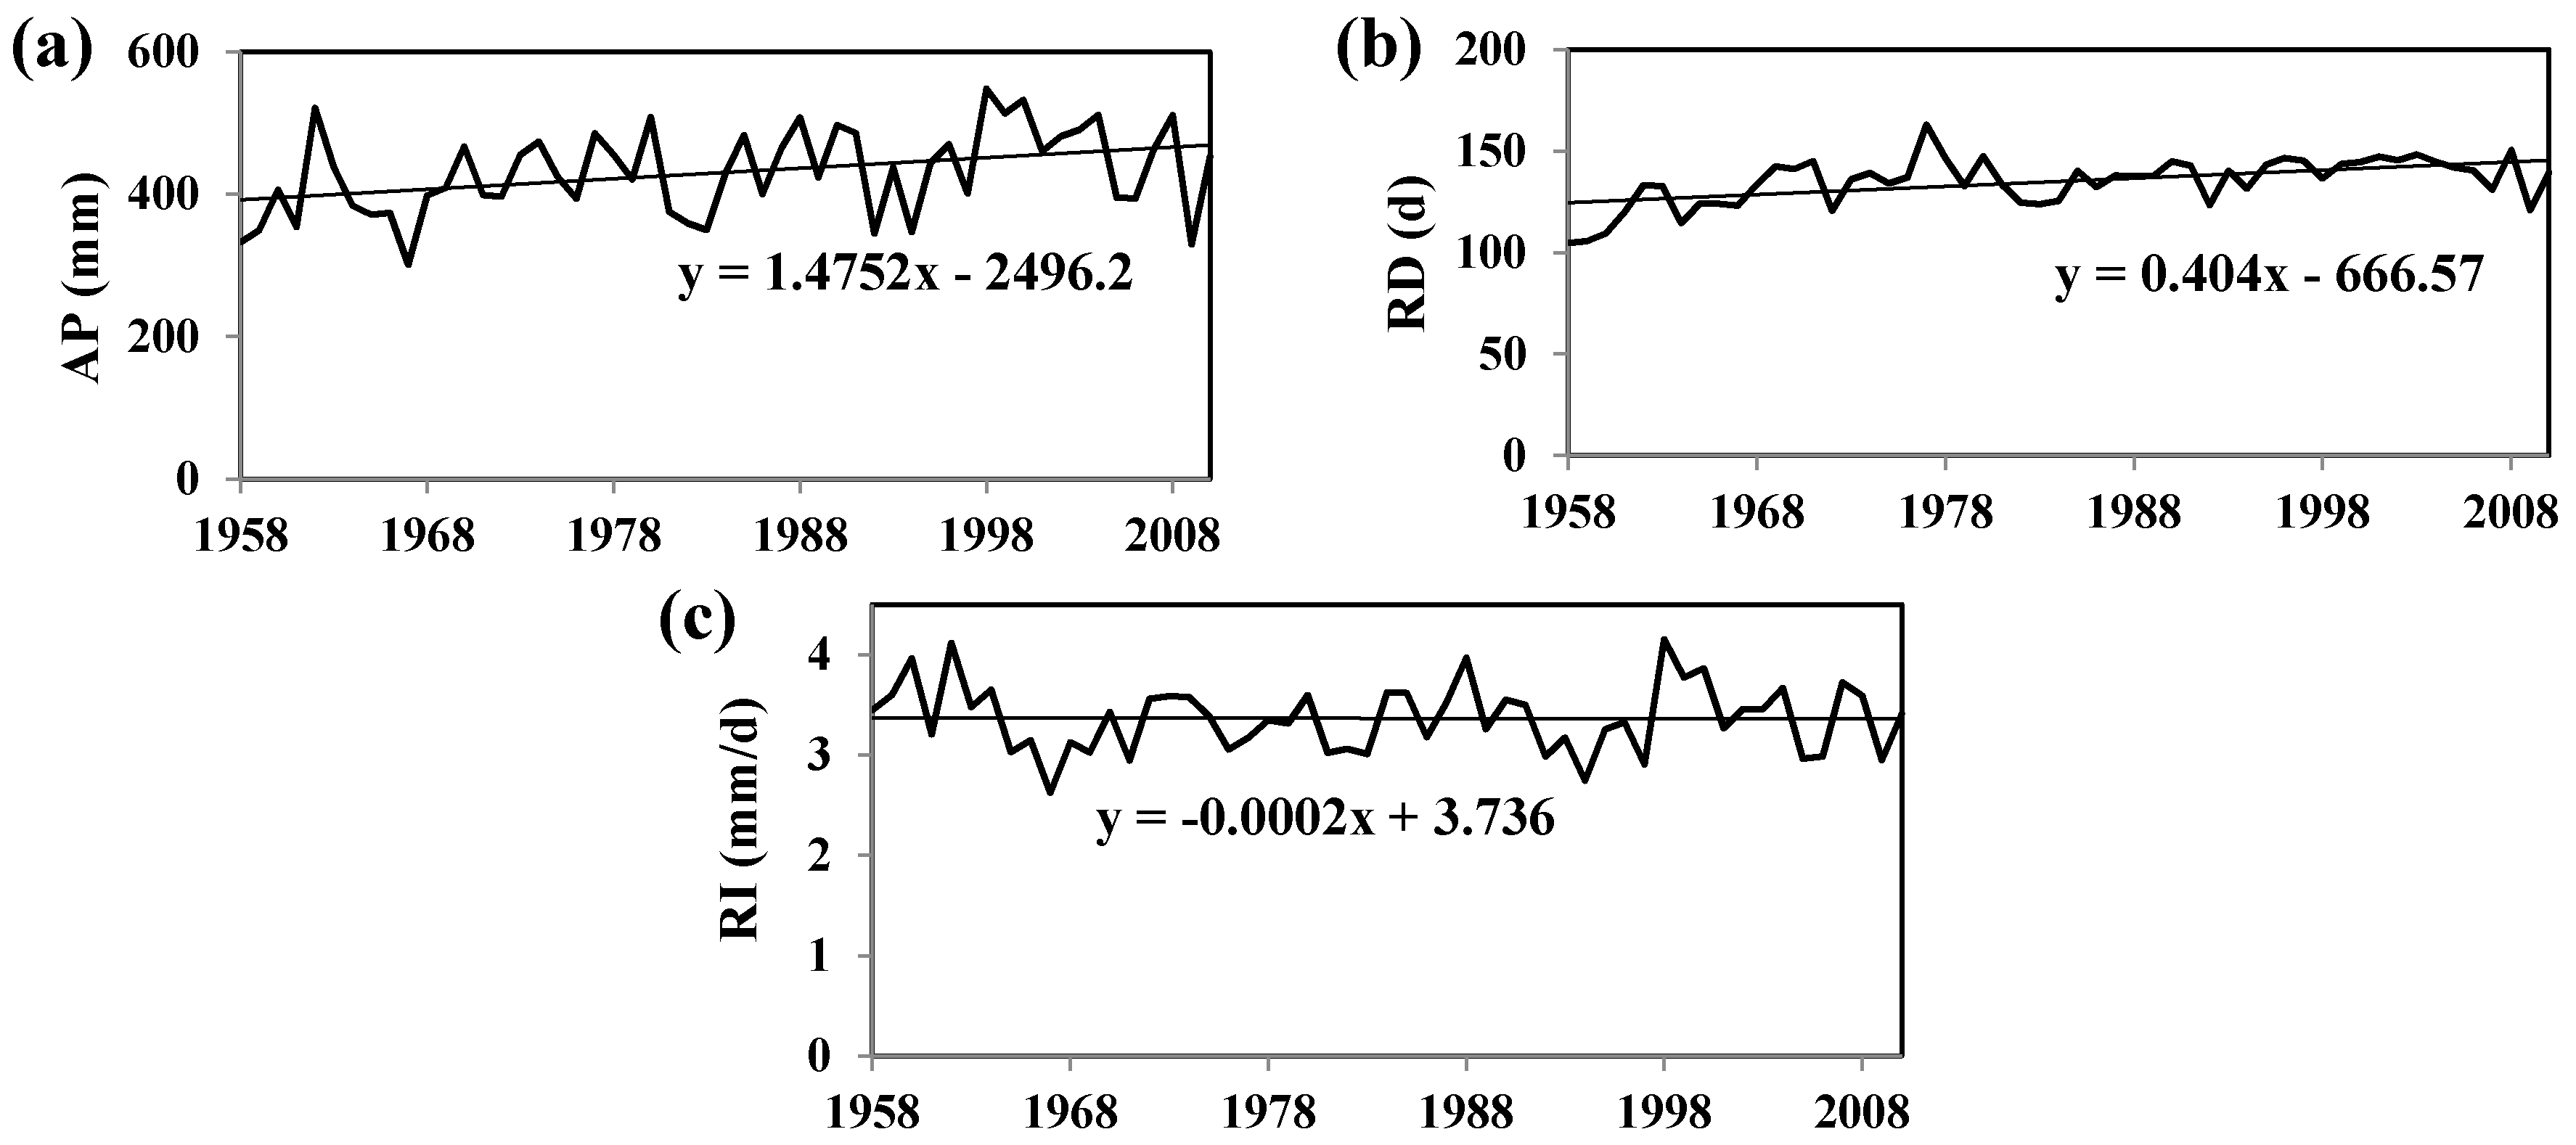
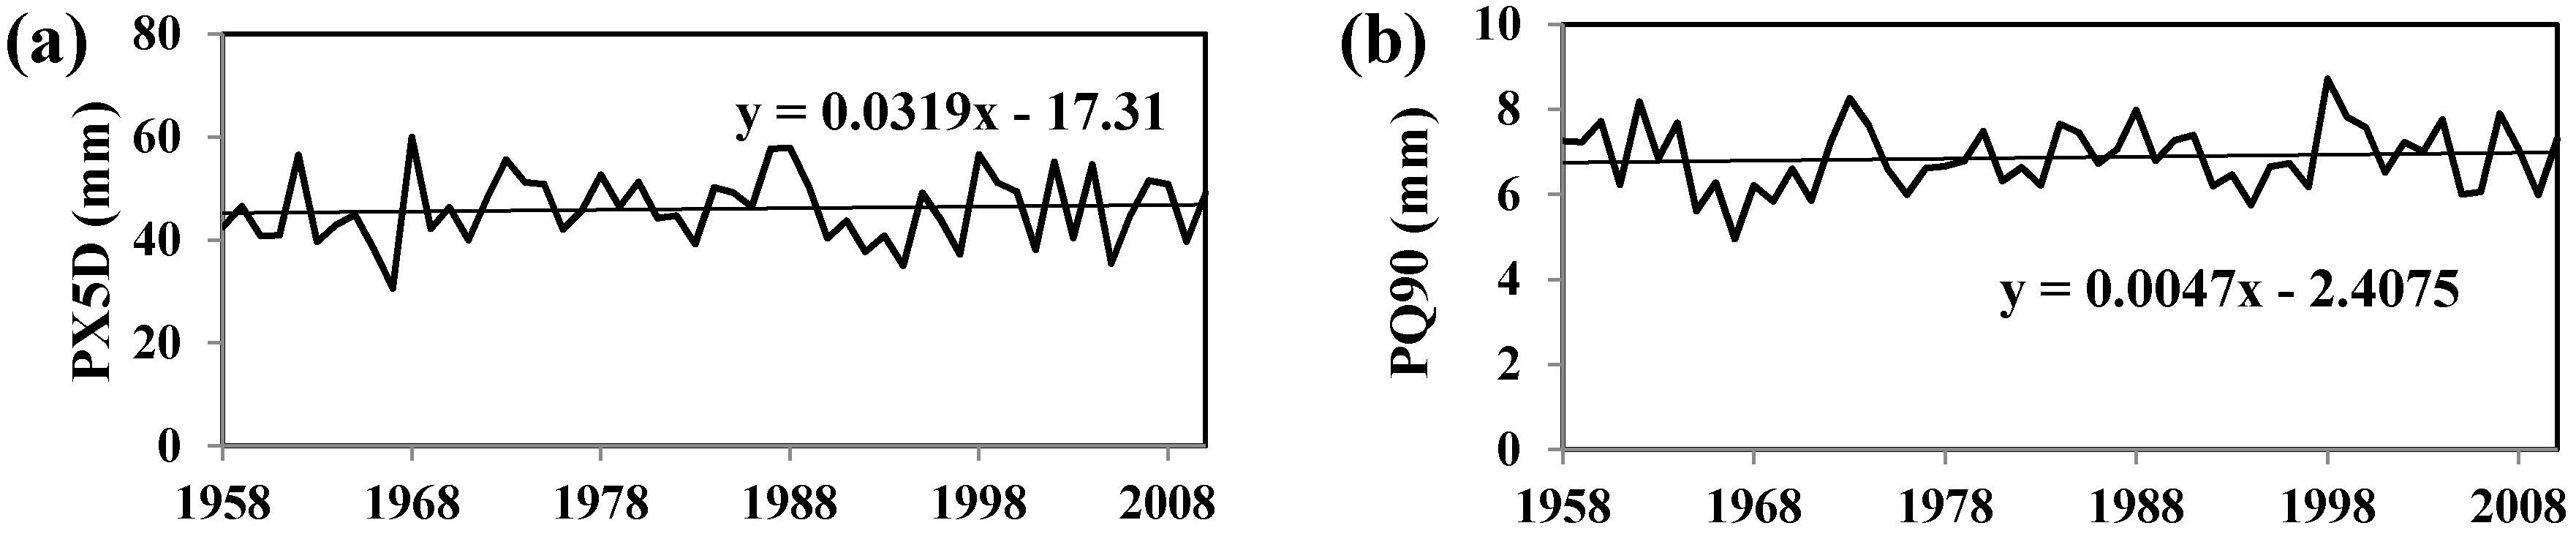
3.1. Changes in AP and EPE at the Basin Scale
3.2. General Precipitation Indexes: Spatial Distribution and Temporal Changes
3.3. Spatial Distribution and Temporal Changes of EPE Indexes
4. Discussion
5. Conclusions
Author Contributions
Acknowledgments
Conflicts of Interest
References
- Stocker, T.F.; Qin, D.; Plattner, G.-K.; Tignor, M.M.B.; Allen, S.K.; Boschung, J.; Nauels, A.; Xia, Y.; Bex, V.; Midgley, P.M. Climate Change 2013—The Physical Science Basis; Cambridge University Press: Cambridge, UK, 2013; ISBN 978-92-9169-138-8. [Google Scholar]
- Aguilar, M.A.; Del Mar Saldana, M.; Aguilar, F.J. Generation and quality assessment of stereo-extracted DSM from GeoEye-1 and WorldView-2 imagery. IEEE Trans. Geosci. Remote Sens. 2014, 52, 1259–1271. [Google Scholar] [CrossRef]
- Iwashima, T.; Yamamoto, Y. Notes and correspondence: A statistical analysis of the extreme events: Long-term trend of heavy daily precipitation. J. Meteorol. Soc. Jpn. Ser. II 1993, 71, 637–640. [Google Scholar] [CrossRef]
- Klein Tank, A.M.G.; Peterson, T.C.; Quadir, D.A.; Dorji, S.; Zou, X.; Tang, H.; Santhosh, K.; Joshi, U.R.; Jaswal, A.K.; Kolli, R.K.; et al. Changes in daily temperature and precipitation extremes in central and south Asia. J. Geophys. Res. 2006, 111, D16105. [Google Scholar] [CrossRef]
- Zolina, O.; Simmer, C.; Gulev, S.K.; Kollet, S. Changing structure of European precipitation: Longer wet periods leading to more abundant rainfalls. Geophys. Res. Lett. 2010, 37. [Google Scholar] [CrossRef]
- Kunkel, K.E.; Easterling, D.R.; Redmond, K.; Hubbard, K. Temporal variations of extreme precipitation events in the United States: 1895–2000. Geophys. Res. Lett. 2003, 30. [Google Scholar] [CrossRef]
- Liu, M.; Xu, X.; Sun, A.Y.; Wang, K.; Liu, W.; Zhang, X. Is southwestern China experiencing more frequent precipitation extremes? Environ. Res. Lett. 2014, 9. [Google Scholar] [CrossRef]
- Li, Z.; He, Y.; Wang, P.; Theakstone, W.H.; An, W.; Wang, X.; Lu, A.; Zhang, W.; Cao, W. Changes of daily climate extremes in southwestern China during 1961–2008. Glob. Planet. Chang. 2012, 80–81, 255–272. [Google Scholar] [CrossRef]
- Li, J.; Zhang, Q.; Chen, Y.D.; Xu, C.Y.; Singh, V.P. Changing spatiotemporal patterns of precipitation extremes in China during 2071-2100 based on Earth System Models. J. Geophys. Res. Atmos. 2013, 118, 12537–12555. [Google Scholar] [CrossRef]
- Zhang, Q.; Sun, P.; Singh, V.P.; Chen, X. Spatial-temporal precipitation changes (1956–2000) and their implications for agriculture in China. Glob. Planet. Chang. 2012, 82–83, 86–95. [Google Scholar] [CrossRef]
- Scholz, G.; Quinton, J.N.; Strauss, P. Soil erosion from sugar beet in Central Europe in response to climate change induced seasonal precipitation variations. Catena 2008, 72, 91–105. [Google Scholar] [CrossRef]
- Zhai, P.; Zhang, X.; Wan, H.; Pan, X. Trends in total precipitation and frequency of daily precipitation extremes over China. J. Clim. 2005, 18, 1096–1108. [Google Scholar] [CrossRef]
- Roy, S.S.; Balling, R.C. Trends in extreme daily precipitation indices in India. Int. J. Climatol. 2004, 24, 457–466. [Google Scholar] [CrossRef]
- Cao, J.; Qin, D.; Kang, E.; Li, Y. River discharge changes in the Qinghai-Tibet Plateau. Chin. Sci. Bull. 2006, 51, 594–600. [Google Scholar] [CrossRef]
- You, Q.; Kang, S.; Wu, Y.; Yan, Y. Climate change over the Yarlung Zangbo River Basin during 1961–2005. J. Geogr. Sci. 2007, 17, 409–420. [Google Scholar] [CrossRef]
- Xu, Z.X.; Gong, T.L.; Li, J.Y. Decadal trend of climate in the Tibetan plateau—Regional temperature and precipitation. Hydrol. Process. 2008, 22, 3056–3065. [Google Scholar] [CrossRef]
- Tong, K.; Su, F.; Yang, D.; Zhang, L.; Hao, Z. Tibetan Plateau precipitation as depicted by gauge observations, reanalyses and satellite retrievals. Int. J. Climatol. 2014, 34, 265–285. [Google Scholar] [CrossRef]
- Liu, Z.; Yao, Z.; Huang, H.; Wu, S.; Liu, G. Land use and climate changes and their impacts on runoff in the Yarlung Zangbo River Basin, China. Land Degrad. Dev. 2014, 25, 203–215. [Google Scholar] [CrossRef]
- Sang, Y.F.; Singh, V.P.; Gong, T.; Xu, K.; Sun, F.; Liu, C.; Liu, W.; Chen, R. Precipitation variability and response to changing climatic condition in the Yarlung Tsangpo River Basin, China. J. Geophys. Res. 2016, 121, 8820–8831. [Google Scholar] [CrossRef]
- Prudhomme, C.; Reed, D.W. Relationships between extreme daily precipitation and topography in a mountainous region: A case study in Scotland. Int. J. Climatol. 1998, 18, 1439–1453. [Google Scholar] [CrossRef]
- Huffman, G.J.; Bolvin, D.T.; Nelkin, E.J.; Wolff, D.B.; Adler, R.F.; Gu, G.; Hong, Y.; Bowman, K.P.; Stocker, E.F. The TRMM Multisatellite Precipitation Analysis (TMPA): Quasi-global, multiyear, combined-sensor precipitation estimates at fine scales. J. Hydrometeorol. 2007, 8, 38–55. [Google Scholar] [CrossRef]
- Al, J.E.T.; Joyce, R.J.; Janowiak, J.E.; Arkin, P.A.; Xie, P. CMORPH: A method that produces global precipitation estimates from passive microwave and infrared data at high spatial and temporal resolution. J. Hydrometeorol. 2004, 5, 487–503. [Google Scholar] [CrossRef]
- Shi, C.; Xie, Z. A time downscaling scheme of precipitation by using geostationary meteorological satellite data. Progress Geogr. 2008, 27, 15–22, (In Chinese with English Abstract). [Google Scholar]
- Pan, Y.; Shen, Y.; Yu, J.; Zhao, P. Analysis of the combined gauge—Satellite hourly precipitation over China based on the OI technique. Acta Meteorol. Sin. 2012, 70, 1381–1389, (In Chinese with English Abstract). [Google Scholar]
- Shen, Y.; Xiong, A.; Wang, Y.; Xie, P. Performance of high-resolution satellite precipitation products over China. J. Geophys. Res. Atmos. 2010, 115. [Google Scholar] [CrossRef]
- Guo, H.; Chen, S.; Bao, A.; Hu, J.; Yang, B.; Stepanian, P.M. Comprehensive evaluation of high-resolution satellite-based precipitation products over China. Atmosphere 2016, 7, 6. [Google Scholar] [CrossRef]
- Dong, L.; Zhang, M.; Wang, S.; Zhu, X.; Ren, Z.; Wang, Q. Extreme precipitation events in arid areas in northwest China based on gridded data. J. Natural Resour. 2014, 29, 2048–2057, (In Chinese with English Abstract). [Google Scholar]
- Lu, L.; Bian, L.; Zhang, Z. Climate change and its impact on the polar and the Tibetan Plateau regions. Chin. J. Polar Res. 2011, 23, 82–89, (In Chinese with English Abstract). [Google Scholar]
- Immerzeel, W.W.; van Beek, L.P.H.; Bierkens, M.F.P. Climate change will affect the Asian water towers. Science 2010, 328, 1382–1385. [Google Scholar] [CrossRef] [PubMed]
- Pan, B.; Li, J. Qinghai-Tibetan Plateau: A driver and amplifier of the global climatic change. J. Lanzhou Univ. 1996, 32, 108–115, (In Chinese with English Abstract). [Google Scholar]
- Liu, C.; Zhou, C.; Yu, J.; Li, L.; Zhang, Y. Zhongguo Shui Wen Di Li; Science Press: Beijing, China, 2014. [Google Scholar]
- Huang, C.; Zheng, X.; Tait, A.; Dai, Y.; Yang, C.; Chen, Z.; Li, T.; Wang, Z. On using smoothing spline and residual correction to fuse rain gauge observations and remote sensing data. J. Hydrol. 2014, 508, 410–417. [Google Scholar] [CrossRef]
- Gao, Y.; Li, K.; Chen, F.; Jiang, Y.; Lu, C. Assessing and improving Noah-MP land model simulations for the central Tibetan Plateau. J. Geophys. Res. 2015, 120, 9258–9278. [Google Scholar] [CrossRef]
- Haylock, M.R.; Goodess, C.M. Interannual variability of European extreme winter rainfall and links with mean large-scale circulation. Int. J. Climatol. 2004, 24, 759–776. [Google Scholar] [CrossRef]
- Mann, H.B. Nonparametric tests against trend. Econometrica 1945, 13, 245–259. [Google Scholar] [CrossRef]
- Kendall, M.G. Rank Correlation Methods; Charles Griffin: London, UK, 1948. [Google Scholar]
- Li, Z.; Zheng, F.; Liu, W.; Flanagan, D.C. Spatial distribution and temporal trends of extreme temperature and precipitation events on the Loess Plateau of China during 1961–2007. Quat. Int. 2010, 226, 92–100. [Google Scholar] [CrossRef]
- Sen, P.K. Estimates of the regression coefficient based on Kendall’s tau. J. Am. Stat. Assoc. 1968, 63, 1379–1389. [Google Scholar] [CrossRef]
- Nandintsetseg, B.; Greene, J.S.; Goulden, C.E. Trends in extreme daily precipitation and temperature near Lake Hövsgöl, Mongolia. Int. J. Climatol. 2007, 27, 341–347. [Google Scholar] [CrossRef]
- Yang, Z.; Jian, J.; Hong, J. Temporal and spatial distribution of extreme precipitation events in Tibet during 1961–2010. Plateau Meteorol. 2014, 33, 37–42, (In Chinese with English Abstract). [Google Scholar]
- You, Q.L.; Kang, S.C.; Yan, Y.P.; Xu, Y.W.; Zhang, Y.J.; Huang, J. Trends in daily temperature and precipitation extremes over the Yarlung Zangbo River Basin during 1961–2005. J. Geogr. Sci. 2009, 64, 592–600, (In Chinese with English Abstract). [Google Scholar]


| Indexes | Definitions | Units |
|---|---|---|
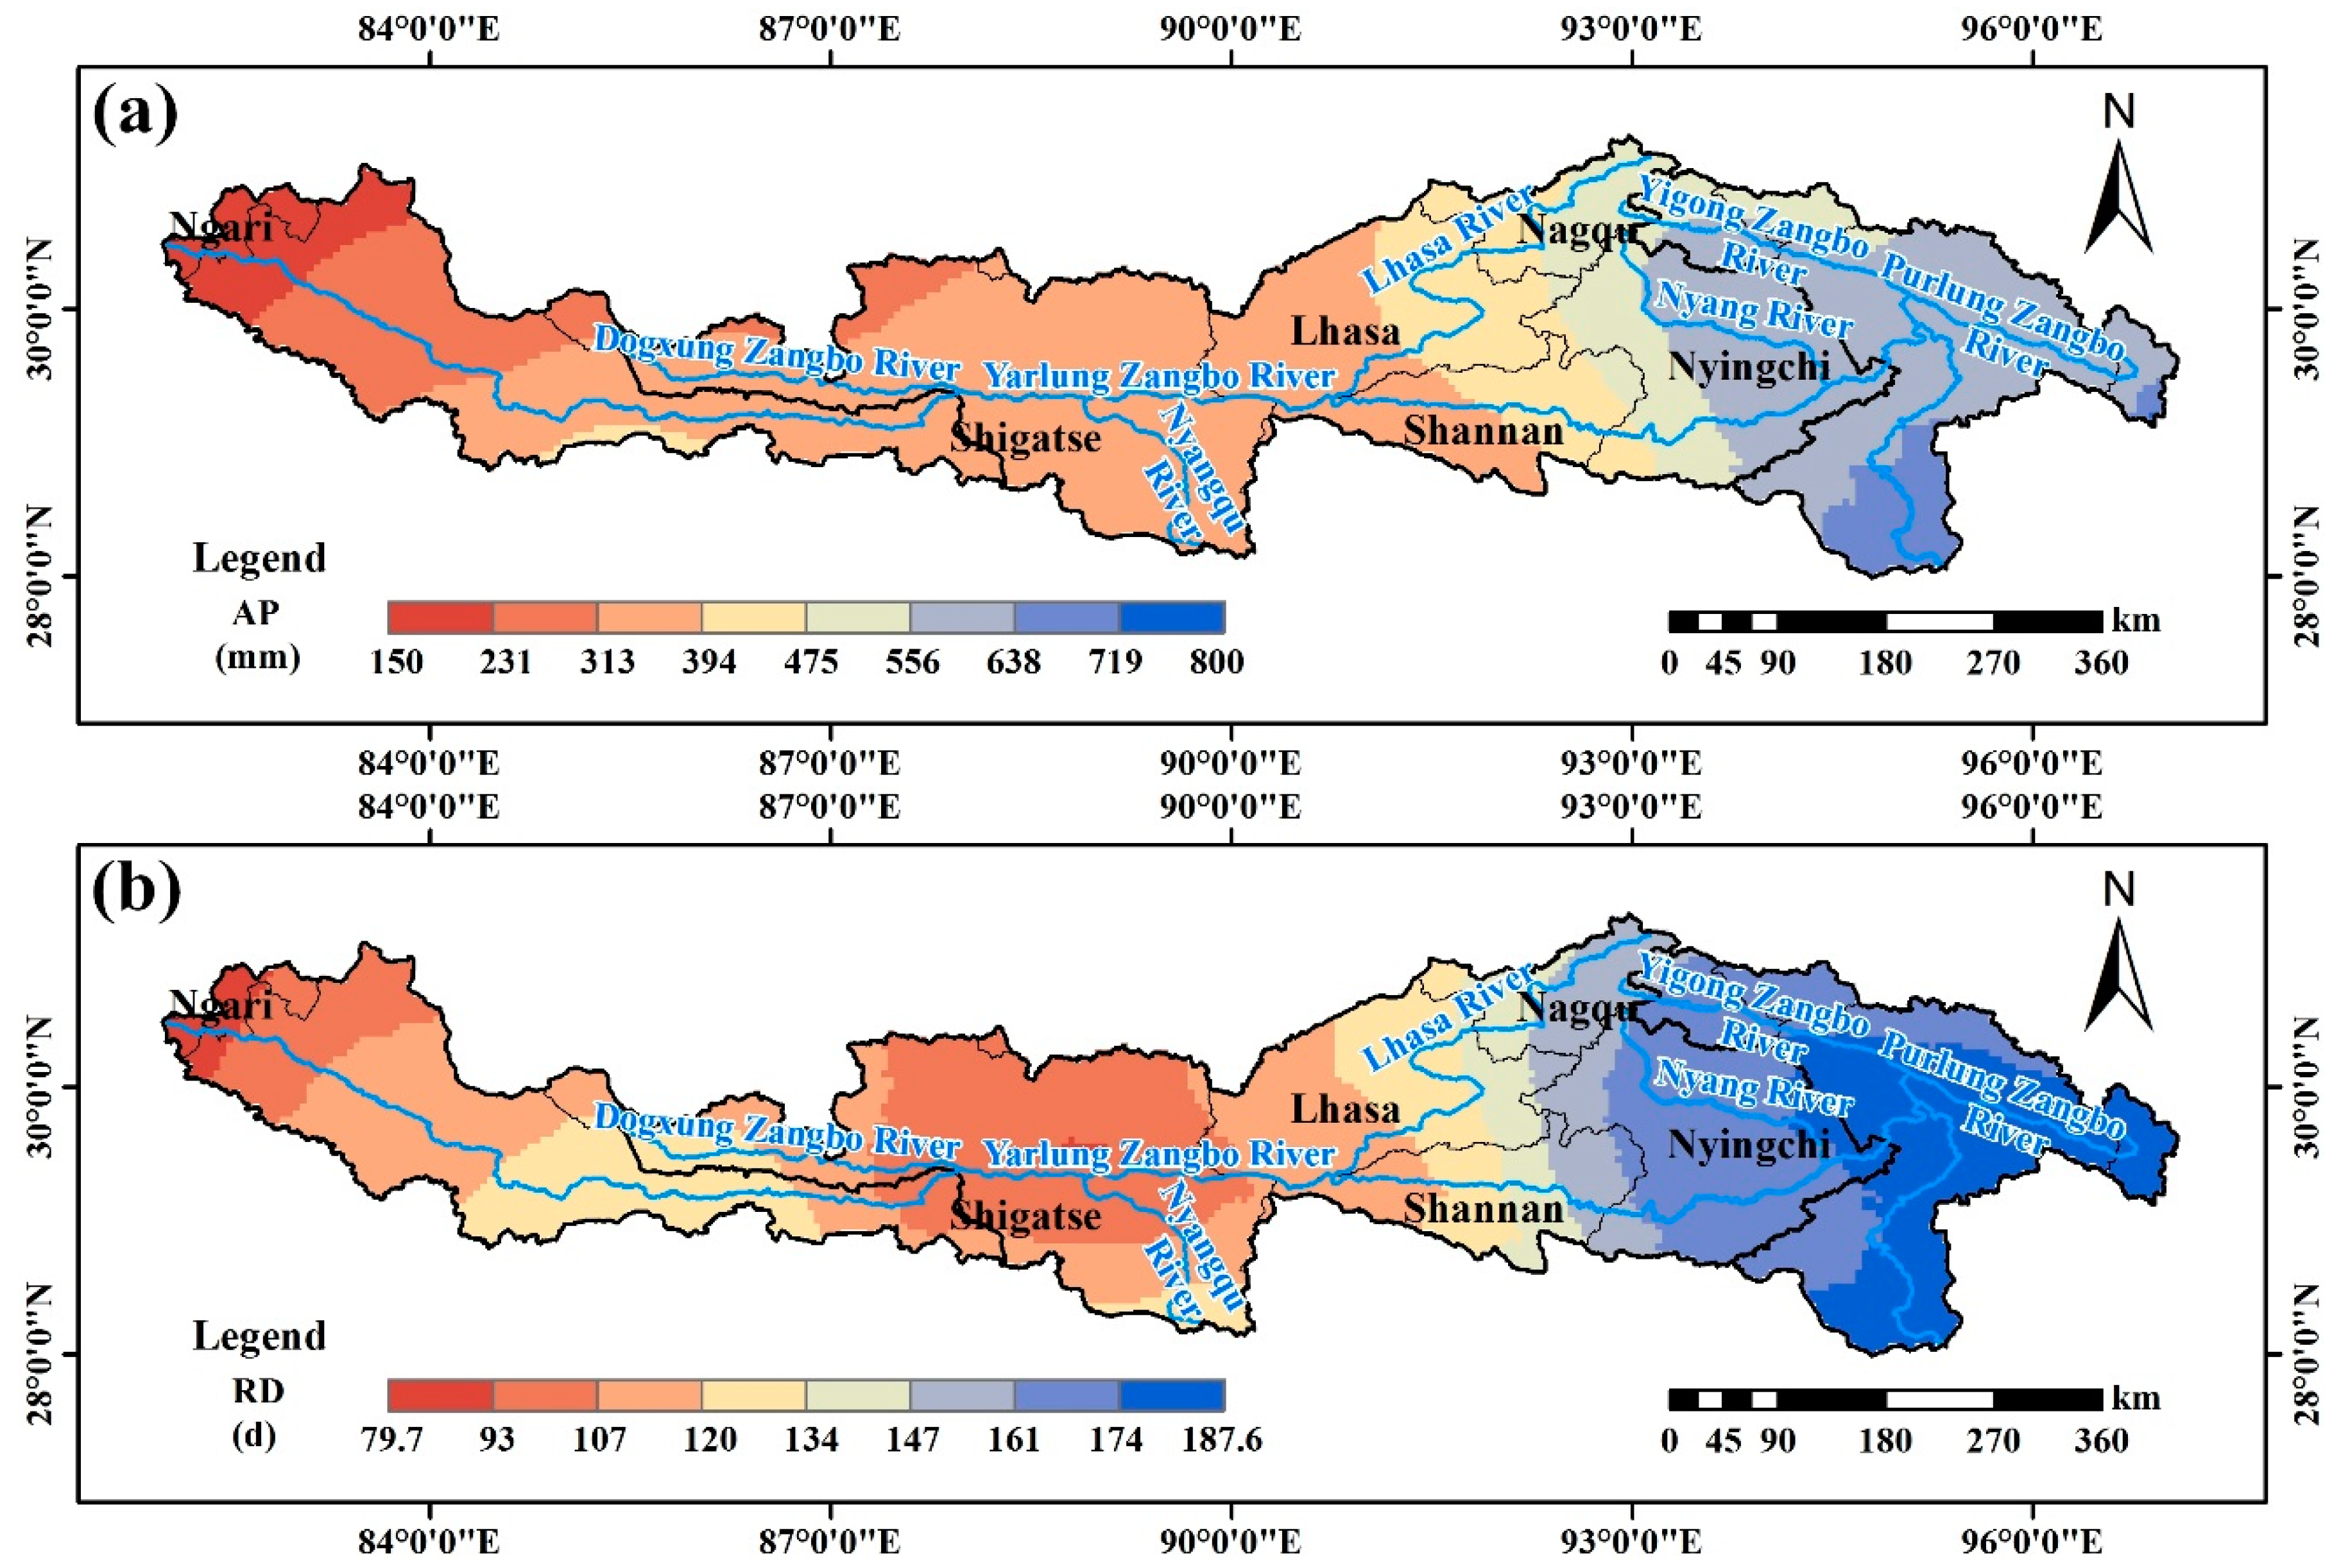
| AP | Annual precipitation | mm |
| RD | The number of rain days in a year | d |
| RI | The ratio of AP and RD in a year | mm/d |
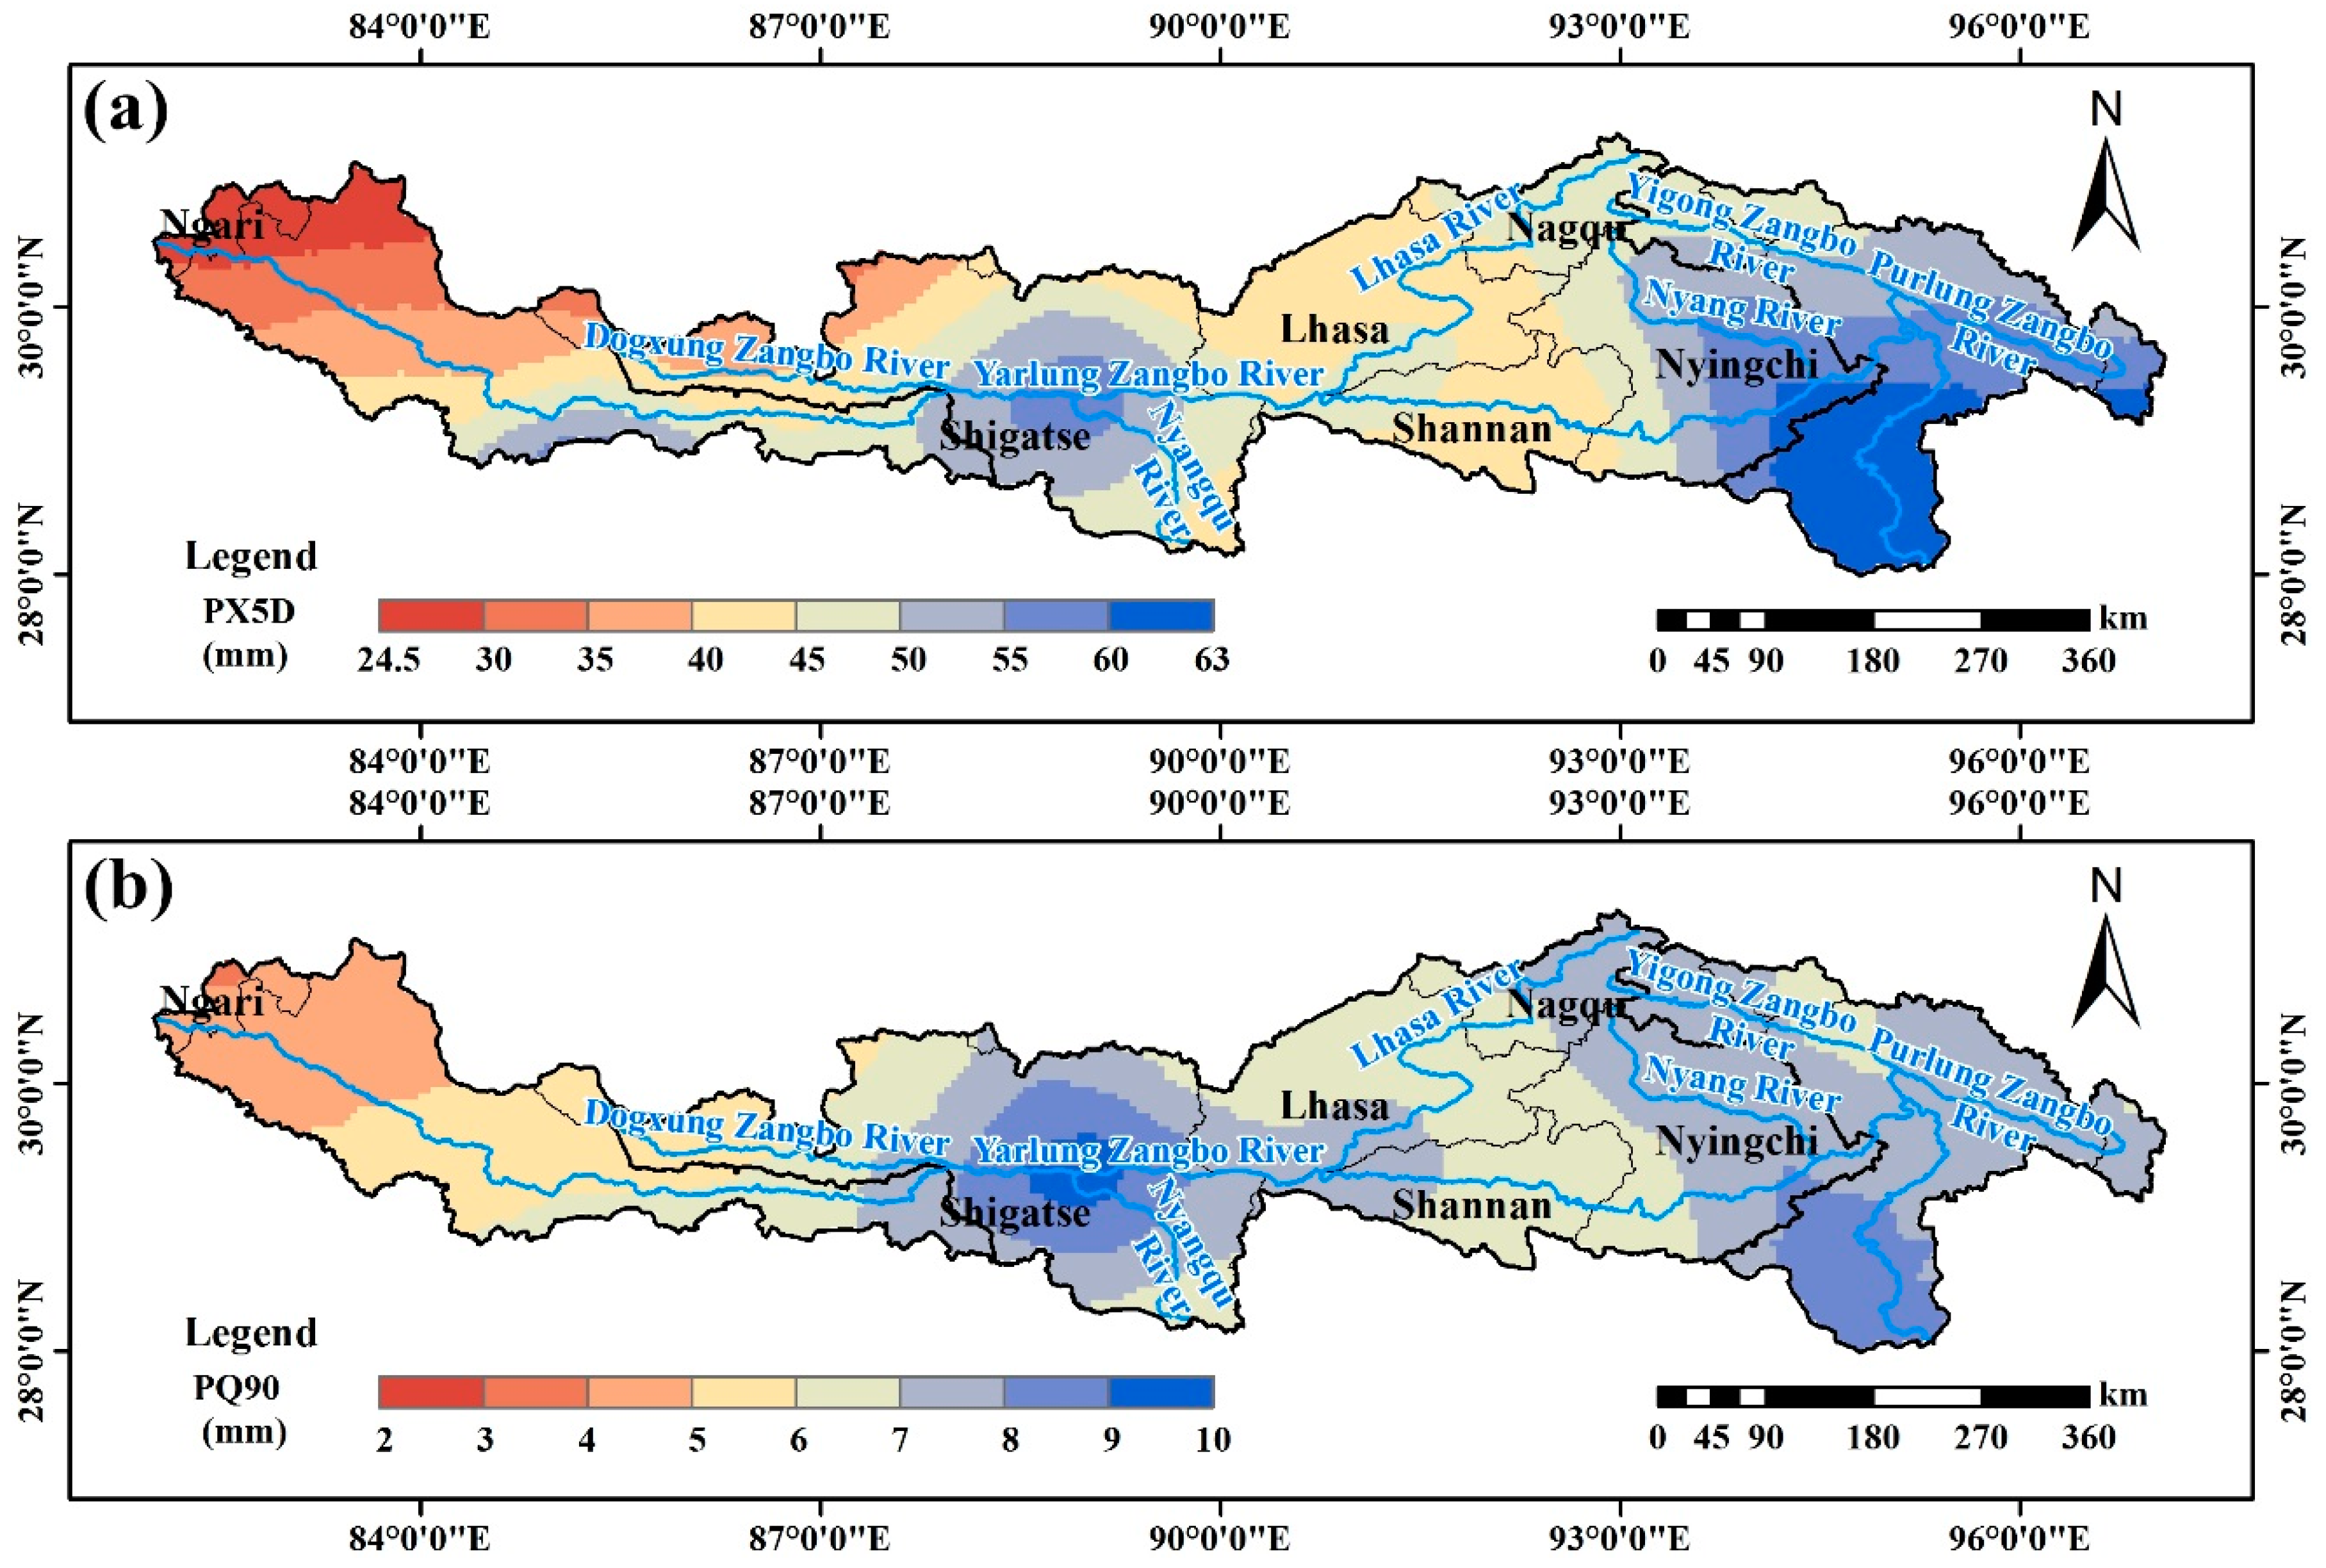
| PX5D | Annual maximum consecutive five-day precipitation in a year | mm |
| PQ90 | The 90th percentile of daily precipitation in a year | mm |
| PNL90 | Number of rain days in a year for which daily precipitation > long-term PQ90 | d |
| PFL90 | The ratio of precipitation for days in a year for when daily precipitation > long-term PQ90 to annual precipitation | % |
| Indexes | Average Value | Trend | Significant or Not |
|---|---|---|---|
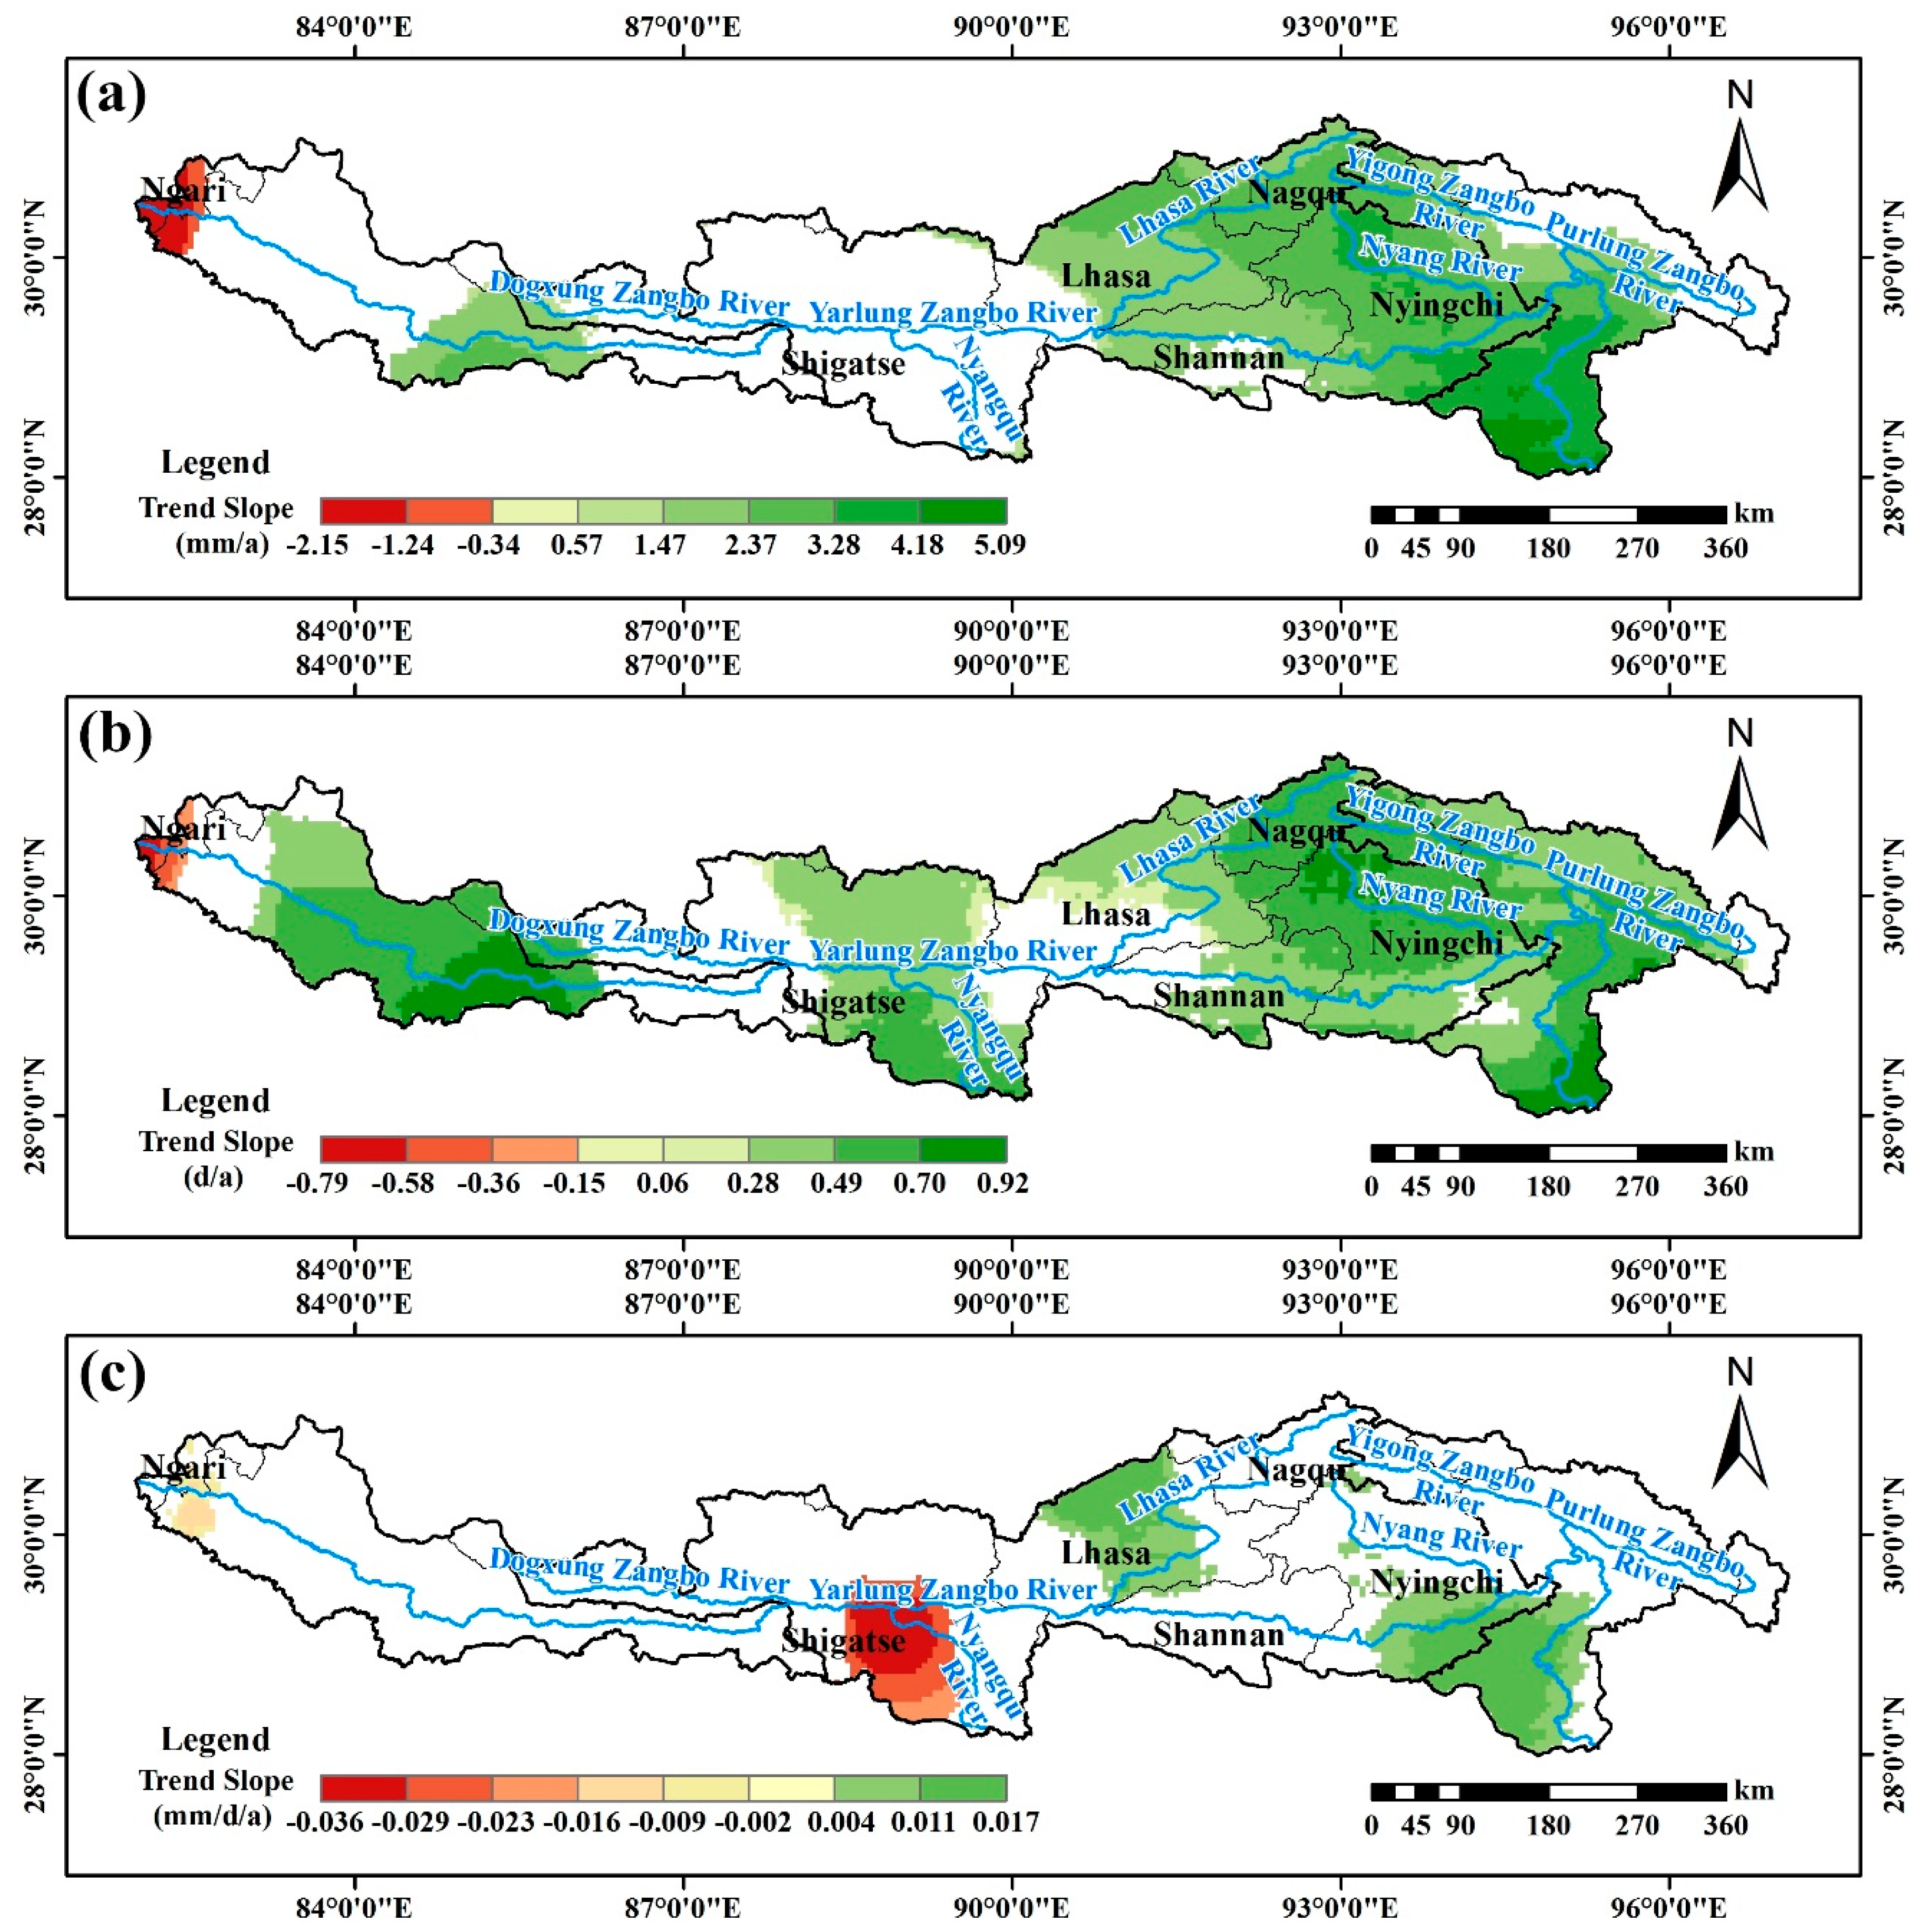
| AP | 430.6 mm | 1.4752 mm/a | YES |
| RD | 135.0 d | 0.404 d/a | YES |
| RI | 3.4 mm/d | −0.0002 mm/a | NO |
| PX5D | 46.0 mm | 0.0319 mm/a | NO |
| PQ90 | 6.9 mm | 0.0047 mm/a | NO |
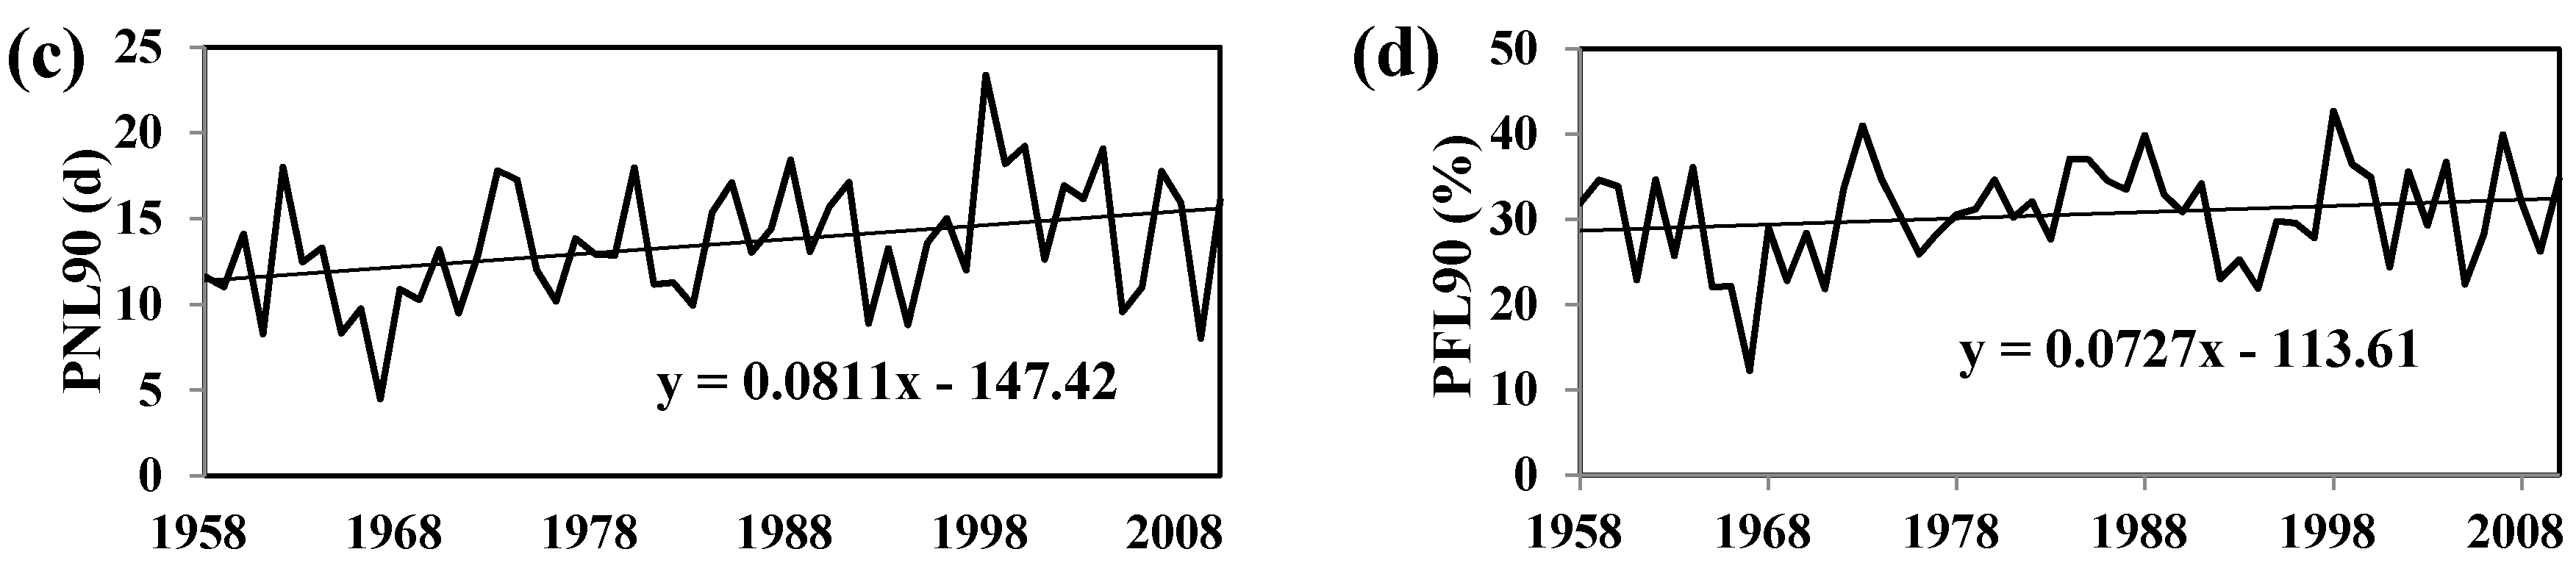
| PNL90 | 13.5 d | 0.0811 d/a | YES |
| PFL90 | 30.5% | 0.0727%/a | NO |
© 2018 by the authors. Licensee MDPI, Basel, Switzerland. This article is an open access article distributed under the terms and conditions of the Creative Commons Attribution (CC BY) license (http://creativecommons.org/licenses/by/4.0/).
Share and Cite
Fan, J.; Sun, W.; Zhao, Y.; Xue, B.; Zuo, D.; Xu, Z. Trend Analyses of Extreme Precipitation Events in the Yarlung Zangbo River Basin, China Using a High-Resolution Precipitation Product. Sustainability 2018, 10, 1396. https://doi.org/10.3390/su10051396
Fan J, Sun W, Zhao Y, Xue B, Zuo D, Xu Z. Trend Analyses of Extreme Precipitation Events in the Yarlung Zangbo River Basin, China Using a High-Resolution Precipitation Product. Sustainability. 2018; 10(5):1396. https://doi.org/10.3390/su10051396
Chicago/Turabian StyleFan, Jiao, Wenchao Sun, Yong Zhao, Baolin Xue, Depeng Zuo, and Zongxue Xu. 2018. "Trend Analyses of Extreme Precipitation Events in the Yarlung Zangbo River Basin, China Using a High-Resolution Precipitation Product" Sustainability 10, no. 5: 1396. https://doi.org/10.3390/su10051396