Article

Dependency of Businesses on Flows of Ecosystem Services: A Case Study from the County of Dorset, UK

by
Stephen C. L. Watson
* and
Adrian C. Newton
Centre for Ecology, Environment and Sustainability, Faculty of Science and Technology, Bournemouth University, Talbot Campus, Poole, Dorset BH12 5BB, UK
*
Author to whom correspondence should be addressed.
Sustainability 2018, 10(5), 1368; https://doi.org/10.3390/su10051368
Submission received: 23 March 2018 / Revised: 23 April 2018 / Accepted: 24 April 2018 / Published: 27 April 2018
(This article belongs to the Section Sustainable Agriculture)

Abstract

:
Although it is widely assumed that business activity is dependent on flows of ecosystem services (ES), little evidence is available with which to evaluate this contention. To address this knowledge gap, we conducted a questionnaire survey of business dependencies on twenty-six different ES in the English county of Dorset, where the environment supports a significant component of the local economy. Responses were received from 212 businesses across twenty-eight sectors. While virtually all businesses (98%) were familiar with the concept of ES, dependency on ES was highly divided with 50% of businesses surveyed claiming no dependence on any ES flows. The highest businesses dependencies reported in this study were for regulating services with the ES of water quality and waste water treatment being of particular importance to businesses. The results however, advised that greater efforts are needed in highlighting the indirect benefits provided by Dorset’s ecosystems, with eight business sectors (58% of respondents) claiming no or little dependence on supporting and habitat services including the ES of biodiversity, habitats for species and maintenance of genetic diversity. Many businesses also indicated little or no dependence on the globally important ES of pollination and soil condition, which may reflect a lack of awareness of dependencies occurring upstream of their value chains. At the sector level, businesses directly involved in protecting, extracting, or manufacturing raw materials were found to be more dependent on provisioning, regulatory and supporting ES than those operating in the service sector who favored cultural ES. These results highlight the value of assessing business dependencies on ES flows, which could usefully inform environmental management and accounting systems and improve monitoring of business performance, and thereby contribute to achievement of sustainability goals.

1. Introduction

Research on the interrelated concepts of natural capital (NC) and ecosystem services (ES) has developed rapidly in recent years [1,2,3], and has provided detailed insights into the spatial dynamics of ES flows in relation to land/ocean management [4,5,6], how ES may be valued [7,8] and how such values may be incorporated into decision making [9,10]. It is now widely believed that the process of economic development is dependent on maintenance of NC and the associated flows of ES to human society [11,12]. Furthermore, it is axiomatic that economic development is contingent on the activities of the private sector, which plays a leading role in driving productivity and economic participation, creating employment and funding investment. Yet the specific role of ecosystem flows in supporting business activity has received relatively little attention from researchers. In their overview of the linkages between biodiversity, ecosystems and business, The Economics of Ecosystems and Biodiversity study TEEB [13] suggested that all businesses depend on ES, either directly or indirectly, without citing any supporting evidence. TEEB [13] also highlighted the need to measure the dependence of businesses on ES flows, as a first step towards identifying opportunities from development of the green economy and avoiding undefined risks associated with environmental change. Further, TEEB [14] highlighted the need for environmental management and accounting systems to capture ecosystem service dependencies more consistently, to improve monitoring of business performance and to ensure that returns to investors are not undermined.
Despite such calls, relatively few studies have explicitly investigated the extent to which businesses are dependent on ES flows [15] and even fewer have provided evidence that enables companies to make commercially motivating arguments for investing in NC [16]. The small numbers of studies investigating business dependence on NC or ES have tended to consider the importance of a single tangible asset such as water, carbon, biodiversity, or soil e.g., [17,18], but this does not adequately address the full spectrum of NC assets and benefits used by businesses. Other studies that have investigated business preferences for multiple ES only consider one economic sector e.g., [19,20,21]. While it is widely asserted or assumed that businesses are dependent on flows of many ES to conduct their activities [22], there is an urgent need to better understand different businesses’ opinions and preferences, as well as their attitudes towards all forms of NC, to facilitate relevant policy developments and to inform better business leadership decisions. While the links between business, ES and NC are manifold [23], specific business preferences and dependencies regarding ES are usually based on local geographic and cultural characteristics [24]. This exemplifies the need for case studies that capture local knowledge and data around the interdependencies of ES so that policy-makers can determine the most appropriate investments in NC, both for business priorities and for society.
In this study, we examined business dependencies on ES in the county of Dorset in South West England. Dorset provides a useful example as the environment is one of the main economic assets of the area. Its value to society is recognized through many international, national, and local designations on land and at sea. For example, there are 4 Ramsar sites, 20 Special Areas of Conservation, 11 National Nature Reserves and 141 Sites of Special Scientific Interest located within Dorset, which together with local nature reserves cover about 12% of the land area [25]. Half of the land area of Dorset is also designated as an Area of Outstanding Natural Beauty (AONB) and the county is also home to the Jurassic Coast World Heritage Site, as well as 12,000 designated heritage sites [25]. The “environmental economy” in Dorset has recently been valued at £0.9–£2.5 billion pa and supports 17,000–61,000 jobs, the range in these values depending on the underlying assumptions [25]. These estimates are conservative because they consider only the tangible assets and flows. The wider value of NC includes such intangible benefits as the value to a business of attracting and retaining good staff, and the number of companies that stay in the county because they value the environmental characteristics and quality of the area. Such intangible values could potentially underpin much of the businesses activity and jobs in Dorset [26]. Therefore, the overall objective of this study was to gain information on how dependent business activity in Dorset is on different ES flows, collected through an online questionnaire survey. This research was undertaken to address the following questions: (i) How dependent are businesses on obtaining particular local skills, assets, and resources? (ii) How dependent is the production process of the business, or the service that they offer, on obtaining ES from Dorset?

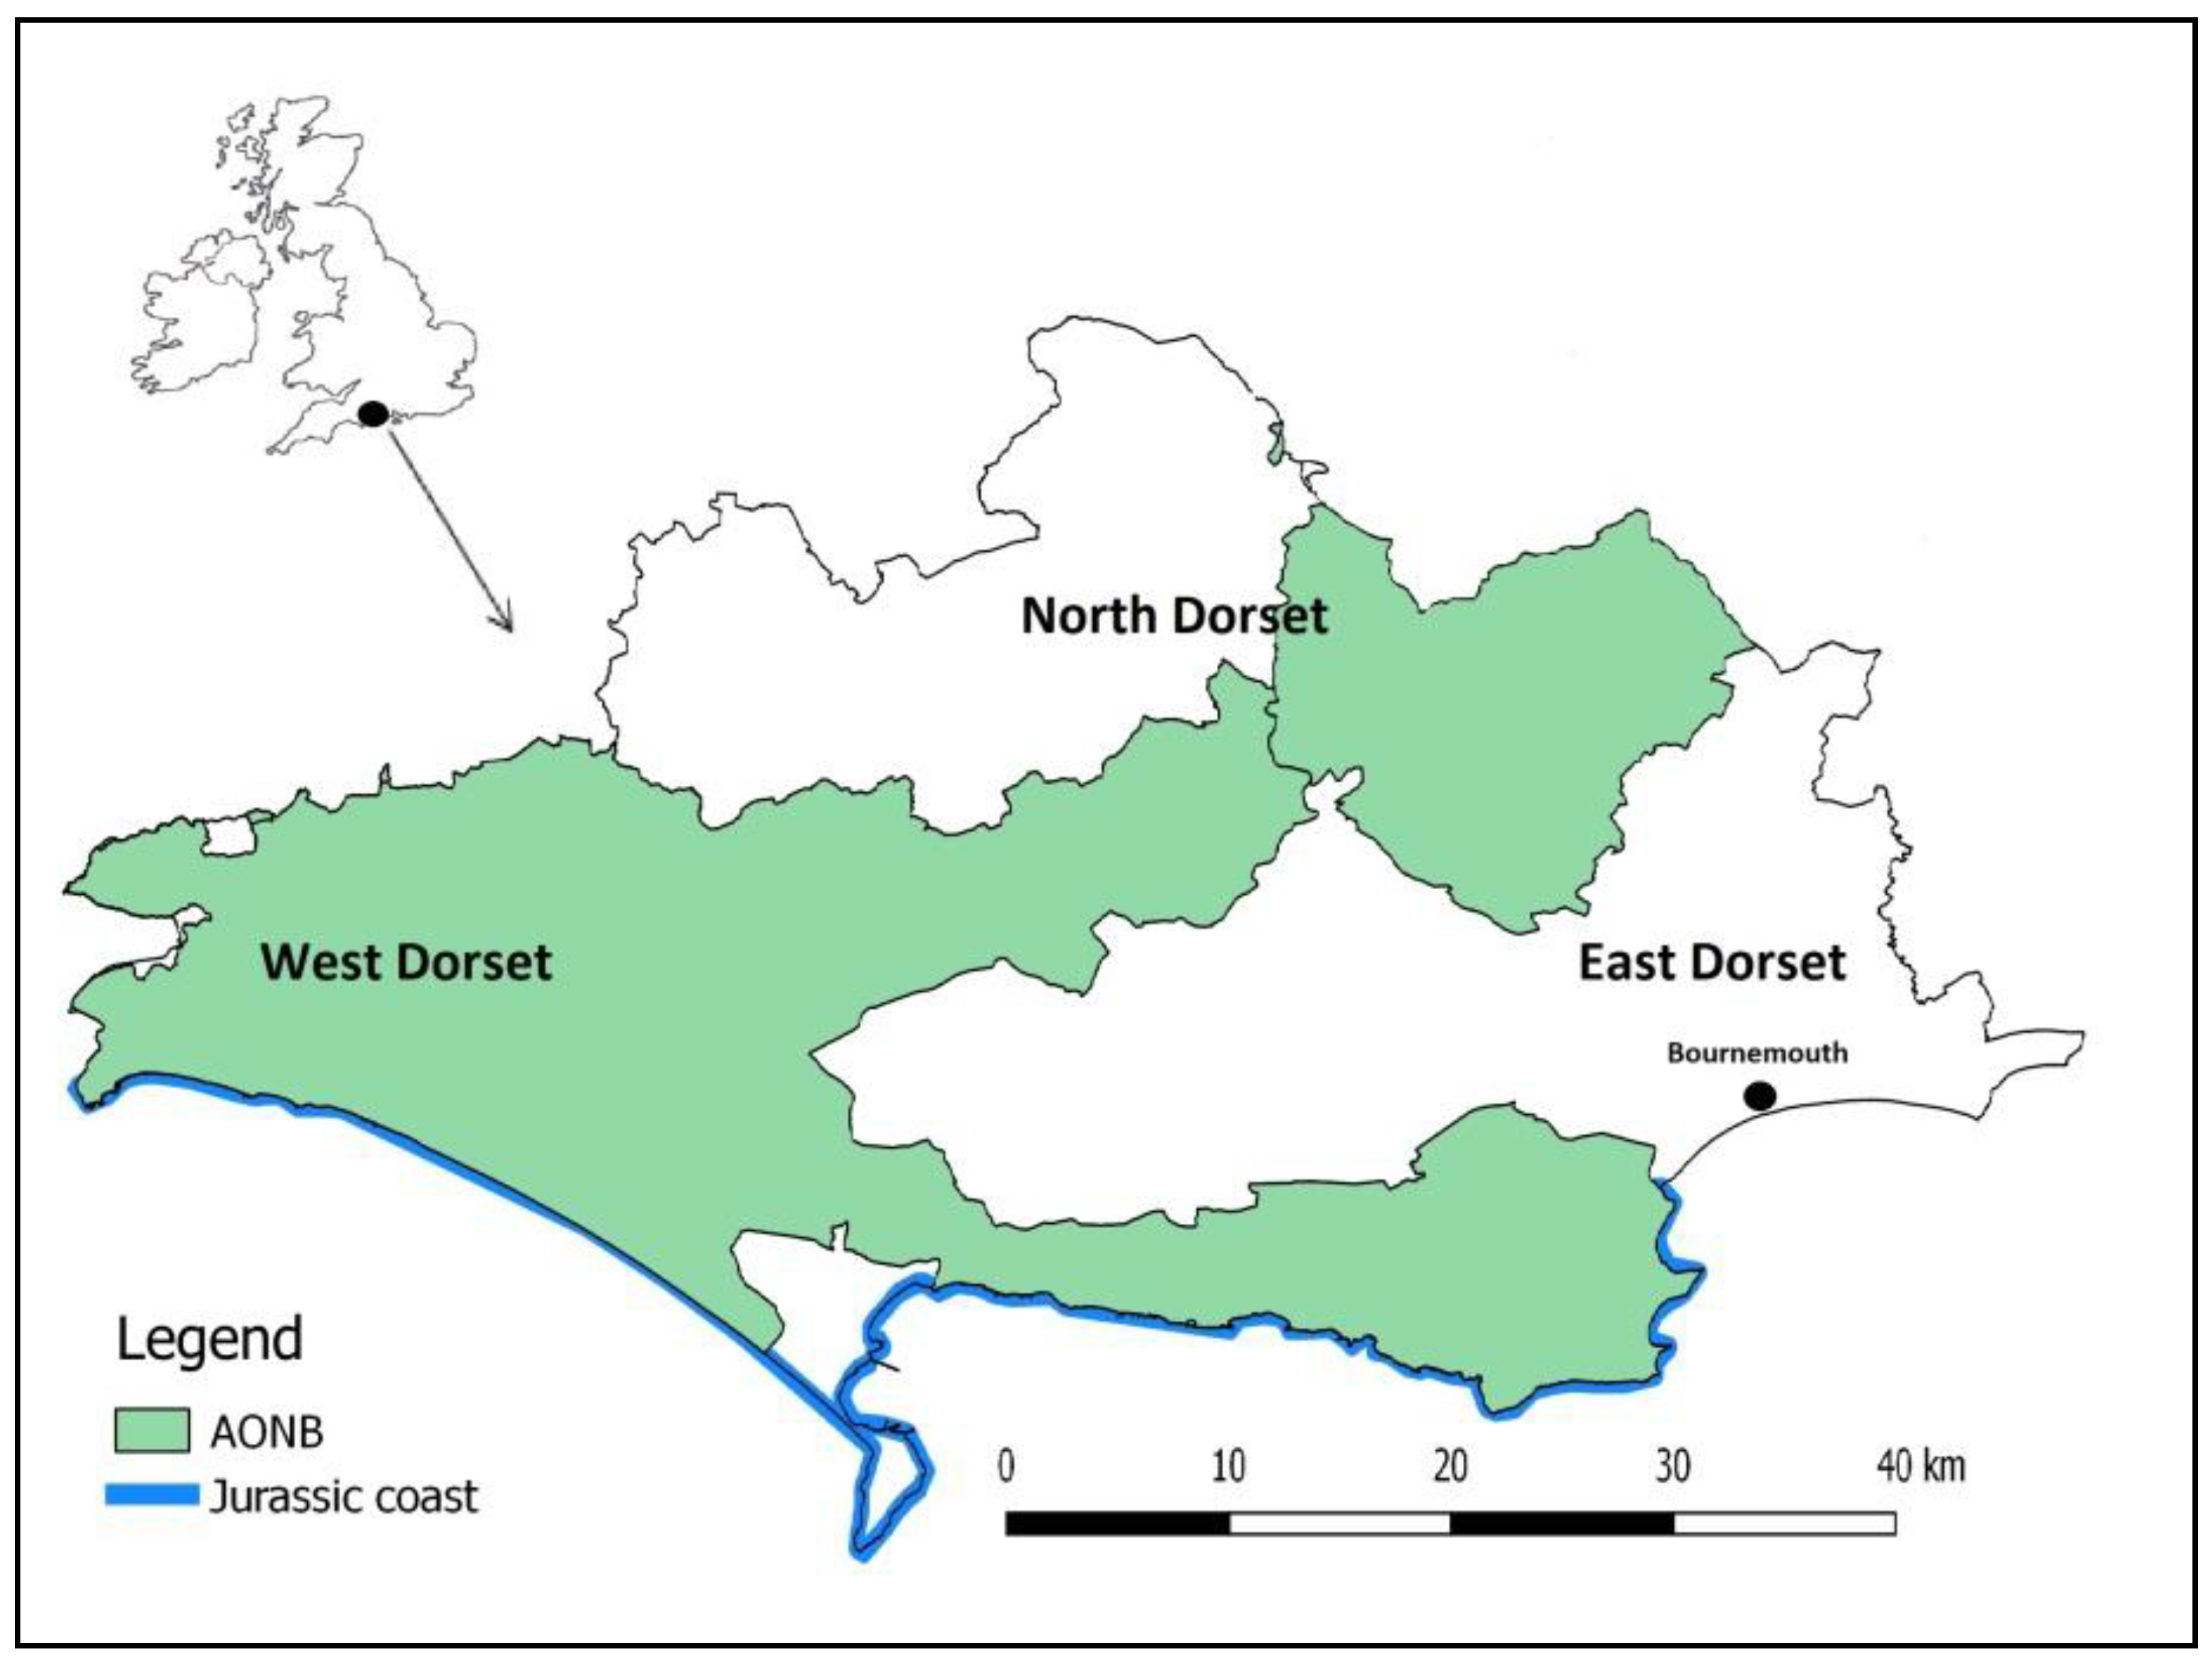
2. Questionnaire Development and Data Sources

We developed the questionnaire based on six steps: (1) create a pilot questionnaire; (2) seek experts’ opinions to improve the reliability of the sampling design, as well as the cohesion and level of relevance of questions addressed; (3) redesign the questionnaire based on the corrections suggested by experts; (4) conduct a pilot survey with the members of the Dorset Local Nature Partnership (LNP); (5) redesign the questionnaire based on the results of the pilot study; (6) disseminate the questionnaire to businesses. The questionnaire was composed of four closed questions that aimed to identify: (1) which sector each business or organization belonged to; (2) why each business chose to base their business activities in Dorset rather than in another county; (3) how important are materials produced in Dorset to business operations; and (4) how dependent is the production process of their business, or the service that they offer, on obtaining ES from Dorset (see online Figure S1 for a full copy of the questionnaire). Any business-based or active in Dorset was invited to complete the questionnaire. This included charitable organizations, local authorities, health services and other public sector organizations, as well as purely commercial organizations. Contacts were gathered from several local businesses directories [26,27,28,29], across the three local county government districts: North, West and East Dorset including the unitary authority areas of Poole and Bournemouth (Figure 1). Additional contacts were also sourced though the business networks of the Dorset LNP, Dorset Local Enterprise Partnership (LEP) and the Dorset Chamber of Commerce and Industry [30,31].
After indicating their business sector in question one, responses were elicited using a three-point (questions two and three) or six-point (question four) Likert scale [32]. The survey was conducted by a single emailing of 2000 questionnaires followed by two follow up reminders sent over a four-month period (July–October 2017). The link to the survey was also promoted via social media and online forums with the purpose of reaching businesses not represented in the local business directories. A response rate of 10.6% (212 participants) was received which is consistent with the relatively low response rates typical of online surveys [33]. However, the sample responses covered a reasonably good representation of different sectors (Figure 2). In development of question four we considered five ecosystem service classifications (The Millennium Ecosystem Assessment, [34]), The Economics of Ecosystems and Biodiversity classification (TEEB, [13]), UK National Ecosystem Assessment (NEA, [35]) Common International Classification of Ecosystem Services (CICES, [36]) and The Final Ecosystem Goods and Services Classification System (FEGS-CS, [37]). These were used to produce a combined list of 26 services that were included in the survey. In line with the above TEEB study ES were defined as “the direct and indirect contributions of ecosystems to human well-being” and were categorized into provisioning, regulating, cultural, and habitat and supporting services.

3. Results

3.1. Reasons for Locating Business Activity in Dorset

Availability of labor/local skills (73%), access to suppliers and markets (71%) and the availability of people with skills in ecology, the environment or nature (61%) were highlighted (i.e., classified as either “somewhat” or “very” important) as the top three reasons for conducting business activities in the county (Figure 3). Further, 60% of businesses considered availability of food, water, and raw materials as being important for business activity. Over 50% of businesses recognized tourism as an important factor for locating the business in Dorset, with access to beach (53%), heathland (52%) and forest (50%) areas of the county of particular importance. In contrast, the need to access other ‘land-based’ habitats such agricultural land was slightly lower (46%). Demand for the maintenance of ecological biodiversity (47%) and access to ‘marine and coastal habitats’ such as cliffs (49%) and sea (48%) was also relatively high considering the range of sectors considered in the study, many of which do not have a direct connection to the coast. This high dependence is likely due to the county’s proximity to the Jurassic Coast World Heritage Site, and the large array of beaches, which attract millions of tourists to the area each year. Sea fishing also takes place from several ports and harbors from Lyme Regis to Christchurch, highlighting the environmental value of Dorset’s seas. Social and cultural factors was evenly split (50%) as an important factor for locating business activity. The least important criteria for establishing a business in Dorset however, was the price of property (39%).

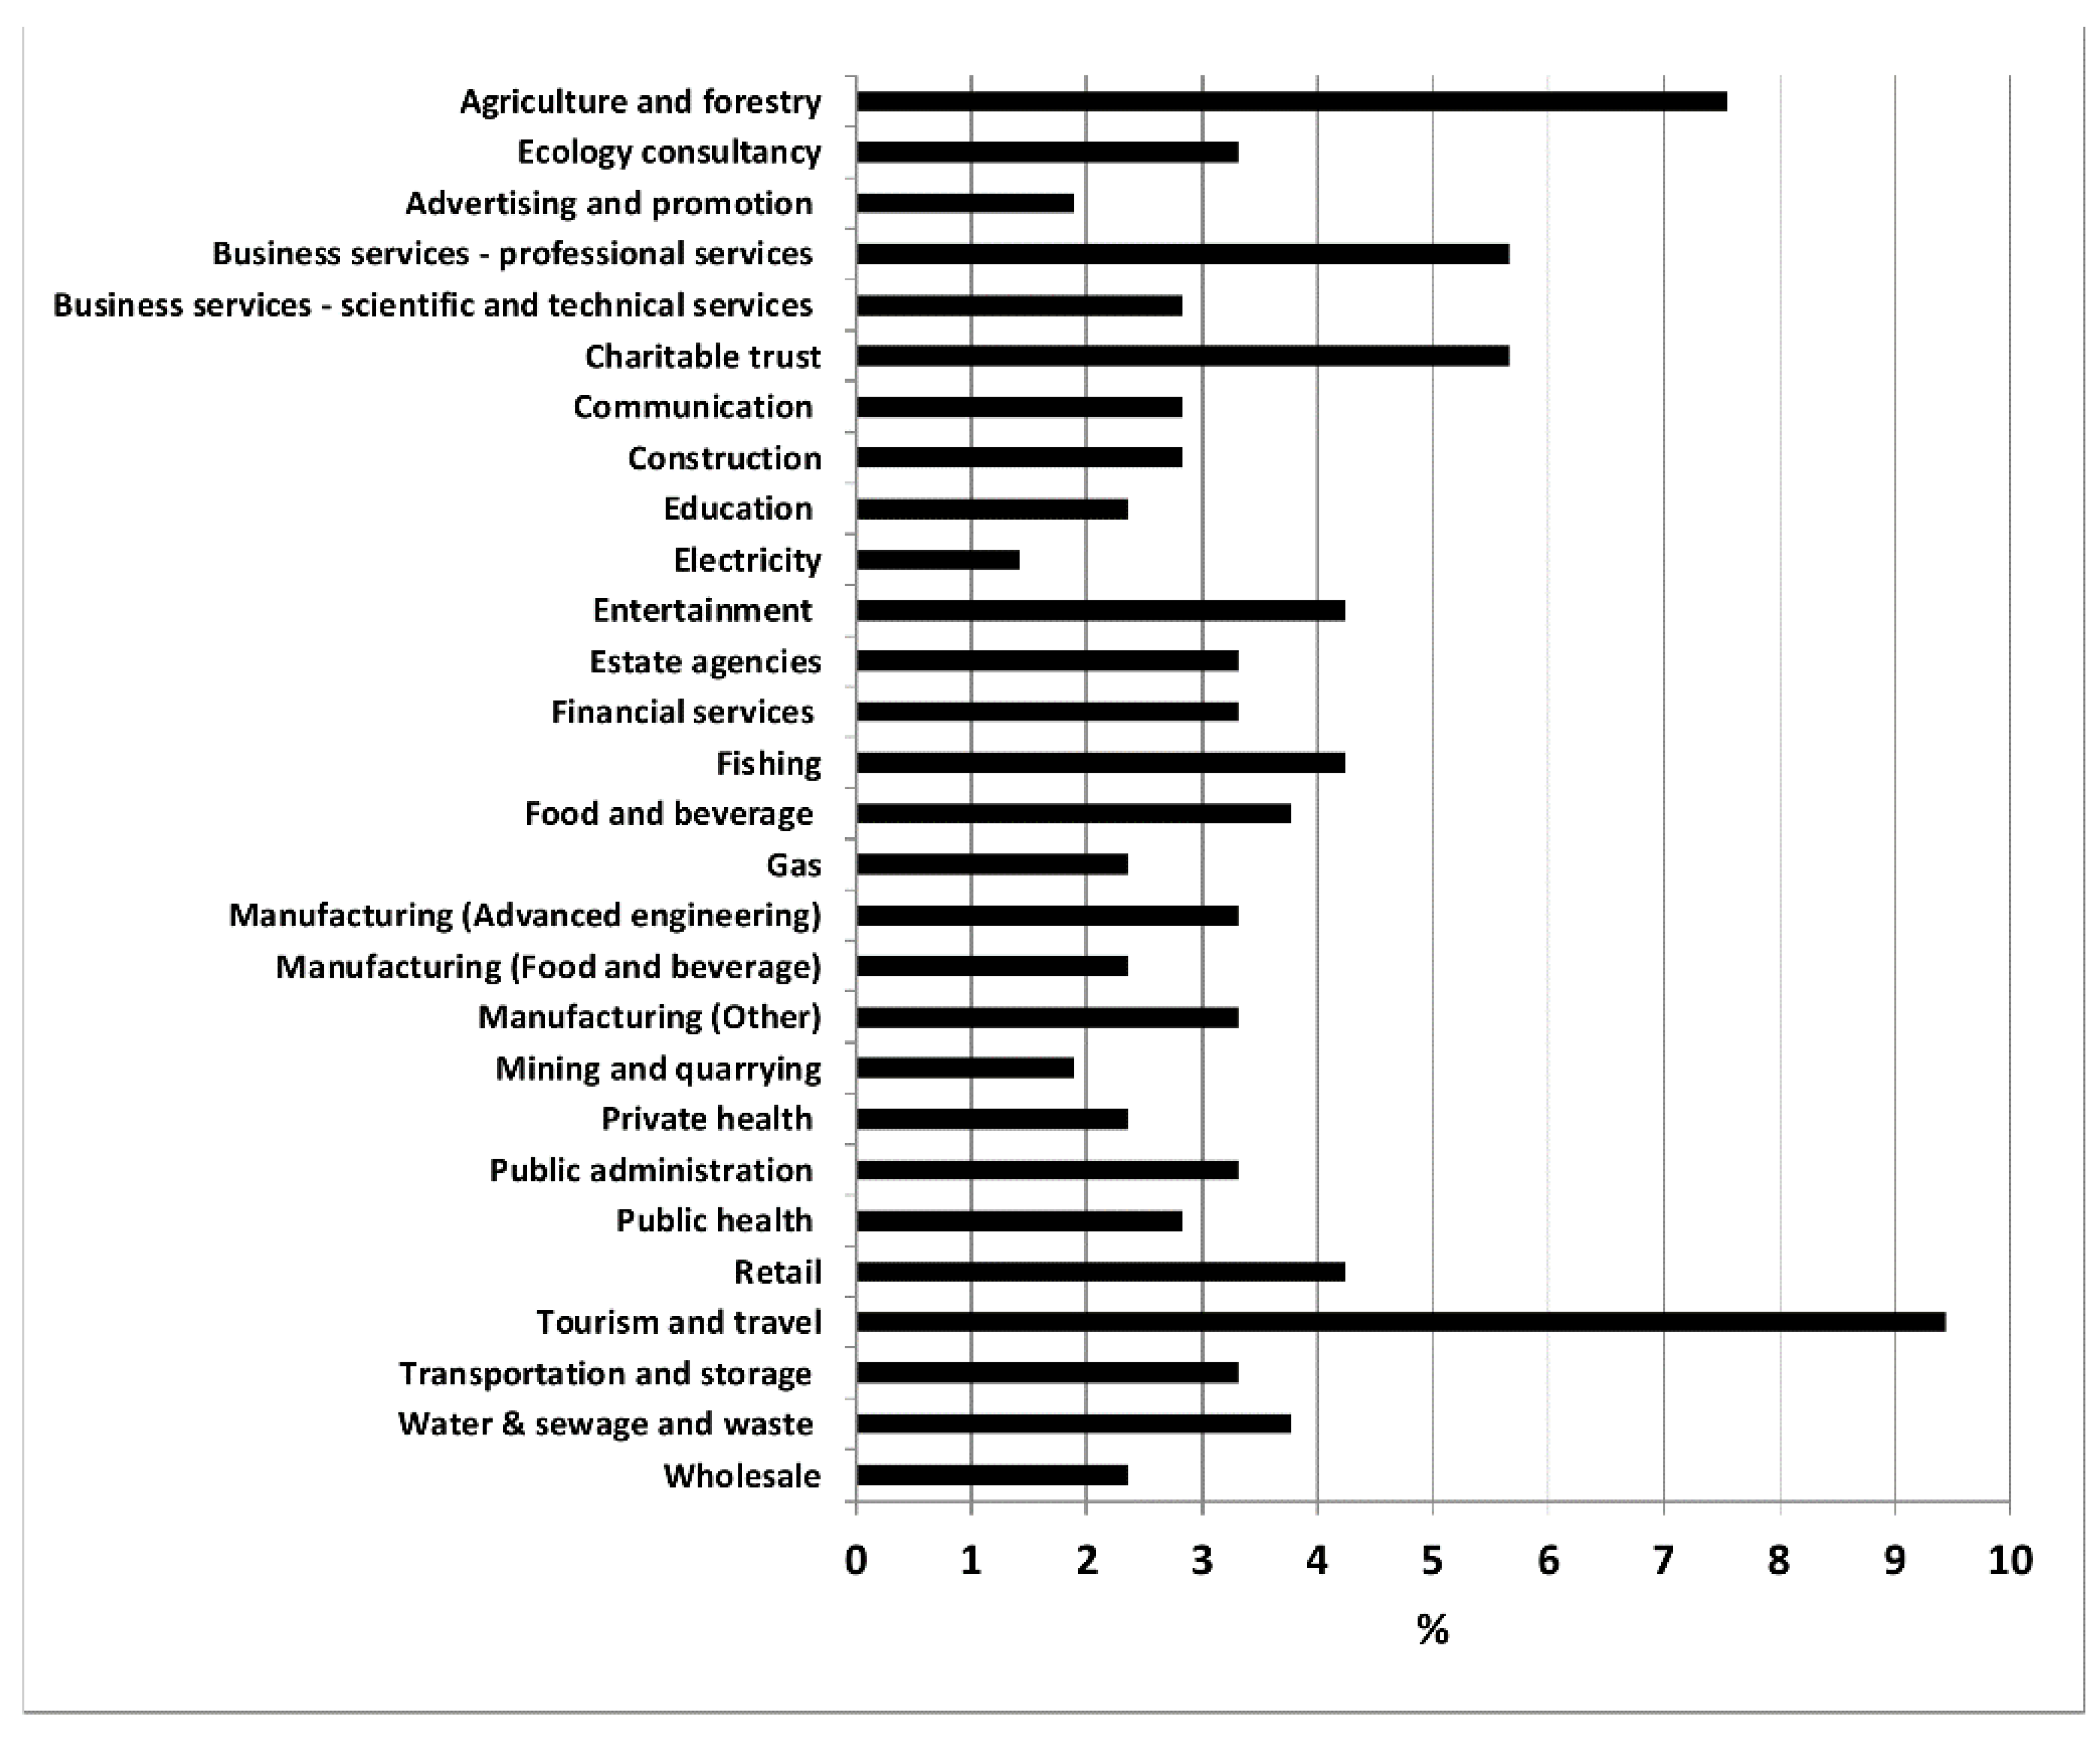
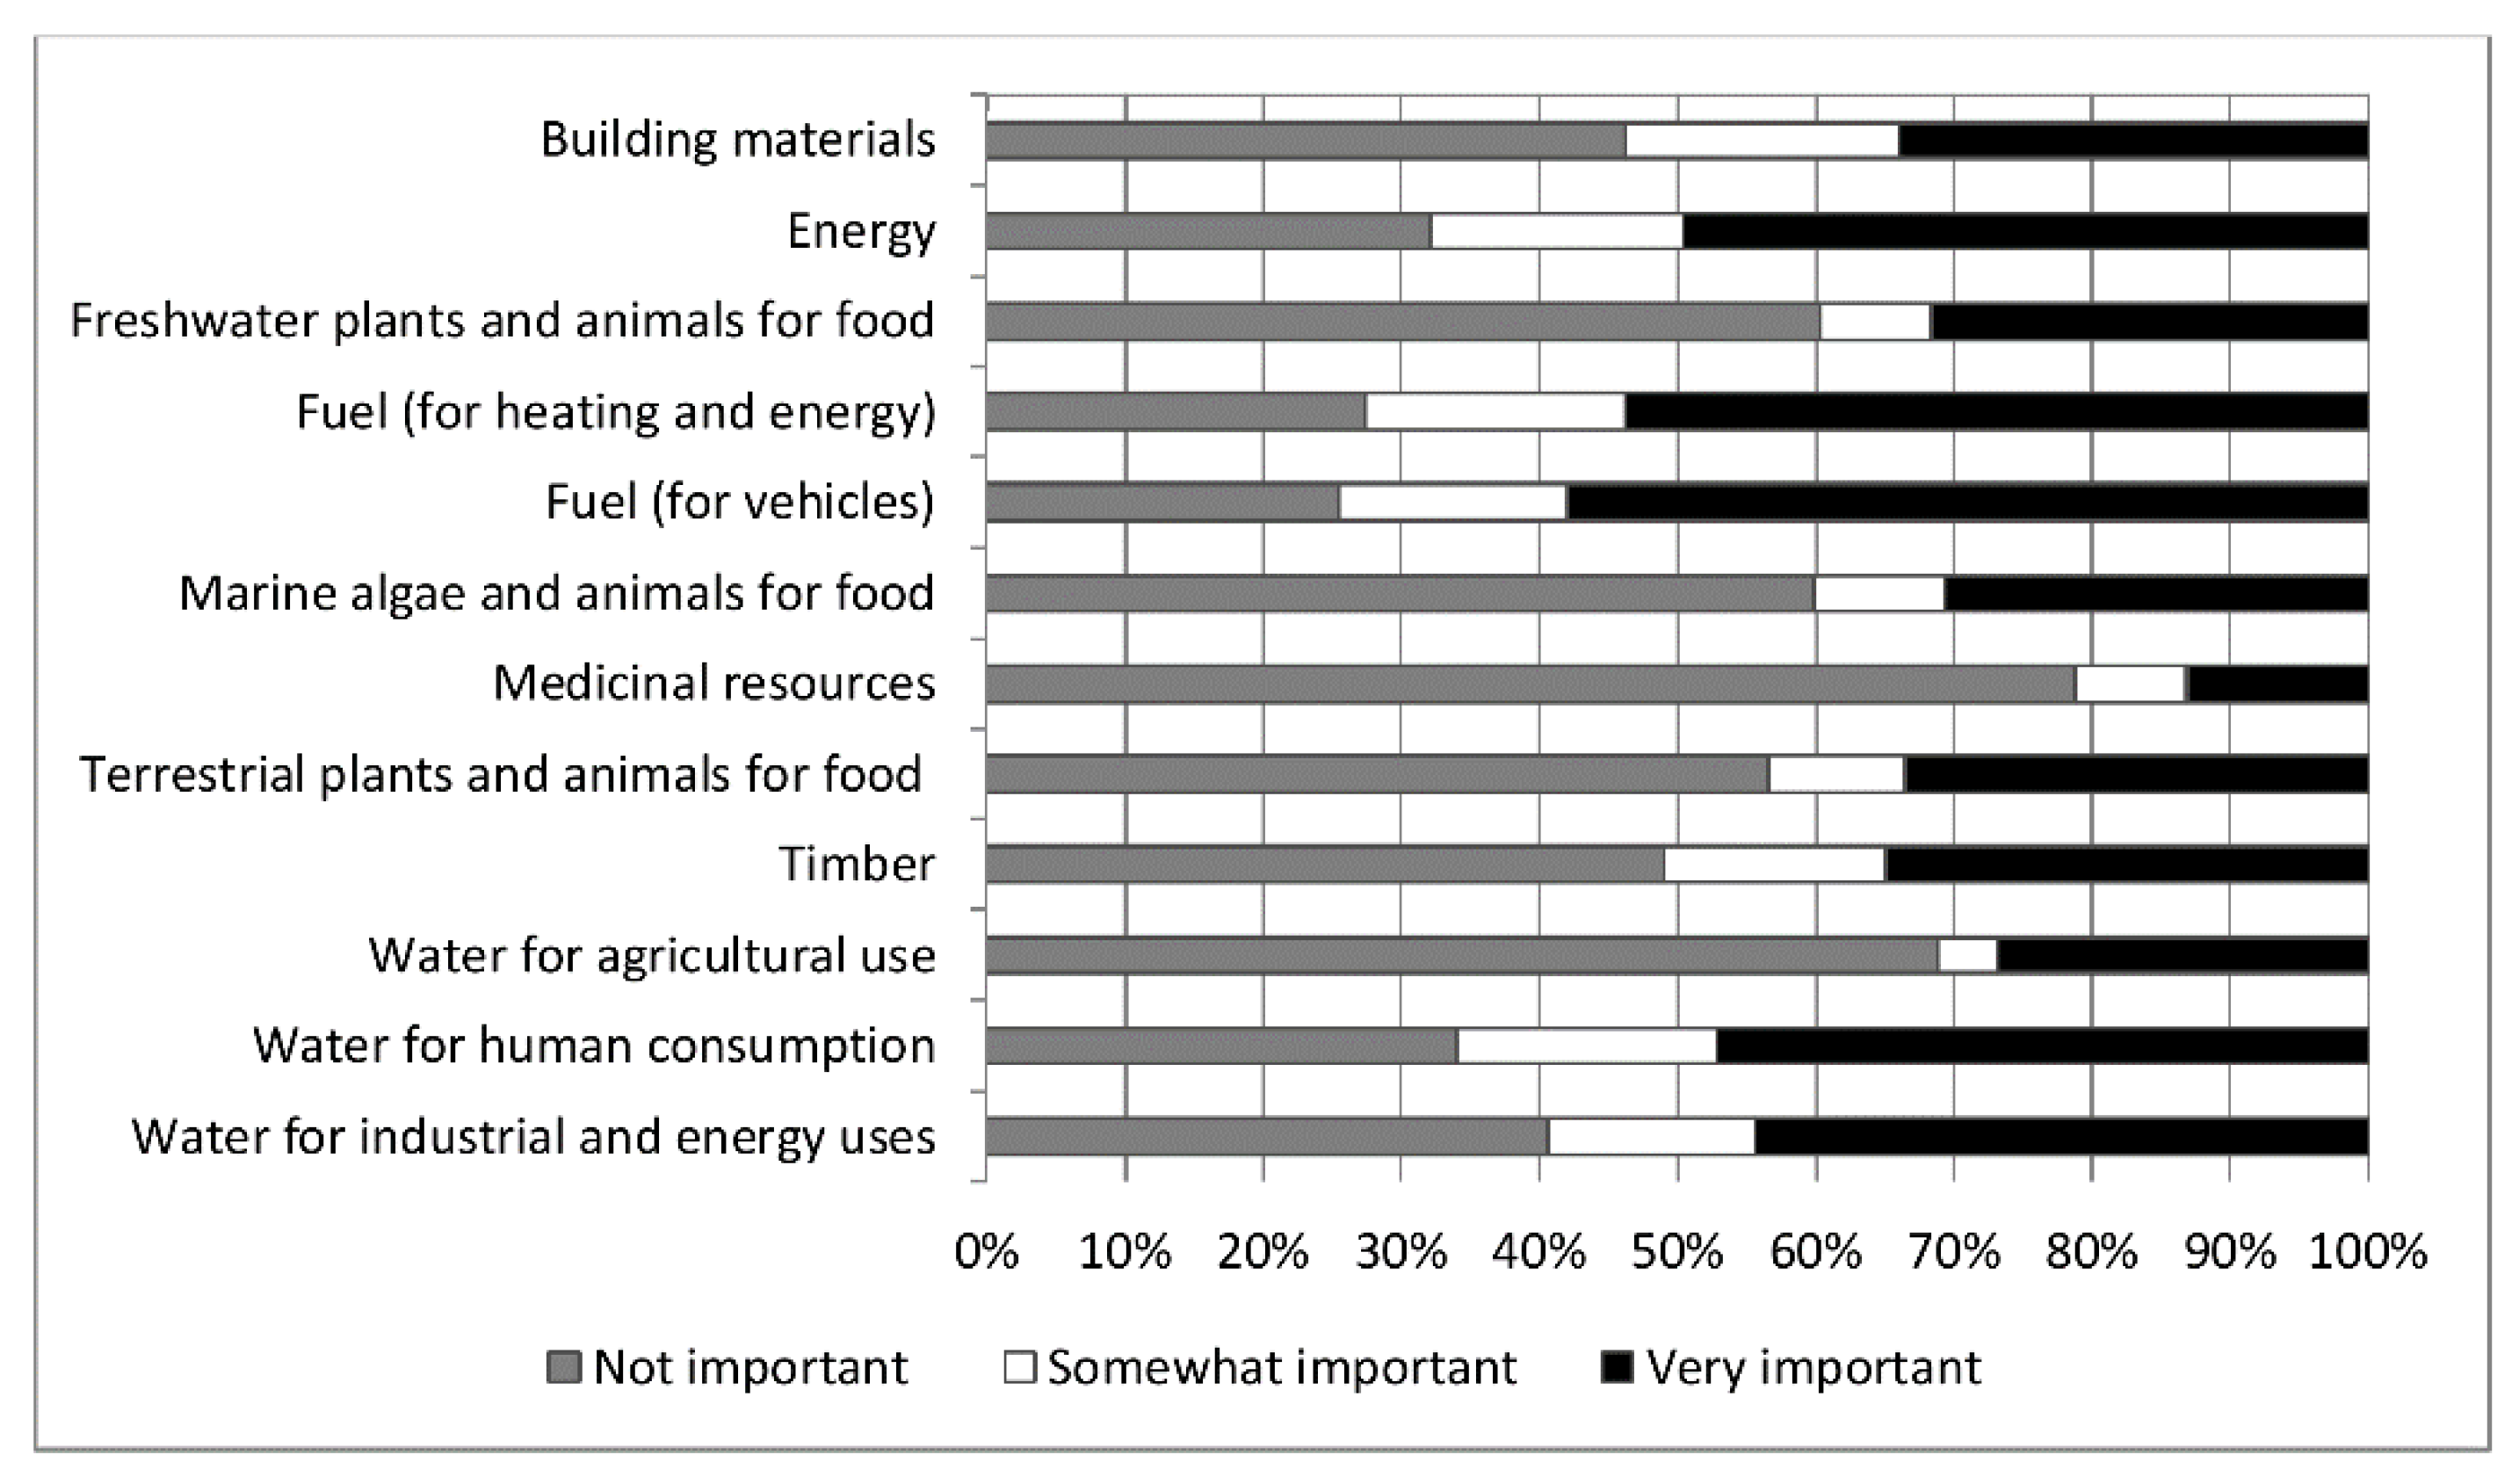
3.2. Importance of Materials Produced in Dorset for Business

Many businesses were found to place a high importance on locally produced materials and utilities (Figure 4), with 75% classifying fuel (for vehicles) as either “somewhat” or “very” important. Other materials that scored highly (>50%) included fuel (for heating and energy) (73%), energy (68%), water for human consumption (66%), water for industrial and energy uses (59%), locally produced building materials (54%) and timber (51%). Conversely, local environmental goods such as terrestrial plants and animals (43%), marine algae and animals (40%) and freshwater plants and animals (39%) were considered less important. Local sources of water for agricultural use (31%) and medicinal resources (13%) were ranked as the least important materials.

3.3. Perception and Importance of ES

Most respondents (98%) could identify ES, with the regulating service of carbon sequestration and storage considered to be the least identifiable service within business operations with 6% of respondents unsure if this service contributed to their business activity. When respondents were asked how dependent their business are on obtaining various environmental goods and services from Dorset, regulating services were perceived to be the most important to businesses, being categorized by 35% of interviewees as “highly dependent” or “entirely dependent” (Table 1). Corresponding values for the other categories were lower, at 30–31%. 58% of businesses claimed that they are “not at all dependent” on habitat and supporting services, indicating that there is a significant proportion of businesses that do not perceive any benefits of biodiversity to their business activities compared with a smaller proportion who do. Overall, 50% of businesses indicated that they were “not dependent at all” on ES flows, with mean scores of this lack of dependence ranging from 21% to 70% for individual services.
The top five ES on which business activities reported as being “high” or “entirely” dependent were all provisioning or regulating services including: the provisioning of freshwater (53%), waste-water treatment (51%), micro-climate regulation (46%), water quality (45%) and carbon sequestration and storage (42%). Leisure and tourism (41%), aesthetically attractive landscapes (37%) and recreation, mental and physical health (36%) were also considered highly or entirely important cultural services by the respondents. In contrast, several regulatory, cultural and habitat services were considered to be unimportant to businesses including: pollination (70% indicating “not dependent at all”), spiritual experience (69%), good soil condition (64%), maintenance of genetic diversity (65%) and pest and disease control (63%).

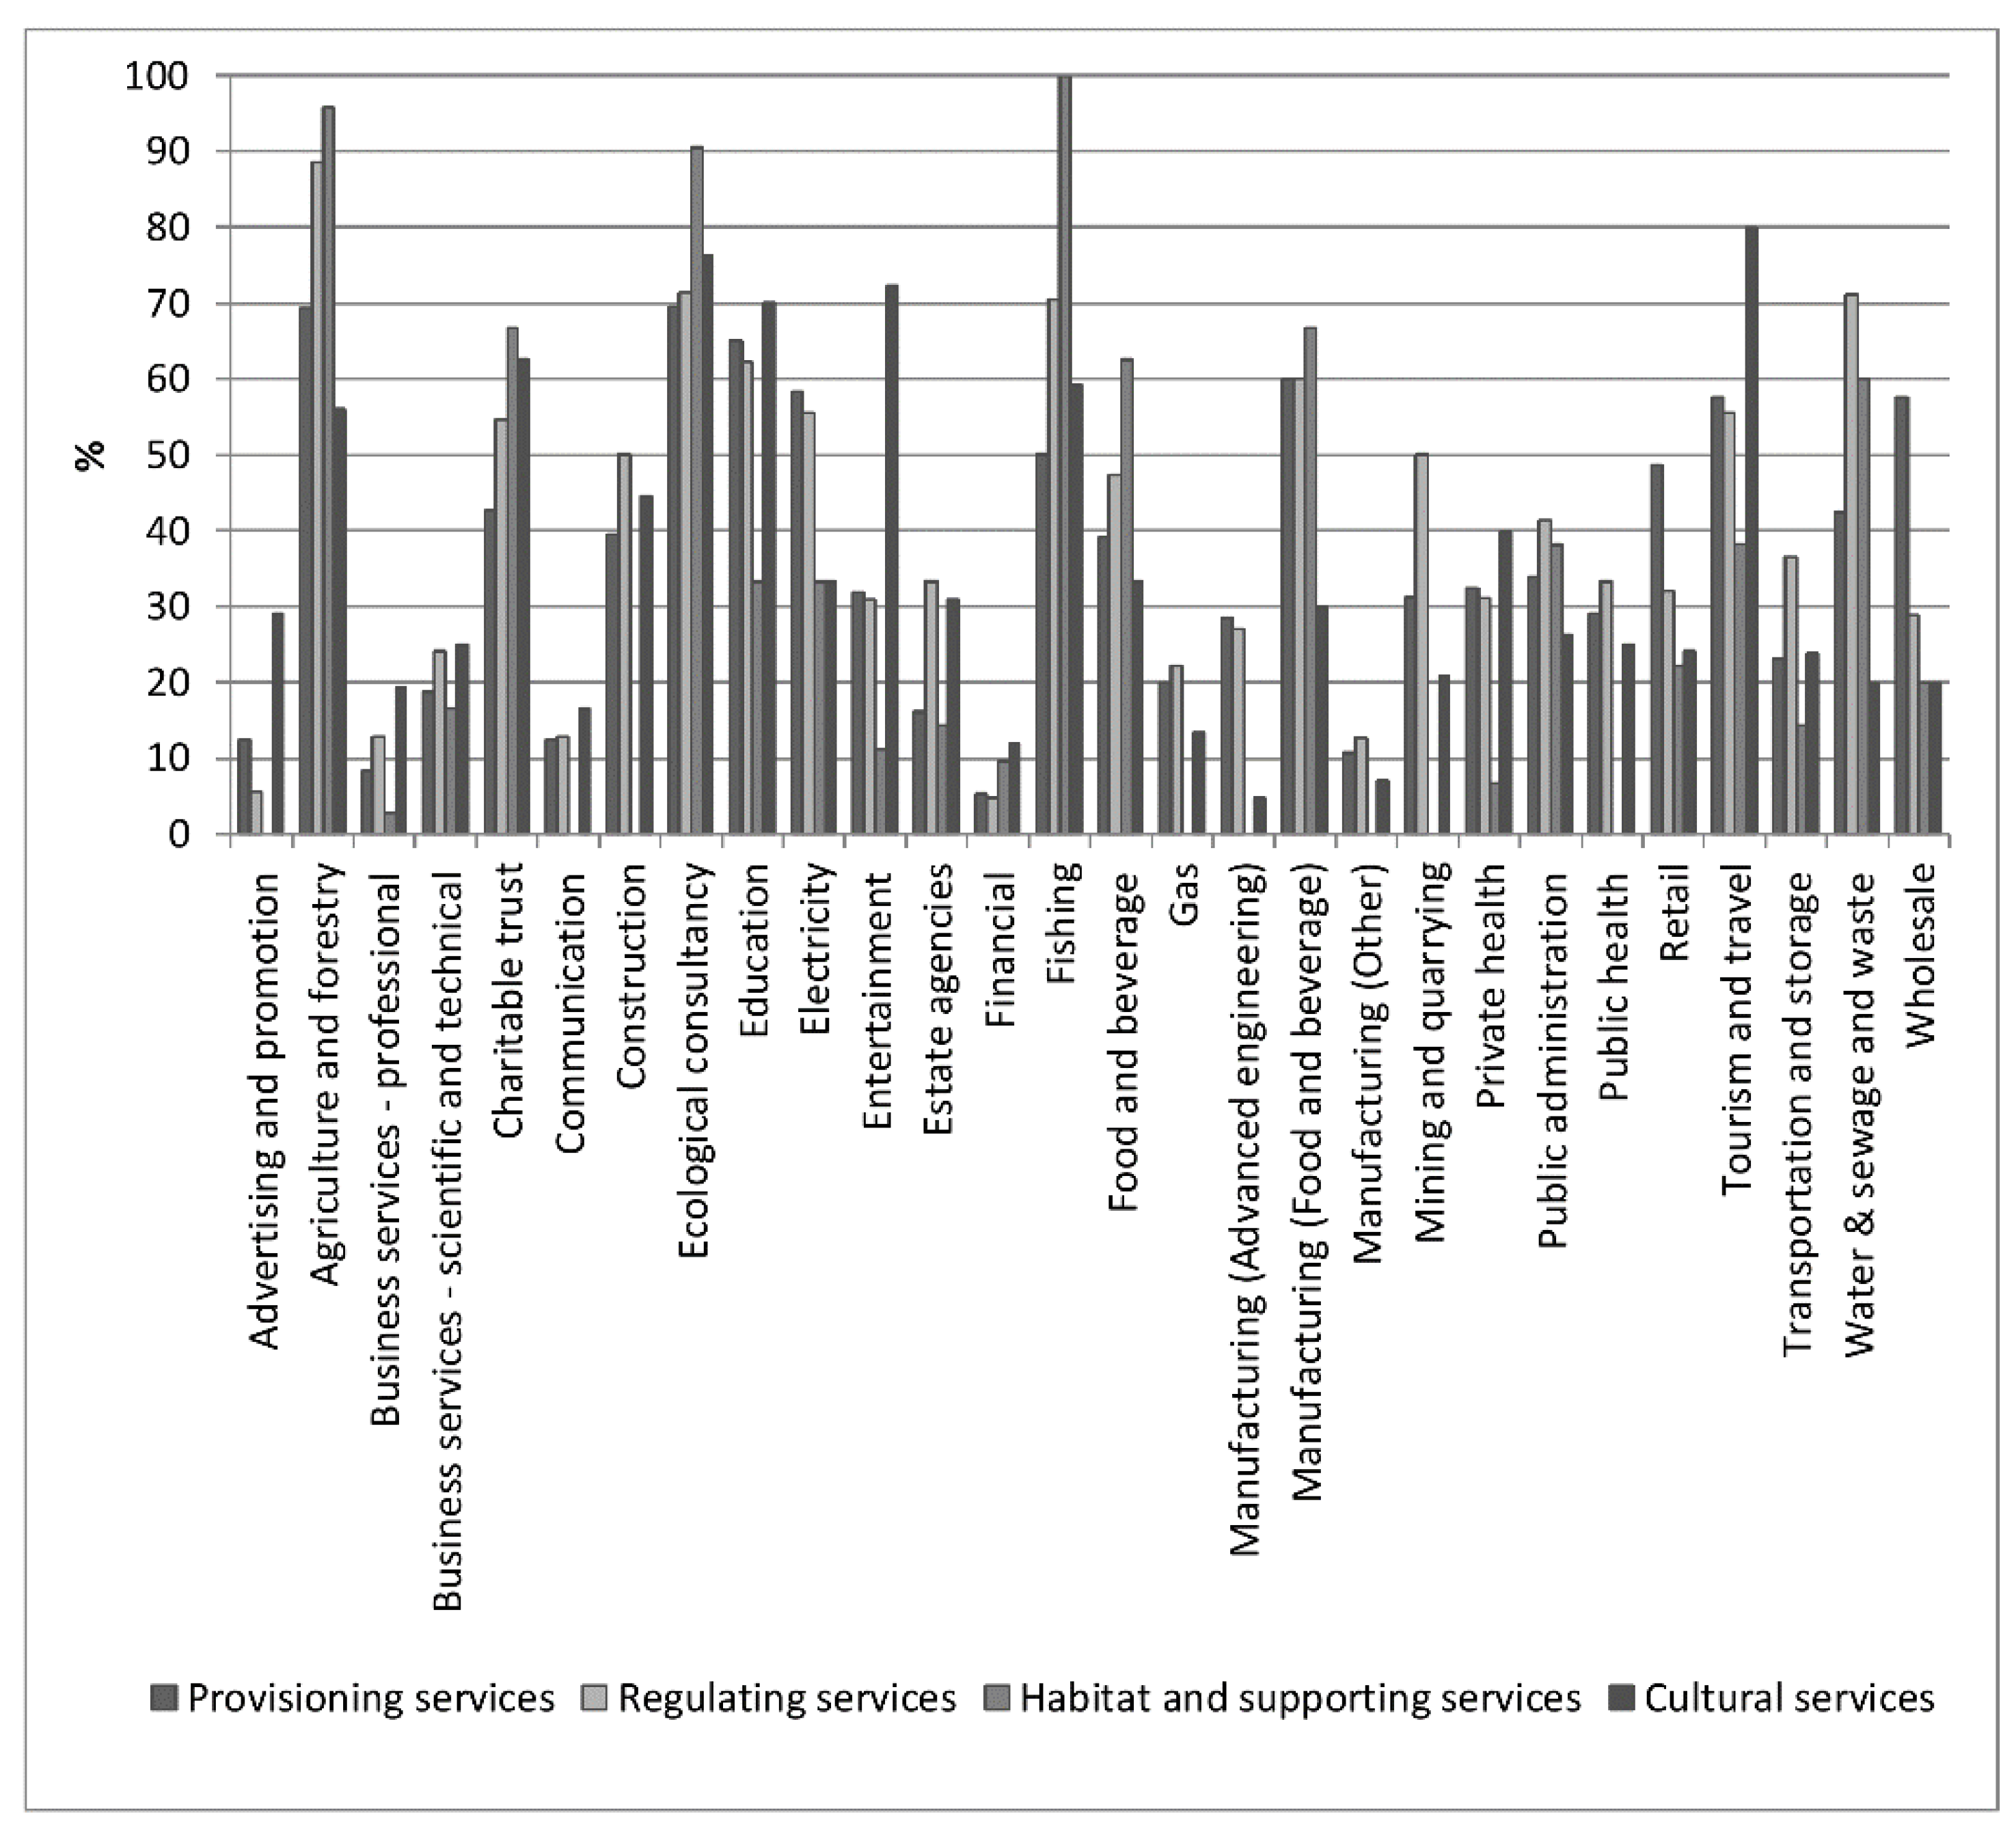
3.4. Comparison of the Perceptions of ES across Different Sectors

The degree of dependence on ES differed markedly between economic sectors (Table 2). Overall, the agricultural and forestry sector was associated with the highest dependence on ES (76% indicating “high dependence” or “entirely dependent”), with corresponding values for ecological consultancy, education, fishing and tourism and travel also being >60%. Conversely, sectors such as advertising, business services—professional, communication, financial services, gas, and manufacturing (advanced engineering and other) were each associated with <20% dependence.
The importance each business sector attributed to each ES category also varied; with businesses directly involved in protecting, extracting or manufacturing raw materials (e.g., agriculture, forestry, ecological consultants and food manufacturers) being more dependent on provisioning, regulatory and supporting ES than those operating in the service sector (e.g., communication, financial and tourism), who were more dependent on cultural ES.
The greatest dependence on provisioning ES was in the agricultural and forestry sector and ecological consultants (Figure 5), with the services of food (livestock) and timber production both scoring highly (>81% classified as “moderately” “highly” or “entirely” dependent, online Supplementary Materials Table S2). Other sectors that were associated with high dependence on provisioning services included: manufacturing (food and beverage) (60%), electricity (58%), tourism and travel (57%) and wholesale (57%). However, the dependence attributed by users to different ES also varied between sectors, with the food and drink manufacturing and wholesale sector considering food production (crops) important (80%), while the tourism and travel sector indicated the provisioning of freshwater to be the most important (80%). The electricity sector took a more balanced approach suggesting that no single provisioning service was the most important.
The fishing sector placed the highest importance on habitat and supporting ES (100%), followed again by the agricultural and forestry sector (95%) and ecological consultants (90%). Manufacturing (food and beverage) businesses also placed a high importance on habitat and supporting ES (66%) the fourth highest, followed in joint place by charitable trusts (66%), food and beverage (62%) and the water, sewage, and waste sector (60%). These sectors along many others recognized the importance of biodiversity, habitats for species and genetic flows within ecosystems, but this category also proved the most divisive with eight sectors placing no dependence (0%) on any of the supporting or habitat services.
Regulatory services were regarded as important by agriculture and forestry (88%), ecological consultancy (71%), water, sewage, and waste (71%), education (62%) and manufacturing (food and beverage) (60%). Compared to the other regulatory ES, the services of pest and disease control and pollination received the lowest mean scores (i.e., <50%), with exceptions from the agriculture and forestry, ecological consultancy and food and beverage sectors (i.e., >50%). The two sectors least dependent on regulatory services were manufacturing (other) (12%) and advertising and promotion (5%).
The tourism and travel sector was the most dependent on the cultural assets of Dorset (80%), suggesting these businesses derive the most benefits from leisure and tourism (100%), aesthetically attractive landscapes (95%) and places for recreation, mental and physical health (95%). Cultural services were also in high demand by: ecological consultants (76%), entertainment venues (72%), education authorities (70%) and charitable trusts (62%). Ecological consultants considered aesthetically attractive landscapes the most important cultural service (100%) while education and entertainment considered inspiration for culture, art, and design more important (71–100%). Spiritual experience generally received the lowest dependency score from all sectors with fifteen out of twenty-eight sectors indicating 0% dependency ( see online Table S2).

4. Discussion

All businesses impact and depend upon NC to some extent. However, business dependencies on ES are often difficult to quantify purely in financial terms because many ES, such as biodiversity, pollination, climate regulation, aesthetic landscapes, recreational values, and cultural heritage are intangible or immaterial and are typically not priced in economic markets [10,39,40], and hence are not accounted for in business decision making. While many of these ES fall outside traditional business accounts and reporting approaches, the ability to factor NC values into corporate decision making is becoming increasingly important, with new markets and regulations for ES requiring businesses to publicly report on their ES impacts and dependencies [14]. As such, it has been suggested by some authors e.g., [41,42] that a more nuanced assessment of the materiality of the environment can be achieved by assessing relevant stakeholders’ perceptions on their dependence on the goods and services provided by ecosystems. This study has attempted to address this knowledge gap.
In summary, the main findings of our results are that: (1) exactly 50% of the businesses did not consider themselves to be at all dependent on ES; (2) the highest businesses dependencies reported in this study were for regulating services (35% highly or entirely dependent), with lower corresponding values for the other categories, at 30–31%; (3) the degree of dependence differed markedly between individual ES, with values of no dependency ranging between 21% and 70% of businesses; and (4) businesses directly involved in protecting, extracting or manufacturing raw materials were more dependent on provisioning, regulatory and supporting ES than those operating in the service sector, who were conversely more dependent on cultural ES.
These findings contrast with suggestions made by TEEB (14) that all businesses depend to some degree on biodiversity and ES and that business dependency would most likely be highest for provisioning services. We attribute the high dependencies on regulating ES encountered here to the high dependencies recorded on water waste treatment, carbon sequestration and storage, micro-climate regulation and water quality, all of which are considered as regulating services. This finding is similar to other questionnaire-based studies from Spain [19,43], which found that regulating services were the most perceived by stakeholders linked to agriculturally-dominated landscapes. Our results are, however, at odds with current emerging ES decision-making frameworks, which often understate regulating services. Rather, they tend to focus on cultural and provisioning ES that have more obvious links to human wellbeing (e.g., in closer proximity to beneficiaries [44]). The lack of scientific knowledge surrounding the processes that provide regulatory services e.g., [45] and the fact that many of the benefits provide by these services are indirect and far removed from the businesses that utilize or experience them, also makes them prone to being overlooked [46]. This was observed in this study where the regulatory ES of carbon sequestration and storage were the least understood of all the ES. Two other key regulating services that were viewed as relatively unimportant by businesses included soil condition (64% not dependent) and the ES of pollination (70% not dependent). This is likely an outcome of businesses not recognizing that some of the largest impacts on natural capital can occur upstream of their value chains, particularly on farms where the value of these ES to agriculture is enormous and often underappreciated [47,48]. Recently efforts have focused on incorporating soils [49,50] and pollination [51,52] in ES frameworks that inform decision-making and environmental policies. A key challenge now will be to highlight to businesses the indirect benefits provided by underlying ecological processes to reduce future negative land use impacts. For example, soils provide many regulating services such as recycling of wastes or flood mitigation, both of which scored highly in this survey.
Interestingly, a high percentage (≥50%) of businesses choose to base their business in Dorset because of its heathlands, forests, and beaches, yet eight business sectors placed no dependence (0%) on any of the supporting or habitat services. This result is consistent with recent studies e.g., [17,53], which suggest that biodiversity and other supporting services are still an emerging issue for most businesses. While there is increasing evidence that business attitudes, behaviors and strategies regarding biodiversity are progressively changing [54,55], rapid biodiversity loss and ecosystem degradation are continuing at an alarming rate at the global scale [56], affecting all companies (knowingly or not) through their supply chains and growth objectives. For example, the landscapes and seascapes of Dorset have experienced dramatic change over the last century, with substantial increases in (agriculturally) improved grassland [57,58], loss of heathland [59,60] and an increasingly congested coastal zone [61,62]. The green economy now makes a very significant contribution to the wider economy of Dorset, [25], yet future economic growth can only be considered sustainable if the intrinsic value of Dorset’s natural assets is properly understood, fully costed and internalized within business decision making processes.
The question of how to assess the benefits of cultural services has been a difficult topic to address for businesses and policymakers alike, owing to their non-material and intangible nature [63,64]. Our results regarding the viewpoints of businesses on the role of cultural ES are in line with other studies [24,65] suggesting that “visible” services, such as tourism, recreation and aesthetic landscapes are more likely to be perceived to be important by respondents than “invisible” services such as cultural heritage and spiritual experience. The higher dependence on tourism and recreation services observed by many businesses is likely attributable to the high level of environmental brand awareness and the positive view of the impact of the AONB and Jurassic Coast designations held by Dorset’s visitors, businesses, and residents. This is illustrated by two separate studies [25,66] highlighting that the existence of these environmental designations, or brands, has increased the scale of jobs and benefits to the area considerably.
Property price was respectively ranked as the lowest reason for locating business activity in the county, which may suggest Dorset’s work-force is attracted to and retained not only by business opportunities, but also by a lifestyle in a high quality natural environment. At the same time, businesses indicated that good transport links and access to suppliers and markets to be of high importance for conducting business activity in the region. As such, new transport infrastructure projects will have to balance any net loss in NC with initiatives that explicitly aim to increase Dorset’s NC. This of course is not an issue that is exclusive to Dorset, with many businesses worldwide now publicly committing themselves to achieving no net loss (NNL), ecological neutrality or having a net positive impact (NPI) on ecosystems and their services [67,68].
The principal limitation of this study is the sampling procedure adopted. While the online survey methods used here are relatively easy to implement and can potentially reach a wide audience group, survey respondents are also likely to include a younger demographic and those with a high degree of education [69]. As this study was based on a combination of stratified sampling (i.e., a targeted chosen subset of business sectors from business directories) and convenience sampling (business members who were conveniently available to participate in the study via social media), it is also possible there may be an element of ‘selection bias’ with those businesses with a vested interest skewing the overall results. Putting these caveats aside, the response rate to the business survey was evenly spread across the spectrum of the twenty-eight different business sectors, suggesting these responses may be representative of the wider business community of Dorset. A further limitation was our consideration of businesses across Dorset as comprising a single sample, which could have obscured regional differences in business’ perceptions. These limitations could potentially be addressed by more comprehensive business surveys. For example, further work could usefully be done to compare ES dependencies between the relatively urban areas of East Dorset (including the towns of Bournemouth and Poole) and the more agriculturally orientated West and North Dorset districts.

5. Conclusions

Considering that effective management of all forms of NC is needed to both strengthen the environment and support economic development, a key future challenge for researchers and policymakers is to enable businesses to make decisions that appropriately reflect the values of ES [14]. Specifically, tools are required that can be used to help embed ES and NC concepts within the context of a business organization, which has been identified previously [70] as a critical research gap in sustainability and ES research. Analysis of business dependencies on ES flows, as presented here, can be of value in this context. Information on such dependencies can promote nexus-thinking [71,72] and help identify aspects of ES that are not well integrated within environmental management systems used by businesses. Information on business dependencies on both tangible and intangible ES is required to identify priorities for strategic business monitoring and reporting, with which companies can then set clear goals for ES actions. There is a particular need to encourage businesses to consider their possible dependencies on intangible or “invisible” ES such as: pollination, soil condition, biodiversity, cultural heritage, and spiritual experience. Based on current results, businesses are relatively unaware of their potential dependencies on these services. Currently several impact assessment methodologies (e.g., Life Cycle Analysis [56,73]) and business engagement strategies [74] exist that provide a practical approach for product-based decision making in business. Yet, such approaches are limited by a lack of suitable indicators and metrics of ES. We suggest that information on business dependencies on ES, as demonstrated here, can be of value to such monitoring and reporting processes, and offer a relatively low-cost method enabling companies to examine their own operations in relation to ES provision. The intrinsic values revealed by our Dorset business’ survey could also be expanded to include a monetary value of environmental quality, further enhancing their use to businesses. As policy makers and businesses are increasingly interested in measuring not only dependencies but also impacts of business activities on ES (including intangible values), future research could usefully involve development of methodologies linking drivers of environmental change to changes in NC condition and ES provision to identify the risks to business of ecosystem decline or deterioration.

Supplementary Materials

The following are available online at https://www.mdpi.com/2071-1050/10/5/1368/s1, S1: The Importance of Ecosystem Services for Businesses in Dorset questionnaire, Table S2: Aggregated percentages of the importance of ES to each business sector in Dorset.

Author Contributions

Adrian Newton had the initial idea for the study and drafted the initial pilot questionnaire. Stephen Watson contributed by refining and conducting the online questionnaire, analyzed the results and designed the overall structure of the paper. Stephen Watson wrote the paper with contribution from Adrian Newton.

Acknowledgments

This publication is part of a larger effort from the Mechanisms and Consequences of Tipping Points in Lowland Agricultural Landscapes (TPAL) project (www.tpalvaluing-nature.co.uk). The Valuing Nature Programme (www.valuing-nature.net.) is funded by the Natural Environment Research Council, the Economic and Social Research Council, the Biotechnology and Biological Sciences Research Council, the Arts and Humanities Research Council and the Department for Environment, Food and Rural Affairs. This work was supported by NERC grant reference number: NE/P007716/1 and the BU Open Access Publication Fund (OAPF). We are deeply grateful to Nigel Jump for his expertise and Maria Clarke, Dorset LNP Manager for their contributions and hard work during our survey. We also want to thank the local businesses of Dorset for taking the time to respond to the questionnaire

Conflicts of Interest

The founding sponsors had no role in the design of the study; in the collection, analyses, or interpretation of data; in the writing of the manuscript, and in the decision to publish the results. The views expressed are those of the author(s) and not necessarily those of the funders or the Valuing Nature Programme Coordination Team.

References

  1. Guerry, A.D.; Polasky, S.; Lubchenco, J.; Chaplin-Kramer, R.; Daily, G.C.; Griffin, R.; Ruckelshaus, M.; Bateman, I.J.; Duraiappah, A.; Elmqvist, T.; et al. Natural capital and ecosystem services informing decisions: From promise to practice. Proc. Natl. Acad. Sci. USA 2015, 112, 7348–7355. [Google Scholar] [CrossRef] [PubMed] [Green Version]
  2. Costanza, R.; de Groot, R.; Braat, L.; Kubiszewski, I.; Fioramonti, L.; Sutton, P.; Farber, S.; Grasso, M. Twenty years of ecosystem services: How far have we come and how far do we still need to go? Ecosyst. Serv. 2017, 28, 1–6. [Google Scholar] [CrossRef]
  3. Missemer, A. Natural Capital as an Economic Concept, History and Contemporary Issues. Ecol. Econ. 2018, 143, 90–96. [Google Scholar] [CrossRef]
  4. Bagstad, K.J.; Johnson, G.W.; Voigt, B.; Villa, F. Spatial dynamics of ecosystem service flows: A comprehensive approach to quantifying actual services. Ecosyst. Serv. 2013, 4, 117–125. [Google Scholar] [CrossRef]
  5. Maes, J.; Egoh, B.; Willemen, L.; Liquete, C.; Vihervaara, P.; Schägner, J.P.; Bouraoui, F. Mapping ecosystem services for policy support and decision making in the European Union. Ecosyst. Serv. 2012, 1, 31–39. [Google Scholar] [CrossRef]
  6. Verhagen, W.; Kukkala, A.S.; Moilanen, A.; van Teeffelen, A.J.; Verburg, P.H. Use of demand for and spatial flow of ecosystem services to identify priority areas. Conserv. Biol. 2017, 31, 860–871. [Google Scholar] [CrossRef] [PubMed]
  7. Beaumont, N.J.; Austen, M.C.; Mangi, S.C.; Townsend, M. Economic valuation for the conservation of marine biodiversity. Mar. Pollut. Bull. 2008, 56, 386–396. [Google Scholar] [CrossRef] [PubMed]
  8. Costanza, R.; de Groot, R.; Sutton, P.; Van der Ploeg, S.; Anderson, S.J.; Kubiszewski, I.; Turner, R.K. Changes in the global value of ecosystem services. Glob. Environ. Chang. 2014, 26, 152–158. [Google Scholar] [CrossRef]
  9. Fisher, B.; Turner, R.K.; Morling, P. Defining and classifying ecosystem services for decision making. Ecol. Econ. 2009, 68, 643–653. [Google Scholar] [CrossRef]
  10. De Groot, R.S.; Alkemade, R.; Braat, L.; Hein, L.; Willemen, L. Challenges in integrating the concept of ecosystem services and values in landscape planning, management and decision making. Ecol. Complex. 2010, 7, 260–272. [Google Scholar] [CrossRef]
  11. Helm, D. Natural capital. In Valuing the Planet; Yale University Press: New Haven, CT, USA; London, UK, 2015. [Google Scholar]
  12. Juniper, T. What Has Nature Ever Done for Us; Profile Books: London, UK, 2013. [Google Scholar]
  13. The Economics of Ecosystems and Biodiversity. TEEB Report for Business—Executive Summary. United Nations Environment Programme and TEEB; TEEB: Geneva, Switzerland, 2010. [Google Scholar]
  14. The Economics of Ecosystems and Biodiversity. The Economics of Ecosystems and Biodiversity in Business and Enterprise; Joshua, B., Ed.; Earthscan: London, UK; New York, NY, USA, 2012. [Google Scholar]
  15. Belt, M.; Blake, D. Investing in natural capital and getting returns: An ecosystem service approach. Bus. Strateg. Environ. 2015, 24, 667–677. [Google Scholar] [CrossRef]
  16. Cranston, G.R.; Green, J.M.H.; Tranter, H.R. Doing Business with Nature: Opportunities from Natural Capital; Report by the Natural Capital Leaders Platform; CISL: Cambridge, UK, 2015. [Google Scholar]
  17. Houdet, J.; Trommetter, M.; Weber, J. Understanding changes in business strategies regarding biodiversity and ecosystem services. Ecol. Econ. 2012, 73, 37–46. [Google Scholar] [CrossRef]
  18. Reddy, S.M.; McDonald, R.I.; Maas, S.; Rogers, A.; Girvetz, E.H.; North, J.; DiMuro, J.L. Finding solutions to water scarcity: Incorporating ecosystem service values into business planning at The Dow Chemical Company’s Freeport, TX facility. Ecosyst. Serv. 2015, 12, 94–107. [Google Scholar] [CrossRef]
  19. Casado-Arzuaga, I.; Madariaga, I.; Onaindia, M. Perception, demand and user contribution to ecosystem services in the Bilbao Metropolitan Greenbelt. J. Environ. Manag. 2013, 129, 33–43. [Google Scholar] [CrossRef] [PubMed]
  20. Wan, M.; D’Amato, D.; Toppinen, A.; Rekola, M. Forest Company Dependencies and Impacts on Ecosystem Services: Expert Perceptions from China. Forests 2017, 8, 134. [Google Scholar] [CrossRef]
  21. Xun, F.; Hu, Y.; Lv, L.; Tong, J. Farmers’ Awareness of Ecosystem Services and the Associated Policy Implications. Sustainability 2017, 9, 1612. [Google Scholar] [CrossRef]
  22. Natural Capital Coalition. The Natural Capital Protocol. 2016. Available online: https://is.gd/e2cMwj (accessed on 2 February 2018).
  23. Hime, S.; Cranston, G. The Commercial Logic to Measuring Natural Capital; Working Paper 03/2017; University of Cambridge Institute for Sustainability Leadership (CISL): Cambridge, UK, 2017. [Google Scholar]
  24. Lamarque, P.; Tappeiner, U.; Turner, C.; Steinbacher, M.; Bardgett, R.D.; Szukics, U.; Schermer, M.; Lavorel, S. Stakeholder perceptions of grassland ecosystem services in relation to knowledge on soil fertility and biodiversity. Reg. Environ. Chang. 2011, 11, 791–804. [Google Scholar] [CrossRef]
  25. Ash Futures Ltd. Dorset’s Environmental Economy; Dorset County Council: Dorchester, UK, 2015. [Google Scholar]
  26. Dorset Local Nature Partnership. The Natural Place for Business: A Natural Capital Investment Strategy for Dorset; DLNP: Dorchester, UK, 2016; p. 16. [Google Scholar]
  27. Burrows Communications Ltd. Bournemouth, Poole, Christchurch and East Dorset Business Directory. 2014–2016. Available online: http://www.burrows.co.uk/bournemouth/files/assets/common/downloads/publication.pdf (accessed on 2 February 2018).
  28. The Dorset Business Directory: Free Business Listings. Idorset.co.uk. 2018. Available online: http://www.idorset.co.uk (accessed on 2 February 2018).
  29. West Dorset Business Directory|Search by Town|. 2018. Available online: http://www.westdorset.org.uk/directory/list.php?cood=dorchester (accessed on 2 February 2018).
  30. Dorset Chamber of Commerce and Industry. Members Directory—Dorset Chamber of Commerce and Industry. 2018. Available online: https://www.dorsetchamber.co.uk/membership/members-directory (accessed on 2 February 2018).
  31. Dorsetlnp.org.uk. Partners and Stakeholders. 2018. Available online: https://www.dorsetlnp.org.uk/Partners_and_Stakeholders.html (accessed on 2 February 2018).
  32. Likert, R. A Technique for the Measurement of Attitudes; Columbia University Press: New York, NY, USA, 1931. [Google Scholar]
  33. Shih, T.H.; Fan, X. Comparing response rates in e-mail and paper surveys: A meta-analysis. Educ. Res. Rev. 2009, 4, 26–40. [Google Scholar] [CrossRef]
  34. Hassan, R.; Scholes, R.; Ash, N. Findings of the Condition and Trends Working Group of the Millennium Ecosystem Assessment. In Ecosystems and Human Well-Being: Current State and Trends; Island Press: Washington, DC, USA, 2005; Volume 1, p. 917. [Google Scholar]
  35. UK National Ecosystem Assessment. The UK National Ecosystem Assessment: Synthesis of the Key Findings; UNEP-WCMC: Cambridge, UK, 2011; p. 85. [Google Scholar]
  36. Haines-Young, R.H.; Potschin, M. CICES V4.3—Revised Report Prepared Following Consultation on CICES Version 4, August–December 2012, EEA Framework Contract No EEA/IEA/09/003; University of Nottingham: Nottingham, UK, 2013. [Google Scholar]
  37. Landers, D.H.; Nahlik, A.M. Final Ecosystem Goods and Services Classification System (FEGS-CS); EPA/600/R-13/ORD-004914; Standard Industrial Classification of Economic Activities (SIC); House, C., Ed.; U.S. Environmental Protection Agency, Office of Research and Development: Washington, DC, USA, 2013.
  38. House, C. Standard Industrial Classification of Economic Activities (SIC). Available online: https://www.gov.uk/government/publications/standard-industrial-classification-of-economic-activities-sic (accessed on 2 February 2018).
  39. Daily, G.C.; Polasky, S.; Goldstein, J.; Kareiva, P.M.; Mooney, H.A.; Pejchar, L.; Ricketts, T.H.; Salzman, J.; Shallenberger, R. Ecosystem services in decision making: Time to deliver. Front. Ecol. Environ. 2009, 7, 21–28. [Google Scholar] [CrossRef]
  40. Small, N.; Munday, M.; Durance, I. The challenge of valuing ecosystem services that have no material benefits. Glob. Environ. Chang. 2017, 44, 57–67. [Google Scholar] [CrossRef]
  41. De Juan, S.; Gelcich, S.; Fernandez, M. Integrating stakeholder perceptions and preferences on ecosystem services in the management of coastal areas. Ocean Coast. Manag. 2017, 136, 38–48. [Google Scholar] [CrossRef]
  42. Simpson, S.; Brown, G.; Peterson, A.; Johnstone, R. Stakeholder perspectives for coastal ecosystem services and influences on value integration in policy. Ocean Coast. Manag. 2016, 126, 9–21. [Google Scholar] [CrossRef]
  43. Martín-López, B.; Iniesta-Arandia, I.; García-Llorente, M.; Palomo, I.; Casado-Arzuaga, I.; Del Amo, D.G.; Gómez-Baggethun, E.; Oteros-Rozas, E.; Palacios-Agundez, I.; Willaarts, B.; et al. Uncovering ecosystem service bundles through social preferences. PLoS ONE 2012, 7, e38970. [Google Scholar] [CrossRef] [PubMed]
  44. Sutherland, I.J.; Villamagna, A.M.; Dallaire, C.O.; Bennett, E.M.; Chin, A.T.; Yeung, A.C.; Lamothe, K.A.; Tomscha, S.A.; Cormier, R. Undervalued and under pressure: A plea for greater attention toward regulating ecosystem services. Ecol. Indic. 2017, in press. [Google Scholar] [CrossRef]
  45. Watson, S.C.; Paterson, D.M.; Queirós, A.M.; Rees, A.P.; Stephen, N.; Widdicombe, S.; Beaumont, N.J. A conceptual framework for assessing the ecosystem service of waste remediation: In the marine environment. Ecosyst. Serv. 2016, 20, 69–81. [Google Scholar] [CrossRef] [Green Version]
  46. Beaumont, N.J.; Jones, L.; Garbutt, A.; Hansom, J.D.; Toberman, M. The value of carbon sequestration and storage in coastal habitats. Estuar. Coast. Shelf Sci. 2014, 137, 32–40. [Google Scholar] [CrossRef] [Green Version]
  47. Dominati, E.; Patterson, M.; Mackay, A. A framework for classifying and quantifying the natural capital and ecosystem services of soils. Ecol. Econ. 2010, 69, 1858–1868. [Google Scholar] [CrossRef]
  48. Power, A.G. Ecosystem services and agriculture: Tradeoffs and synergies. Philos. Trans. R. Soc. Lond. B Biol. Sci. 2010, 365, 2959–2971. [Google Scholar] [CrossRef] [PubMed]
  49. Adhikari, K.; Hartemink, A.E. Linking soils to ecosystem services—A global review. Geoderma 2016, 262, 101–111. [Google Scholar] [CrossRef]
  50. Baveye, P.C.; Baveye, J.; Gowdy, J. Soil “ecosystem” services and natural capital: Critical appraisal of research on uncertain ground. Front. Environ. Sci. 2016, 4, 41. [Google Scholar] [CrossRef]
  51. Rose, T.; Kremen, C.; Thrupp, A.; Gemmill-Herren, B.; Graub, B.; Azzu, N. Policy Analysis Paper: Policy Mainstreaming o Biodiversity and Ecosystem Services with a Focus on Pollination; Food and Agricultural Organisation of United Nations: Rome, Italy, 2014. [Google Scholar]
  52. Melathopoulos, A.P.; Cutler, G.C.; Tyedmers, P. Where is the value in valuing pollination ecosystem services to agriculture? Ecol. Econ. 2015, 109, 59–70. [Google Scholar] [CrossRef]
  53. Potdar, A.; Gautam, R.; Singh, A.; Unnikrishnan, S.; Naik, N. Business reporting on biodiversity and enhancement of conservation initiatives. Int. J. Biodivers. Sci. Ecosyst. Serv. Manag. 2016, 12, 227–236. [Google Scholar] [CrossRef]
  54. Athanas, A.; Bishop, J.; Cassara, A.; Donaubauer, P.; Perceval, C.; Rafiq, M.; Ranganathan, J.; Risgaard, P. Ecosystem Challenges and Business Implications. Available online: https://www.wbcsd.org/Clusters/Natural-Capital-and-Ecosystems/Resources/Issue-brief-Ecosystems-Challenges-and-Business-Implications (accessed on 2 February 2018).
  55. Van den Belt, M.; Stevens, S.M. Transformative agenda, or lost in the translation? A review of top-cited articles in the first four years of Ecosystem Services. Ecosyst. Serv. 2016, 22, 60–72. [Google Scholar] [CrossRef]
  56. Hooper, D.U.; Adair, E.C.; Cardinale, B.J.; Byrnes, J.E.; Hungate, B.A.; Matulich, K.L.; Gonzalez, A.; Duffy, E.; Gamfeldt, L.; O’Connor, M.I. A global synthesis reveals biodiversity loss as a major driver of ecosystem change. Nature 2012, 486, 105. [Google Scholar] [CrossRef] [PubMed]
  57. Hooftman, D.A.P.; Bullock, J.M. Mapping to inform conservation: A case study of changes in semi-natural habitats and their connectivity over 70 years. Biol. Conserv. 2012, 145, 30–38. [Google Scholar] [CrossRef]
  58. Jiang, M.; Bullock, J.M.; Hooftman, D.A. Mapping ecosystem service and biodiversity changes over 70 years in a rural English county. J. Appl. Ecol. 2013, 50, 841–850. [Google Scholar] [CrossRef]
  59. Moore, N.W. The heaths of Dorset and their conservation. J. Ecol. 1962, 50, 369–391. [Google Scholar] [CrossRef]
  60. Cordingley, J.E.; Newton, A.C.; Rose, R.J.; Clarke, R.T.; Bullock, J.M. Habitat fragmentation intensifies trade-offs between biodiversity and ecosystem services in a heathland ecosystem in southern England. PLoS ONE 2015, 10, e0130004. [Google Scholar] [CrossRef] [PubMed] [Green Version]
  61. Simón, F.J.G.; Narangajavana, Y.; Marqués, D.P. Carrying capacity in the tourism industry: A case study of Hengistbury Head. Tour. Manag. 2004, 25, 275–283. [Google Scholar] [CrossRef]
  62. Dickinson, J.E.; Robbins, D. Representations of tourism transport problems in a rural destination. Tour. Manag. 2008, 29, 1110–1121. [Google Scholar] [CrossRef]
  63. Chan, K.M.; Satterfield, T.; Goldstein, J. Rethinking ecosystem services to better address and navigate cultural values. Ecol. Econ. 2012, 74, 8–18. [Google Scholar] [CrossRef]
  64. Smith, M.; Ram, Y. Tourism, landscapes and cultural ecosystem services: A new research tool. Tour. Recreat. Res. 2017, 42, 113–119. [Google Scholar] [CrossRef]
  65. Lewan, L.; Söderqvist, T. Knowledge and recognition of ecosystem services among the general public in a drainage basin in Scania, Southern Sweden. Ecol. Econ. 2002, 42, 459–467. [Google Scholar] [CrossRef]
  66. Dorset Local Nature Partnership. The State of Dorset’s Environment; DLNP: Dorchester, UK, 2014. [Google Scholar]
  67. Madsen, B.; Carroll, N.; Moore, B.K. State of Biodiversity Markets Report: Offset and Compensation Programs Worldwide; Ecosystem Marketplace: Washington, DC, USA, 2010; Available online: www.ecosystemmarketplace.com/documents/acrobat/sbdmr.pdf (accessed on 2 February 2018).
  68. Rainey, H.J.; Pollard, E.H.; Dutson, G.; Ekstrom, J.M.; Livingstone, S.R.; Temple, H.J.; Pilgrim, J.D. A review of corporate goals of No Net Loss and Net Positive Impact on biodiversity. Oryx 2015, 49, 232–238. [Google Scholar] [CrossRef]
  69. Ranacher, L.; Lähtinen, K.; Järvinen, E.; Toppinen, A. Perceptions of the general public on forest sector responsibility: A survey related to ecosystem services and forest sector business impacts in four European countries. For. Policy Econ. 2017, 78, 180–189. [Google Scholar] [CrossRef]
  70. Sala, S.; Ciuffo, B.; Nijkamp, P. A systemic framework for sustainability assessment. Ecol. Econ. 2015, 119, 314–325. [Google Scholar] [CrossRef]
  71. Luque, S.; Fürst, C.; Geneletti, D. Nexus Thinking—How Ecosystem Services Concepts and Practice Can Contribute Balancing Integrative Resource Management through Facilitating Cross-Scale and Cross-Sectoral Planning; Taylor & Francis: Oxford, UK, 2017; pp. 1–3. [Google Scholar]
  72. Green, J.M.; Cranston, G.R.; Sutherland, W.J.; Tranter, H.R.; Bell, S.J.; Benton, T.G.; Brown, C. Research priorities for managing the impacts and dependencies of business upon food, energy, water and the environment. Sustain. Sci. 2017, 12, 319–331. [Google Scholar] [CrossRef]
  73. Notarnicola, B.; Sala, S.; Anton, A.; McLaren, S.J.; Saouter, E.; Sonesson, U. The role of life cycle assessment in supporting sustainable agri-food systems: A review of the challenges. J. Clean. Prod. 2017, 140, 399–409. [Google Scholar] [CrossRef]
  74. Beumer, C.; Martens, P. IUCN and perspectives on biodiversity conservation in a changing world. Biodivers. Conserv. 2013, 22, 3105–3120. [Google Scholar] [CrossRef]
Figure 1. Map of Dorset, showing the Areas of Outstanding Natural Beauty (AONB) and the Jurassic Coast.
Sustainability 10 01368 g001
Figure 2. Proportion of total responses by business sector [38], completed by Dorset businesses reporting their dependence on ecosystem services (n = 212).
Sustainability 10 01368 g002
Figure 3. Level of agreement on the importance of socio-ecological factors in locating business activity in Dorset (n = 212). * Full title: Availability of people with skills in ecology, the environment or nature.
Sustainability 10 01368 g003
Figure 4. Level of agreement on the importance of materials produced in Dorset for business (n = 212).
Sustainability 10 01368 g004
Figure 5. Percentages of businesses’ demand of ES (provisioning, regulating, habitat and supporting and cultural), by sector.
Sustainability 10 01368 g005
Table 1. Comparison of the importance of ES to businesses in Dorset, split into “provisioning”, “regulating”, “habitat and supporting services”, and “cultural” ES as categorized in the TEEB framework (2010) (n = 212).
Ecosystem ServicesDon’t KnowNot at All DependentSomewhat DependentModerately DependentHighly DependentEntirely Dependent
Provisioning services
Food production (crops)2%58%7%5%10%18%
Food production (livestock)2%61%7%6%9%15%
Freshwater fishing3%62%5%5%9%16%
Marine fishing (including shellfish)3%62%4%6%8%16%
Minerals3%49%7%9%15%18%
Renewable biofuels2%51%5%11%20%11%
The provisioning of freshwater1%22%13%11%25%28%
Timber production2%53%10%9%11%15%
Provisioning overall2%52%7%8%13%17%
Regulating services
Carbon sequestration and storage6%34%11%8%21%21%
Coastal protection1%52%6%9%18%14%
Good soil condition2%64%5%4%8%17%
Micro-climate regulation3%31%8%12%26%21%
Noise regulation1%49%13%15%11%11%
Pest and disease control0%63%4%4%14%14%
Pollination1%70%5%1%6%17%
Waste-water treatment1%21%15%11%24%26%
Water quality0%34%12%7%16%30%
Regulating overall2%46%9%8%16%19%
Habitat and supporting services
Biodiversity (wildlife)1%53%10%3%11%22%
Habitats for species0%57%7%3%11%22%
Maintenance of genetic diversity1%65%4%2%10%18%
Habitat and supporting overall1%58%7%3%10%21%
Cultural services
Aesthetically attractive landscapes0%44%7%12%14%23%
Cultural heritage0%51%12%9%14%15%
Inspiration for culture, art, and design1%55%8%6%12%18%
Leisure and tourism1%32%11%15%18%24%
Recreation, mental and physical health0%48%10%6%17%18%
Spiritual experience2%67%13%4%5%9%
Cultural overall1%49%10%9%13%18%
All ES overall2%50%8%7%14%18%
Table 2. Percentages of businesses who demanded ES, by each business sector.
Business SectorES Mean DependencyBusiness Sector ES Mean Dependency
Advertising and promotion13%Food and beverage43%
Agriculture and forestry76%Gas17%
Business services—professional services12%Manufacturing (Advanced engineering)19%
Business services—scientific and technical22%Manufacturing (Food and beverage)54%
Charitable trust54%Manufacturing (Other)9%
Communication12%Mining and quarrying32%
Construction40%Private health31%
Ecological consultancy74%Public administration35%
Education62%Public health26%
Electricity49%Retail34%
Entertainment38%Tourism and travel60%
Estate agencies25%Transportation and storage27%
Financial services7%Water and sewage and waste49%
Fishing65%Wholesale35%

