Carbon Footprint Estimation Tool for Residential Buildings for Non-Specialized Users: OERCO2 Project

 and
and 
Abstract
:1. Introduction
- -
- The manufacturing and construction phase of a building’s life cycle, which is usually concentrated into a short period of time (1–2 years), causes the most intensive environmental impact. This is mainly due to the consumption of concrete and steel for the structure, both of which represent a high percentage of the emissions produced during this phase [23,24]. This impact is reduced the longer the building’s service life is considered; however, the decisions made during this phase greatly influence the results of the other life-cycle phases of the building.
- -
- The use and maintenance phase is generally responsible for 80–90% of the CO2 emissions generated during a building’s life cycle [25], almost 60% of which is caused by the energy demand for heating and air-conditioning [26]. An operational phase of more than 50 years duration reduces emissions and this should be a primary goal.
- -
- Reductions in energy consumption during the use and maintenance phase should be achieved through decisions made during the design phase, which implies the use of materials with a higher embodied energy. This means that, in nearly-zero-energy buildings, the emissions during the construction phase represent a higher percentage of the total emissions of the entire life cycle [27]. Therefore, once the operational energy has been reduced, attention should be focused on the development of new insulation materials that require less energy to manufacture [28].
2. Materials and Methods
2.1. OERCO2 Project
- Studying the methodology for the calculation of CO2 emissions of the construction process and throughout the life cycle of materials at European level.
- Establishing a common European curriculum in this area, thus increasing awareness of climate change and providing information on the emissions generated by each element.
- Developing an Open Educational Resource (OER) to spread knowledge on CO2 emissions in construction processes.
- Launching an online tool accessible to all building agents (students, professionals, etc.) at European level. Specialized knowledge on the environmental impact of building processes is not necessary for its use.
2.2. OERCO2 Tool
3. Case Studies
4. Results and Discussion
5. Conclusions
Author Contributions
Acknowledgments
Conflicts of Interest
References
- González-Vallejo, P.; Marrero, M.; Solís-Guzmán, J. The ecological footprint of dwelling construction in Spain. Ecol. Indic. 2015, 52, 75–84. [Google Scholar] [CrossRef]
- Giesekam, J.; Barrett, J.; Taylor, P.; Owen, A. The greenhouse gas emissions and mitigation options for materials used in UK construction. Energy Build. 2014, 78, 202–214. [Google Scholar] [CrossRef]
- Giesekam, J.; Barrett, J.R.; Taylor, P. Construction sector views on low carbon building materials. Build. Res. Inf. 2016, 44, 423–444. [Google Scholar] [CrossRef]
- International Organization for Standardization (ISO). Environmental Labels and Declarations—General Principles; UNE-EN ISO 14020; ISO: Geneva, Switzerland, 2002. [Google Scholar]
- International Organization for Standardization (ISO). Environmental Labels and Declarations—Self-Declared Environmental Claims (Type II Environmental Labelling); UNE-EN ISO 14021; ISO: Geneva, Switzerland, 2017. [Google Scholar]
- International Organization for Standardization (ISO). Environmental Labels and Declarations—Type III Environmental Declarations—Principles and Procedures; UNE-EN ISO 14025; ISO: Geneva, Switzerland, 2006. [Google Scholar]
- International Organization for Standardization (ISO). Sustainability of Construction Works—Environmental Product declarations—Core Rules for the Product Category of Construction Products; UNE-EN 15804; ISO: Geneva, Switzerland, 2012. [Google Scholar]
- International Organization for Standardization (ISO). Environmental Management—Life Cycle Assessment—Principles and Framework; UNE-EN ISO 14040; ISO: Geneva, Switzerland, 2006. [Google Scholar]
- International Organization for Standardization (ISO). Environmental Management—Life Cycle Assessment—Requirements and Guidelines; UNE-EN ISO 14044; ISO: Geneva, Switzerland, 2006. [Google Scholar]
- International Organization for Standardization (ISO). Sustainability of Construction Works. Assessment of Environmental Performance of Buildings. Calculation Method; UNE-EN 15978; ISO: Geneva, Switzerland, 2012. [Google Scholar]
- International Organization for Standardization (ISO). Buildings and Constructed Assets—Service Life Planning—Part 5: Life-Cycle Costing; ISO 15686-5; ISO: Geneva, Switzerland, 2017. [Google Scholar]
- International Organization for Standardization (ISO). Environmental Management Systems—Requirements with Guidance for Use; UNE-EN ISO 14001; ISO: Geneva, Switzerland, 2015. [Google Scholar]
- Weidema, B.P.; Thrane, M.; Christensen, P.; Schmidt, J.; Lokke, S. Carbon footprint: A catalyst for life cycle assessment? J. Ind. Ecol. 2008, 12, 3–6. [Google Scholar] [CrossRef]
- Cagiao, J.; Gómez, B.; Doménech, J.L.; Gutiérrez Mainar, S.; Gutiérrez Lanza, H. Calculation of the corporate carbon footprint of the cement industry by the application of MC3 methodology. Ecol. Indic. 2011, 11, 1526–1540. [Google Scholar] [CrossRef]
- Bare, J.C.; Hofstetter, P.; Pennington, D.W.; Haes, H.A.U. Midpoints versus endpoints: The sacrifices and benefits. Int. J. Life Cycle Assess. 2000, 5, 319–326. [Google Scholar] [CrossRef]
- Dossche, C.; Boel, V.; De Corte, W. Use of Life Cycle Assessments in the Construction Sector: Critical Review. Proc. Eng. 2017, 171, 302–311. [Google Scholar] [CrossRef]
- Geng, S.; Wang, Y.; Zuo, J.; Zhou, Z.; Du, H.; Mao, G. Building life cycle assessment research: A review by bibliometric analysis. Renew. Sustain. Energy Rev. 2017, 76, 176–184. [Google Scholar] [CrossRef]
- Buyle, M.; Braet, J.; Audenaert, A. Life cycle assessment in the construction sector: A review. Renew. Sustain. Energy Rev. 2013, 26, 379–388. [Google Scholar] [CrossRef]
- Ramesh, T.; Prakash, R.; Shukla, K.K. Life cycle energy analysis of buildings: An overview. Energy Build. 2010, 42, 1592–1600. [Google Scholar] [CrossRef]
- Schwartz, Y.; Raslan, R.; Mumovic, D. The life cycle carbon footprint of refurbished and new buildings—A systematic review of case studies. Renew. Sustain. Energy Rev. 2018, 81, 231–241. [Google Scholar] [CrossRef]
- Chau, C.K.; Leung, T.M.; Ng, W.Y. A review on life cycle assessment, life cycle energy assessment and life cycle carbon emissions assessment on buildings. Appl. Energy 2015, 143, 395–413. [Google Scholar] [CrossRef]
- Cabeza, L.F.; Rincón, L.; Vilariño, V.; Pérez, G.; Castell, A. Life cycle assessment (LCA) and life cycle energy analysis (LCEA) of buildings and the building sector: A review. Renew. Sustain. Energy Rev. 2014, 29, 394–416. [Google Scholar] [CrossRef]
- Asif, M.; Muneer, T.; Kelley, R. Life cycle assessment: A case study of a dwelling home in Scotland. Build. Environ. 2007, 42, 1391–1394. [Google Scholar] [CrossRef]
- Dimoudi, A.; Tompa, C. Energy and environmental indicators related to construction of office buildings. Resour. Conserv. Recycl. 2008, 53, 86–95. [Google Scholar] [CrossRef]
- Radhi, H.; Sharples, S. Global warming implications of facade parameters: A life cycle assessment of residential buildings in Bahrain. Environ. Impact Assess. Rev. 2013, 38, 99–108. [Google Scholar] [CrossRef]
- You, F.; Hu, D.; Zhang, H.; Guo, Z.; Zhao, Y.; Wang, B.; Yuan, Y. Carbon emissions in the life cycle of urban building system in China-A case study of residential buildings. Ecol. Complex. 2011, 8, 201–212. [Google Scholar] [CrossRef]
- Cellura, M.; Guarino, F.; Longo, S.; Mistretta, M. Energy life-cycle approach in Net zero energy buildings balance: Operation and embodied energy of an Italian case study. Energy Build. 2014, 72, 371–381. [Google Scholar] [CrossRef]
- Scheuer, C.; Keoleian, G.A.; Reppe, P. Life cycle energy and environmental performance of a new university building: Modeling challenges and design implications. Energy Build. 2003, 35, 1049–1064. [Google Scholar] [CrossRef]
- SpainGBC LEED Certificate. Available online: http://www.spaingbc.org/web/leed-4.php (accessed on 22 December 2017).
- BREEAM BREEAM ES Website. Available online: http://www.breeam.es/ (accessed on 22 December 2017).
- SpainGBC VERDE Tool Website. Available online: http://www.gbce.es/es/pagina/herramientas-de-evaluacion-de-edificios (accessed on 22 December 2017).
- Asociación Ecómetro Ecometro LCA Tool Website. Available online: http://acv.ecometro.org/ (accessed on 22 December 2017).
- Spain METDA Simplified Procedures for Building Energy Certification. Available online: http://www.minetur.gob.es/ENERGIA/DESARROLLO/EFICIENCIAENERGETICA/CERTIFICACIONENERGETICA/DOCUMENTOSRECONOCIDOS/Paginas/procedimientos-certificacion-proyecto-terminados.aspx (accessed on 22 December 2017).
- Spain MPW Unified Tool LIDER-CALENER. Available online: http://www.codigotecnico.org/index.php/menu-recursos/menu-aplicaciones/282-herramienta-unificada-lider-calener (accessed on 22 December 2017).
- CYPE Ingenieros CYPETHERM HE. Available online: http://cypeterm-he.cype.es/ (accessed on 22 December 2017).
- ITeC BEDEC Website. Available online: http://www.itec.es/nouBedec.e/bedec.aspx (accessed on 3 December 2013).
- Ecoinvent Association Ecoinvent Database v3. Available online: http://www.ecoinvent.org/database/database.html (accessed on 18 March 2018).
- Martínez-Rocamora, A.; Solís-Guzmán, J.; Marrero, M. LCA databases focused on construction materials: A review. Renew. Sustain. Energy Rev. 2016, 58, 565–573. [Google Scholar] [CrossRef]
- PRé Sustainability SimaPro 8. Available online: https://simapro.com/ (accessed on 28 March 2018).
- SOFIAS Project SOFIAS Project Website. Available online: http://www.sofiasproject.org/ (accessed on 22 December 2017).
- e2CO2cero e2CO2cero Tool Website. Available online: http://tienda.e2co2cero.com/ (accessed on 22 December 2017).
- Marrero, M.; Puerto, M.; Rivero-Camacho, C.; Freire-Guerrero, A.; Solís-Guzmán, J. Assessing the economic impact and ecological footprint of construction and demolition waste during the urbanization of rural land. Resour. Conserv. Recycl. 2017, 117, 160–174. [Google Scholar] [CrossRef]
- Martínez-Rocamora, A.; Solís-Guzmán, J.; Marrero, M. Toward the Ecological Footprint of the use and maintenance phase of buildings: Utility consumption and cleaning tasks. Ecol. Indic. 2016, 69. [Google Scholar] [CrossRef]
- Solís-Guzmán, J.; González-Vallejo, P.; Martínez-Rocamora, A.; Marrero, M. The Carbon Footprint of Dwelling Construction in Spain. In The Carbon Footprint Handbook; CRC Press-Taylor & Francis Group: Boca Raton, FL, USA, 2015; pp. 261–283. ISBN 978-1-4822-6222-3. [Google Scholar]
- Solís-Guzmán, J.; Marrero, M.; Ramírez-de-Arellano, A. Methodology for determining the ecological footprint of the construction of residential buildings in Andalusia (Spain). Ecol. Indic. 2013, 25, 239–249. [Google Scholar] [CrossRef]
- Solís-Guzmán, J.; Marrero, M.; Montes-Delgado, M.V.; Ramírez-de-Arellano, A. A Spanish model for quantification and management of construction waste. Waste Manag. 2009, 29, 2542–2548. [Google Scholar] [CrossRef] [PubMed]
- Martínez Rocamora, A.; Solís-Guzmán, J.; Marrero, M. Ecological footprint of the use and maintenance phase of buildings: Maintenance tasks and final results. Energy Build. 2017, 155. [Google Scholar] [CrossRef]
- Alba-Rodríguez, M.D.; Martínez-Rocamora, A.; González-Vallejo, P.; Ferreira-Sánchez, A.; Marrero, M. Building rehabilitation versus demolition and new construction: Economic and environmental assessment. Environ. Impact Assess. Rev. 2017, 66. [Google Scholar] [CrossRef]
- Andalusia Government Andalusia Construction Cost Database (ACCD). Available online: http://www.juntadeandalucia.es/organismos/fomentoyvivienda/areas/vivienda-rehabilitacion/planes-instrumentos/paginas/bcca-sept-2017.html (accessed on 21 March 2018).
- Marrero, M.; Ramirez-De-Arellano, A. The building cost system in Andalusia: Application to construction and demolition waste management. Constr. Manag. Econ. 2010, 28, 495–507. [Google Scholar] [CrossRef]
- González-Vallejo, P.; Solís-Guzmán, J.; Llácer, R.; Marrero, M. La construcción de edificios residenciales en España en el período 2007-2010 y su impacto según el indicador Huella Ecológica. Inf. Constr. 2015, 67, e111. [Google Scholar] [CrossRef]
- Chastas, P.; Theodosiou, T.; Kontoleon, K.J.; Bikas, D. Normalising and assessing carbon emissions in the building sector: A review on the embodied CO2 emissions of residential buildings. Build. Environ. 2018, 130, 212–226. [Google Scholar] [CrossRef]
- De Wolf, C. Material Quantities in Building Structures and Their Environmental Impact; Massachusetts Institute of Technology: Cambridge, MA, USA, 2014. [Google Scholar]
- Clark, D. What Colour is Your Building?: Measuring and Reducing the Energy and Carbon Footprint of Buildings; RIBA Publishing: Marylebone, UK, 2012; ISBN 978-1859464472. [Google Scholar]
- De Wolf, C.; Pomponi, F.; Moncaster, A. Measuring embodied carbon dioxide equivalent of buildings: A review and critique of current industry practice. Energy Build. 2017, 140, 68–80. [Google Scholar] [CrossRef]


| Class Levels | Definitions |
|---|---|
| L1. Construction site | All the constructive elements that give up a construction site |
| L2. Chapter | Element sets with a common characteristic. |
| e.g., 05. Structures. | |
| L3. Sub-chapter | Chapter division into smaller sets with a common characteristic. |
| e.g., 05H. Reinforced concrete. | |
| L4. Sections | Sub-Chapter division into smaller sets with a common characteristic. |
| e.g., 05HH. Concrete. | |
| L5. Groups | Section division into smaller sets with a common characteristic. |
| e.g., 05HHJ. Reinforced concrete beam. | |
| L6. Work units | Group division into unitary elements. |
| e.g., 05HHJ00001 m3 Concrete HA-25 in... |
| Unit | Concept | Tool Options Available | |
|---|---|---|---|
| INIT. INF. | Num. Floors | ||
| N/A | Num. floors | 1/2/3/4/5/6+ | |
| N/A | Num. undergr. floors | 0/1/2/3/4 | |
| N/A | Shops in ground floor | No/Yes | |
| C.02 | Earthworks | ||
| m3 | Excavations | Excavator/Backhoe/Not applicable | |
| m3 | Fillings | Manual means/Mechanic means/Not applicable | |
| m3 | Earth transport | Manual means/Mechanic means/Not applicable | |
| C.03 | Foundations | ||
| m3 | Footings | Isolated/Slab/Strip/Piles (m) | |
| C. 04 | Sewer System | ||
| u | Manholes | In situ/Prefabricated | |
| m | Sewage pipes | PVC/Concrete/Fibre-cement/Polyethylene | |
| m | Downpipes and roof sinks | Zinc sheet/Steel sheet/Reinforced PVC/Polypropylene/Fibre-cement | |
| C. 05 | Structure | ||
| m2/m3 | Supports | Brick wall/Reinforced concrete | |
| m2 | Floor slabs | Waffle slab w/non-recoverable caissons/Waffle slab w/recoverable caissons/One-way slab w/ceramic vaults/One-way slab w/concrete vaults/Solid slab | |
| m2 | Formwork | Wood/Metal | |
| C. 06 | Masonry | ||
| m2 | Façades | 1ft brick wall w/chamber/1/2ft brick wall w/chamber/1ft w/o chamber/1/2ft w/o chamber/1ft w/chamber + plasterboard/1/2ft w/chamber + plasterboard/Lightweight concrete block wall | |
| m2 | Claddings | Ceramic brick/Single layer mortar/Cement mortar/Plastic paint/Cement paint/Ventilated cladding (natural stone/ceramic/resin/cellulose-cement/wooden sandwich panel + XPS/Cladding (artificial stone/limestone/marble/granite/wood) | |
| m2 | Partitions | Double hollow brick 9 cm/24 cm/Triple hollow brick 15 cm/Plasterboard | |
| C. 07 | Roof | ||
| m2 | Flat | Non-passable and ventilated/Non-passable and non-ventilated/Non-passable and inverted/Passable and ventilated/Passable and non-ventilated/Passable and inverted/Does not apply | |
| m2 | Sloping | Wavy fibre-cement sheet/Sandwich insulating panel/Aluminium sheet/Galvanized steel sheet/Polyester/Slate tiles/Ceramic tiles/Cement tiles/Does not apply | |
| C. 08 | Installations | ||
| u | Air-Cond. System | Compact/Parted system w/ducts/Heat pump/VRF Inverter/None | |
| u | Terminal units | Ceiling unit/Console/Apartment type/None | |
| m | Ducts | Glass fibre/Galvanized steel/None | |
| m | Pipes | Built-in galvanized steel/Superficial galvanized steel/None | |
| m2 | Radiators | Classic steel/Injected aluminium/Iron/Steel sheet/None | |
| u | Boilers | Diesel/Solid fuel/Gas wall-mounted/Mix electric wall-mounted/None | |
| m | Cold-water pipes | Copper/Galvanized steel/Polyethylene/Polypropylene | |
| m | Hot-water pipes | Copper/Galvanized steel/Polypropylene | |
| u | Sinks | PVC/Polypropylene | |
| m | Ventilation | Concrete/Ceramic/Helical galvanized Steel | |
| u | Heater | Gas/Electric/Does not apply | |
| u | Solar panels | Applies/Does not apply | |
| m | Pipe insulation | Applies/Does not apply | |
| u | Lift | Applies/Does not apply | |
| C. 09 | Insulation | ||
| m2 | Thermal-acoustic | Polystyrene/Polyurethane/Glass fibre/Rock wool/Perlite/Cork/Polyethylene/None | |
| C. 10 | Finishes | ||
| m2 | Continuous claddings | Gypsum plaster/Cement mortar/Does not apply | |
| m2 | Floorings | Ceramic/Stoneware/Continuous concrete/Hydraulic tile/Linoleum/Carpet/Cork/Soft-wood parquet/Floating solid soft-wood/Floating laminated soft-wood/Hard-wood parquet/Floating solid hard-wood/Floating laminated hard-wood/Limestone/Marble/Slate/Granite/Terrazzo/Concrete slab | |
| m2 | Ceilings | Continuous plaster w/rods/Continuous plaster w/metal fixings/Removable plaster panels/Continuous laminated gypsum/Removable laminated gypsum w/hidden support grid | |
| C. 11 | Carpentry and Protection Elements | ||
| m2 | Windows | Pine-wood casement/Lacquered aluminium sliding/Lacquered aluminium casement w/thermal bridge break/PVC sliding | |
| m2 | Doors | Wood/Melamine | |
| m2 | Blinds | Anodized aluminium/PVC/Wood/None | |
| m2 | Protection grids | Hot-rolled steel/None | |
| m | Railings | Steel/Aluminium/Wood/None | |
| C. 12 | Glass and Synthetics | ||
| m2 | Glazing | Thermal-acoustic 6 + 12 + 6/6 + 12 + 6 low-emissive/8 + 14 + 5 + 5 low-emissive argon and solar control | |
| C. 13 | Paintings | ||
| m2 | Exterior | Plastic paint/Cement paint/Does not apply | |
| m2 | Interior | Plastic paint/Does not apply | |
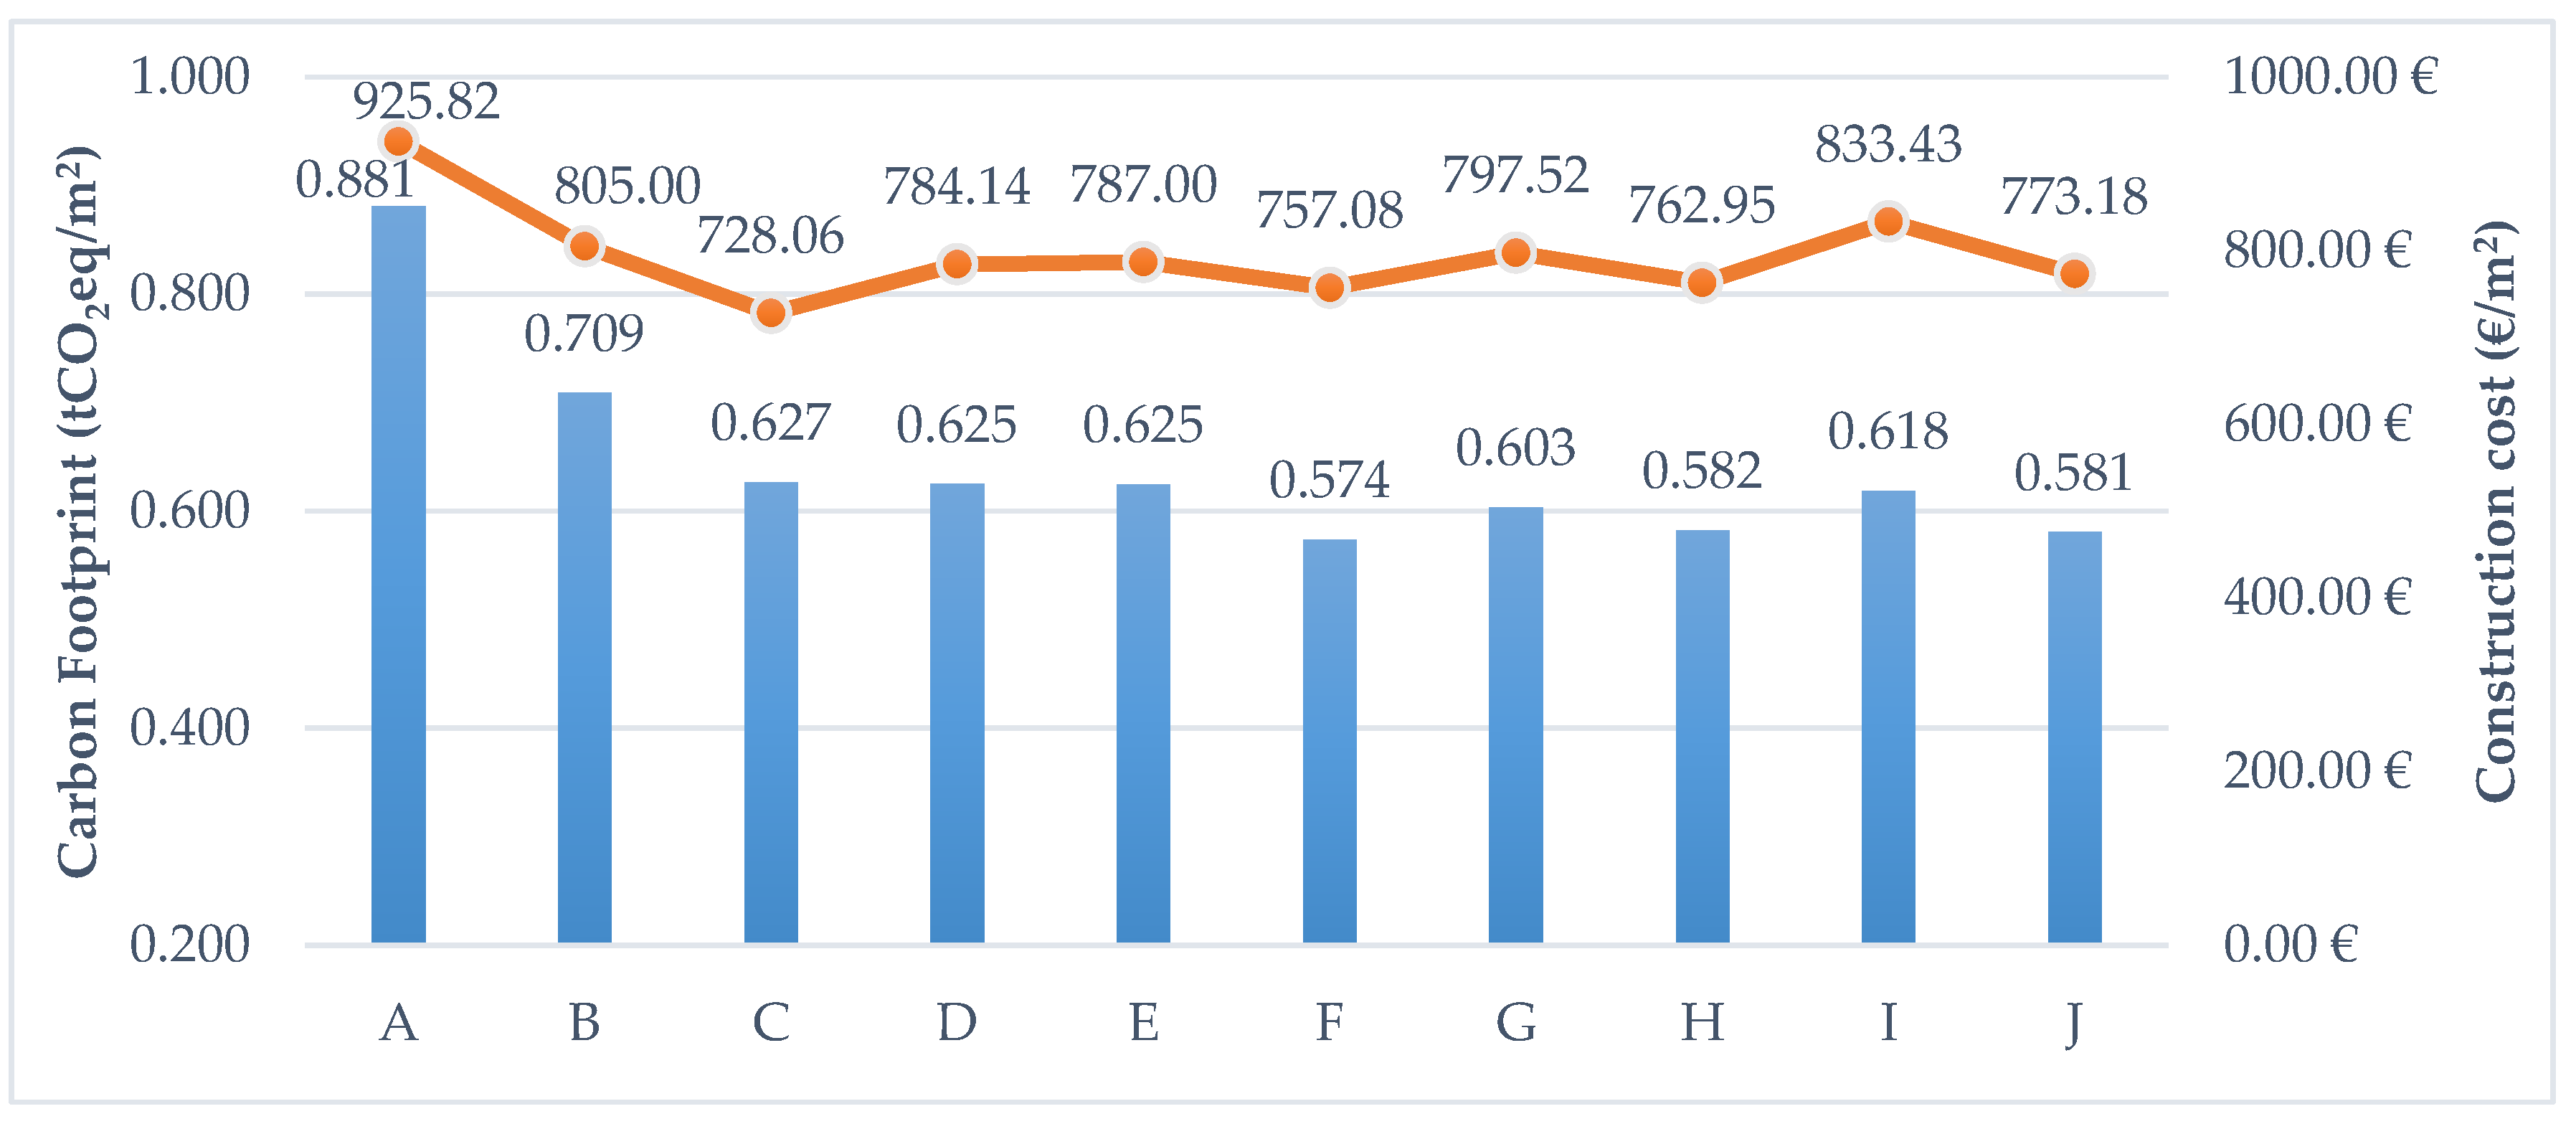
| Project Identifier | Dwelling Type | Built-Up Surface (m2) | Floors Above Ground | Underground Floors | Footings | Structure | Roof |
|---|---|---|---|---|---|---|---|
| A | Detached house | 2696.57 | 1 | 0 | Strip | Brick walls | Sloping |
| B | Terraced house | 3836.17 | 2 | 0 | Isolated | Reinforced concrete | Sloping |
| C | Residential building | 7672.32 | 2 | 1 | Isolated | Reinforced concrete | Flat |
| D | Residential building | 4440.34 | 3 | 1 | Isolated | Reinforced concrete | Sloping |
| E | Residential building | 4440.34 | 3 | 1 | Isolated | Reinforced concrete | Flat |
| F | Residential building | 6660.60 | 4 | 2 | Slab | Reinforced concrete | Flat |
| G | Residential building | 6661.78 | 5 | 1 | Isolated | Reinforced concrete | Flat |
| H | Residential building | 7772.08 | 5 | 2 | Slab | Reinforced concrete | Sloping |
| I | Residential building | 12,210.97 | 6+ | 1 | Isolated | Reinforced concrete | Flat |
| J | Residential building | 13,320.00 | 6+ | 2 | Slab | Reinforced concrete | Sloping |
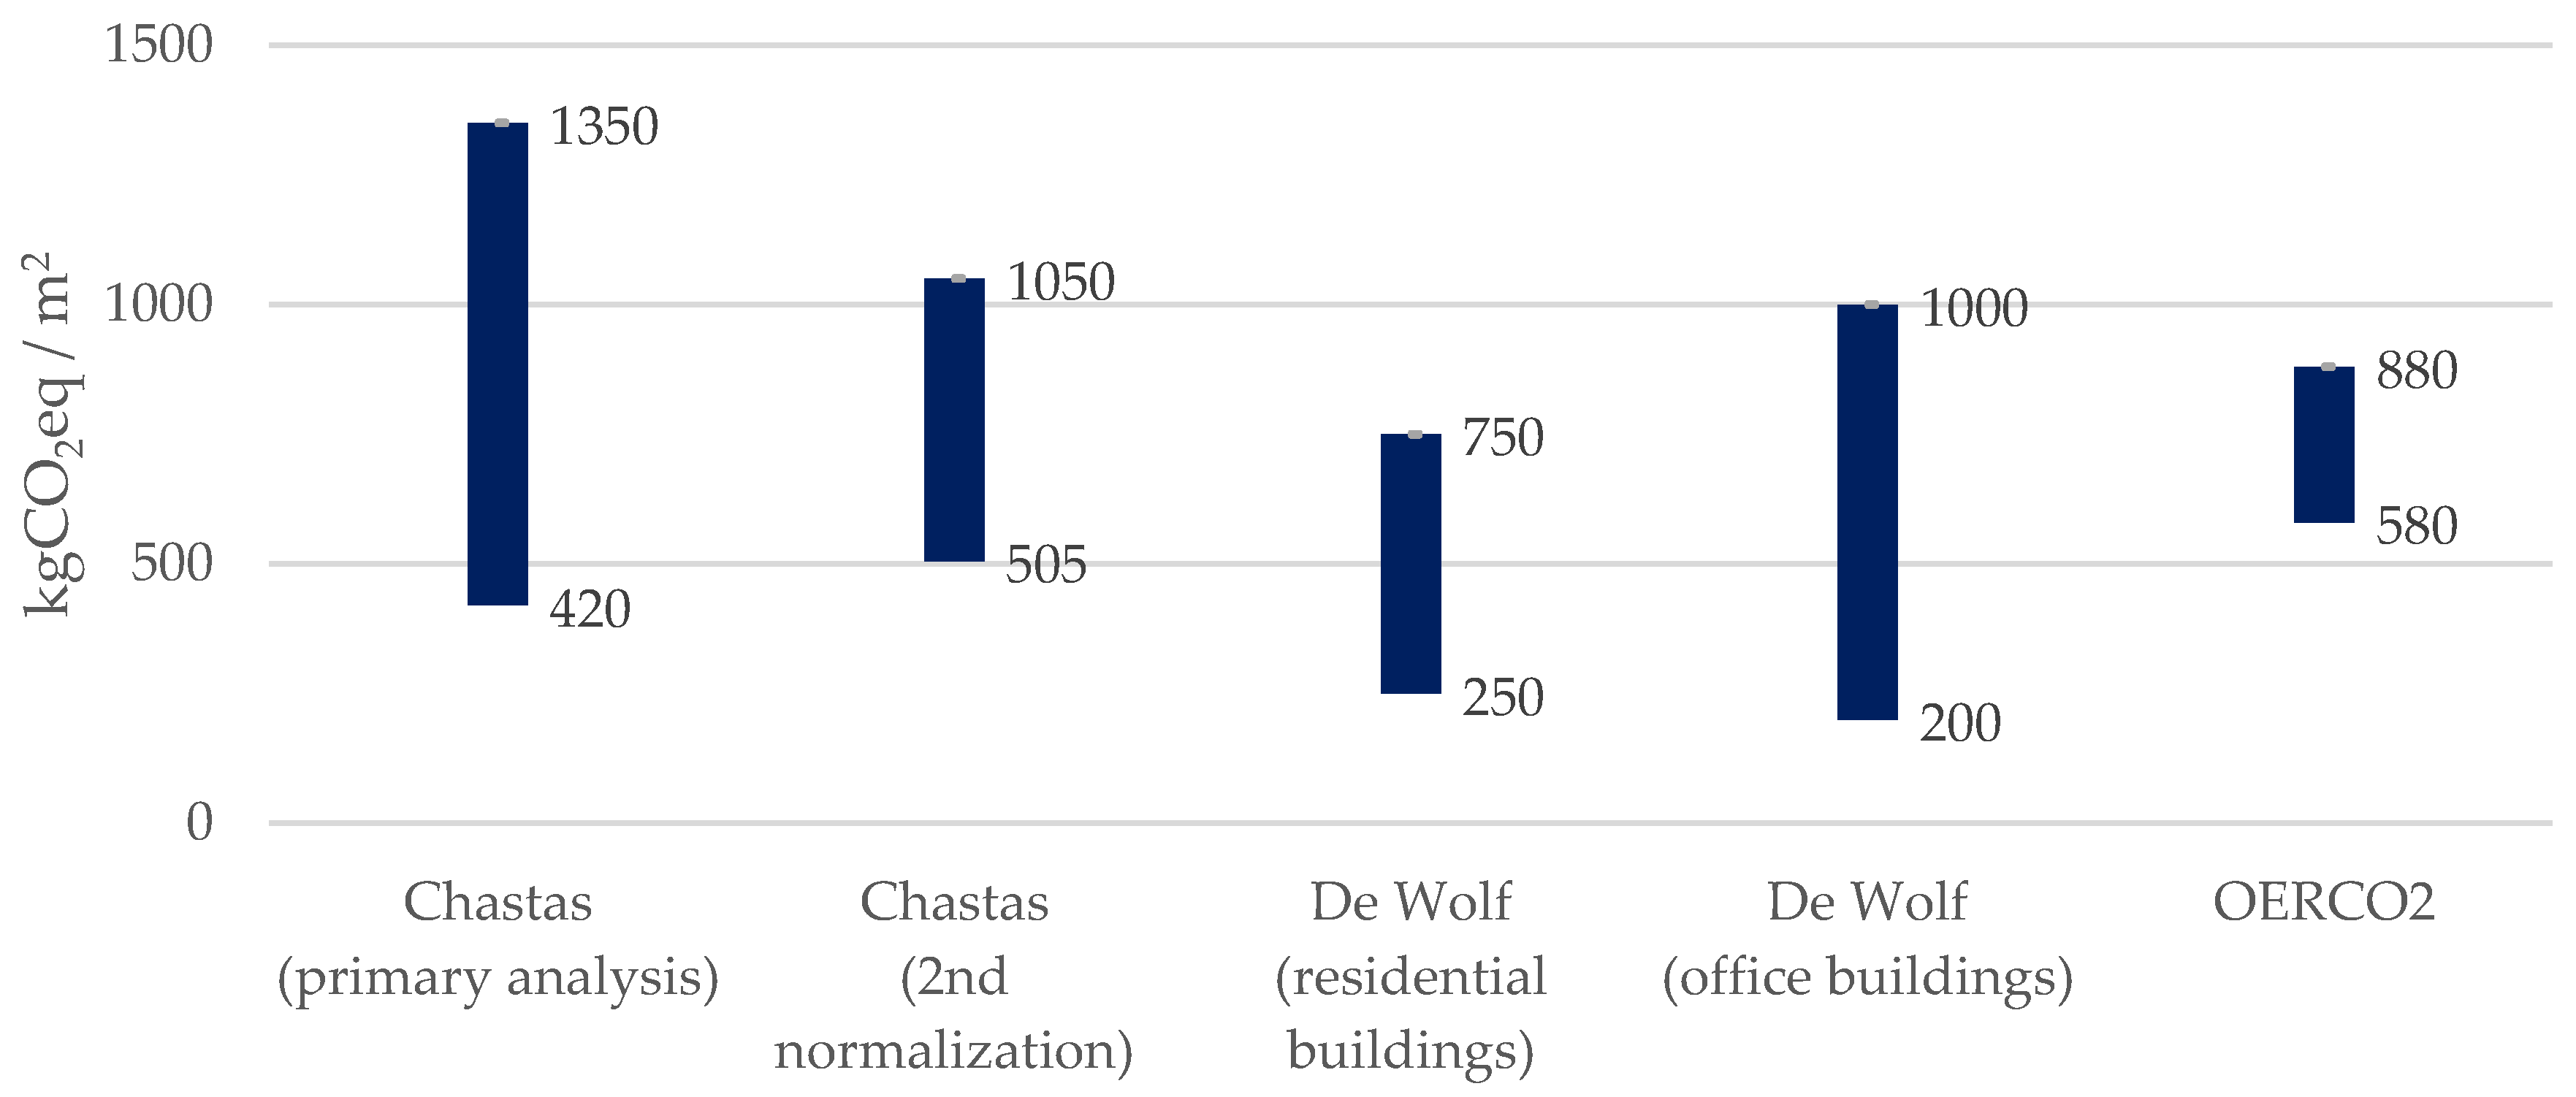
| Structure Type | CF 1st Norm. (kgCO2eq/m2) | CF 2nd Norm.(kgCO2eq/m2) |
|---|---|---|
| Reinforced concrete | 421–1350 | 505.7–1050 |
| Wood | 128–830 | - |
| Concrete | 140.6–448.5 | 243–448.5 |
| Steel | 170–385 | - |
| Masonry | 161–393.1 | 274–331.4 |
© 2018 by the authors. Licensee MDPI, Basel, Switzerland. This article is an open access article distributed under the terms and conditions of the Creative Commons Attribution (CC BY) license (http://creativecommons.org/licenses/by/4.0/).
Share and Cite
Solís-Guzmán, J.; Rivero-Camacho, C.; Alba-Rodríguez, D.; Martínez-Rocamora, A. Carbon Footprint Estimation Tool for Residential Buildings for Non-Specialized Users: OERCO2 Project. Sustainability 2018, 10, 1359. https://doi.org/10.3390/su10051359
Solís-Guzmán J, Rivero-Camacho C, Alba-Rodríguez D, Martínez-Rocamora A. Carbon Footprint Estimation Tool for Residential Buildings for Non-Specialized Users: OERCO2 Project. Sustainability. 2018; 10(5):1359. https://doi.org/10.3390/su10051359
Chicago/Turabian StyleSolís-Guzmán, Jaime, Cristina Rivero-Camacho, Desirée Alba-Rodríguez, and Alejandro Martínez-Rocamora. 2018. "Carbon Footprint Estimation Tool for Residential Buildings for Non-Specialized Users: OERCO2 Project" Sustainability 10, no. 5: 1359. https://doi.org/10.3390/su10051359
APA StyleSolís-Guzmán, J., Rivero-Camacho, C., Alba-Rodríguez, D., & Martínez-Rocamora, A. (2018). Carbon Footprint Estimation Tool for Residential Buildings for Non-Specialized Users: OERCO2 Project. Sustainability, 10(5), 1359. https://doi.org/10.3390/su10051359