1. Introduction
Eskom, the custodian of South Africa’s national grid, has been saddled with the government’s optimistic goal of tripling the contribution by renewable energy from the current 4% of the national generating capacity to about 6000 MW by 2020 [
1]. This comes against Eskom’s occasional failure to meet demand, which compels the energy regulatory authority to impose strict load shedding schedules so as to ease the pressure on the grid. The pressure in turn hampers Eskom’s drive towards renewable energy use, as it is forced to focus more on meeting demand through traditional non-renewable technologies rather than promoting new renewable ones. One way of easing pressure on the national grid without the need for scheduling load shedding is promoting the use of distributed wind power systems. The major advantage of distributed wind power systems, as is the case with other distributed systems, is their proximity to end users. Distributed wind power systems can protect consumers from dearths due to technicalities associated with grid failure and transportation or capacity shortfalls, because the system can be installed within the consumer’s locality. Of particular interest in this study is the built environment wind turbine (BEWT) technology that [
2] identified as a developing and less mature innovation than the utility-scale or conventional ground-based distributed wind power systems.
BEWT refers to wind projects that are constructed on, in, or near buildings. One of the main factors to consider when choosing a wind turbine for deployment as a BEWT is its performance in terms of power output within the given built environment. The built environment is known to be characterised by complex wind flow patterns [
3], where wind direction variations are considerable. Thus, horizontal axis wind turbines (HAWT) with their yawing system may not be capable of tracking fast and extensive variations in wind direction, thus rendering HAWTs less effective for the built environment [
4]. On the other hand, vertical axis wind turbines (VAWTs) are more compact, and their performance is independent of wind direction; hence, VAWTs are the preferred choice for deployment as BEWTs.
The power output of a wind turbine depends on wind speed that, in turn, is a spatiotemporal variable. Therefore, it is important to carry out a wind resource assessment of the candidate site prior to deployment of the BEWT. This is crucial in assessing the physical and economic sustainability of deploying a particular wind turbine in the given environment. Carrying out a site-specific wind resource assessment gives the most reliable estimation of the wind resource potential, but this may increase installation costs and even delay deployment. Knowledge of the wind resource potential in the host region of the candidate site(s) is therefore important, as it can be used as a referral tool for predicting the performance and lifespan of the BEWT in the given built environment.
Wind speed is a random variable; hence, it can be represented statistically, with Weibull distribution being recommended by most authors due to its flexibility, simplicity, and capability to fit a wide range of wind data [
5,
6,
7]. This paper is aimed at using the Weibull distribution function to assess the wind resource potential of Fort Beaufort, South Africa for the purpose of deploying BEWT systems. This may go a long way in promoting the adoption of BEWTs in South Africa and ease pressure on the national grid. South Africa is yet to adopt BEWTs, with available literature on wind power projects in the country (as is the case with other African countries) showing a bias towards wind resource potential assessment for establishing large-scale wind farms.
2. Materials and Methods
2.1. Study Area
Fort Beaufort is a town in the Amathole district of the Eastern Cape province in South Africa, whose prevailing climate is classified as steppe [
8]. The district has moderate wind energy potential [
9] therefore, its wind resource potential may be suitable for setting up BEWTs.
2.2. Power Output
The generic formula for estimating the power output (
) of a wind turbine is;
Estimations of
using Equation (1) are premised on the assumption that air density (
) is independent of wind speed [
6], where
is the area swept by the turbine blades and
is the speed of wind driving the turbine positioned at a height
above the ground. Equation (1) is useful when dealing with HAWTs and less reliable for VAWTs, hence [
10] formulated Equation (2) for estimating the power output of VAWTs;
is the nominal power corresponding to the nominal velocity
. Wind speed depends on topography and altitude [
11,
12]; hence, wind speed measured at the weather station (
) of height
should be adjusted to
so as to cater for differences in height and topography between the weather station and the turbine. The author of [
10] came up with Equation (3) for estimating the power output of a BEWT based on the corrected wind speed;
Equation (3) was successfully used to estimate the power output of a turbine operating within the built environment at a 15-m height, where building geometry was assumed not to influence wind speed. However, for a BEWT operating in/and on a building, building orientation with respect to the wind profile should be catered for when recalculating wind speed. The authors of [
13] used Equation (4) to extrapolate a velocity profile from the meteorological station to the building while studying wind induced natural ventilation in residential areas:
Thus, Equation (2) can be modified into Equation (5) as follows:
where
is the building height and
and
are constants for the terrain conditions. Considering Fort Beaufort’s peripheral zone that can be classified as suburban, the constants were assumed to be
and
for
and
, respectively.
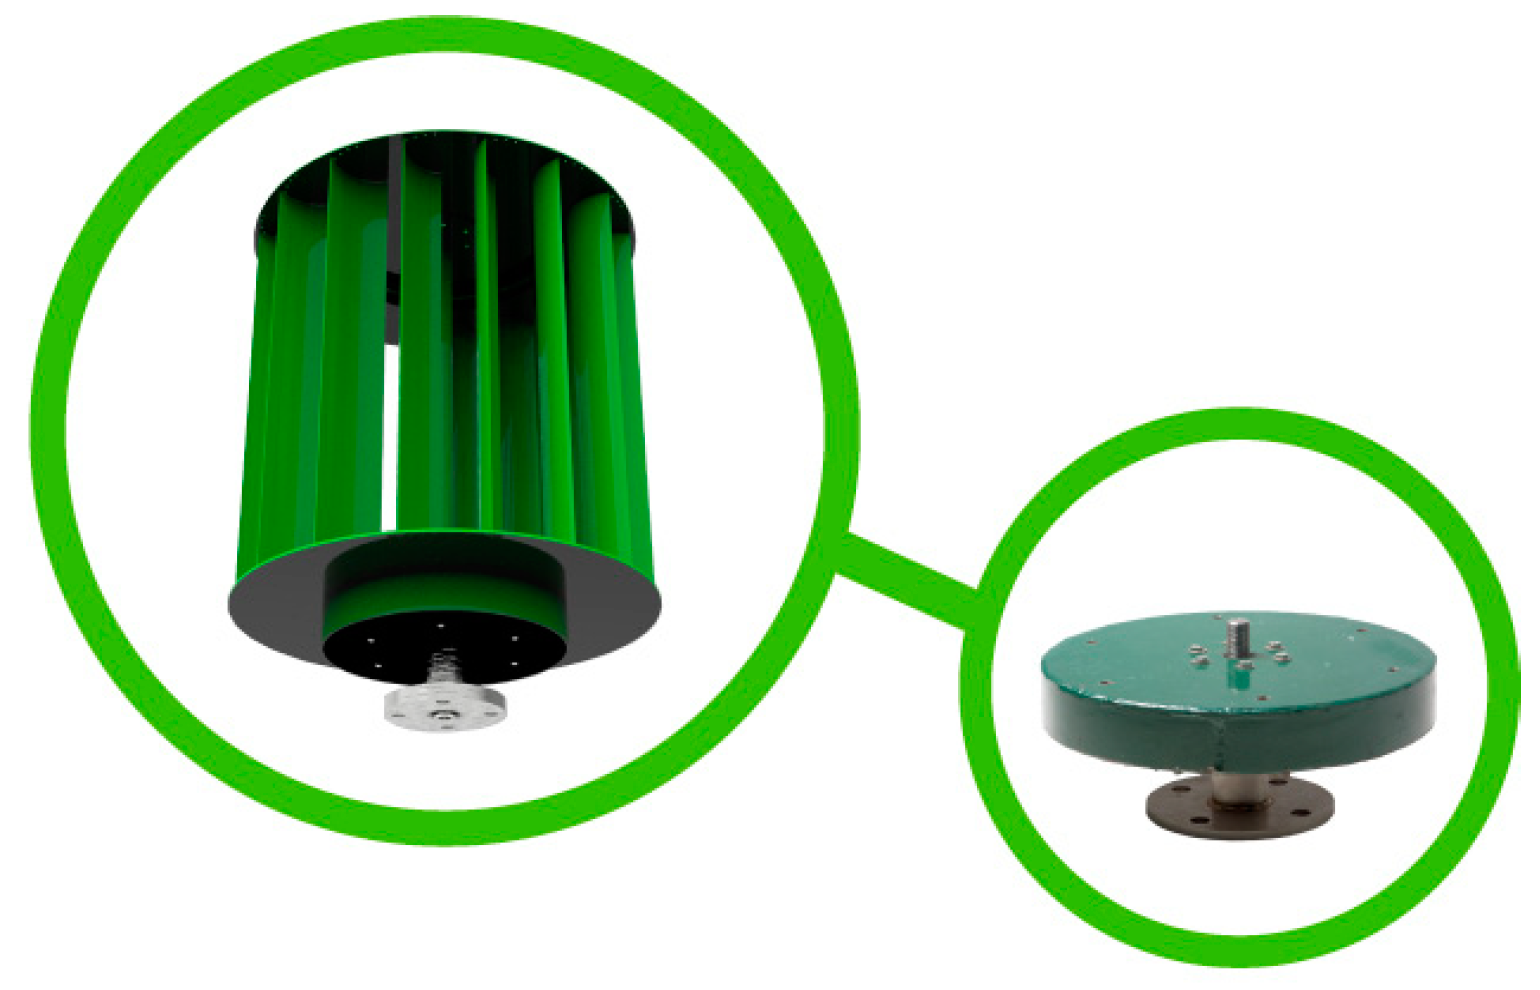
The Psiclone power tree (
Figure 1) was used as a reference BEWT.
Its operational specifications are presented in
Table 1.
According to Eskom, an average family in South Africa uses between 500 kWh and 750 kWh per month [
15]; therefore, the power tree can meet up to 23% of domestic energy needs when the system is operating under nominal conditions. Equation (3) was used to estimate the power output of the power tree installed within a built environment at a 15-m height, while Equation (5) was used for the BEWT installed on a rooftop assumed to be
. The power tree is too bulky for use as a BEWT inside a building; hence, the assessment was limited to the two cases mentioned.
2.3. Wind Speed Data
The wind speed data that was used in this study was obtained from the South African Weather Services department. The location of the weather station is given in
Table 2.
The data was in hourly time series format for the period of 2006–2016 and averaged into seasons. Because
is a stochastic variable, the most probable wind speed (
) corresponding to the most probable power output was determined from Weibull parameters
and
[
16] using the following formula;
where
is the average wind speed and
is the corresponding standard deviation of the measured wind speeds.
The constant
is the shape parameter while
is the scale parameter for the Weibull distribution based on the mean wind speed standard deviation approach [
5,
17]. Knowledge of
is fundamental to estimating the potential of the preferred choice of a BEWT in the given environment. A large
(and hence a large power output) can support a turbine with a large cut-in speed. The probability density function,
is then given as follows:
The maximum wind speed corresponding to the maximum power output is obtained from
and
using the following formula:
2.4. Power Density
Wind power density (
) is generally considered a better indicator of wind resource potential than wind speed [
6]. It is a measure of the power available per unit square area (
) swept by the wind turbine. The wind power density can be estimated using the Weibull distribution as follows:
Thus, wind resource potential can be rated using a magnitude-based assessment categorization, as shown in
Table 3 [
6,
16].
3. Results and Discussion
3.1. Wind and Power Density Distribution
Wind speed ranges from
to
for the ten-year period that was considered.
Table 4 summarizes the seasonal average values of wind speed and the corresponding power output for the BEWTs at 3-m and 15-m heights.
It can be observed from
Table 4 that a BEWT deployed at
gives a lower power density than one deployed at
, as is expected because wind speed increases with altitude. The unimodal seasonal probability densities for wind speed are presented graphically.
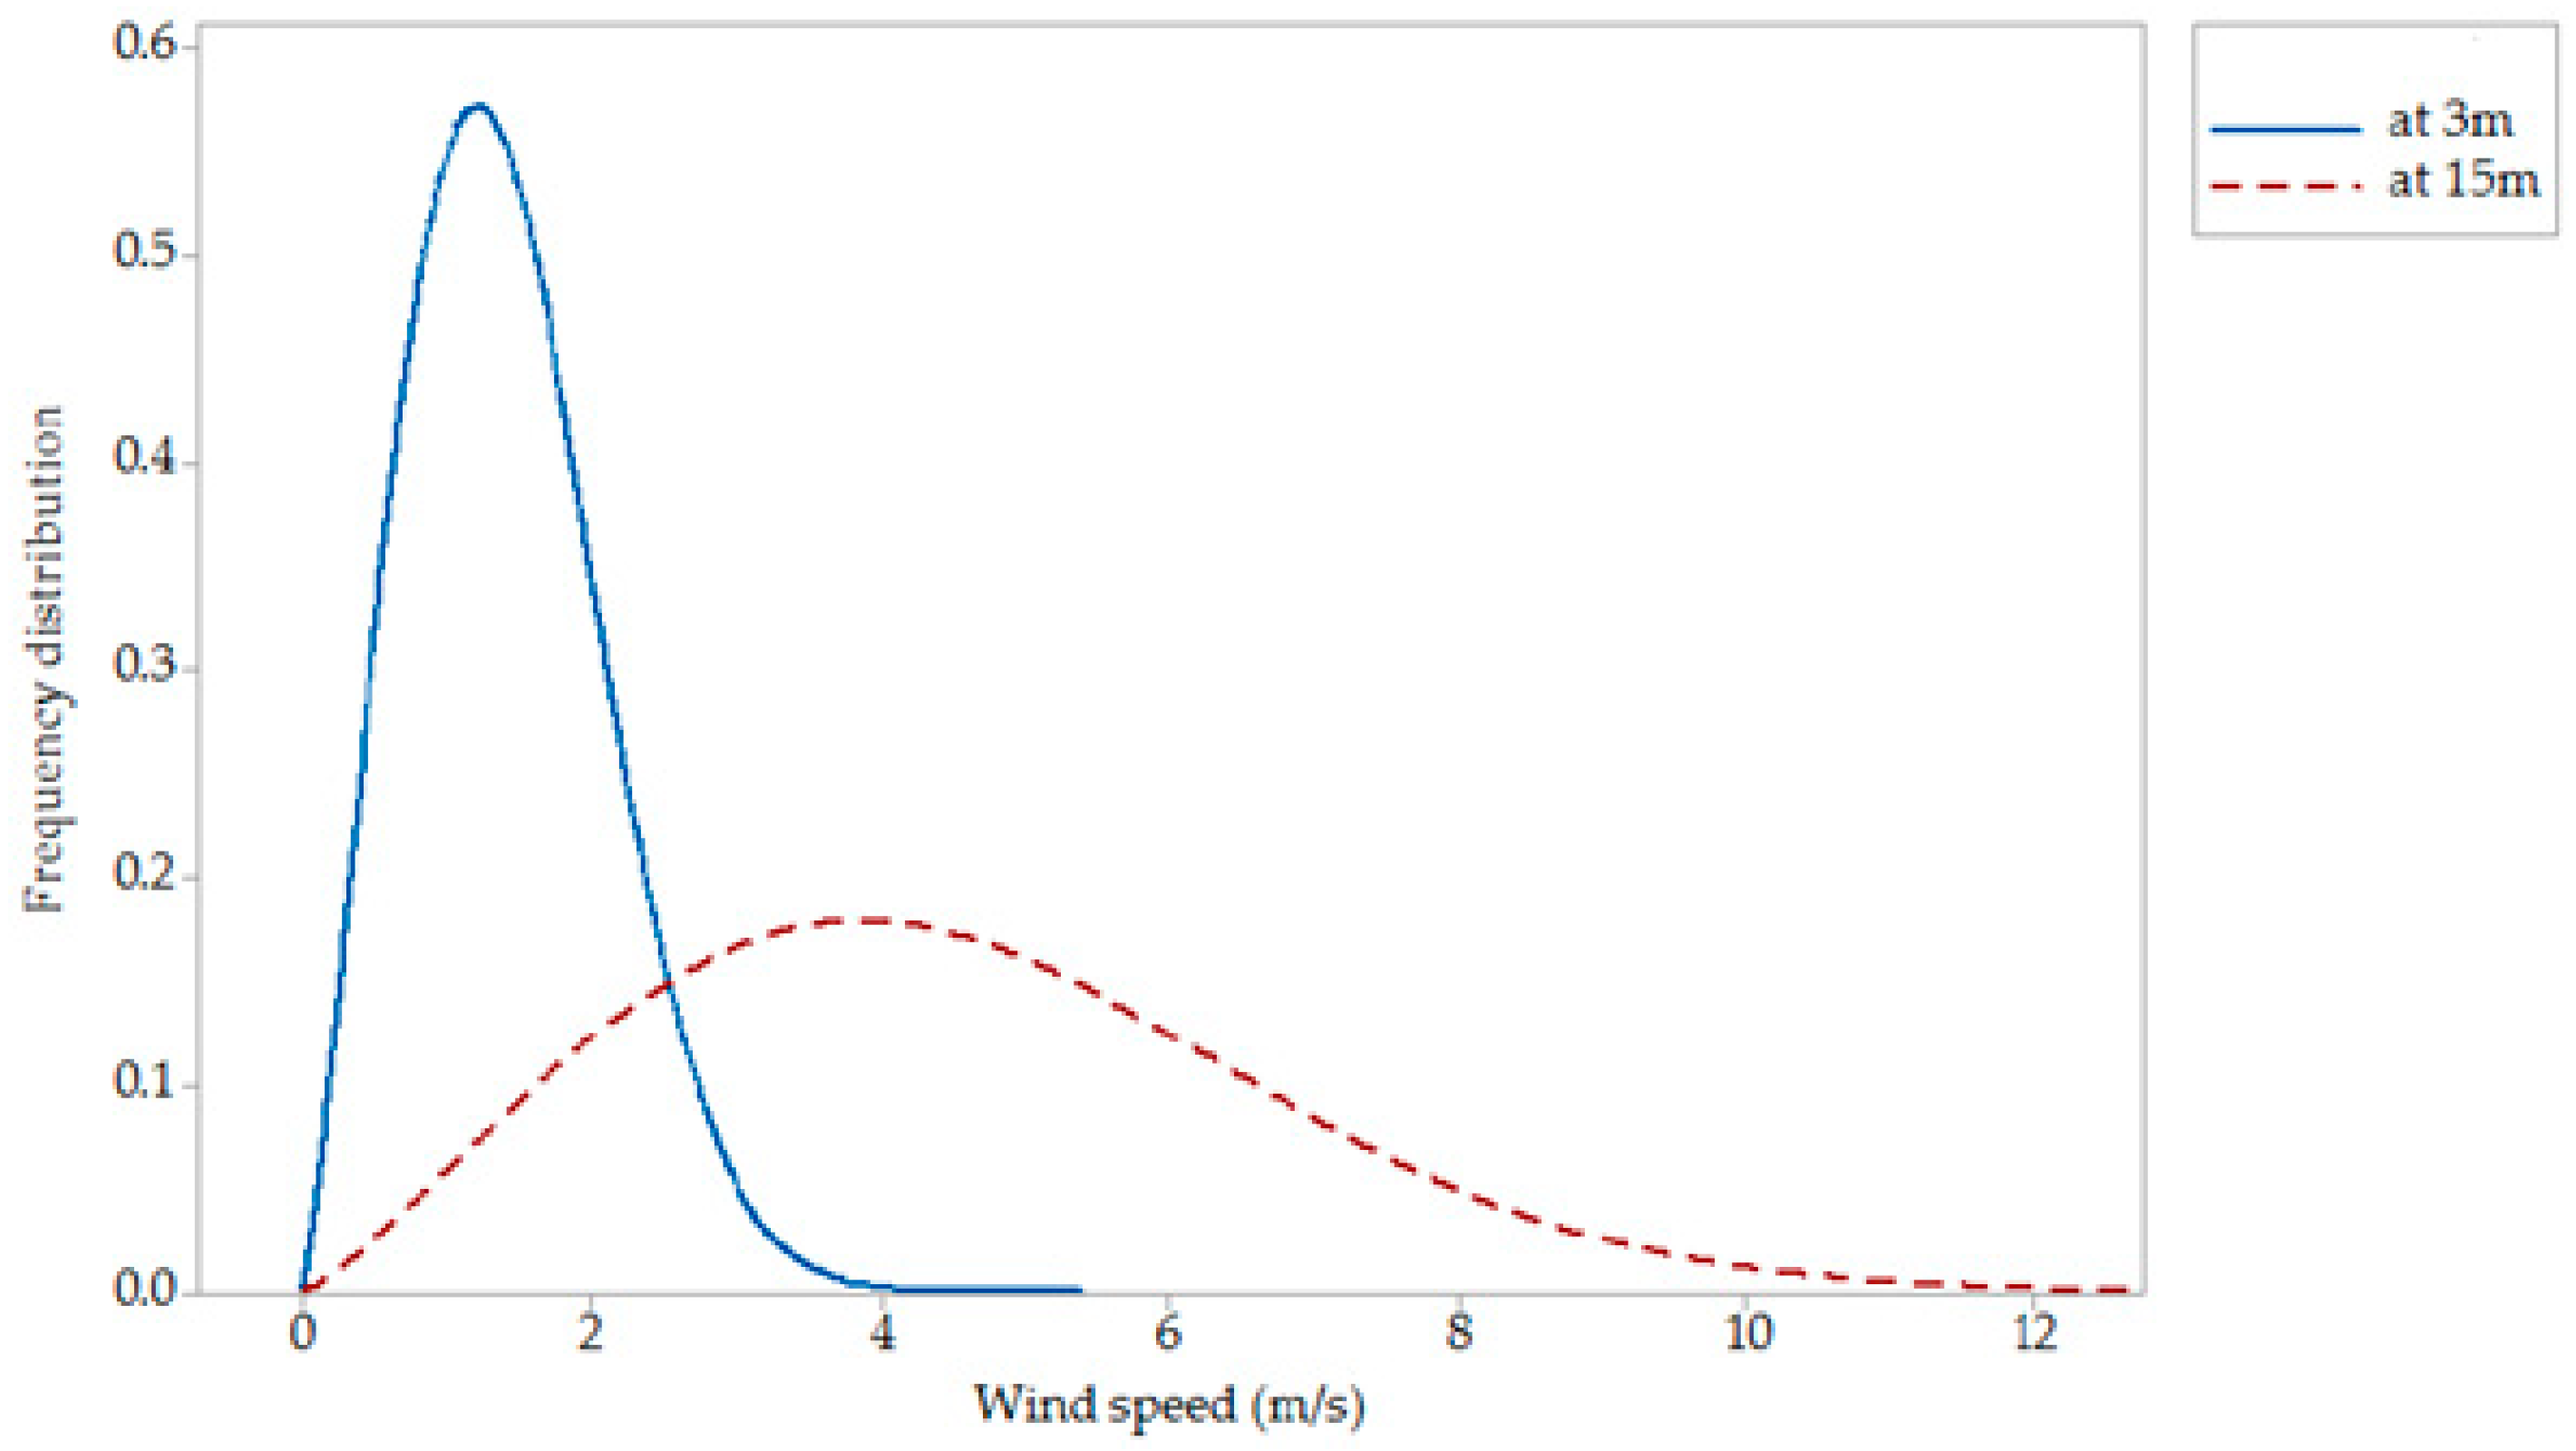
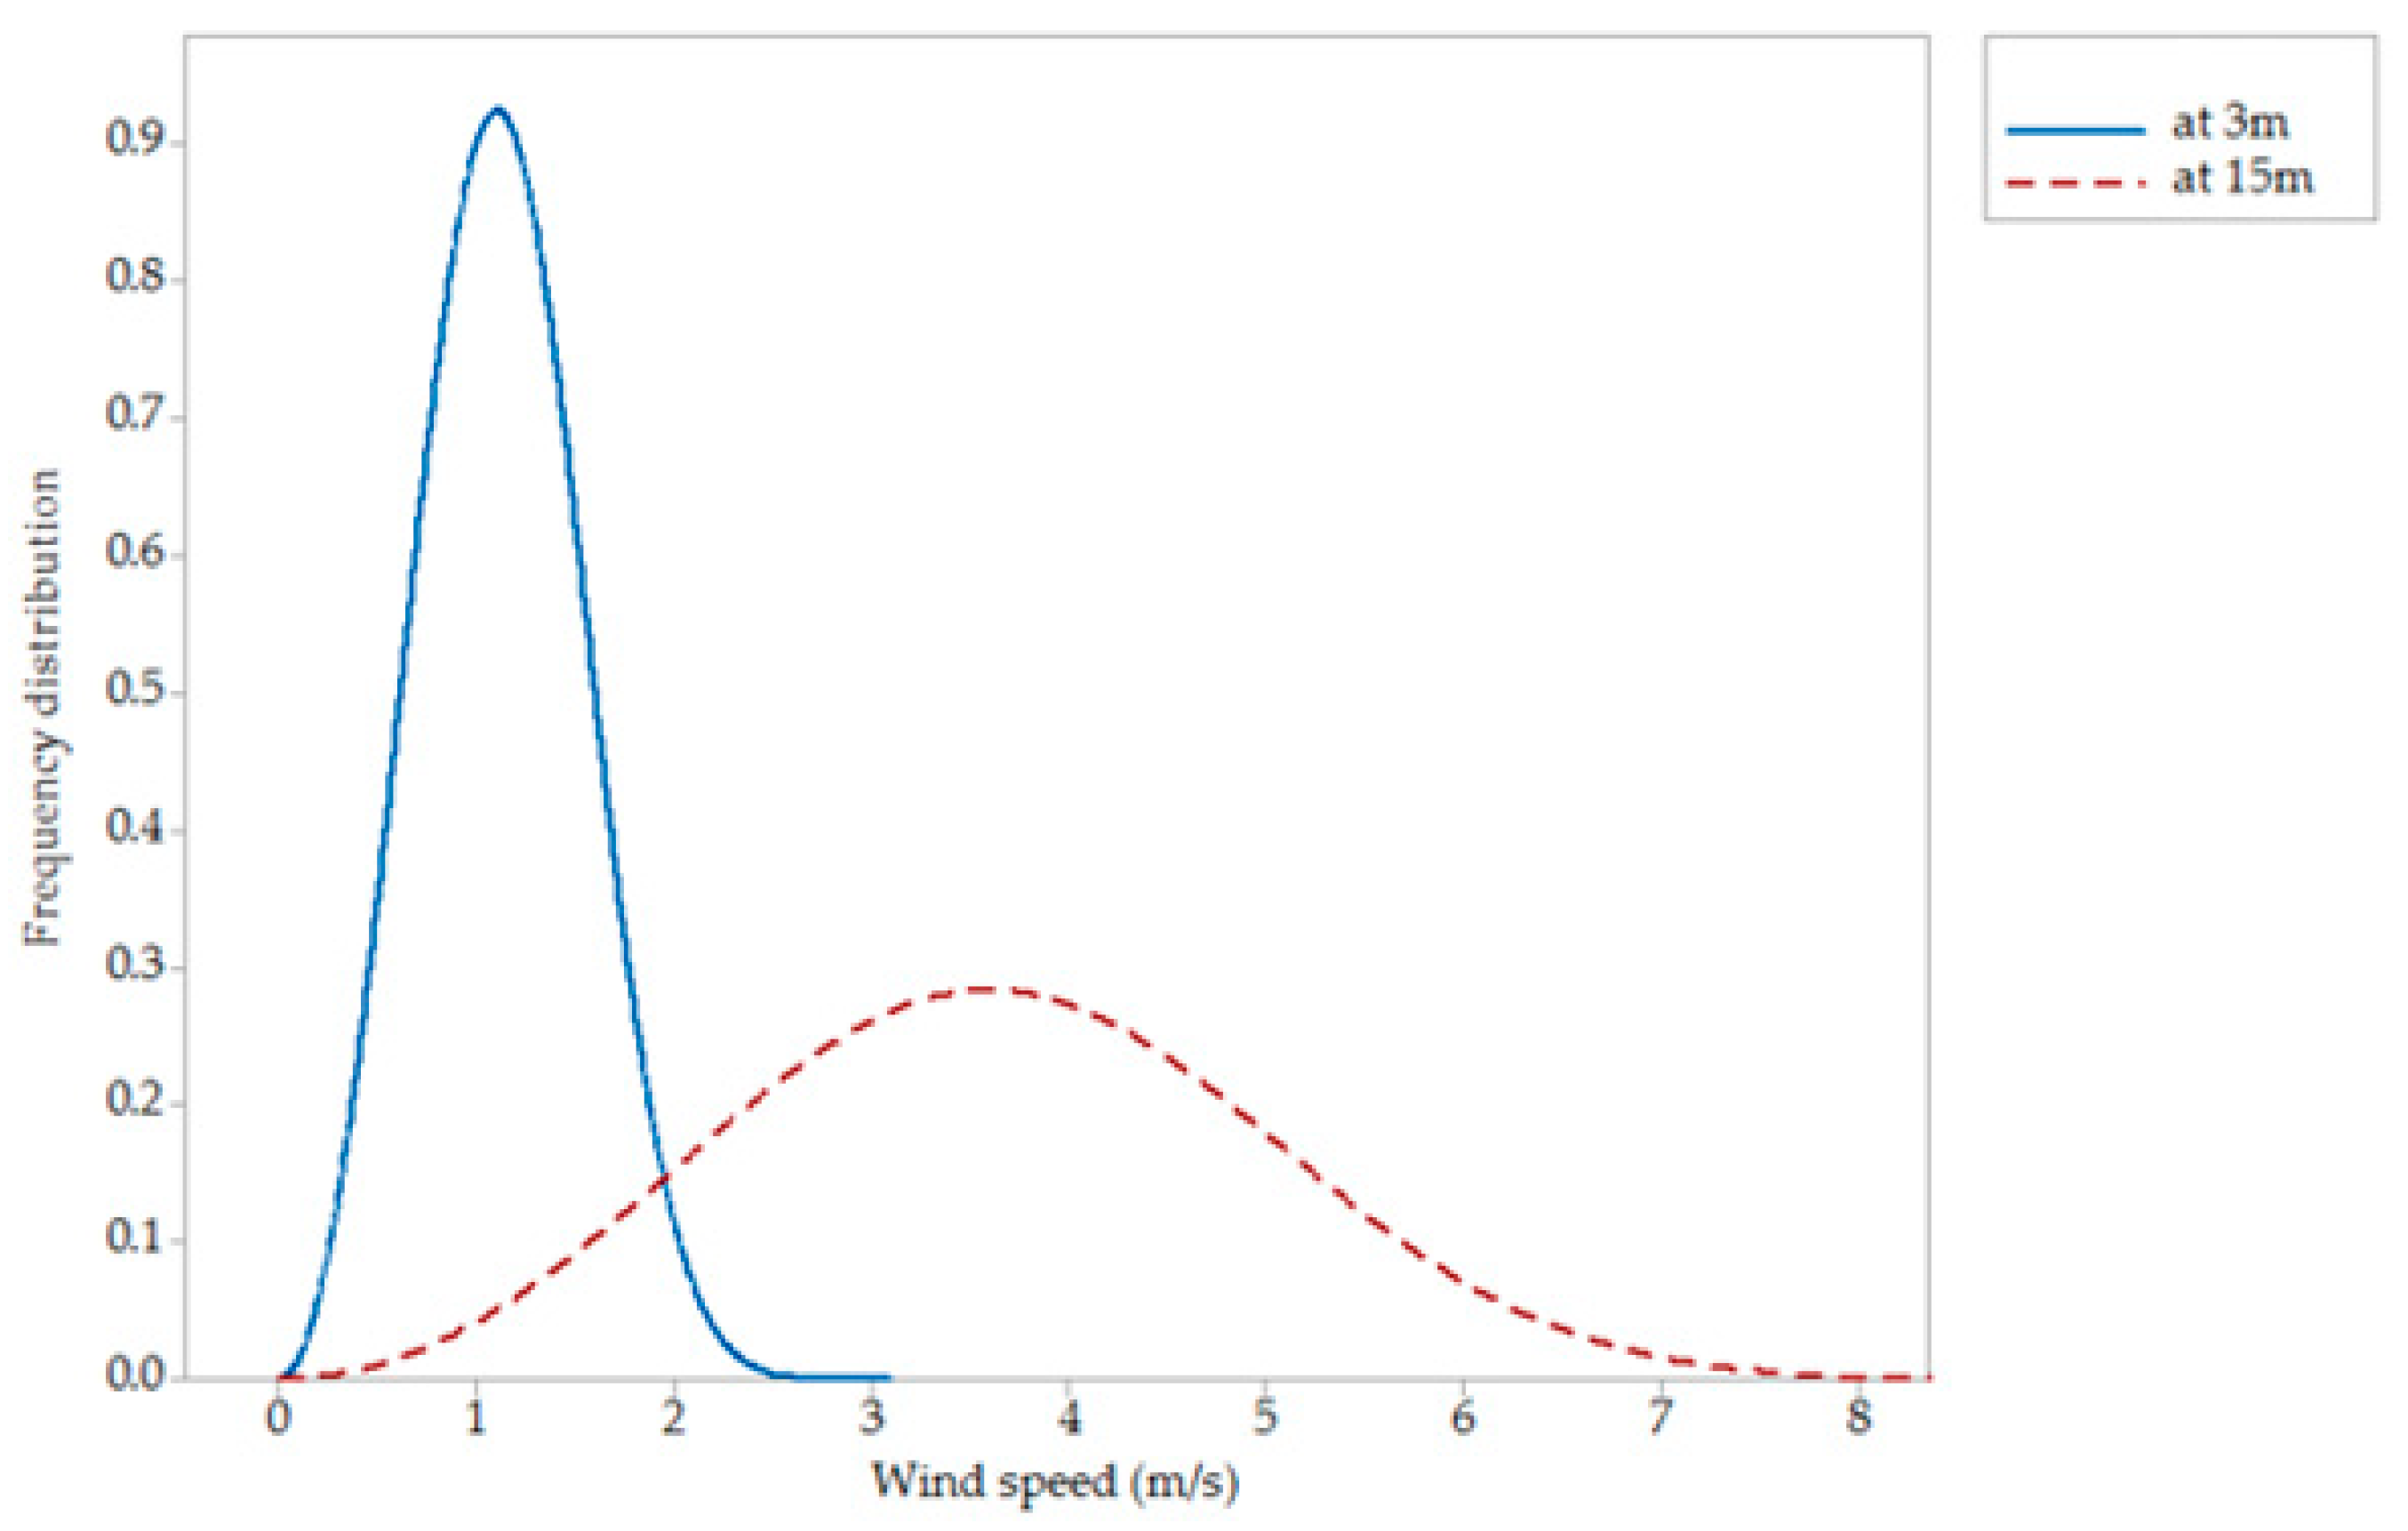
3.1.1. Summer
The wind speed distribution for summer is presented in
Figure 2.
It can be observed from
Figure 2 that the distribution is slightly skewed towards lower wind speeds; hence, the probability of having above average wind speeds is relatively low. Considering
Figure 2 in conjunction with
Table 4, it can be observed that both
and
for summer are less than the cut-in speed of the BEWT at a 3-m height. This shows that the BEWT of
cut-in speed cannot be supported at this height. On the other hand, both
and
at
for summer are greater than the cut-in speed; hence, a BEWT can be supported at this height. Thus, with reference to summer, a BEWT can be deployed at
if its cut-in speed is at most
and such technologies are generally expensive considering the returns in terms of power output and production costs. The most probable power density at
is
while at
it is
as given in
Table 4. Using the power density categorization in
Table 3, the power densities can therefore be categorized as fair and fairly good, respectively.
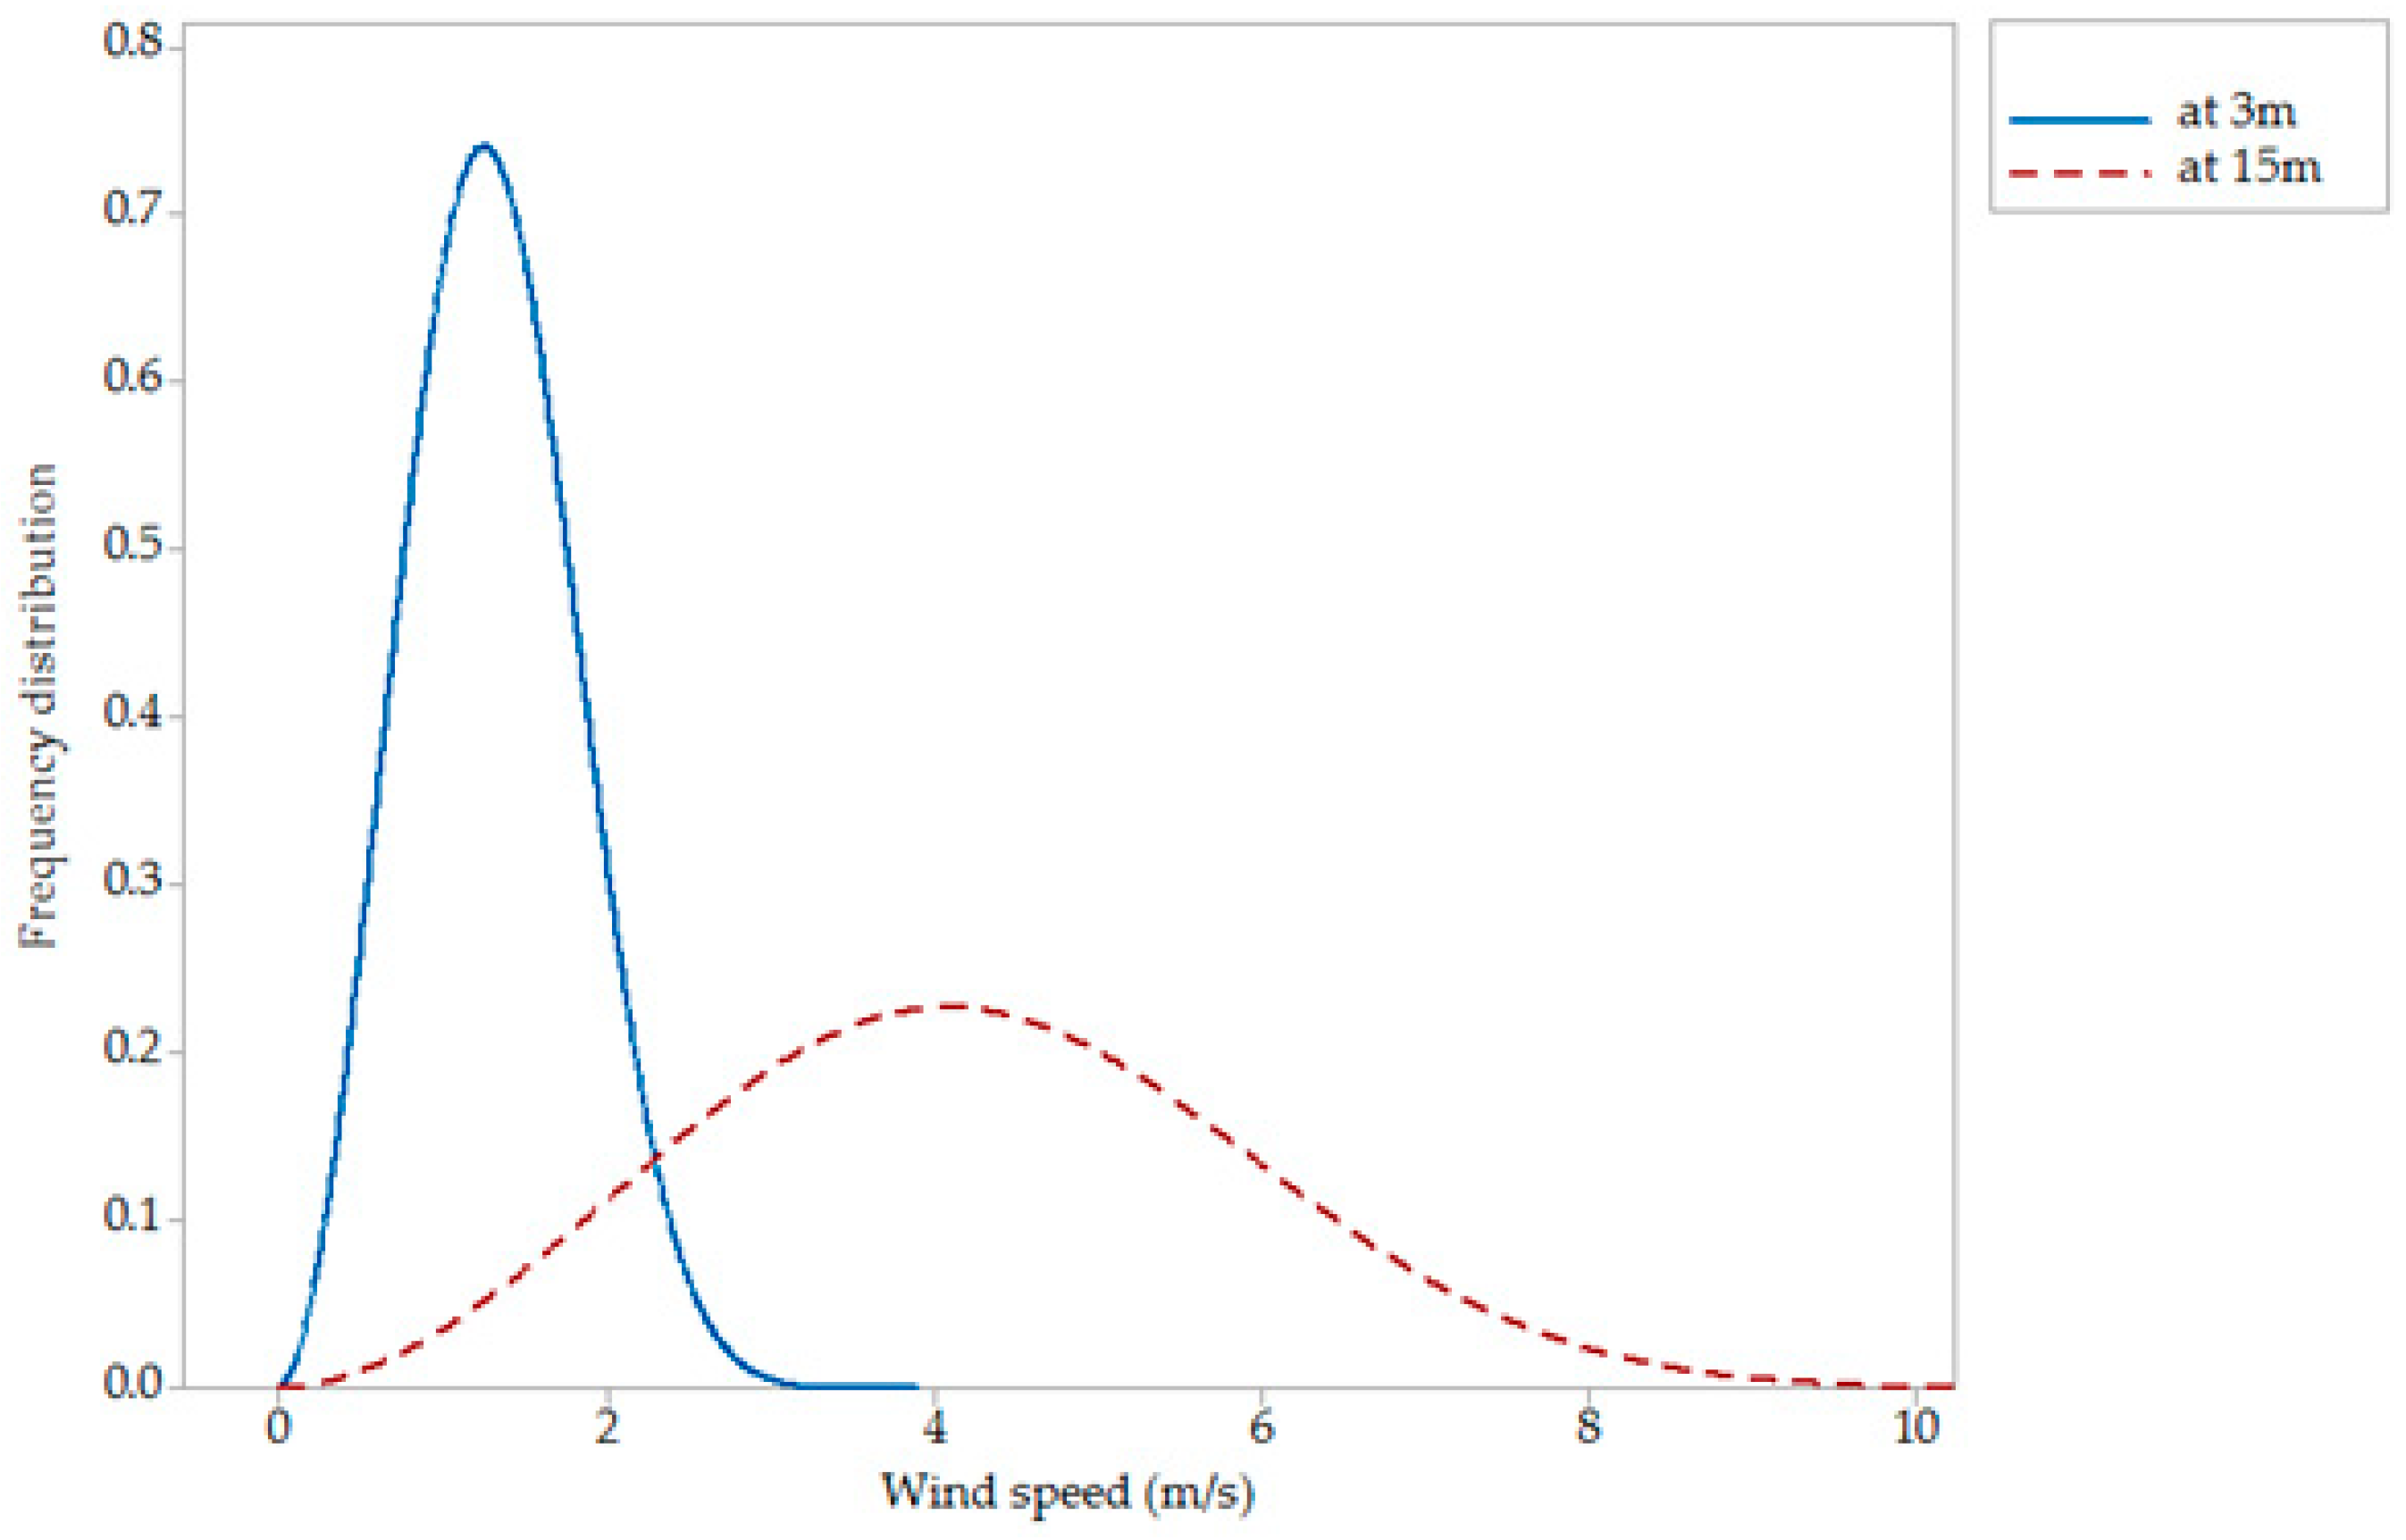
3.1.2. Autumn
The autumn wind distribution is almost symmetrical with a slight positive skew, as shown in
Figure 3.
The modal wind speeds are and at 3-m and 15-m heights, respectively. The corresponding modal power densities are and at the respective heights; hence, they are both categorized as fair. The maximum power densities are at and at . Therefore, wind conditions in autumn are capable of giving a fair power output for operating a BEWT.
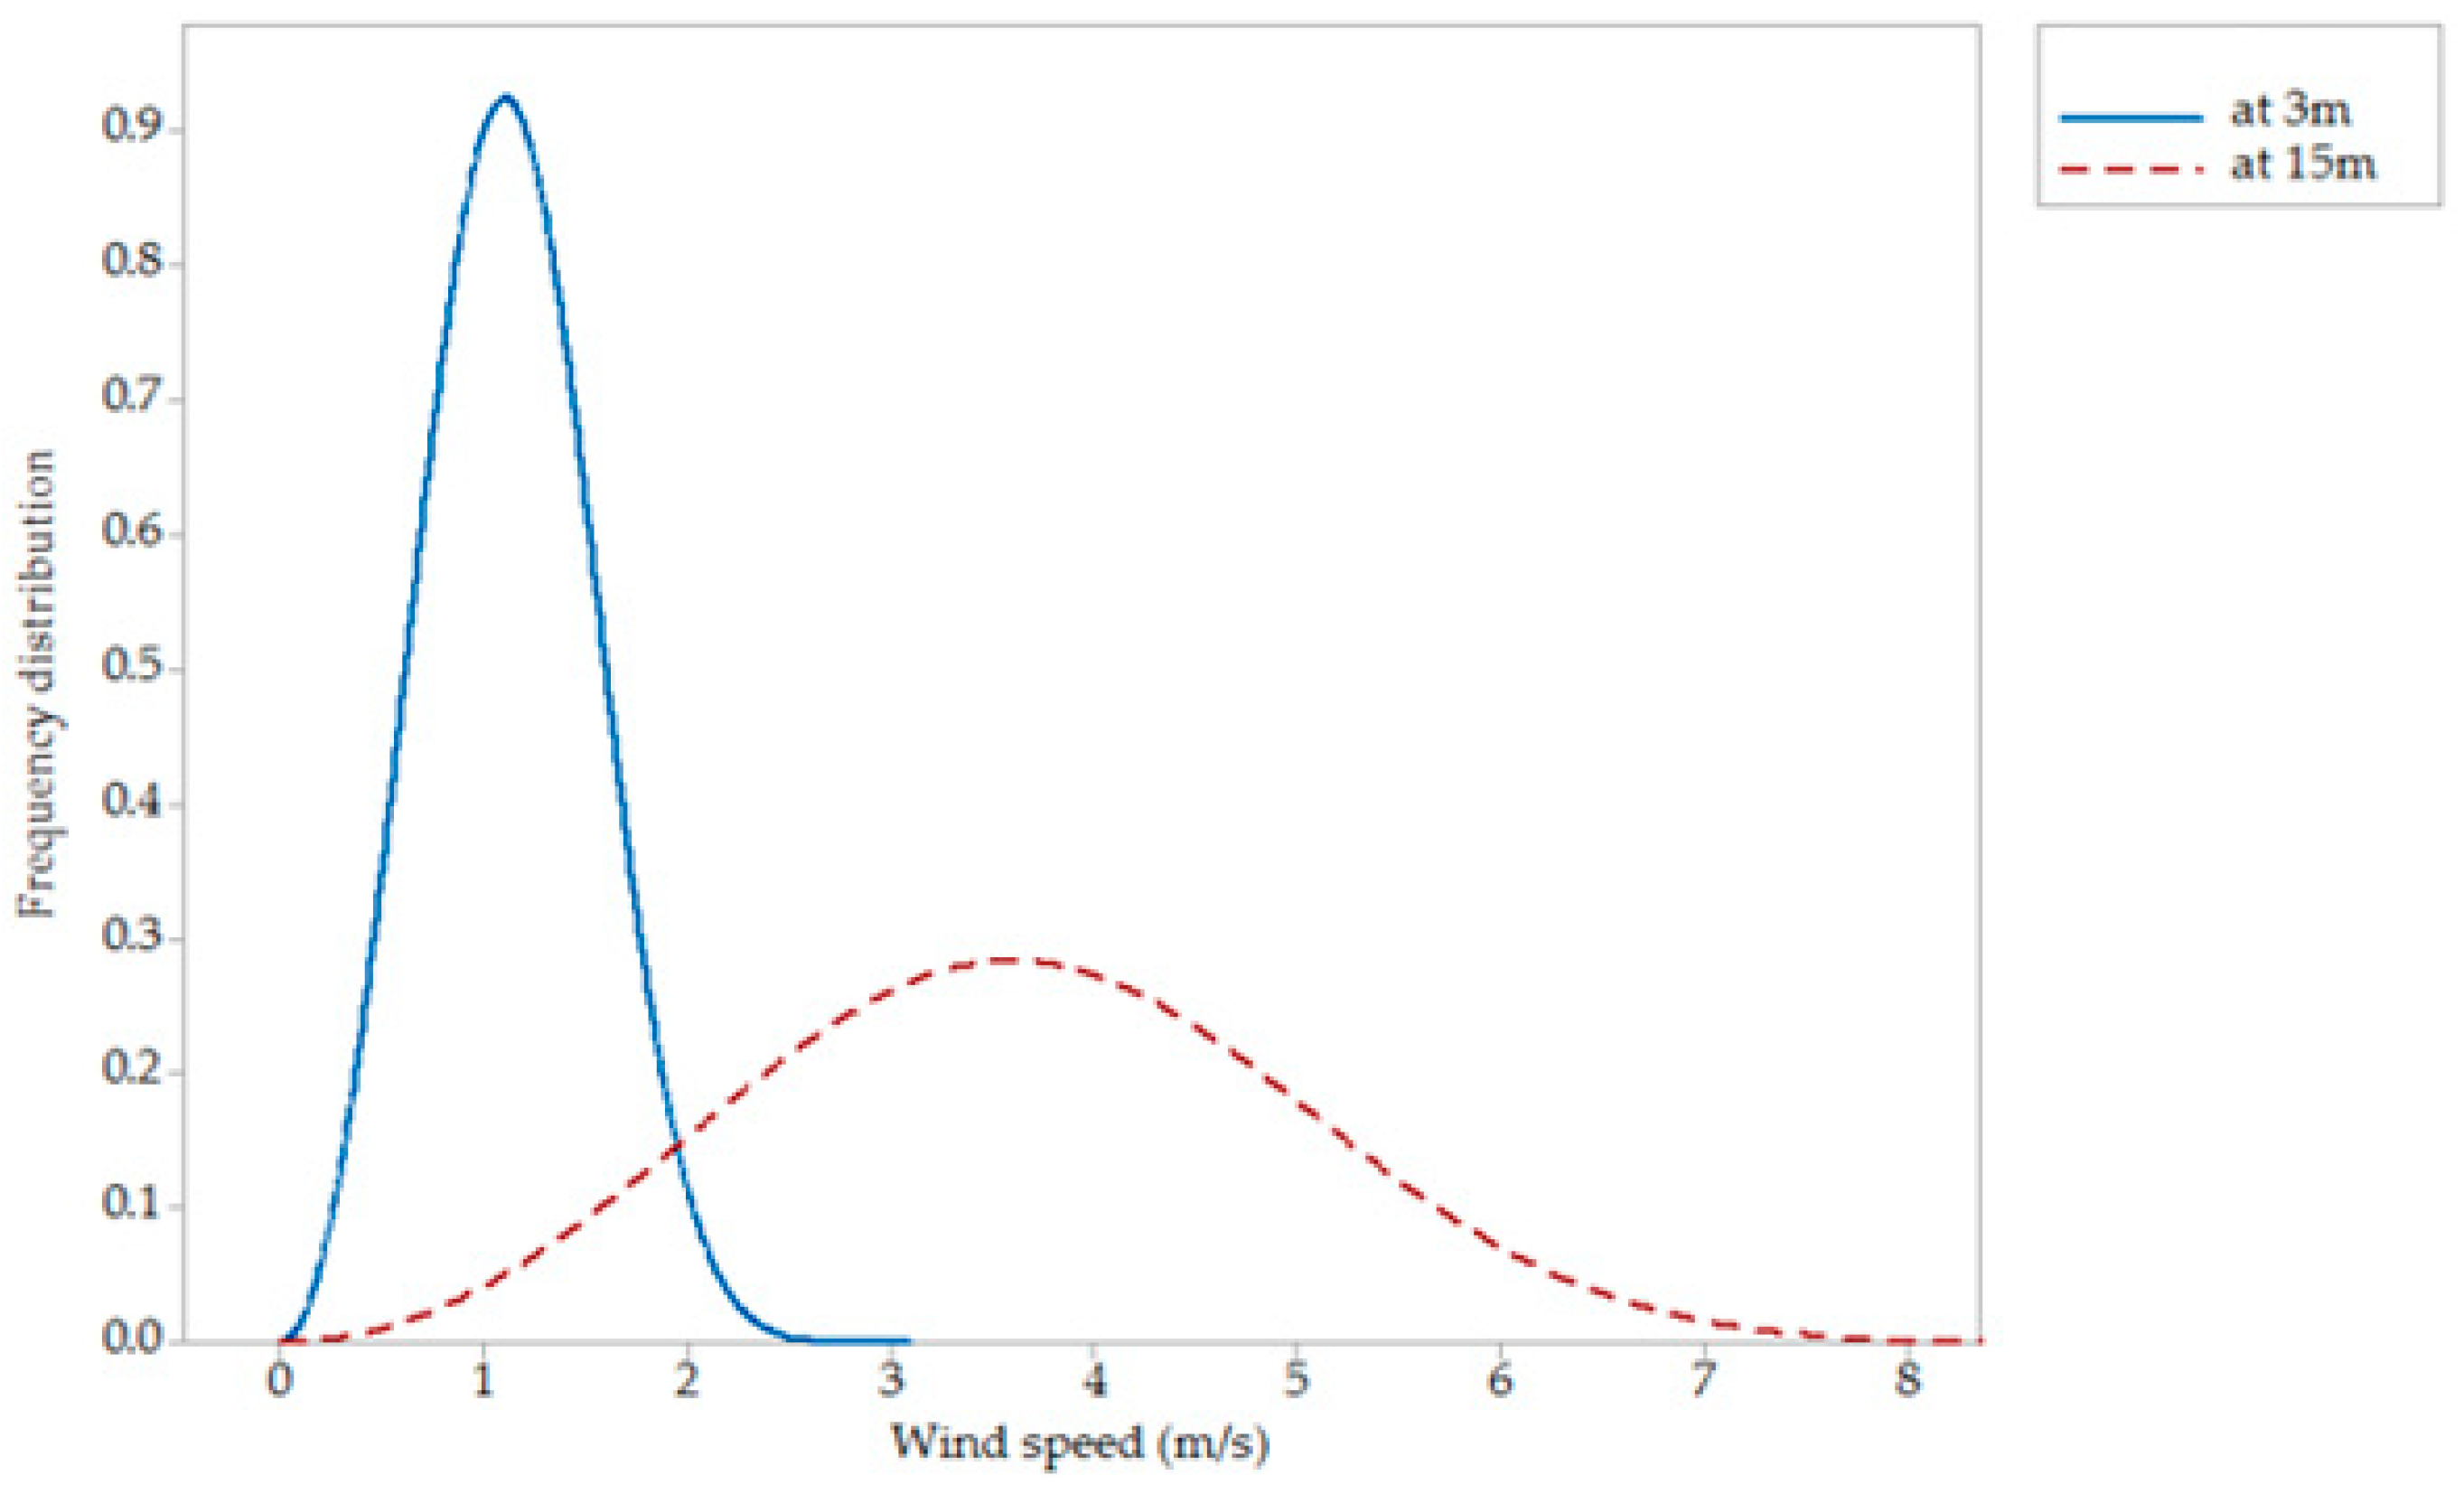
3.1.3. Winter
The probability of having average or higher wind speeds in winter is relatively low, because the probability distribution for winter is again slightly skewed towards low wind speeds, as shown in
Figure 4.
The modal power densities are both categorized are and at the respective heights hence categorized as fair. Thus, winter wind speeds are more favorable for operating a BEWT compared to those for autumn. The corresponding maximum power densities achievable in winter are at and at , both which fall under the fair category.
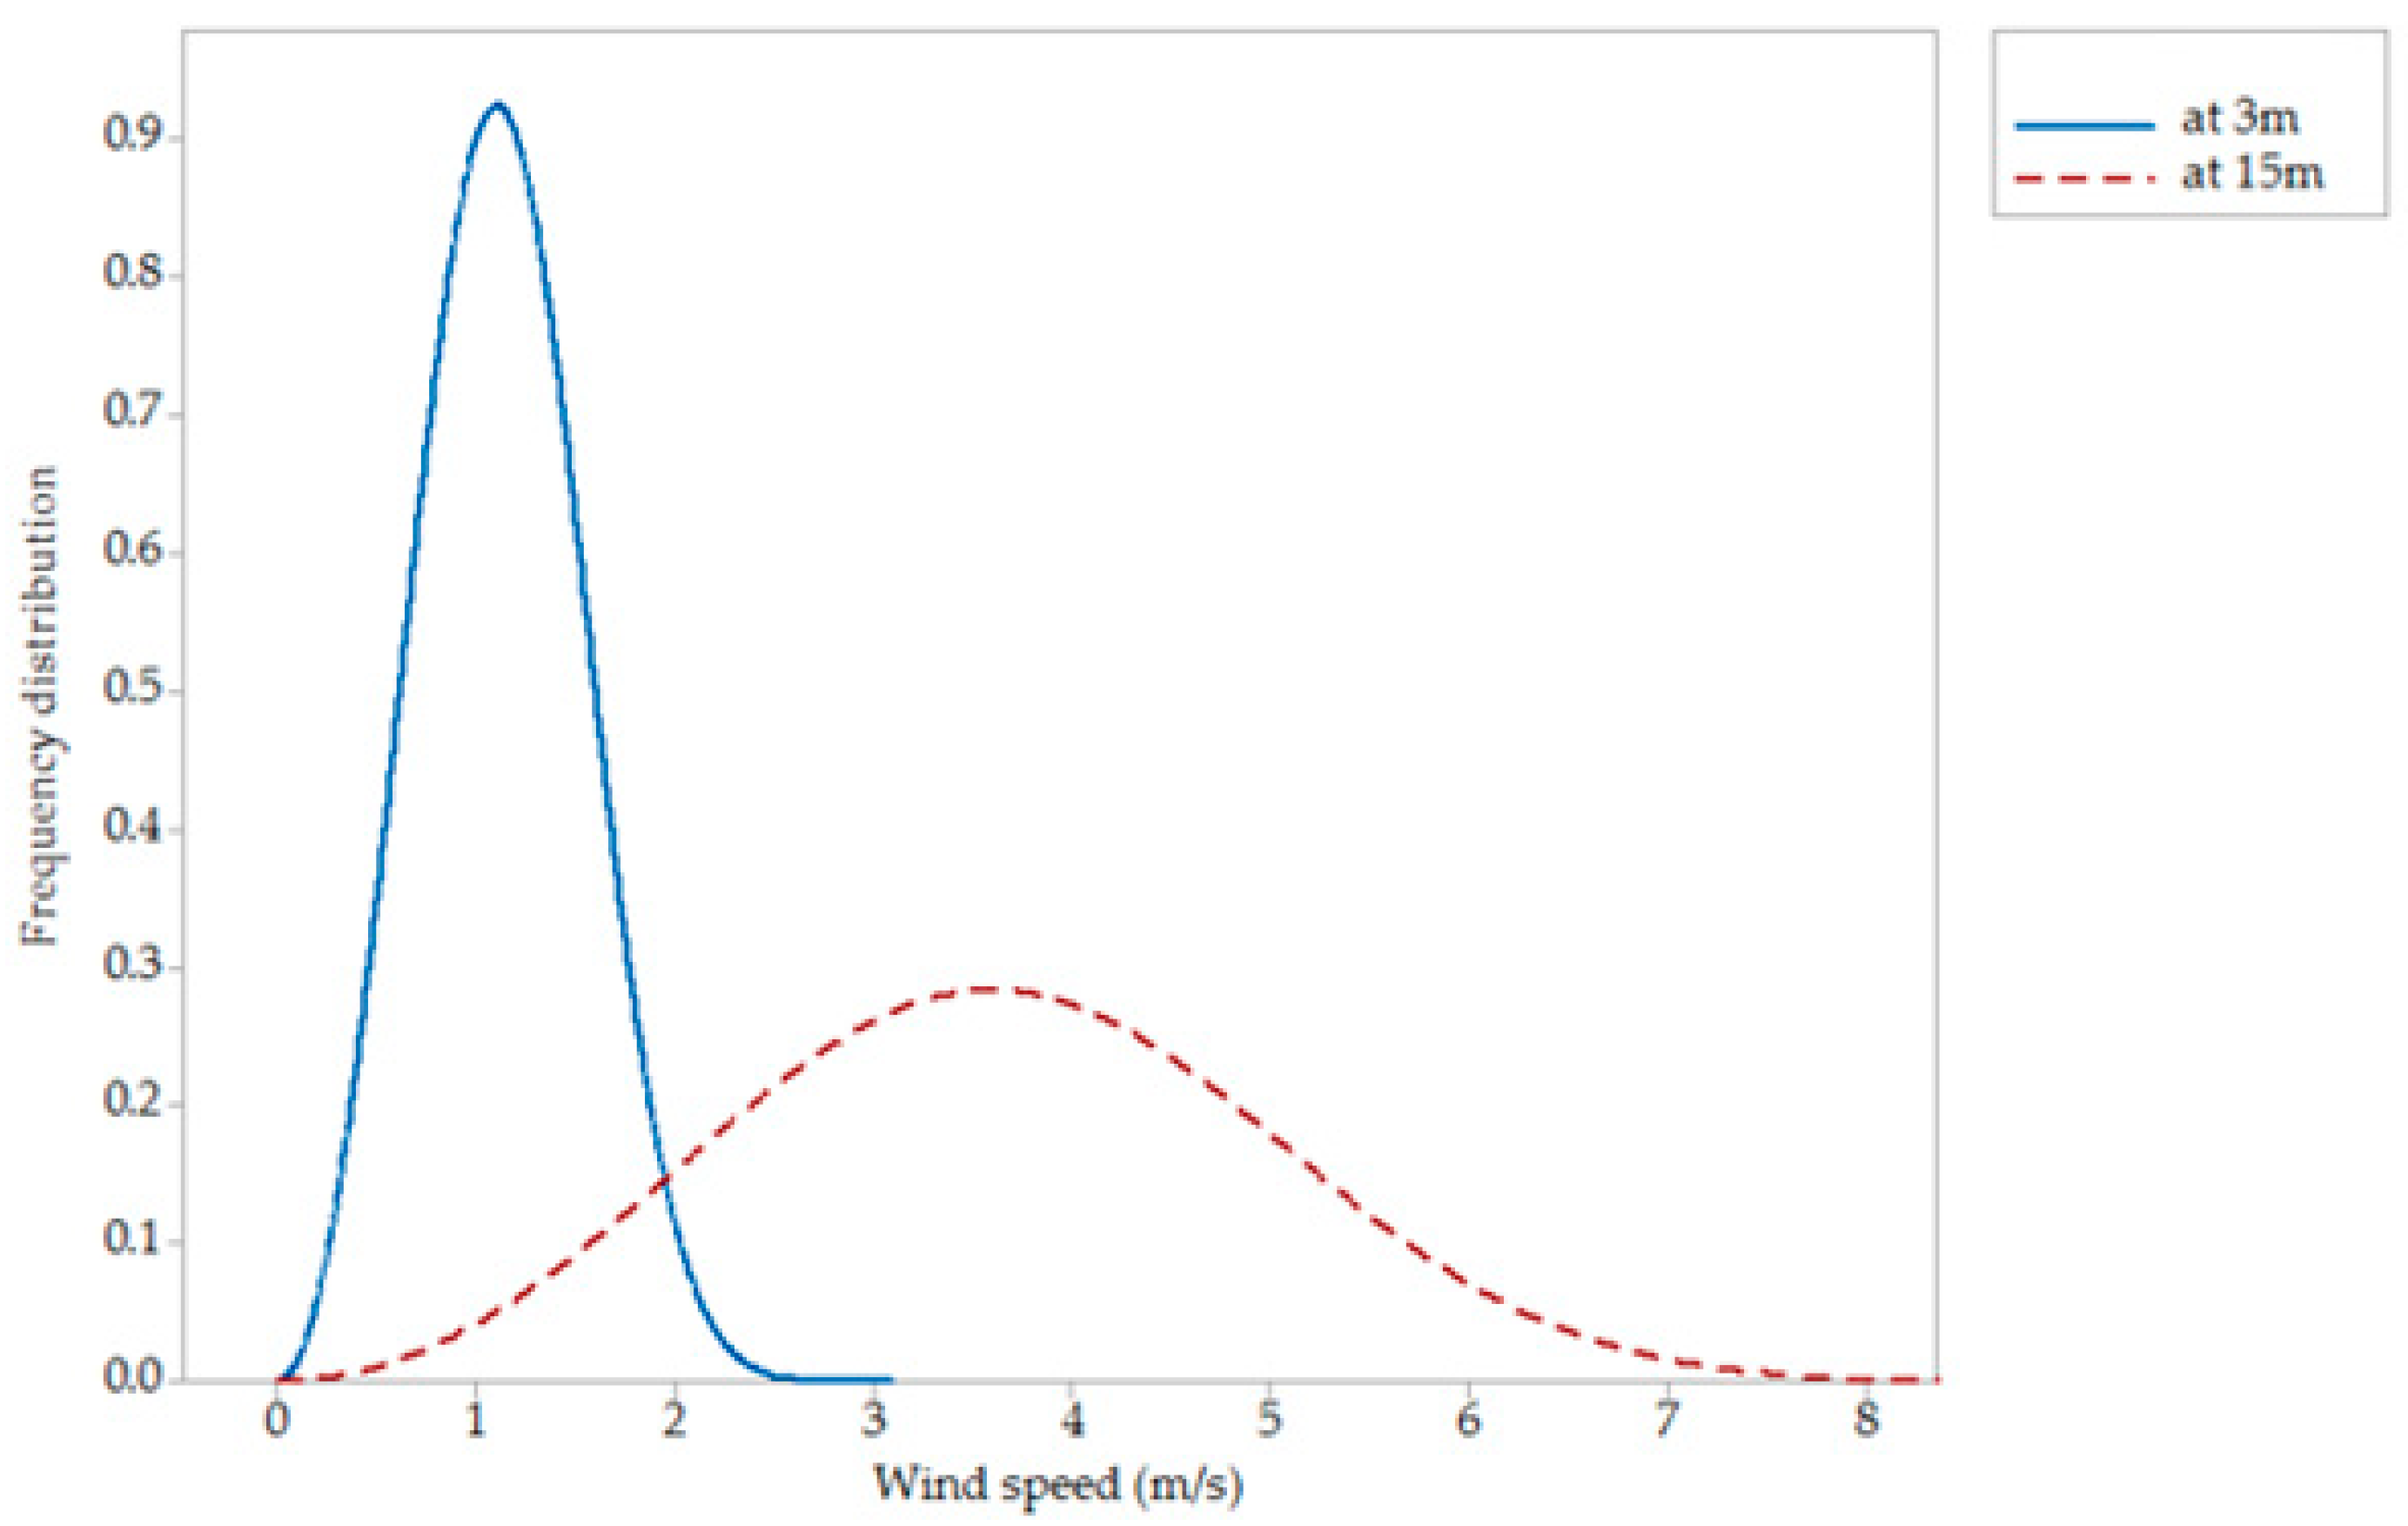
3.1.4. Spring
The distribution for wind speeds in spring is shown in
Figure 5.
It can be observed that the distribution is skewed towards low wind speeds. The most probable power densities are and at 3-m and 15-m heights, respectively. Thus, the wind conditions for spring can be categorized as fair for operating a BEWT, with the maximum power densities achievable being at and at .
3.1.5. Overall
Generally, the wind speed distribution for Fort Beaufort is slightly skewed towards low wind speeds (
Figure 6); hence, the probability of having below average wind speeds is slightly high.
The average modal power densities for Fort Beaufort are and at and respectively. Thus, wind conditions for Fort Beaufort can be categorized as fair for operating a BEWT, with the average maximum power densities achievable being at and at .
4. Conclusions
The most probable seasonal power density for Fort Beaufort is in the range of to at a 3-m height. At a 15-m height, the most probable seasonal power density ranges from to . Thus, seasonal wind conditions for Fort Beaufort can be categorized as fair to fairly good for operating a BEWT, with the maximum power densities achievable being at and at . However, the BEWTs can best be deployed at for a fairer power output, as roof height wind speeds require BEWTs of very low cut-in speeds of that are not readily available on the market. Therefore, it is recommended to install BEWTs at otherwise low cut-in speed BEWTs should be used on rooftops.


