1. Introduction
In recent years, the large populations have been referred to as “rising stars”, “rising powers” [
1,
2], or bottom of the pyramid (BOP) segments [
3]. These people do not have sufficient resources for day-to-day living, but they retain the possibility for abundance in other life dimensions. These large BOP groups have also been recognized as offering new market opportunities, as noted by Prahalad [
3], once their daily demands and requirements are addressed and fulfilled.
Prahalad [
3] pointed out that enterprises can help to eliminate or alleviate poverty through the development of BOP markets using innovative technologies and business models. The potential for the BOP segment is huge, however, poor infrastructure and cultural differences continue to pose significant challenges. Therefore, MNEs need to create mutual value and provide the right kinds of operational support, such as putting in place physical infrastructure, providing financial services, and knowledge and skills development, and incorporates these people at different level of the supply chain.
To create a mutually beneficial process is very complex. Sodhi and Tang [
4] highlights this problem would cost a lot of efforts and resources to redesign and operate supply chain. Previous related studies focusing on the singular difficulty of addressing the BOP segment include the following topics: product development [
5,
6,
7], business models [
2,
8,
9], partnerships [
10,
11], marketing and distribution [
12,
13]. However, few of them are systematically arranged to analyze how supply chain management can be applied to integrate the BOP into the value position and creation appropriately. The reason is there are many unquantifiable factors (such as culture differences, lack of market power, etc.) for any company. Therefore, a systematic method is needed to help the MNEs to identify those critical factors and solve them systematically.
In this paper, a survey is developed based on the four stages in the value chain: raw material purchasing, production and manufacturing, distribution and logistics, and marketing and sales [
14]. In addition, product design and capital are also considered since they will dominate the decision-making process of the supply chain network design from the case studies [
11]. The survey is then distributed to the MNEs and local manufacturers to find the differences and identify the critical factors systematically for the BOP market based on the Importance-Performance Analysis (IPA). Finally, the differences are compared between MNEs and local enterprises to highlight the strategies.
The outline of this paper is as follows. First, a literature review on the BOP market strategies for the BOP markets is presented. The next section describes the research methods used in this study. Some comparisons are performed based on Importance-Performance Analysis. Finally, the empirical data is analyzed, and conclusions are drawn.
2. Literature Review
Previously, many MNEs are experienced in the supply chain activities to meet the demand of those markets at the top of the pyramid (TOP). However, for the BOP market, the supply chain activities are different since there exists differences in culture, infrastructure and regulations. In this section, the MNE’s BOP strategies are reviewed.
2.1. MNEs’ BOP Market Strategies
Initially, MNEs considered the low-income BOP markets only as consumers who provide opportunities—BOP 1.0. There was no deeper acknowledgment of additional supply chain issues. However, research has gradually evolved into viewing the BOP as an integral part of value creation as partners: suppliers, producers and retailers. Value chains for the BOP markets are dynamic entities that learn and evolve over time. Some of this has been discussed [
14,
15,
16,
17,
18,
19] previously, overall there is little research done on the implementation and management of supply chains for the BOP markets.
However, people living at the BOP typically cannot predict their incomes, even in the short run. Moreover, BOP populations tend to be relatively isolated, leading to strong local cultures and less contact with national or international consumer habits [
20]. Also, those in the BOP may not have adequate education, health care, or access to appropriate infrastructure. They are often not well served by the private sector, and they tend to pay more than the TOP for the same products. BOP consumers lack the knowledge, skills, and resources to fulfill their demand. Since the strategy of “selling to the poor” is not workable, Prahalad and Ramaswamy [
3] suggested that organizations create value through co-creation with BOP consumers, which became BOP 2.0. Normally, there are three major processes in value co-creation: the customer value-creating process, the supplier value-creating process, and the encounter process [
21]. Hence, value can be created between the customer and the supplier.
From the perspective of value creation, one way to increase the value proposition for more actors is to utilize local supply chains [
22]. In this way, local communities are included as producers [
23], which increases wealth throughout the supply chains [
24]. This is referred to as BOP 3.0., which is a kind of inclusive business strategy [
25,
26]. Here the definition of inclusive business based on the definition by UNDP [
27] (United Nations Development Program), as one that engages the poor along the entire supply chain network development: as clients and customers and on the supply side as employees, producers, and business owners. The main features of BOP 1.0, 2.0 and 3.0 are shown in
Table 1.
2.2. Designing the Value Chain for Success at the Bottom of the Pyramid
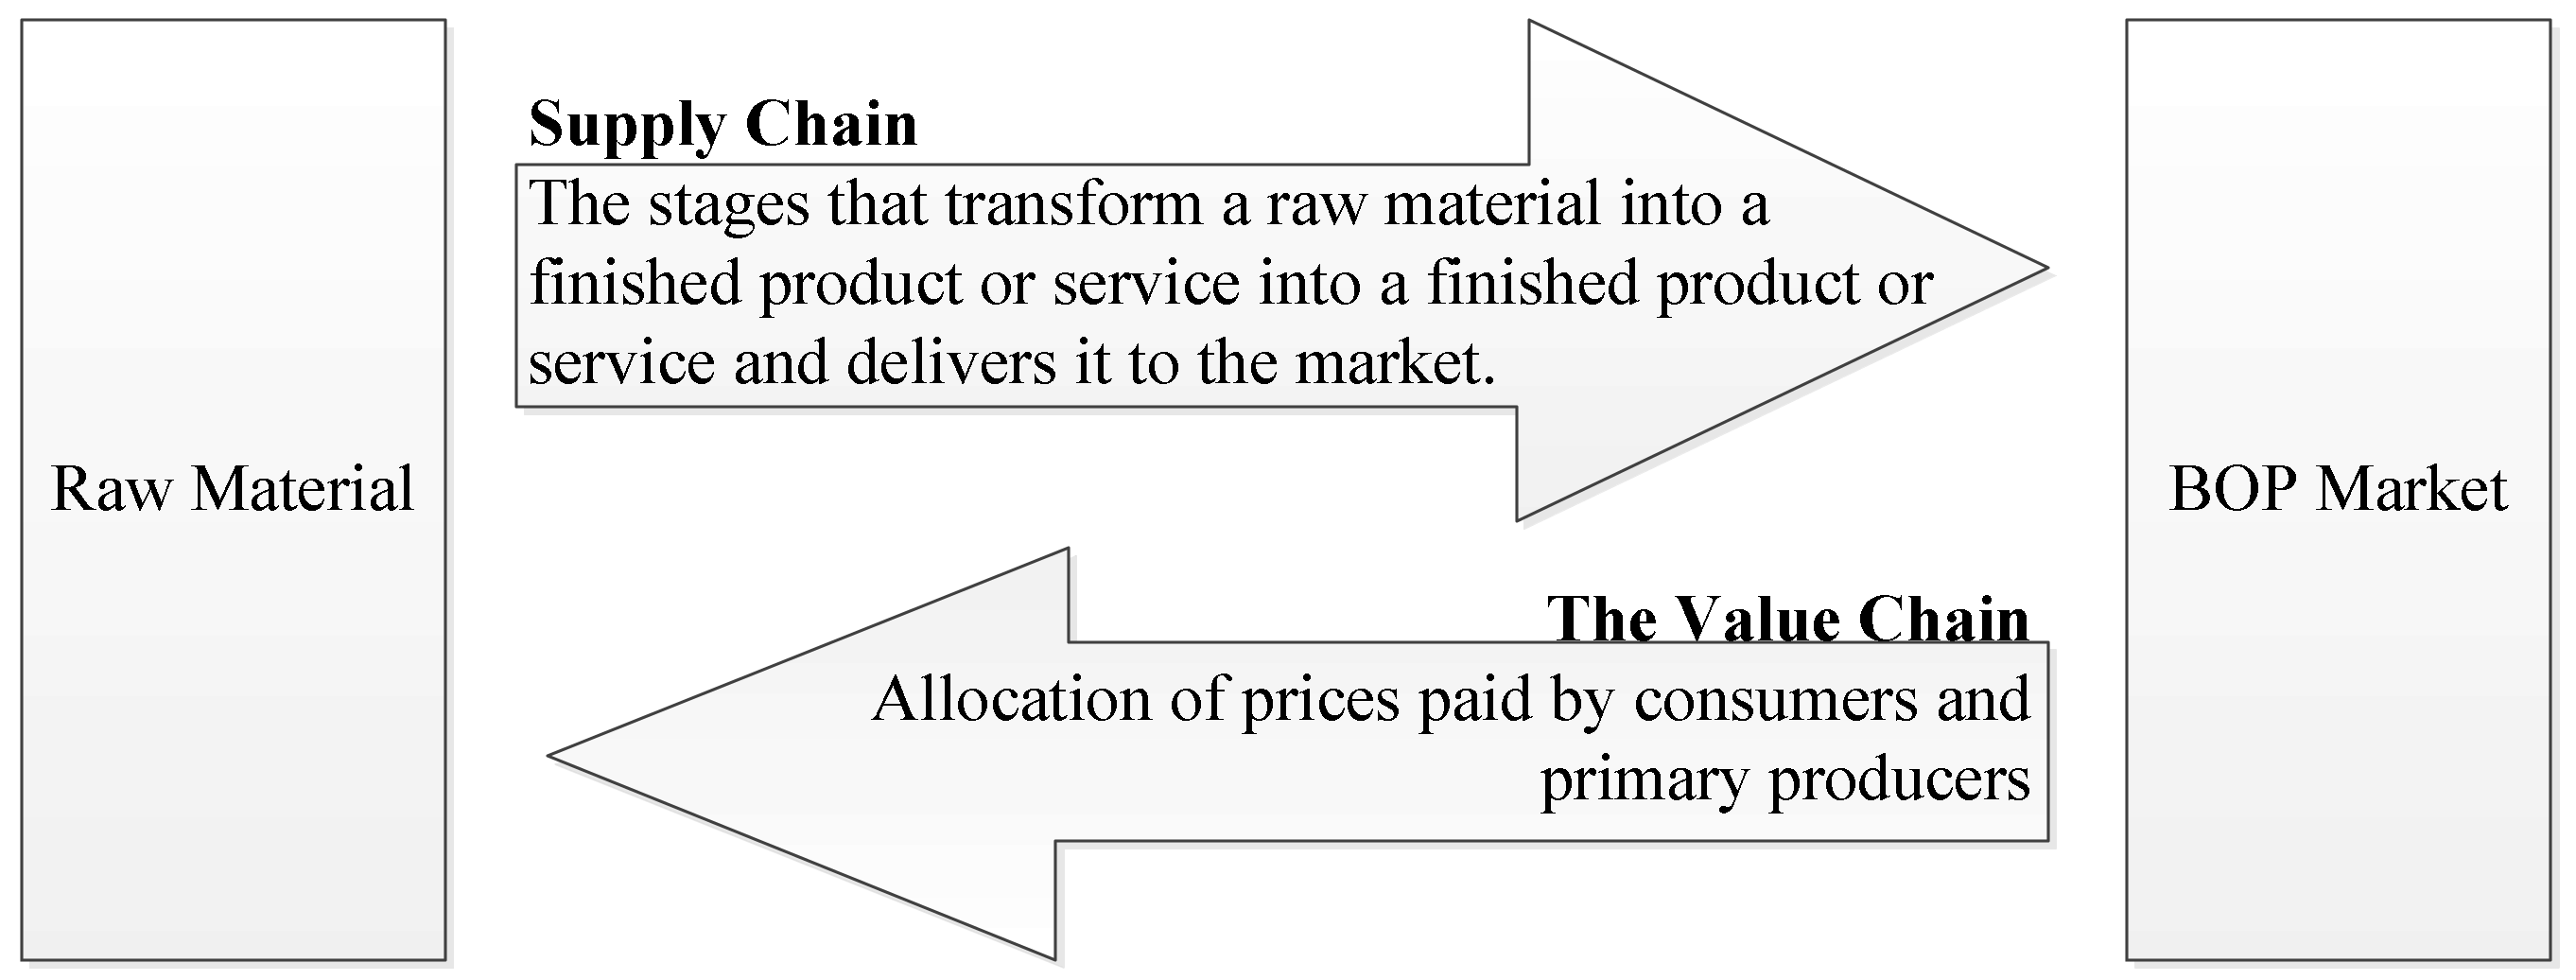
A profitable value chain requires matching the demands of the consumers and what a company produces. For the supply chain, it comprises the flow of all information, products, materials, and funds throughout the various stages of creating and selling a product. The difference between a value chain and a supply chain is that a supply chain is the process where several parties are involved in the process of fulfilling a customer request, while a value chain is a set of interrelated activities a company undergoes to create a competitive advantage [
28].
Figure 1 shows the value and supply chain of fulfilling the BOP consumer’s needs. Since the BOP market is changing into a mutually beneficial venture, the MNEs should revise their supply chain design.
A successful development of the BOP markets relies on a proposition of mutual value creation—the greater the ability to the MNEs to meet the needs of the poor, the greater the return for the partners involved. Also, the MNE must understand its industry and competitors and develop appropriate strategies and supply chain activities.
In order to create mutual value for the BOP market and MNEs, Parmigiani and Rivera-Santos [
14] summarized that MNEs must cope with a lack of intermediaries and formal institutional support in the product, labor, and capital markets, as well as ambiguities in regulation and the lack of formal contracting system [
29,
30]. Adhikari, Collins [
31] emphasized that the relationship of the BOP market development within a value chain is not only an economic phenomenon but also has behavioral and social dimensions. Hall and Martin [
32] proposed several uncertainties that include technological, commercial, organizational, and societal uncertainties. These issues create challenges for companies that wish to successfully enter markets and remain in them over time.
3. Methods
3.1. Research Framework
Prahalad [
3] emphasized that MNEs should adapt their supply chain to different nations and cultures if they want to have successful BOP marketing. To address the factors of BOP marketing, Parmigiani [
14] considered four stages in the value chain: raw material supply, production/manufacturing, distribution/logistics, and marketing/sales. In addition, product design should also be revised based on BOP requirements and the capital that dominates decision-making during supply chain network design [
11]. In this study, a questionnaire was developed based on the six factors and questionnaire development consisted of four steps: (1) the selection of an adequate number of suitable items from published studies to form a questionnaire draft; (2) field expert review and feedback to ensure valid content; (3) data collection through surveys of people who worked in Taiwanese industry and relevant results analysis; and (4) comparison of the results of Taiwan’s MNEs with Indonesian companies.
Based on factors of the supply chain management in BOP market, the questionnaire was initially developed. In
Table 2, 38 factors are extracted from the related references in different stages of the value chain and the supply chain for the BOP market. Then, it is revised based on the comments of two experts who had several years in BOP marketing development. The first expert is a project manager who focuses on sustainable planning and BOP marketing development. The second expert is a marketing manager in charge of product design. The questionnaire was originally written in English, and then it was translated into Indonesian; the questionnaire in the Indonesian language was pretested by Indonesian students. The questionnaire consists of two parts. The first part addresses the basic data of a company, while the second part has questions about the institutional gaps for BOP in the following supply chain stages: product design, raw material, production and manufacturing, distribution, and marketing, and capital. The content of the questionnaire was checked for consistency with local customs to ensure that it was not discriminatory towards BOP populations.
3.2. Data Analysis Method
The data were encoded and analyzed using SPSS. The analytic methods included the following:
- (1)
Descriptive statistics: These are used to study differences in decision-making in BOP marketing for different industries. The smaller the standard deviation, the more consistency there is in the decision-making.
- (2)
Factor analysis: This is a multivariate method used for data reduction purposes. When using this method, the basic idea is to represent a set of variables by a smaller number of variables.
- (3)
Construct validity. In this research, convergent and discriminant validity are used. Both methods are considered for subcategories or subtypes of construct validity.
- (4)
Reliability analysis: Cronbach’s α was used to measure the questionnaire’s consistency and reliability. The Cronbach’s α coefficient was above 0.70, indicating high reliability. A score between 0.35 and 0.70 is acceptable, while one below 0.35 should be rejected.
- (5)
Pearson correlation analysis: A correlational analysis of countries’ cultural traits and BOP product design was used to explore the collinearity between variables.
- (6)
Mean difference test: A t-test was used to test the average mean of the two countries.
- (7)
Importance—Performance Analysis (IPA) [
38]: A technique for measuring attribute importance and performance is developed as an analytical tool. The quadrants and implications of IPA are shown
Table 3.
4. Results
4.1. Descriptive Statistics for the Sample
The survey was distributed through email and regular mail, and the survey period was from May to July 2015. The paper-based surveys were distributed to 700 potential industry participants in Taiwan, of which 338 (48.2%) were collected, as shown in
Table 4. In
Table 5, the average market share of the sample companies in Indonesia is about 6.6%. The BOP local manufacturers in Indonesia were surveyed. The survey was distributed through approximately 50 emails to local small to medium enterprises (SMEs). Both surveys were checked for inconsistencies. In the end, a total of 301 valid samples were collected and analyzed in Taiwan, while there were 29 valid responses from Indonesia. The industries represented in this research are categorized as electronics companies, electric companies, and others (textile, plastics, chemicals, and so on.). Interest in BOP marketing was also surveyed.
4.2. The Descriptive Statistics for Importance and Performance
To understand the dimensions of importance and performance for each company, importance was measured using a five-point Likert scale, with responses to survey questions ranging from “strongly disagree” to “strongly agree”; performance was measured in a similar manner on a five-point Likert scale, with responses also ranging from “strongly disagree” to “strongly agree”.
4.2.1. The Importance and Performance for Different Stages in the Supply Chain
The factors are renumbered based on the different supply chain stages (as shown in
Table 6). For example, P1 = 1, P2 = 2, P3 = 3, P4 = 4, R1 = 5, …, F5 = 37, F6 = 38. It showed the top five importance factors as M1 (4.21), M9 (4.21), M10 (4.21), M2 (4), and M5 (4). All of these factors are included in the stages of production and manufacturing. This shows that the enterprises are more focused on the stage of production and manufacturing when considering emerging markets. Conversely, the four lowest important factors are F3 (2.96), F4 (2.93), F5 (2.89), and F6 (2.77) indicating that enterprises do not focus on capital (financial support) when considering entry into emerging markets. For performance, the five highest factors are M (3.3), M9 (3.26), M10 (3.25), M2 (3.13), and M5 (3.12). All five factors are also in the stage of production and manufacturing, consistent with importance. The lowest four performance factors are the same as those for importance, demonstrating a similar finding with respect to capital. The value of
IF is calculated to be between −20~−35%. This means improvements are needed for all the factors.
4.2.2. Validity of Importance
Based on the suggestions of previous research, all the values of Cronbach’s α should be higher than 0.7, otherwise, the questionnaire should be revised. According to the survey result in this research, the validity of this research is 0.959. For each factor, the validity is also greater than 0.7: product design (0.709), raw material purchasing (0.843), production and manufacturing (0.896), distribution and logistics (0.870), marketing and sales (0.916), and financial support (0.925).
Furthermore, the questionnaire is also tested using critical factor analysis (CFA). Fornell [
40] suggests the mean value should be higher than
0.5. If the value is higher than
0.5, it means the factor is representative. In this research, all the mean values are between
0.56 and
0.91: product design (
0.54), raw material purchasing (
0.59), production and manufacturing (
0.53), distribution and logistics (
0.91), marketing and sales (
0.64), and capital (
0.74), showing the representativeness of the results of this research.
4.2.3. The Correlation of Importance and Performance
In this study, the data for importance and performance are measured by Pearson correlation. Correlations are between −1 and 1 and can be categorized as high correlation (0.5 to 1.0 or −0.5 to −1.0), medium correlation (0.3 to 0.5 or −0.3 to −0.5), and low correlation (0.1 to 0.3 or −0.1 to −0.3). The closer the value of r gets to zero, the greater the variances of the data points are around the line of best fit.
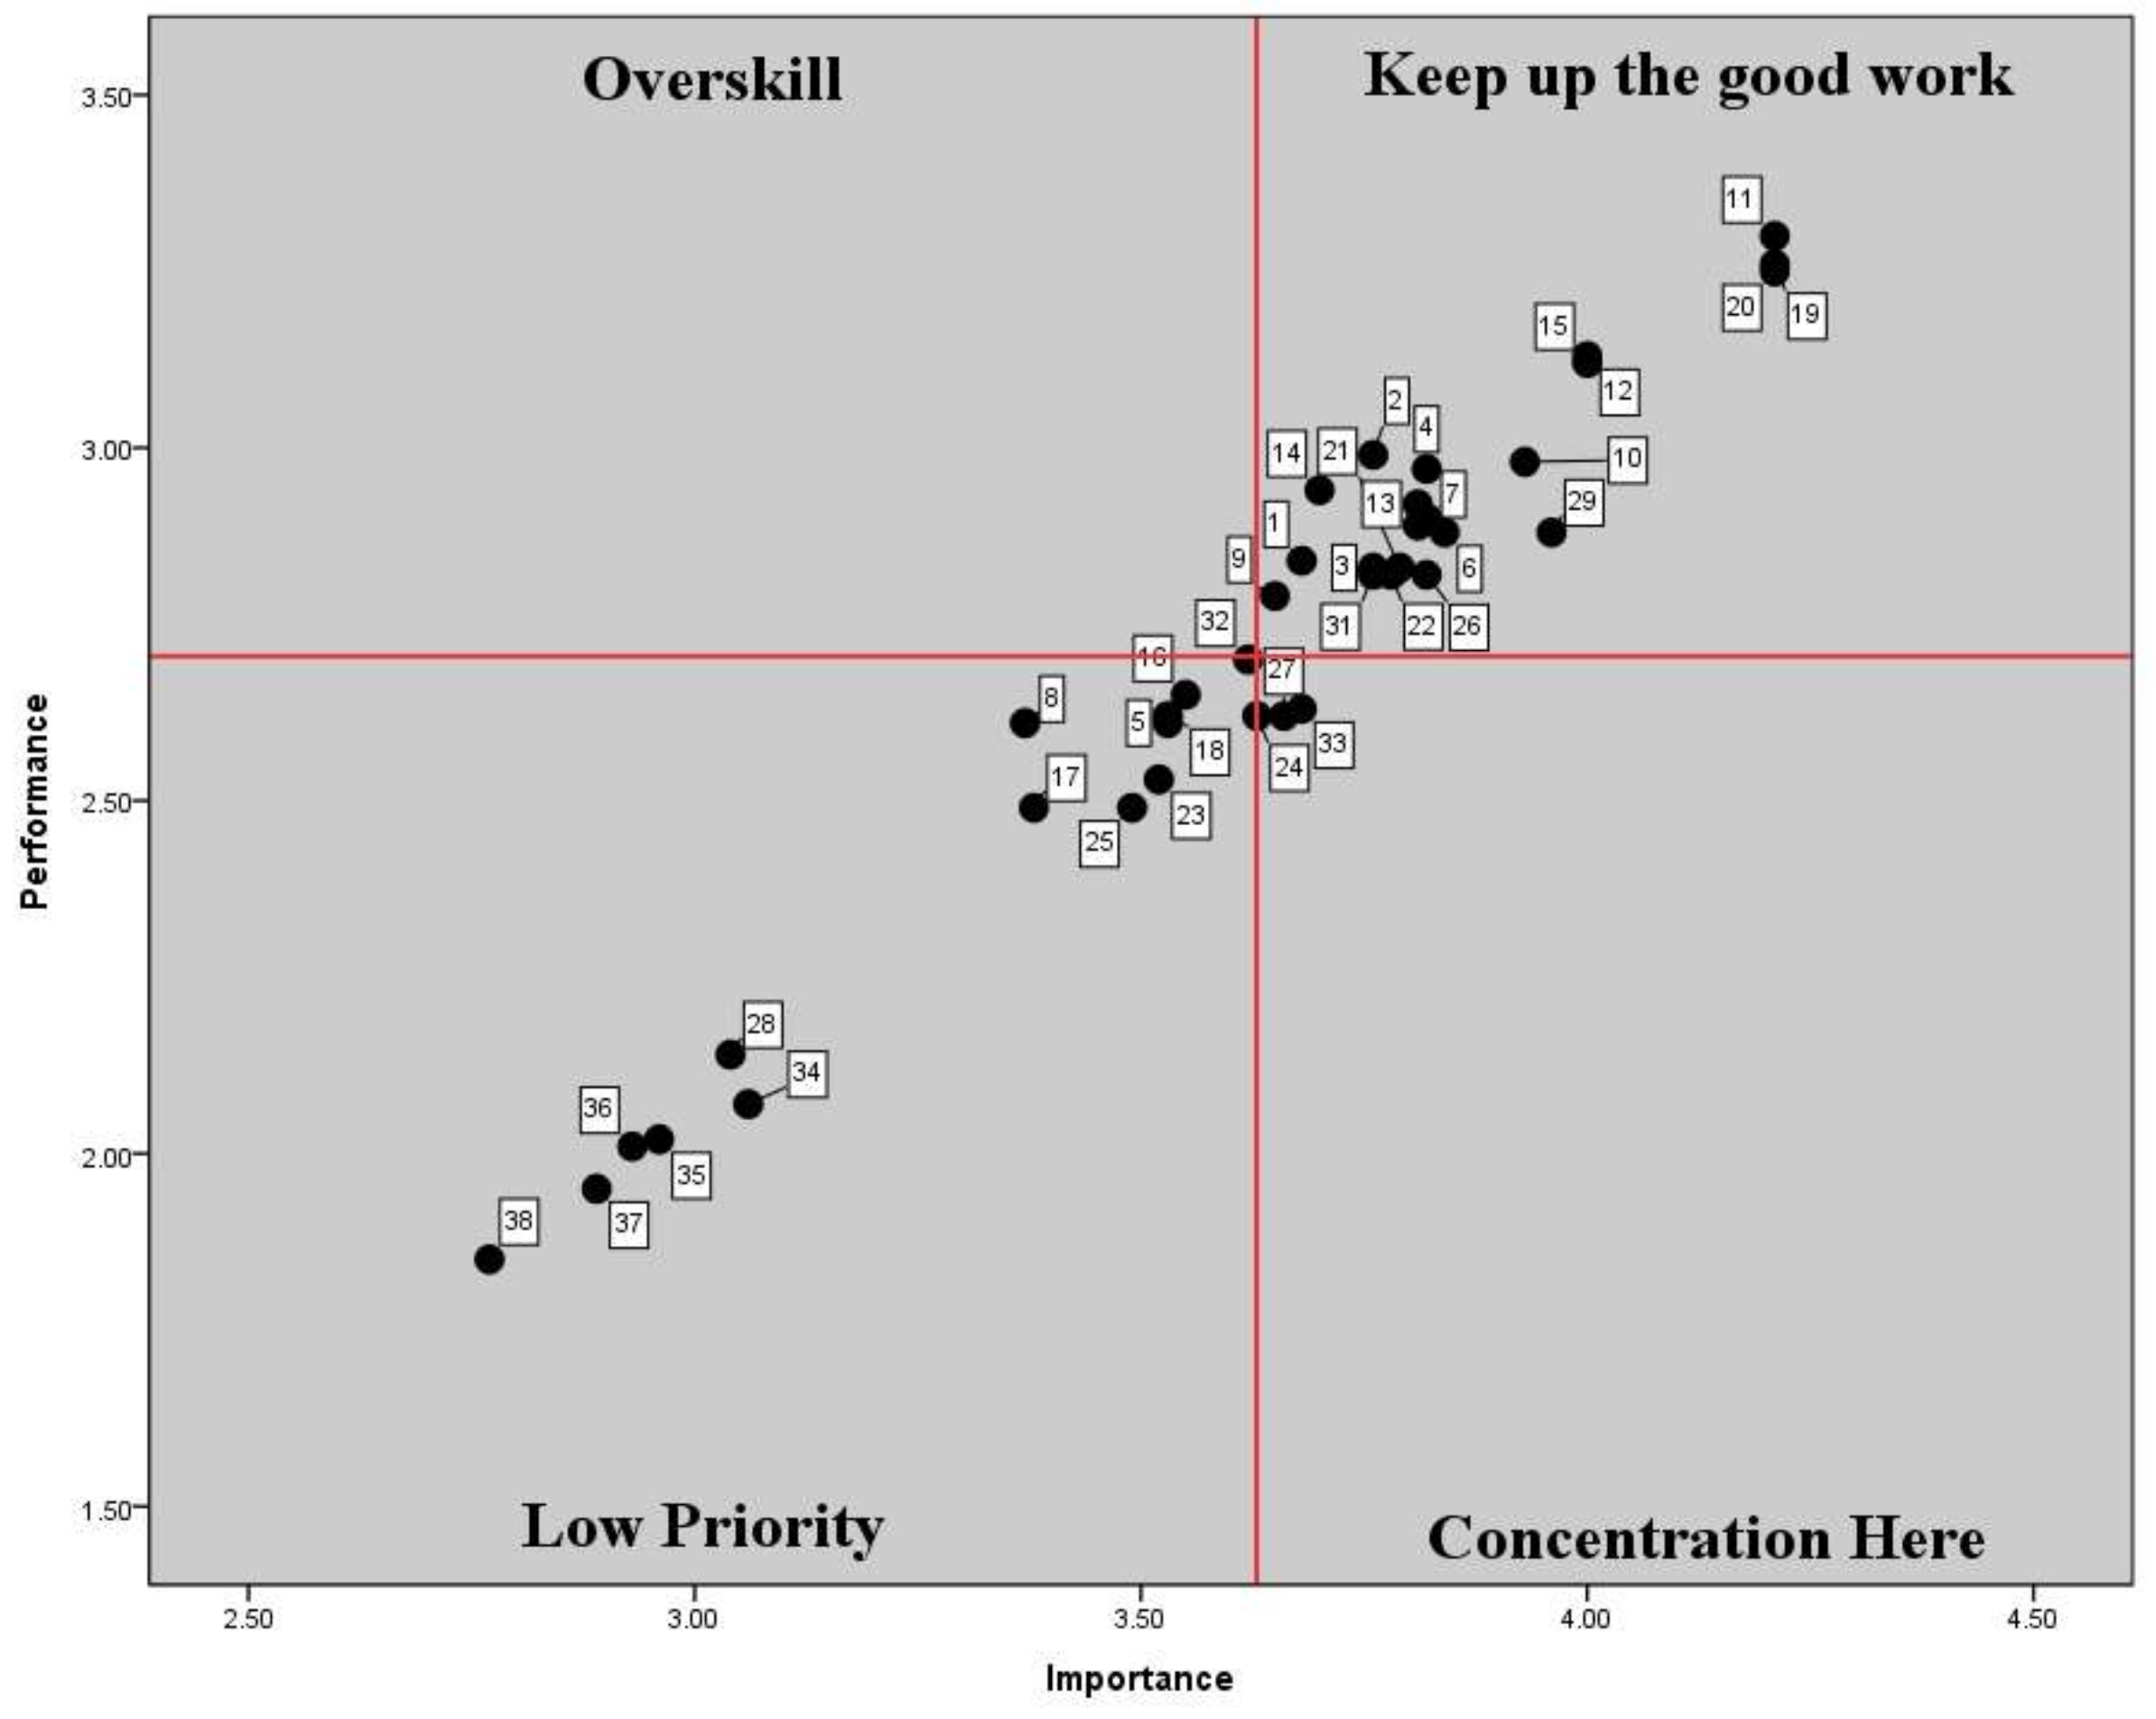
4.2.4. The IPA Analysis
In
Figure 2, all the factors are mapped to the IPA diagram using SPSS. For example, the MNEs in Taiwan think the importance is 3.68, while, the performance is only 2.84. It means the performance is behind as the importance. It shows that most of the factors are located in the area of “keep up the good work”. It means most factors are good. However, in the “concentration” area, there are factors of 24[D4], 27[S3], 32[S8], and 33[F1]. For the “over skill” area, there are factors of 9[R5] and 32[S8]. For the area of “low priority”, there are several factors: 5[R1], 8[R4], 17[M7], 18[M8], 23[D4], 25[S1], 28[S4], and 34–38[F2–F6]. This shows that MNEs in Taiwan listed cost factors as low priority.
Figure 3 shows that for local manufactures in Indonesia, most factors are also located in the area of “keep up the good work”. For the “concentration” area, there are factors of 7[R3], 9[R5], 13[M3], 21[M10], and 23[D3]. For the area of “over skill”, there are factors of 27[S3] and 28[S4]. For the area of “low priority”, there are several factors: 2[P2], 5[R1], 8[P4], 25[S1], and 35–38[F3–F6].
Concentration here
- ●
24[D4]. It should provide innovative and convenient methods to distribute goods to local residents (such as storing milk in refrigerated containers when transporting).
- ●
27[S3]. The foreign enterprises should provide user experience for their customers.
- ●
32[S8]. The foreign enterprises should cooperate with local retailers.
- ●
33[F1]. The foreign enterprises should have joint ventures with local material suppliers.
- ●
7[R3]. In order to reduce the cost of production, the raw material should be purchased from local suppliers.
- ●
9[R5]. The enterprises should purchase materials locally to minimize the environmental impacts of transportation processes.
- ●
13[M3]. Foreign enterprises should provide new technologies in these emerging countries.
- ●
21[D1]. The foreign enterprises should provide training in local distribution for residents” if appropriate
- ●
23[D3]. The foreign enterprises should build a decentralized network to distribute the products. Using this method, they could improve ineffective distribution infrastructure.
4.3. Test of Equal Variances for Different Industry Types
To understand if there exist any differences in the IPA among industries, the survey is distributed to the respondents in Taiwanese enterprises who are interested markets. Enterprises were classified in terms of the following categories: LEs (large/micro) and SMEs (small to medium enterprises). The Levene’s test of equal variances is performed to test the consistency of different types of samples. Levene’s test [
41] is used to test if
k samples have equal variances, and equal variances across samples is referred to as homogeneity of variance. Some statistical tests, such as the analysis of variance, assume that variances are equal across groups or samples, and the Levene’s test can be used to verify that assumption. If the value for the test is greater than 0.05, then there is not homogeneity of variance.
Appendix A shows that the viewpoints of LEs and SMEs are consistent as to the importance of each question. It was found that the mean values in the LEs were greater than the SMEs, showing that these factors are more important to LEs than to SMEs. Also, only six question are significantly different with respect to Importance:
11[M1],
12[M2],
13[M3],
16[M6],
19[M9], and
20[M10]; while seven question are significantly different with respect to Performance:
11[M1],
12[M2],
15[M5],
16[M6],
19[M9],
20[M10], and
21[D1].
4.4. Differences in Importance for MNE Enterprises in Taiwan vs. Local Manufacturers in Indonesia
Figure 4 shows the differences in importance for MNE enterprises in Taiwan vs. local manufacturers in Indonesia. Factors 16[M6], 18[M8], 23[D3], 24[D4], 32[S8], and 34[F2] are highlighted as “over skill”. It means NME enterprises in Taiwan did not emphasize these factors, while the local manufactures in Indonesia did. Factor 16[M6] focused on creating job opportunities through foreign enterprises and increasing income levels by employing local residents. Factor 18[M8] pertains to the usage of renewable energy in manufacturing plants to minimize pollution, and factor 23[D3] is related to decentralized network distribution systems to improve ineffective distribution infrastructure. Factor 24[D4] is related to innovative and convenient methods to distribute goods to local residents. Factor 32[S8] is concerned with foreign enterprises cooperating with local retailers. Factor 34[F2] is in regard to offering small loans for married women. These are the factors more emphasized by Indonesian local manufacturers than by MNEs in Taiwan, which placed more emphasis on factors 1[P1] (innovative product design), 2[P2] (as long as possible), and 31[S7] (business alliances) compared to Indonesian local manufacturers.
4.5. Implications of Survey Results
The value of the Pearson correlation for the Importance and Performance of Taiwanese MNEs shows that importance and performance are correlated. This means the six stages of the supply chain are all emphasized by Taiwanese MNEs. The values for Improvement, which are all negative, suggest that enterprises should emphasize supply chain efforts markets, however, performance lags behind perceived importance. From the IPA analysis, it was very clear that only two areas are strongly prioritized: “keep up the good work” and “low priority”. This means that MNEs in Taiwan are doing well with respect to major indices. Only a few indices should be revised, since they are located in the area of “low priority”. In addition, different industries are categorized and analyzed. Compared to SMEs, the LEs focus on the production and manufacturing stage (M1, M2, M3, M6, M9, M10, and D1). EEs and non-EEs, on the other hand, are mostly focused on the stages of product design, marketing, and sales (P1, P2, P3, P4, R1, M5, M8, S6, S7, S8, and F6). It is worth mentioning that R4, in which purchases should be made locally, is in the area of “over skill.”
From the survey results, MNEs in Taiwan and local manufactures in Indonesia did not consider capital factors as important based on the survey results. Also, with respect to the importance comparison in Taiwan against Indonesia, factors M6 (foreign enterprises should create job opportunities and increase income level by employing local residents), M8 (manufacturing plants should use renewable energy to minimize pollution.), and D3 (foreign enterprises should build a decentralized network to distribute the products.), which is of importance.
5. Conclusions
In this research, the factors in different stages of the value chain and supply chain are proposed and studied, and the resulting contributions are summarized as follows. First, a questionnaire is constructed to assess gap in the value chain and supply chain of the BOP marketing. MNEs and local manufacturers can use this survey measure their efforts in an emerging market. Second, from this research, it could be extrapolated that MNEs might perform well in the BOP market, with just a few factors needing improvement. Also, the MNEs should help local manufacturers to create user experiences for the BOP market.
Based on the results of Taiwan manufacturers and Indonesia manufacturers, some strategies are summarized as follows. Both the MNEs and local manufactures are willing to create mutual value for each other. Especially, the local manufactures need support in marketing, such as to provide user experience, and retailer training. The MNEs hope to have joint ventures with local suppliers to minimize the cost and environmental impacts. However, since the quality of the local supplier is still not good, this approach is still very weak. Therefore, the first strategy is to collaborate with the retailers about marketing issue. Then, the second strategy is to collaborate with the supplier in the sub-core raw material. Through the collaboration, the quality of supplier could be improved.
In addition to the case of Taiwan and Indonesia manufacturers, some general managerial implications of this research are summarized as follows. MNEs should continue to focus on the factors of production and manufacturing, such as training and skills to adapt BOP cultural differences. In addition, MNEs should consider the local government policies and tax reduction. However, financial support and loan payment are not emphasized by MNEs and local manufacturers in this study. It means that capital is an important issue but not urgent. Local manufacturers are concerned about the supplies of raw material and technology transfer, and these manufacturers look to MNEs to help them source local raw materials. These results are also supported the results of MNEs marketing strategy—from BOP 1.0 to 3.0. The NMEs may include the BOP as their employees, producers, and business owners. Through co-development, local manufacturers can progress to become partners in the supply chain with MNEs. This is related to the strategy of MNEs to enhance supplier capability through training.
Some limitations should be highlighted. The first is that the sample MNEs are only selected from Taiwan and Indonesia. To be more robust, the MNE sample should draw from different countries, since the result of the different BOP in different countries will be different. Secondly, most barriers are cited in the areas of “keep up the good work” and “low priority”. In a normal setting, barriers would also be encountered in the areas of “over skill” and “concentration”. This unexpected finding suggests that some critical factors were not considered. Again, in future studies, more countries should be studied.
In summary, MNEs should be aware of government policies for the BOP market areas. They also need to adopt the strategy of co-development in production and manufacturing. Through training, MNEs could reduce culture gaps faced by local manufacturers. Also, MNEs should help local manufacturers to build effective distribution infrastructure. Financial support is important but not critical at the moment.


