A Study on the Development and Application of Spatial-TDR Sensor for the Management of Groundwater at Riverside

Kumoh National Institute of Technology, Gumi-si 39177, Korea
Sustainability 2018, 10(4), 1213; https://doi.org/10.3390/su10041213
Submission received: 10 March 2018
/
Revised: 10 April 2018
/
Accepted: 12 April 2018
/
Published: 17 April 2018
(This article belongs to the Special Issue Urban Water Management)
Abstract
:For sustainable use of water and land, efficient management of river water and groundwater at riverside is required for development. For this purpose, both the groundwater as well as the unsaturated areas should be measured and managed. However, existing point-type sensors have physical limitations. In this study, we developed a spatial-TDR (Time-Domain reflectometer) sensor and calibration algorithm for efficient management of riverside groundwater and conducted laboratory and field experiments on whether groundwater level and the unsaturated area can be measured. The rod-type probe shown in ASTM (American Society for Testing and Materials) D 6780-05 was modified into a steel wire-type sensing line so that it could be penetrated into the boring hole. The developed sensing line with steel wire is superior in transport and construction to make observations on the groundwater level, but it requires a separate filtering and calibration procedure because it contains a relatively large amount of noise. The raw data of the electric waveform is filtered by applying the moving-average method and the discrete Fourier transform (DFT). The calibration equation for the voltage of electric pulse and degree of saturation of soil calculated in laboratory experiments can be used to calculate the groundwater level and the unsaturated area of the real embankment. The spatial-TDR sensor developed in this study can measure both the groundwater level and the unsaturated area by improving the physical limit of the existing point-TDR sensor of probe-type. Therefore, it can greatly help efficient management of groundwater at riverside. It is necessary to put them into practical use through continuous improvement and experimental verification.
1. Introduction
For the sustainable use of water and land, the river water, as well as the groundwater at the riverside, should be efficiently managed. Construction of dams and weirs that can utilize river water is costly, but it is easy to measure the level of river water after construction so that it can be managed efficiently. However, in order to utilize water resources, it is necessary to efficiently manage not only the river water but also the groundwater at the riverside. To efficiently manage the groundwater at riverside, it is necessary to measure not only the groundwater level but also the unsaturated area. Currently, groundwater level at riverside is generally managed using a point-type sensor that transduces water pressure to a water level. However, it is difficult to estimate the exact amount of groundwater at riverside because it does not measure the unsaturated areas in the ground. Therefore, it is necessary to develop a measurement system for determining this.
At present, the measurement of the unsaturated area of soil uses the matric suction gauge. The system of the matric suction gauge consists of a ceramic disk, a tube, and a pressure gauge, which are attached to the surface of the soil. When a capillary force is generated on the surface of the soil, suction pressure is generated in the water inside the matric suction gauge, and this is measured by a pressure gauge [1]. Therefore, water must be continuously supplied to the matric suction gauge and it can only be used near the ground surface. The matric suction of the unsaturated area is an important factor for rainfall-induced slope failure. Therefore, as in this study, the measurement of unsaturated area is applied not to manage groundwater but to investigate the stability of unsaturated slopes [2,3,4].
In this study, the TDR (Time-Domain reflectometer) sensor was used to measure groundwater and unsaturated areas. TDR sensors are commercially available for measuring soil moisture content in civil engineering applications. The TDR sensor, originally developed to locate faults in transmission lines, was a cable tester in the field of electric power and communication. It was found to be a sophisticated and accurate method of measuring the dielectric constant of soil [5]. Topp et al. [6] established a relationship between volumetric moisture content and the dielectric constant of soil. He used many soil types and found a polynomial equation applicable to all soil types. Recent studies [7] have shown that Topp’s equation does not provide sufficiently accurate results for heavy clays, organic soils, and soils having too low or too high densities. The test method was created to determine the water content of soils and the in-place density of soils using a TDR apparatus [8,9]. Chen et al. [10] measured the dielectric constant for soil with high conductivity using TDR sensors. Chen et al. [11] also studied the characteristics of two-dimensional electric waveforms using a commercialized point-type TDR sensor. Recently, research is being done to measure bridge scour using TDR sensors [12]. The TDR sensor of Topp et al. [6] and ASTM [8] is a point-type for which accuracy and usability is high. However, there are limitations and disadvantages to using point-type sensors.
The distributed-TDR sensor as used in this study was used by Worsching et al. [13] and Scheuermann et al. [14] for laboratory experiments of a large-scale model levee. They used line-type TDR sensing lines to measure the seepage behavior of the model levee. The seepage behavior of the model levee caused by the difference in water level between the landside and waterside of the levee was determined by measuring the water content of soil with the TDR sensor. Therefore, they used the relationship between the water content and the dielectric constant of the soil, as in the case of the point-TDR sensor. This method is suitable for identifying the seepage behavior of a model levee. However, as in this study, it is difficult to estimate the groundwater level and the unsaturated area. They then installed the line-type sensing lines horizontally, while building up the soil to make the model levee. However, it cannot be installed horizontally in the actual site levee. In recent years, research has been conducted on techniques to increase accuracy by integrating spatial-TDR sensors with other methods. However, the correction equation for the electric waveform of the TDR sensor was based on the relationship between the dielectric constant and the water content of soil [15,16,17].
As mentioned earlier, the TDR sensor with point-type was developed to measure the compaction and water content of soil on an embankment site. It cannot be installed deep into the underground. Since it presents only one measured value by the probe, it cannot calculate the groundwater level and the unsaturated area. The spatial-TDR sensor was used only for research purposes to determine the seepage behavior of a large model levee because the sensing line is not easy to install underground. This study improved the existing point-type TDR and spatial-TDR sensors to study a measurement system that can simultaneously estimate the groundwater level and unsaturated area at riverside.
In this study, a spatial-TDR sensor for efficient management of riverside groundwater was developed and its applicability to the field was studied. To develop the distributed-TDR sensor, (1) a line-type sensing line was fabricated and (2) a calibration function for electric pulse was calculated through laboratory experiment, (3) the applicability of the spatial-TDR sensor was verified by performing a laboratory model simulation reproducing the groundwater level, and (4) line-type sensing lines were examined for installation ability and field application. Finally, the author has developed a filtering and calibration algorithm for the spatial-TDR sensor and applied it to measure the groundwater level and unsaturation area of the levee.
2. Spatial-TDR Sensor for Measurement of Groundwater Table and Unsaturated Zone
2.1. Point-TDR Sensor for Measurement of Water Content and Density of Soil
As mentioned above, the TDR sensor measures the water content and compaction of soil by detecting the reflected electric pulse by injecting an electric pulse into the soil. The TDR sensor presented in ASTM [8] is a method for measuring soil water content and compaction in the field. Here, three metal rods were installed to inject the soil with electric pulses and the reflected electric pulses were detected. Then, the reflected electric pulse was analyzed to calculate the water content and the compaction of soil.
The configuration of a typical point-TDR sensor system is shown in Figure 1. The TDR system used in this study includes a pulse generator with an integrated data-acquisition system, a coaxial cable, a coaxial head, and a cylindrical mold probe. The coaxial head is a transition device from the coaxial cable to the measurement probe (Figure 1) [10]. As described in ASTM standard D 6780-05 [8], the soil was first compacted into the cylindrical mold fitted with a nonmetallic bottom plate and a rod was then driven into the mold along the central axis. The rod acted as the inner conductor of a “coaxial cable,” while the cylindrical metal mold acted as the outer conductor. A ring collar was placed on top of the mold and the coaxial head was then placed on the ring. The diameter of the central rod and the inside diameter of the cylinder are 8 and 102 mm, respectively; the height of the cylindrical mold is 116 mm. The point-TDR sensor shown in Figure 1 is used on the construction site. After compaction of the soil, the rods are penetrated into the ground and the coaxial cylinder is connected to measure the electric pulse of Figure 2. It is designed to be hammered with a rod of 8 mm diameter made of stainless steel so that it can be penetrated into the ground.
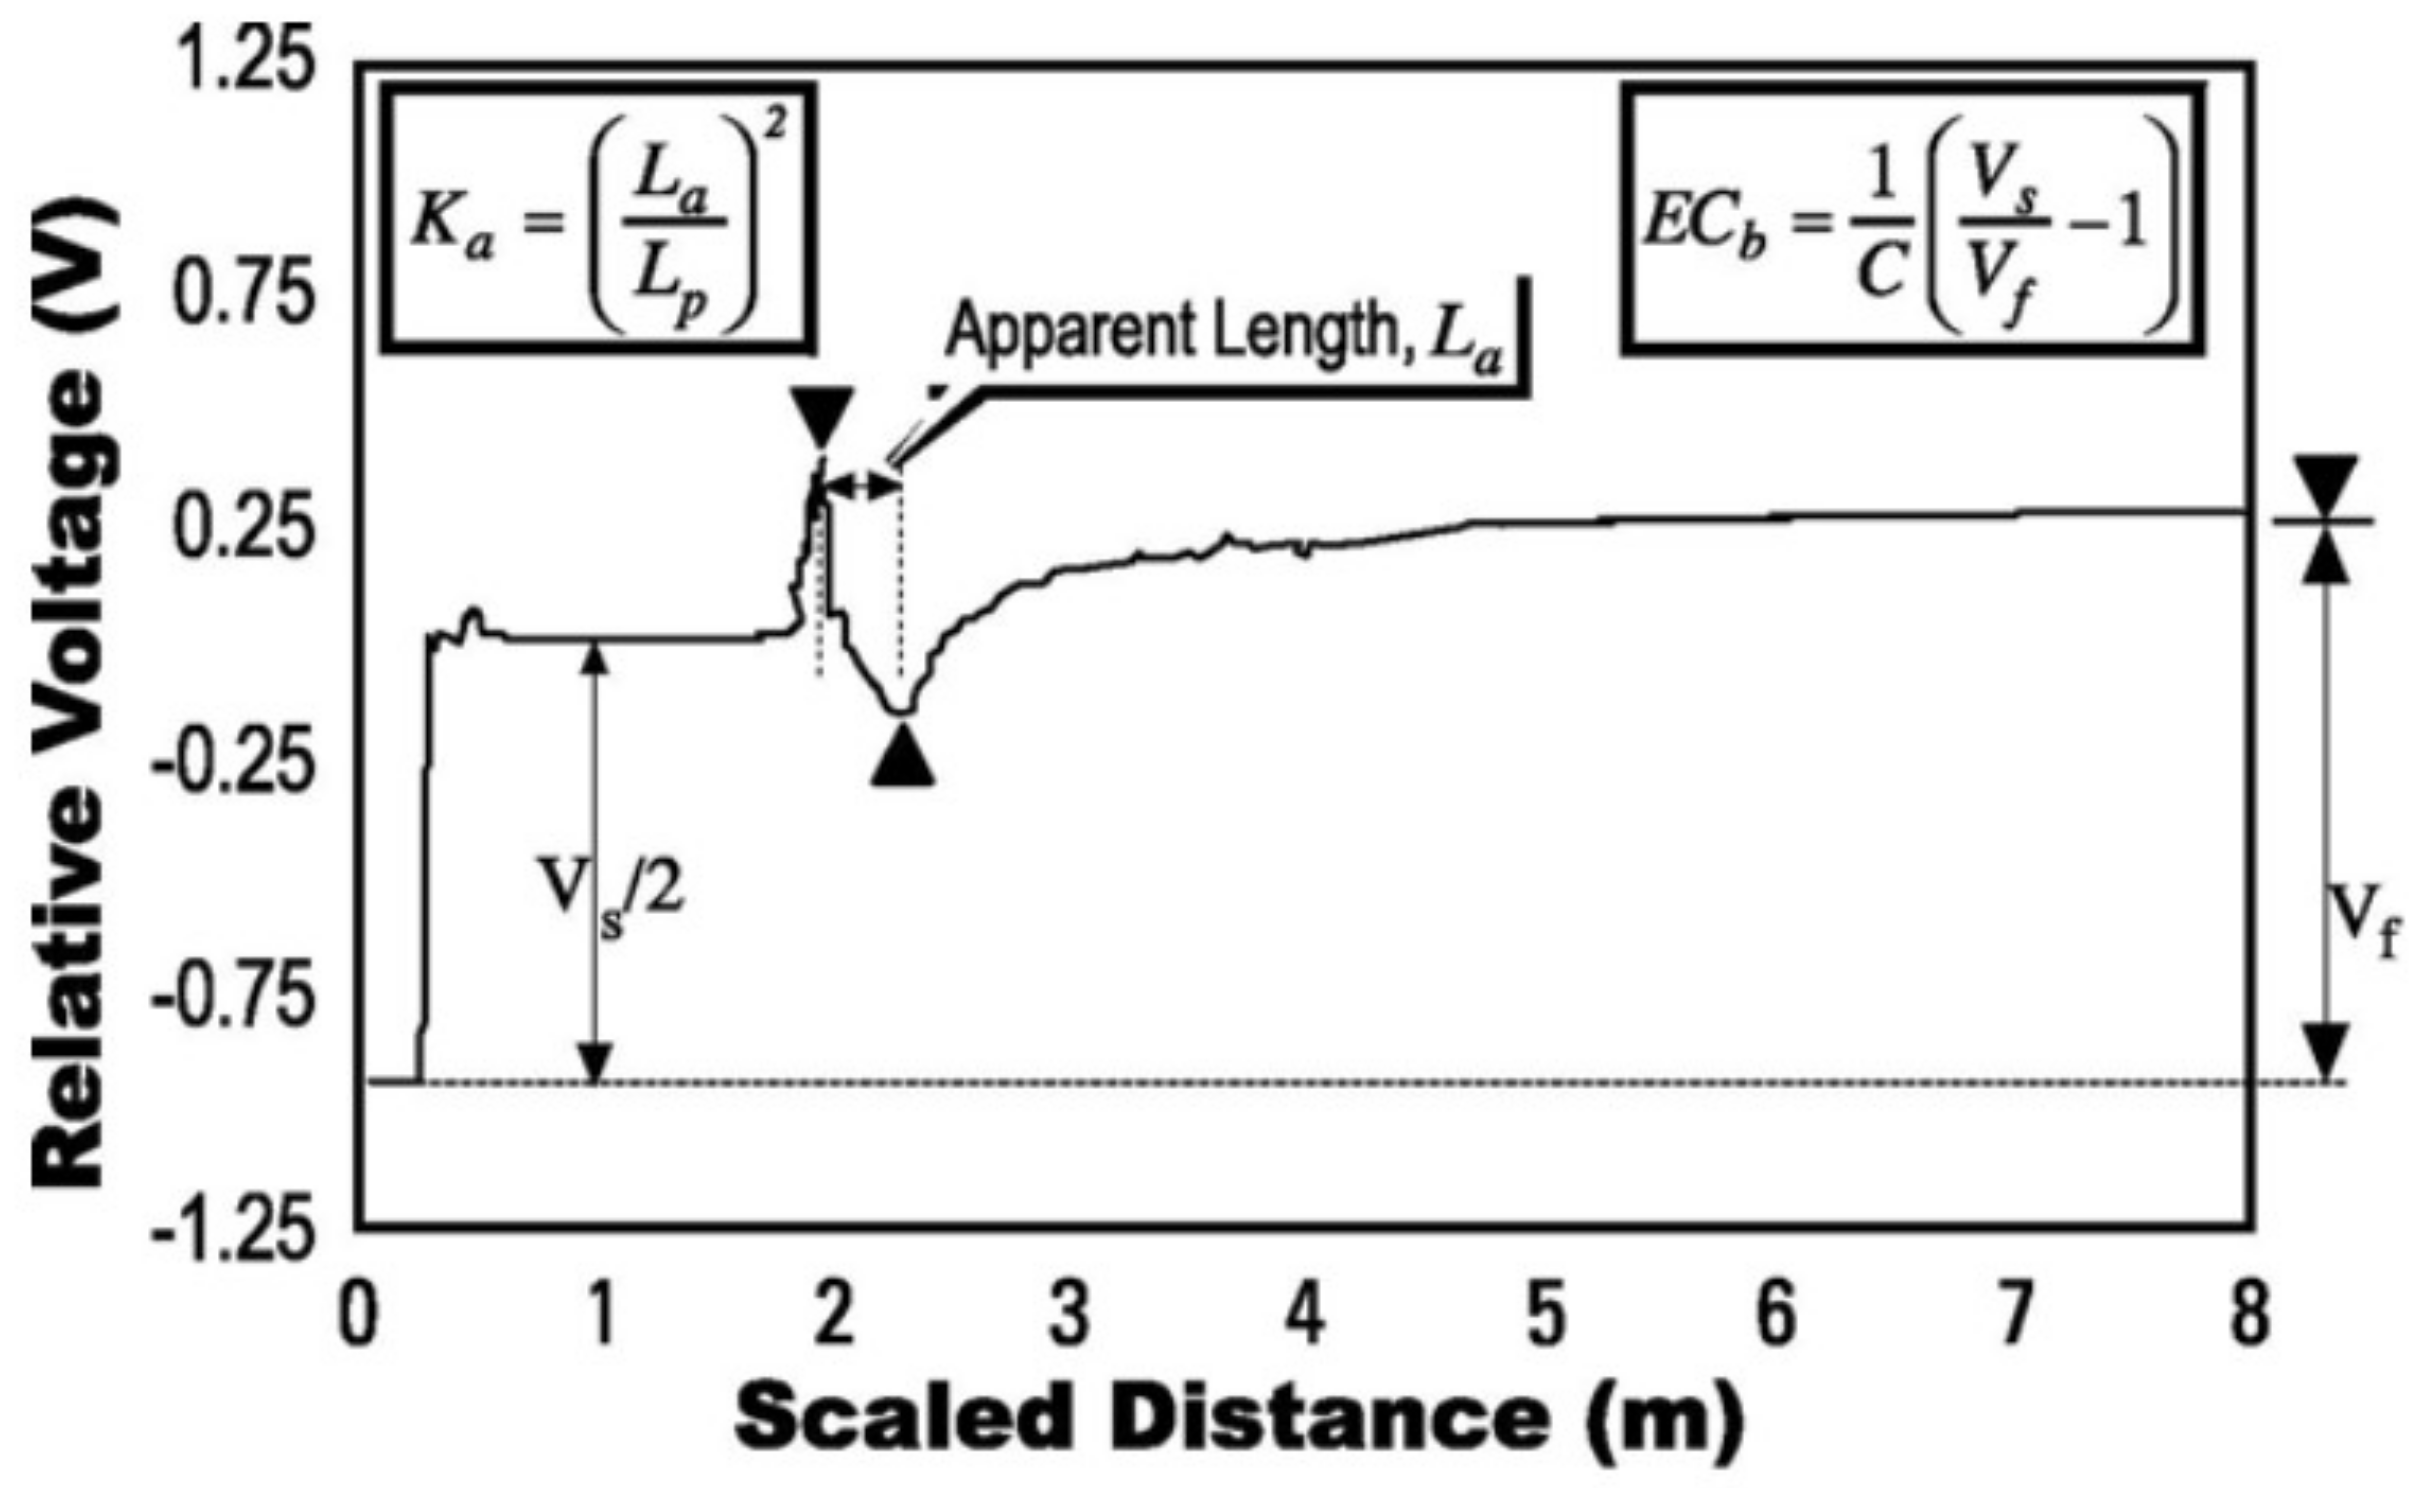
Figure 2 shows the electrical waveform of a typical point-TDR sensor [8]. As first proposed by Topp, et al. [6], the dielectric constant () and electrical conductivity () of the soil in the electric waveform is estimated, and the correction equation is given for the water content of Equation (1) and the water content of Equation (2). Here, a, b, c, and d are characteristic constants of soil.
In Figure 2, is the length of the rod penetrated into the soil, and is the apparent distance between the first reflection point and the second reflection point of the electric pulse. is a voltage twice the magnitude of the step pulse, and is a long-term voltage level. is a constant related to the structure of the probe, which is defined as Equation (3) [18,19], where is the internal resistance of the TDR signal generator and is typically .
The general electric waveforms shown in Figure 2 can be used to calculate the water content and the degree of compaction of the soil by regression analysis when the length is short and constant. Therefore, it is impossible to apply it to the spatial-TDR sensor as in this study. The reason is that the length is relatively long and the length varies depending on the field.
2.2. Spatial-TDR Sensor for Measurement of Groundwater Table and Unsaturated Area
To measure the groundwater level and the unsaturated region as in this study, the point-TDR sensor shown in Figure 1 was modified with the spatial-TDR sensor shown in Figure 2. For this purpose, the rod should be improved to a line shape so that the spatial-TDR sensor can be installed at a specific depth in the ground. Line-type sensing line should calculate the soil moisture content and analyze it to calculate the groundwater level and the unsaturated area. Further, a homogeneous filler is needed to have the same permeability in the spatial-TDR sensor. Finally, a new calibration technique for the measured electrical waveform is needed.
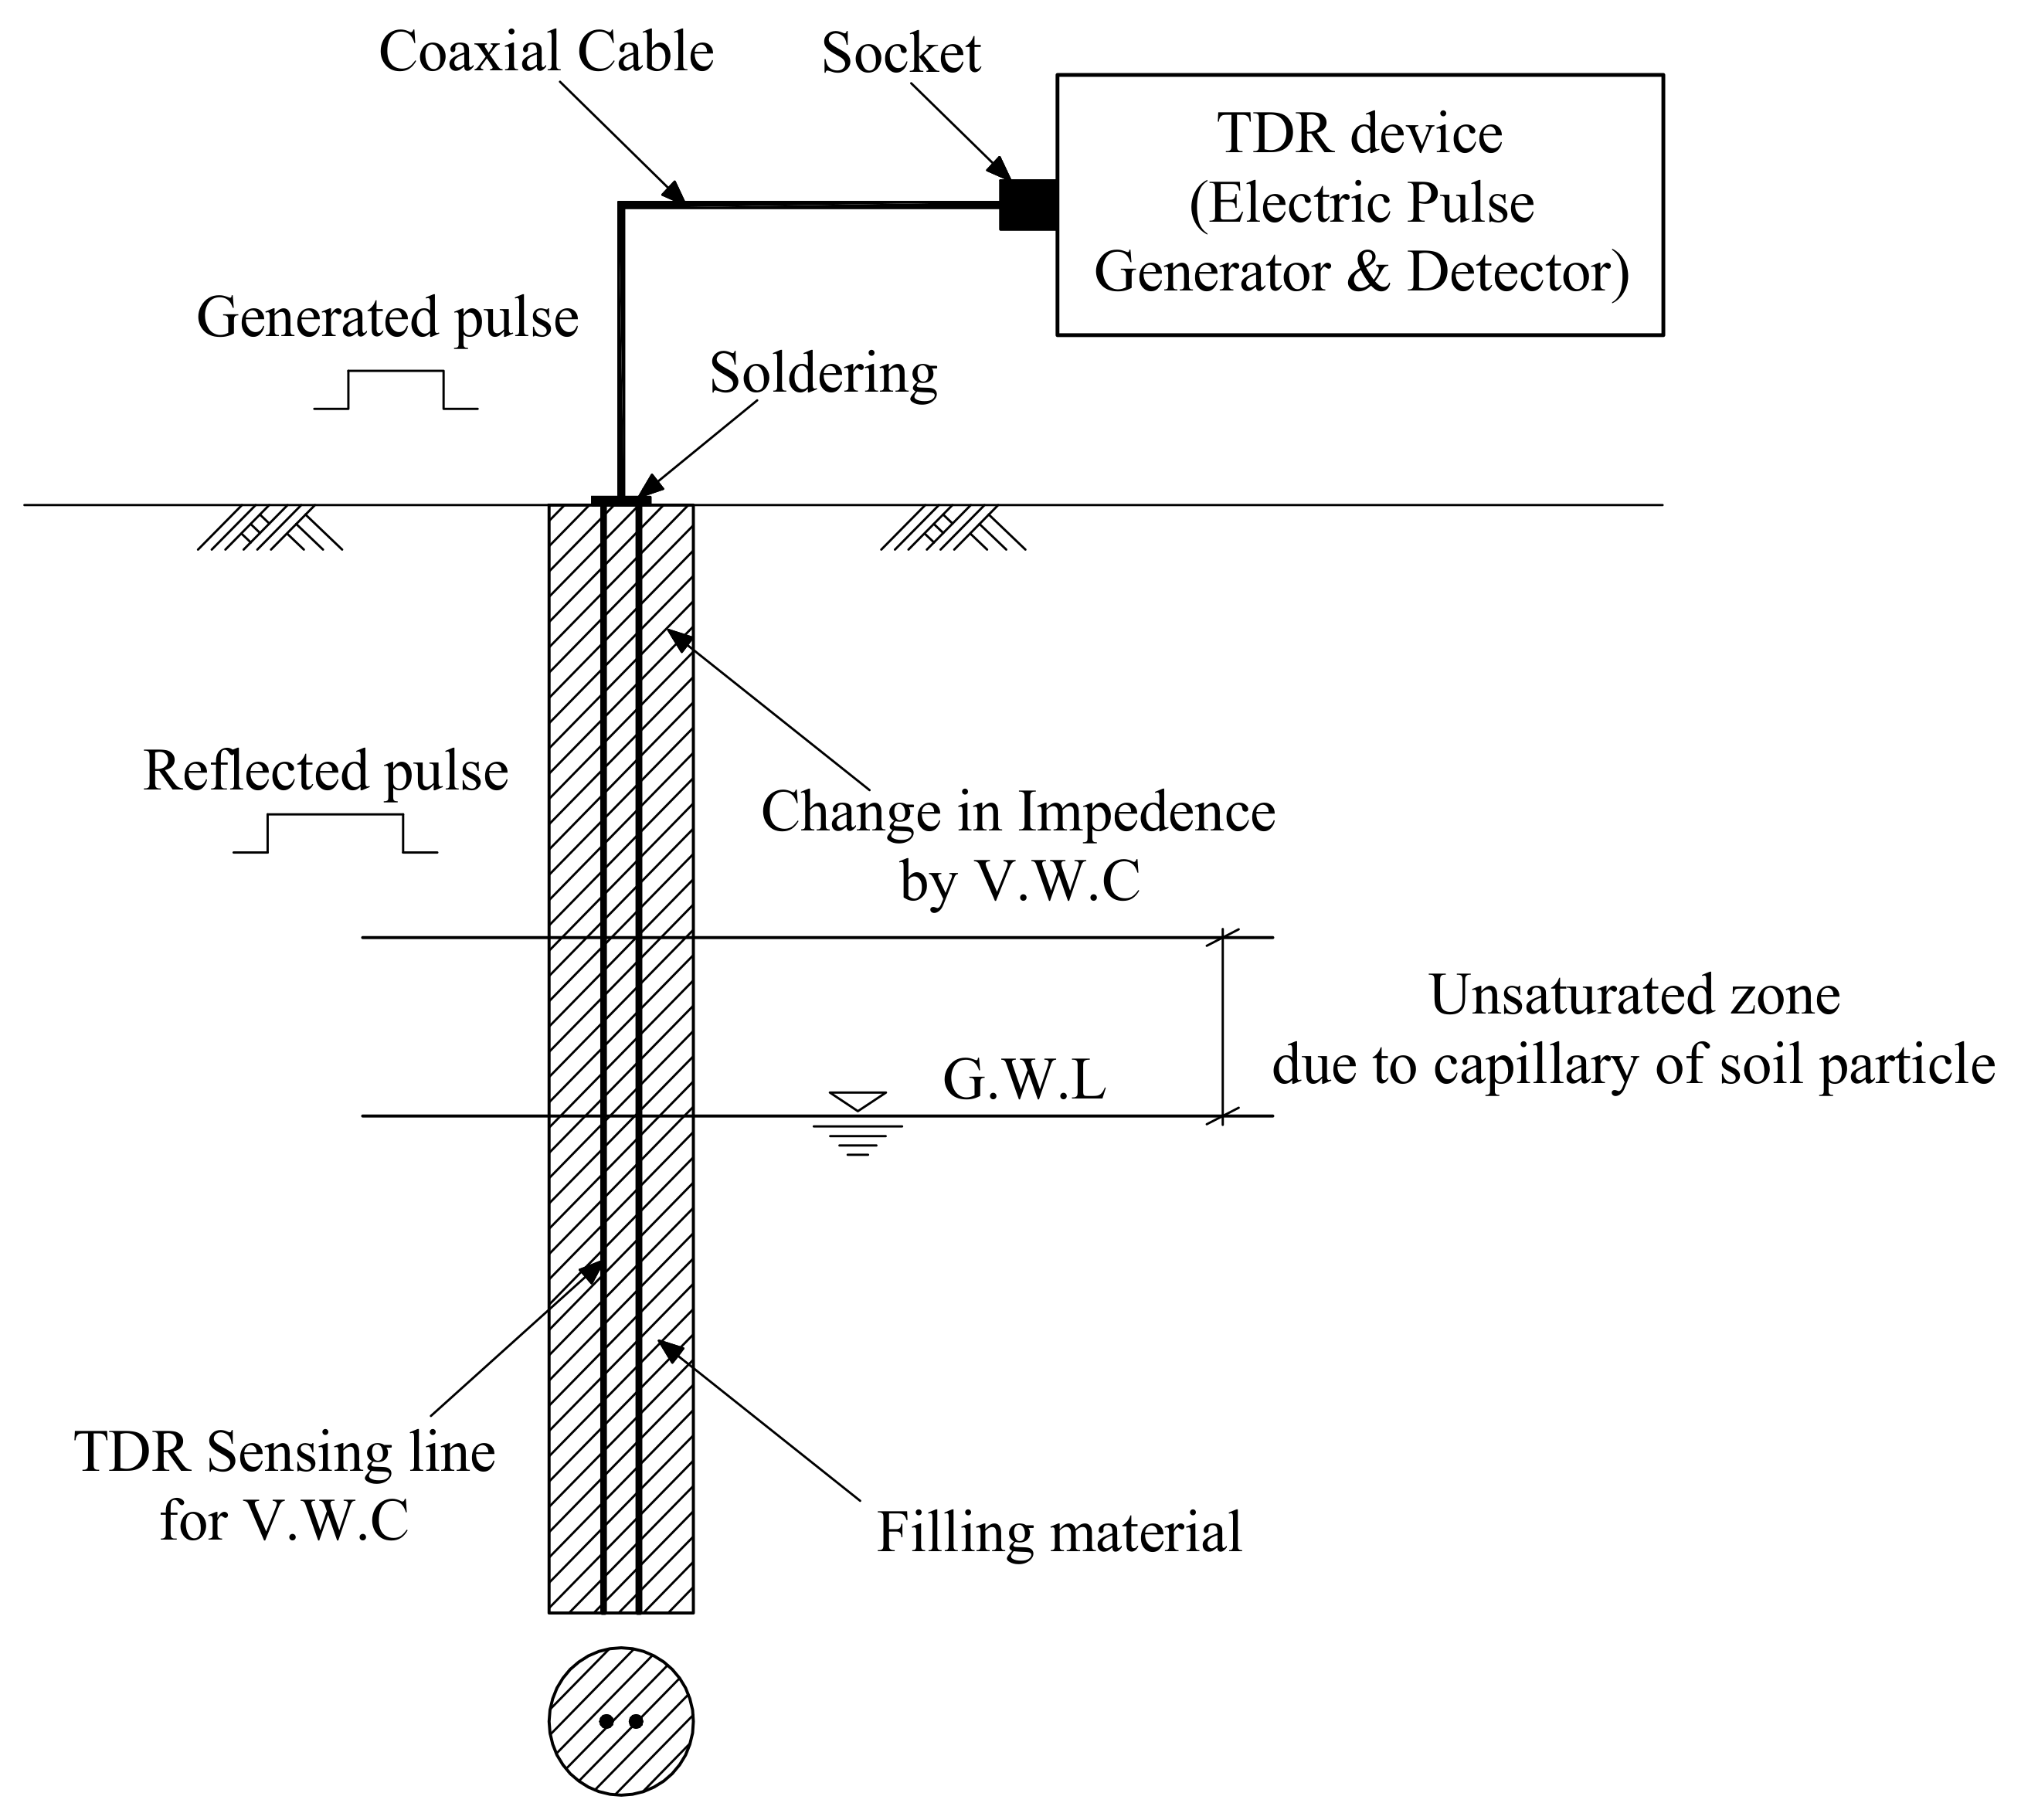
Figure 3 is a conceptual diagram of the spatial-TDR sensor for measuring groundwater and unsaturated areas. The sensing line was line-type, so that it can be installed deep in the ground, and it was welded to a coaxial cable. The electric pulses generated from the TDR device travel along the coaxial cable to the measurement point with no noise and the electric pulses are changed by the water content of the soil along the line-type sensing line. The reflected electrical pulses are detected by the TDR device to measure groundwater level and unsaturated areas in the ground. The measured electric pulse is analyzed by connecting to a notebook.
The line-type sensing line penetrates after boring the ground with NX size of 10 cm diameter. To accurately measure the depth of deformation, the boring holes must be filled with homogeneous material. In this study, the standard sand of Korea was used. A calibration equation was created through laboratory experiments with this material and applied equally to the field. Since the standard sand is uniform in particle size, it can be homogeneously filled by free fall into the boring hole.
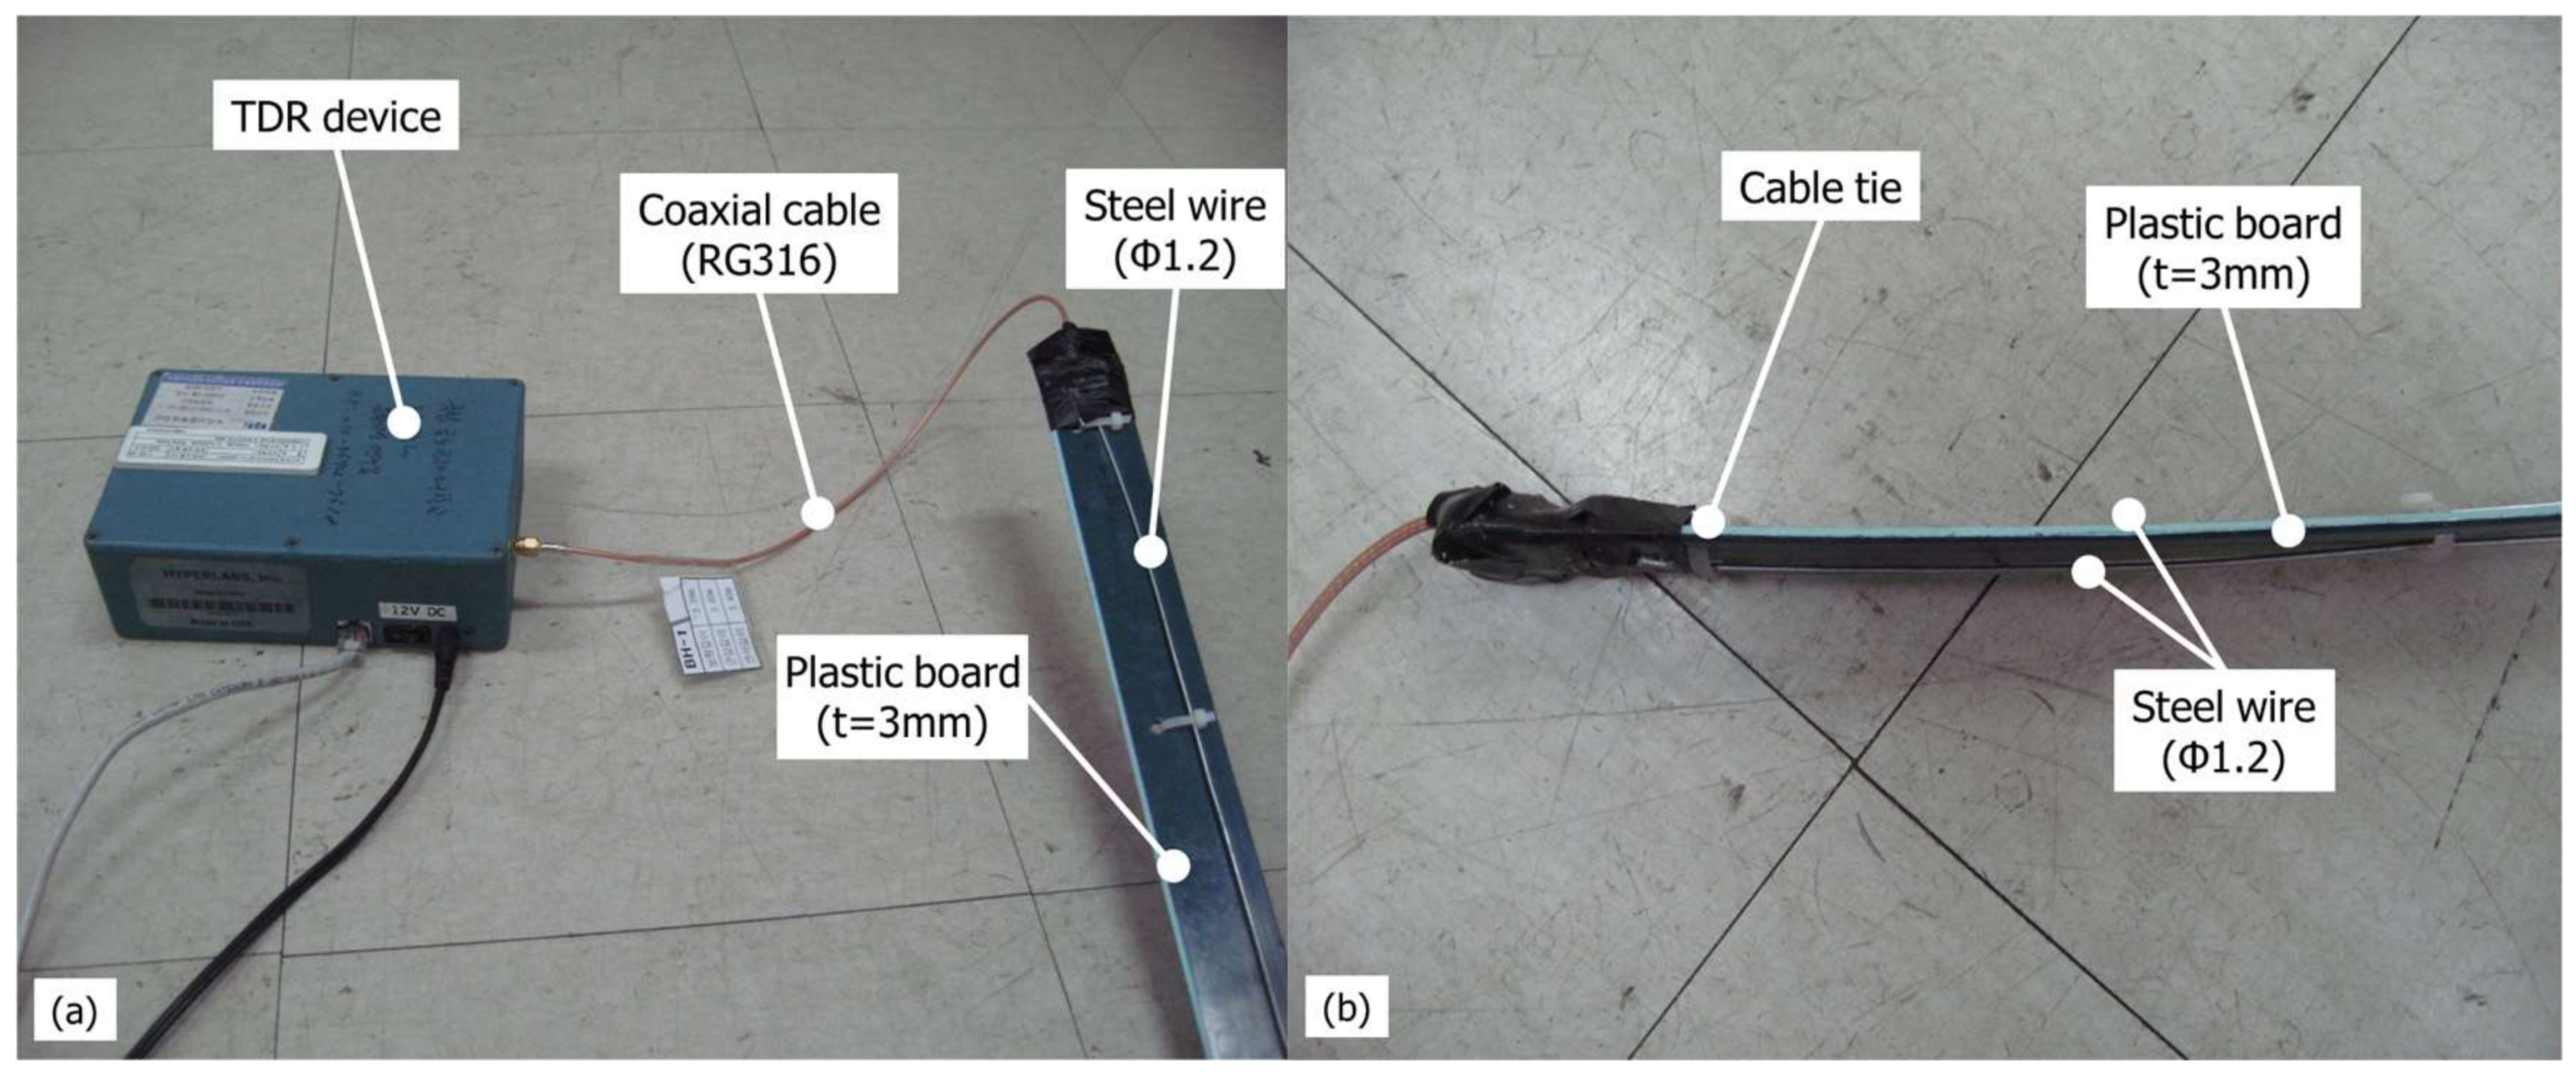
Figure 4 shows the instrument and line-type sensing lines of the spatial-TDR sensor fabricated for this study. The TDR device uses Hyperlabs Inc.’s (Beaverton, OR, USA) HL8200 TCP/IP.TDR device. This device can transmit an electric pulse of 250 mV to an SMA (SubMiniature version A) output jack and measure the reflected wave with the same jack. Both electric pulse generation and detection of the reflected wave are achieved by the TDR. The coaxial cable is RG316 and the TDR device in Figure 1 uses RG58. Both models differ only in diameter.
The configuration of the distributed TDR sensor shown in Figure 3 is similar to that made by Worsching et al. [13] and Scheuermann et al. [14]. Finally, it consists of a metal conductor that transmits electric pulses through the soil and a coaxial cable for connection with the TDR device. In this study, steel wire was used, whereas flat ribbon cable was used for Worsching et al. [13] and Scheuermann et al. [14]. The difference between these metal materials is related to the initial value of the electric pulse, but there is no problem if the same metal is used only when making the sensing line. In these papers, PVC was coated, but the TDR measurement lines of this study were not coated. To prevent shorting of the two steel wires, a plastic board was placed in the center and fixed with a cable tie. In this study, steel wire was used because it is possible to store and transport the made line-type sensing lines in roll form, which made it is easy to penetrate boring hole in the field.
Next, a calibration equation for the electric waveform appropriate for the characteristics of the spatial-TDR sensor were developed. Since the length of the rod in the point-TDR sensor is short and constant, the calibration equations of Equations (1) and (2) were used in the previous studies [5,6,8,10,11]. The independent variables of the calibration equation are electrical conductivity and dielectric constant, and dependent variables are the water content and the compaction of the soil. Only one water content value is calculated for a rod of 116 mm.
However, the sensing line of a spatial-TDR sensor is long and variable depending on the field, and the overall water content of the sensing line is estimated. The independent variable is the voltage or resistance of the electric pulse, and the dependent variable is the water content of the soil. Therefore, to estimate the water content of the soil in the sensing line of the spatial-TDR sensor, the relationship between the two-dimensional electric waveform and the water content was directly calculated.
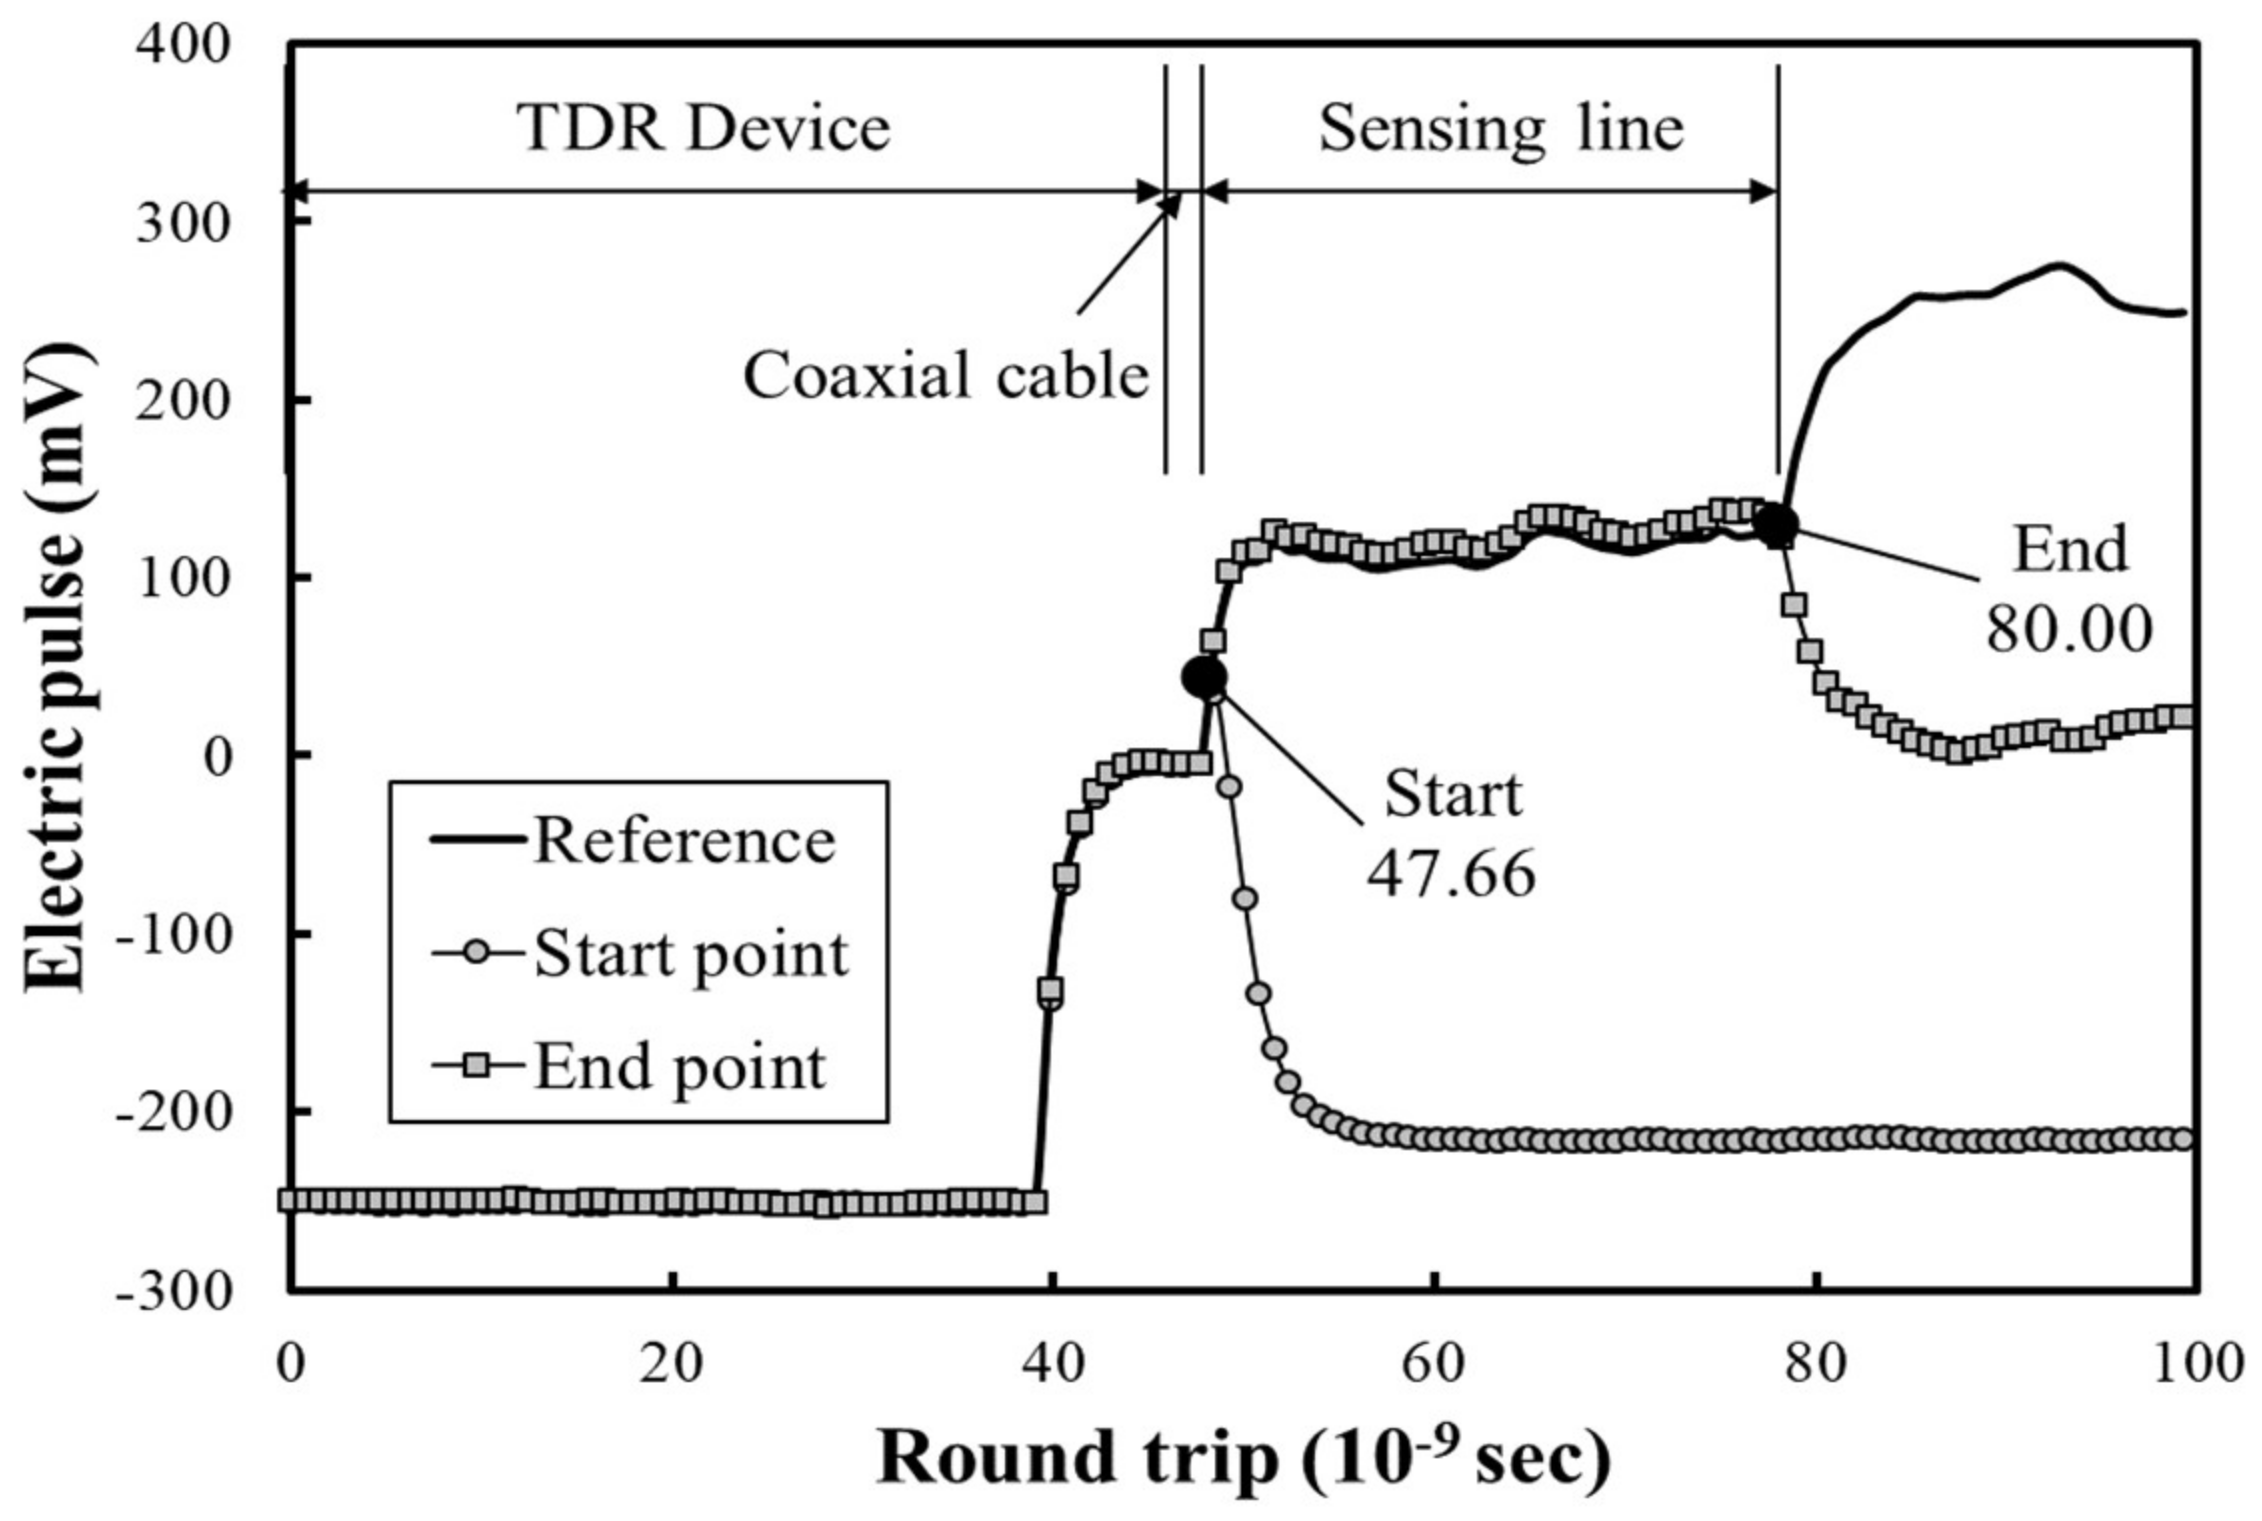
Figure 5 shows the two-dimensional electrical waveform measured on a TDR device. The horizontal axis of the graph is the time that the electric pulse travels through a sensing line, usually expressed in nanoseconds (). The vertical axis of the graph is the voltage or resistance of the electric pulse, and most TDR devices inject the sensing line or rod with an electric pulse of 250 mV. As shown in Figure 2, the horizontal axis of the graph shows the round-trip time of the electric pulse calculated by the length of the rod or sensing line. In this study, the horizontal axis is divided by the length of the sensing line and presented as a corrected length, and the vertical axis is presented as the voltage of the electric pulse. After calibration, the vertical axis was converted from the voltage to the degree of saturation of the soil.
The two-dimensional electric waveform of Figure 5 was removed because the value of the coaxial cable and the inside of the TDR device are also measured. Therefore, it is necessary to measure the starting point and the end point of the electric waveform after manufacturing a line-type sensing line. Generally, two points are found by attaching the conductor. Figure 5 shows the results of measuring the electric pulses of a line-type sensing line with a length of 2.0 m. The starting point was measured as and the end point as . The electric waveform of the line-type measurement line shown in Figure 5 is the same as the previous research [13,14].
3. Laboratory Experiment
3.1. Laboratory Experiments to Calculate the Calibration Equations for Voltage of Electric Pulse and Degree of Saturation of Soil
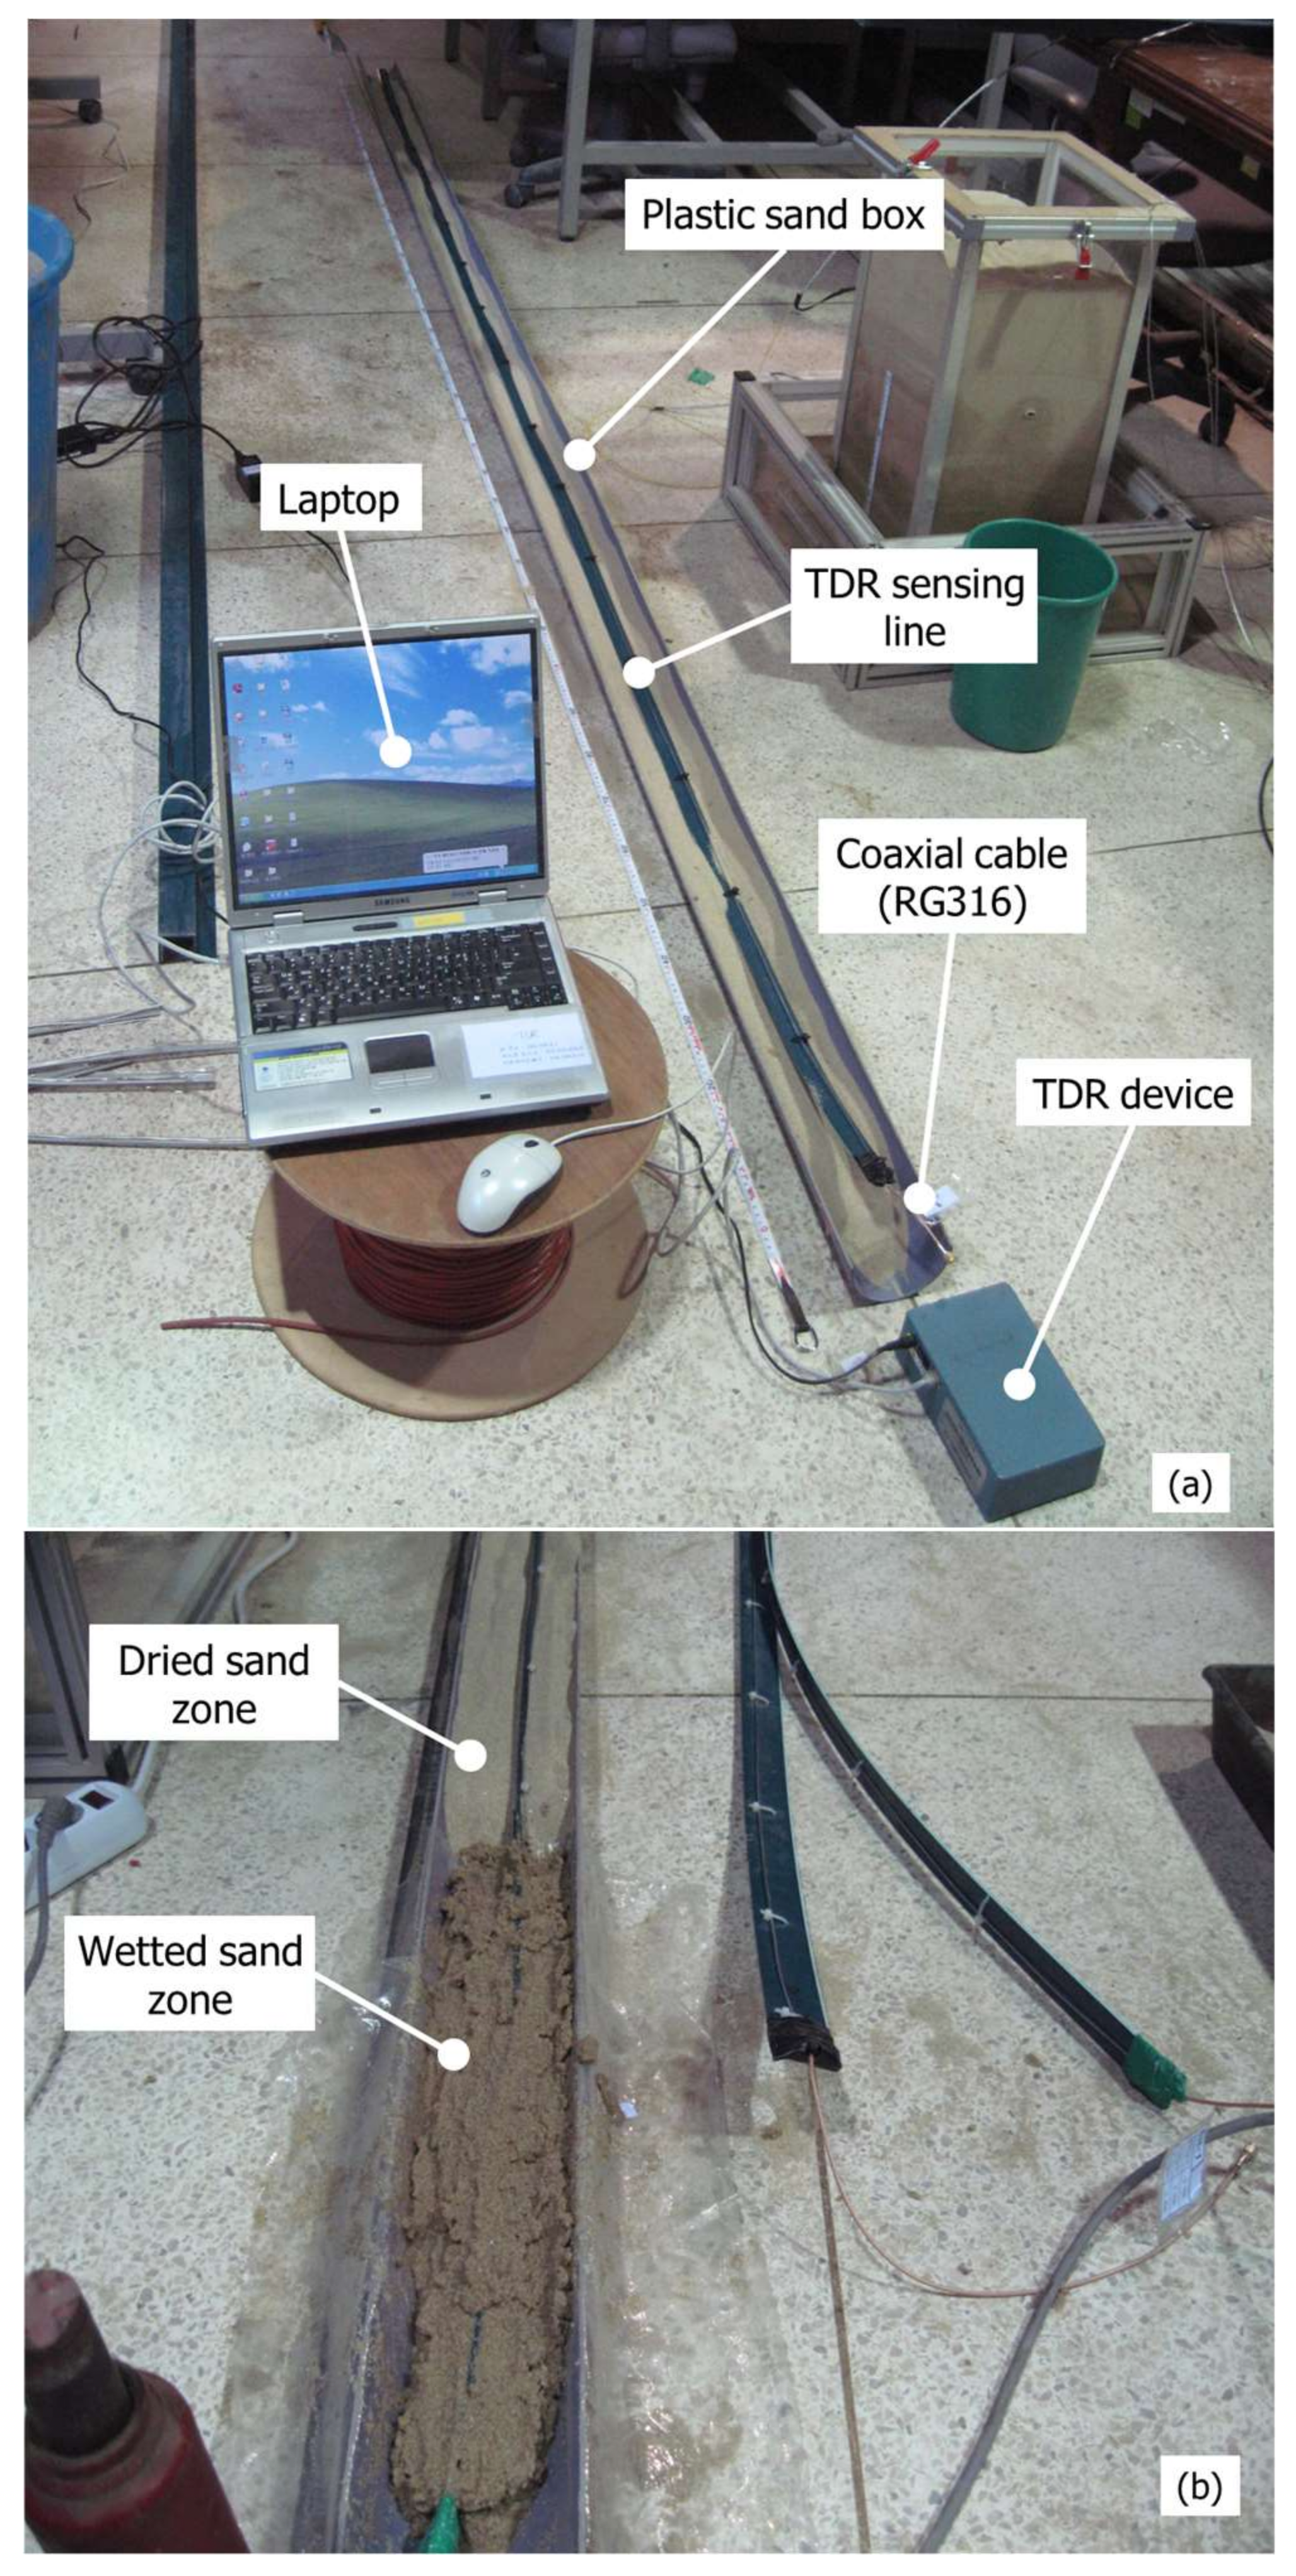
A laboratory experiment was conducted to calculate the calibration equations for voltage of electric pulse and degree of saturation of soil. For the laboratory test, this study used the measurement system of the spatial-TDR sensor shown in Section 2.2 and the line-type sensing line of 4.0 m length. The soil box was cut in half with a 12 cm diameter PVC pipe. The soil used in the experiment is the Korean standard sand, Joomunjin standard sand. Because the sand is of uniform particle size, it has uniform permeability (Figure 6) and can be filled uniformly by free fall into the boring hole of the site.
To calculate the calibration equation, which is the correlation between the electric-pulse voltage and the degree of saturation of the soil, samples with saturation degrees of 30%, 60%, and 100% were made. First, a sensing line was installed on a soil box of PVC pipe and the initial value was measured by filling dried standard sand. A wet sample with 30%, 60%, and 90% of the degree of saturation was filled in the upper, middle, and lower sections of a 50 cm section on a soil box of PVC pipe with a length of 4.0 m. The variation of an electric pulse according to position and degree of saturation of soil measured by a TDR device. The standard sand was dried in an oven at for 24 h. The water content of soil for the degree of saturation was calculated as Equation (4) [20]:
Equation (4) is expressed in Equation (5) regarding the water content of soil
where is specific gravity (standard sand = 2.65), is void ratio (uniform and loose sand = 0.8), is water content, and is degree of saturation.
Using Equation (5), the water contents can be estimated as 9%, 18%, and 30%, corresponding to the degree of saturation of 30%, 60%, and 100%, respectively. To make a sample with the degree of saturation of 30% and the water content of 9%, 90 g of water was mixed with 1000 g of sands. Likewise, 180 g of water was mixed for the degree of saturation of 60% and water content of 18%, and 300 g of water for the degree of saturation of 100% and water content of 30%.
Figure 6 is laboratory experiments to calculate the calibration equations for voltage of electric pulse and degree of saturation of soil. Figure 6a sets up the equipment for the laboratory experiment. The experimental equipment consists of a soil box, a sensing line, a TDR device, and a laptop. Then, the wetted standard sand with the degree of saturation of 30%, 60%, and 100% was filled in the top, middle, and bottom of the soil box with a width of 50 cm. Figure 6b shows that the wetted standard sand with 60% of the degree of saturation is filled halfway into the soil box for photographing. The electrical waveforms were measured in nine cases, with different positions and the degree of saturation of wetted standard sand.
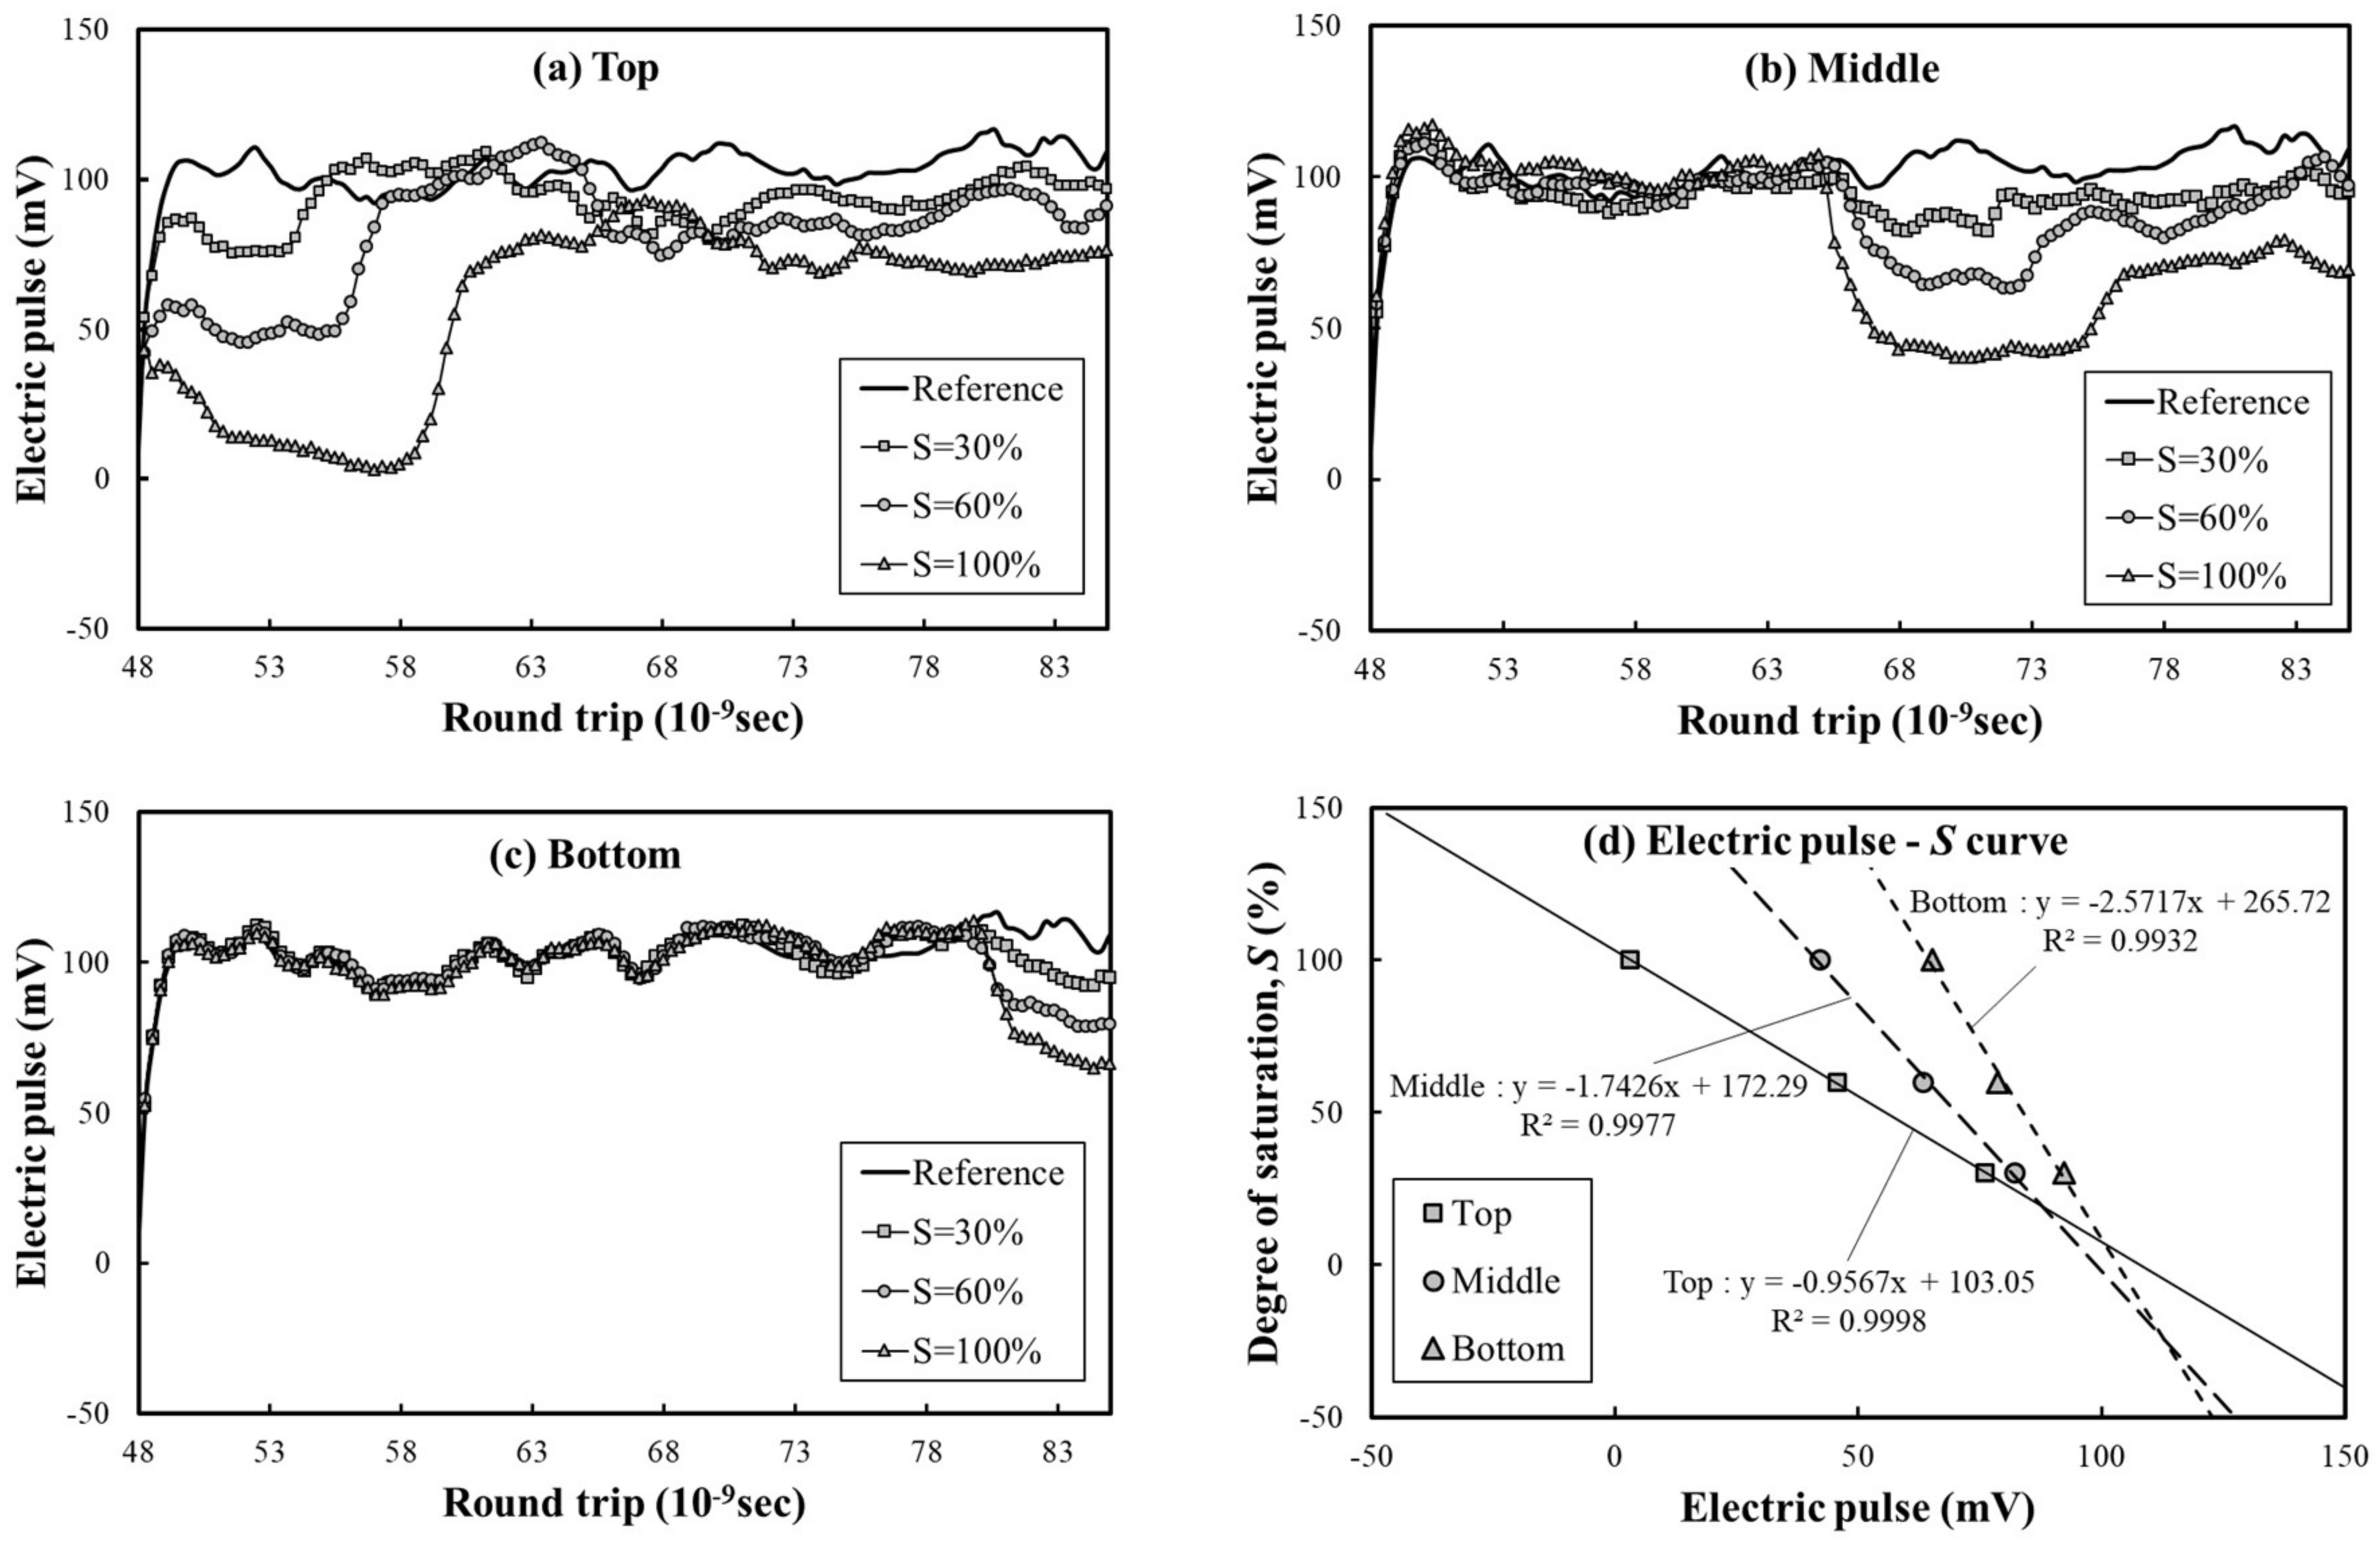
Figure 7 shows the electrical waveforms measured in nine cases, with different positions and degrees of saturation of wetted standard sand. Figure 7a–c is the electric wave in the case of the location of the top, middle, and bottom of the soil box filled with wetted standard sand. Figure 7d is the correlation between voltage of electric pulse and degree of saturation of soil.
Topp et al. [6] first identified the relationship between water content and dielectric constant of soil. As the degree of saturation of soil increases, the dielectric constant increases. Further, as the dielectric constant increases, the voltage decreases linearly. In other words, the amount of variation in voltage decreases toward the end of the sensing line.
Experimental results showed that the variation of the voltage of electric pulse was different according to the position of wet standard sand in the soil box. As the position of the wet standard sand moves from the top of Figure 7a to the bottom of Figure 7b,c, the voltage variation decreases. The point-TDR sensor has a rod length of about 10 cm, which is shorter than the influence area of the electric pulse. Therefore, the relationship between soil saturation and dielectric constant has only one linear equation. Because the sensing line of the spatial-TDR sensor is long, the calibration equation varies according to the length, as shown in Figure 7d. However, as suggested by Topp et al. [6], the relationship between water content and dielectric constant of soil maintains a linear relationship. In some studies, organic soil or clay may deviate from linear relationships [10]. However, since the spatial-TDR sensor only fills the boring hole with homogeneous standard sand, the relationship between water content and the dielectric constant of soil is linear, as shown in Figure 7d and previous studies. The spatial-TDR sensor can be applied to all sites by the calibration equation for Figure 7d. This is because, as mentioned above, the standard sand only fills the boring hole.
3.2. Laboratory Model Simulation for Verifying the Applicability of Spatial-TDR Sensor
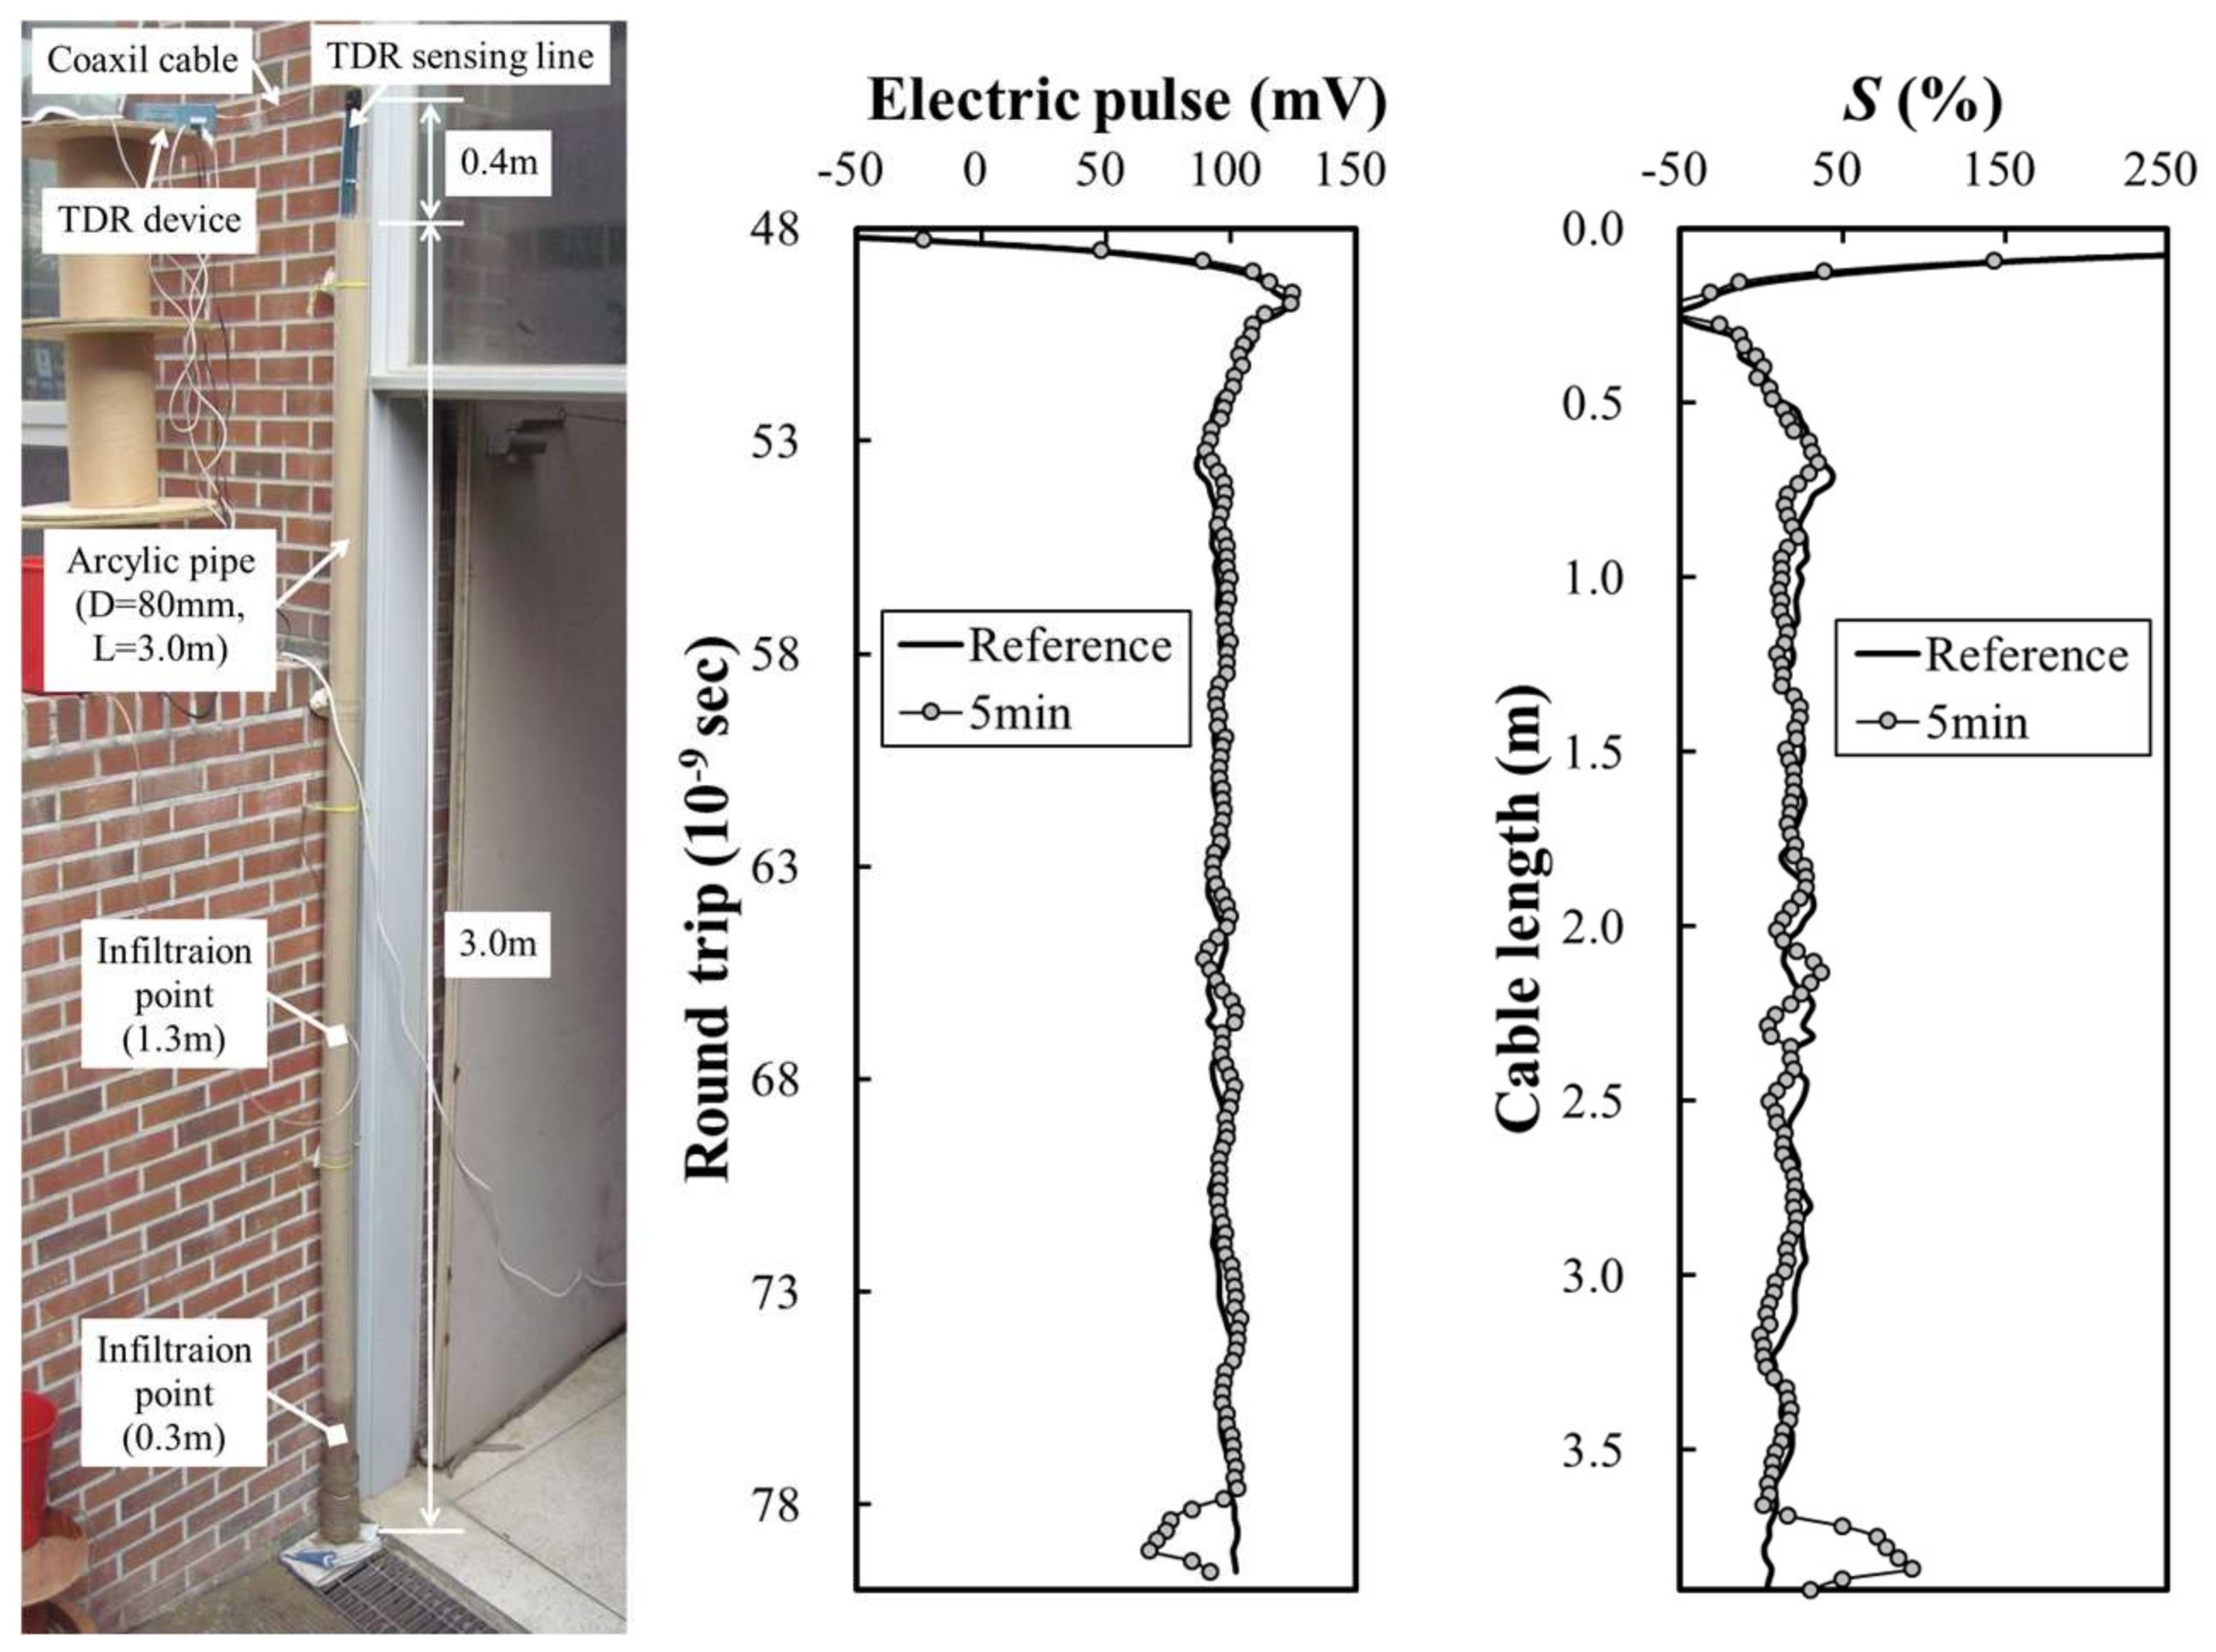
In this section, a laboratory model simulation is performed to verify the applicability of the spatial-TDR sensor. A circular acrylic pipe with a diameter of 80 mm was produced under the same conditions as the boring holes in the site, and the infiltration and groundwater level were reproduced. A circular acrylic pipe with a diameter of 80 mm was produced under the same conditions as the boring holes in the site, and the groundwater level was reproduced. The purpose of this experiment is to verify whether the reproduced groundwater level is detected by the spatial-TDR sensor in the laboratory model simulation.
The circular acrylic pipe is the same as the NX size 80 mm of the boring hole, 3 mm in thickness and 3.0 m in length, made of acrylic material. It is made of acrylic to visually confirm the groundwater level and unsaturated area. A sensing line with a length of 3.4 m was installed on a circular acrylic pipe and filled with dried standard sand. The experimental procedure was the same as that of the field installation. A rubber pipe with a diameter of 5 mm was connected to reproduce the ground water at 0.3 m and 1.3 m of the circular acrylic pipe (Figure 8a).
Figure 8b shows the two-dimensional electric waveform measured at the elapsed time of 5 min after injection of infiltration water at a point of 0.3 m. In order to show the round-trip time of the electric pulse according to the sensing line, the horizontal axis and the vertical axis are alternately displayed, unlike the graphs for the two-dimensional electric waveform shown above. The solid line in Figure 8b is the initial value when filled with dried standard sand. It can be seen that the electric pulse is uniformly distributed at about 100 mV. However, if infiltration occurs at 0.3 m, it can be seen that the electric pulse decreases from . Figure 8c shows the result of calibrating the voltage of the electric pulse with the degree of saturation using the calibration equation. At the end of the sensing line, the degree of saturation of reached 100%. This means that the end point of the sensing line is saturated.
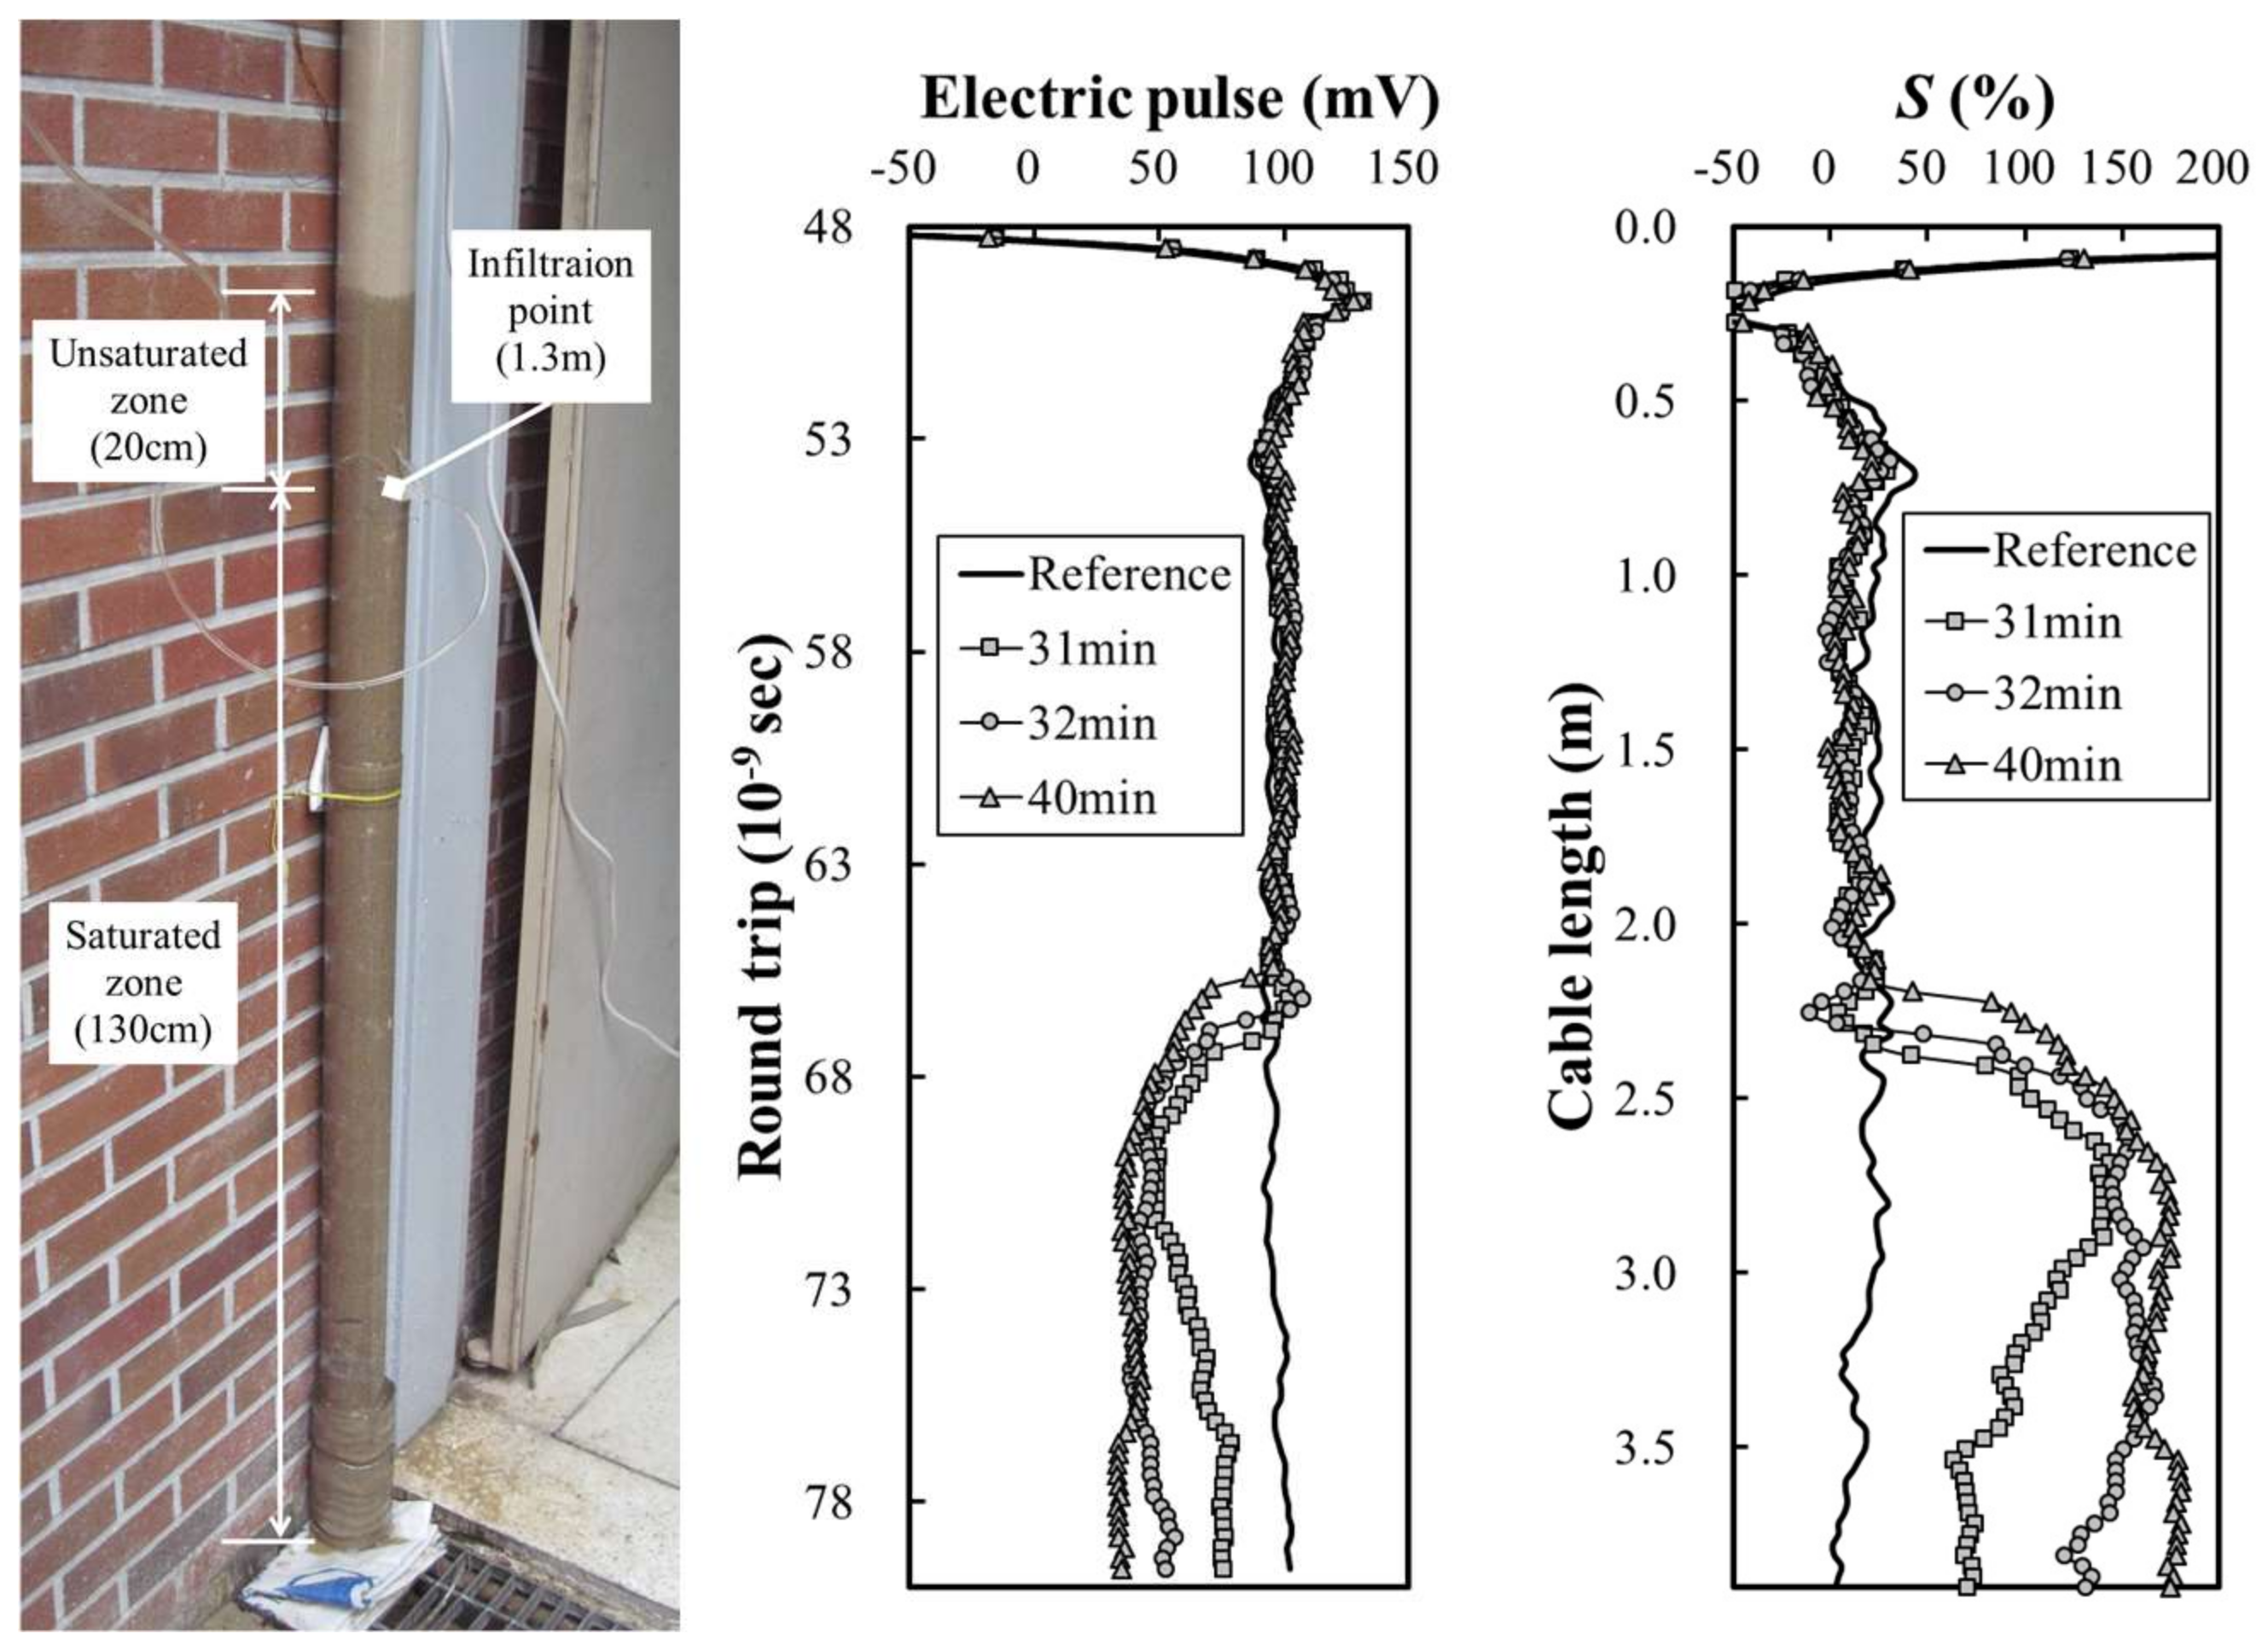
Figure 9 shows the view and result of the laboratory model simulation when it infiltrates at 1.3 m of the circular acrylic pipe. Figure 9a shows the electrical waveform after 40 min of infiltration water at 1.3 m of the circular acrylic pipe. It was visually confirmed that the unsaturated area was due to the capillary effect up to about 20 cm from the point where the infiltration water was injected. As shown in Figure 9b, the two-dimensional electric waveform measured by the distributed TDR sensor showed that the voltage of the electric pulse was reduced to in the . However, if infiltration continues, the voltage of the electric pulse is completely reduced to 50 mV after of the round-trip time. This is because if the infiltration continues, it is saturated to the point of 1.3 m of the circular acrylic pipe. The calibrated degree of saturation of Figure 9c shows that the saturation exceeded 100% from the cable length of 2.5 m. This is the same point where the actual infiltration water was injected and the groundwater level was formed.
As a result of the laboratory model simulation, the two-dimensional electric waveforms changed according to the groundwater reproduced in the circular acrylic pipe. The degree of saturation of soil can is easily estimated by the calibration equation, and line-type sensing line was made considering field application. As a result of applying it to the laboratory experiment, it was easy to penetrate the vertical boring hole because of the softness of the steel wire, and the dried standard sand was filled homogeneously. However, the calibrated degree of the saturation graph contains noise, and the degree of saturation exceeded the threshold of 100%. Therefore, the problems arising from the laboratory experiment were solved through field experiments.
4. Field Experiment
4.1. Site Preparation
Field experiments were performed similarly to the laboratory model simulations performed in Section 3.2. It was easy to reproduce groundwater in the laboratory experiment, but it is difficult to reproduce groundwater in the field experiment. Therefore, this study selected the site of the field experiment where the water level of the river can be controlled by a weir. And it is verified that the spatial-TDR sensor accurately measures the groundwater level of the levee according to the water level of river. In this section, the author has developed an algorithm to improve the noise and threshold problem of two-dimensional electric waveforms in laboratory experiments. It was applied to estimate the groundwater level in the field experiment.
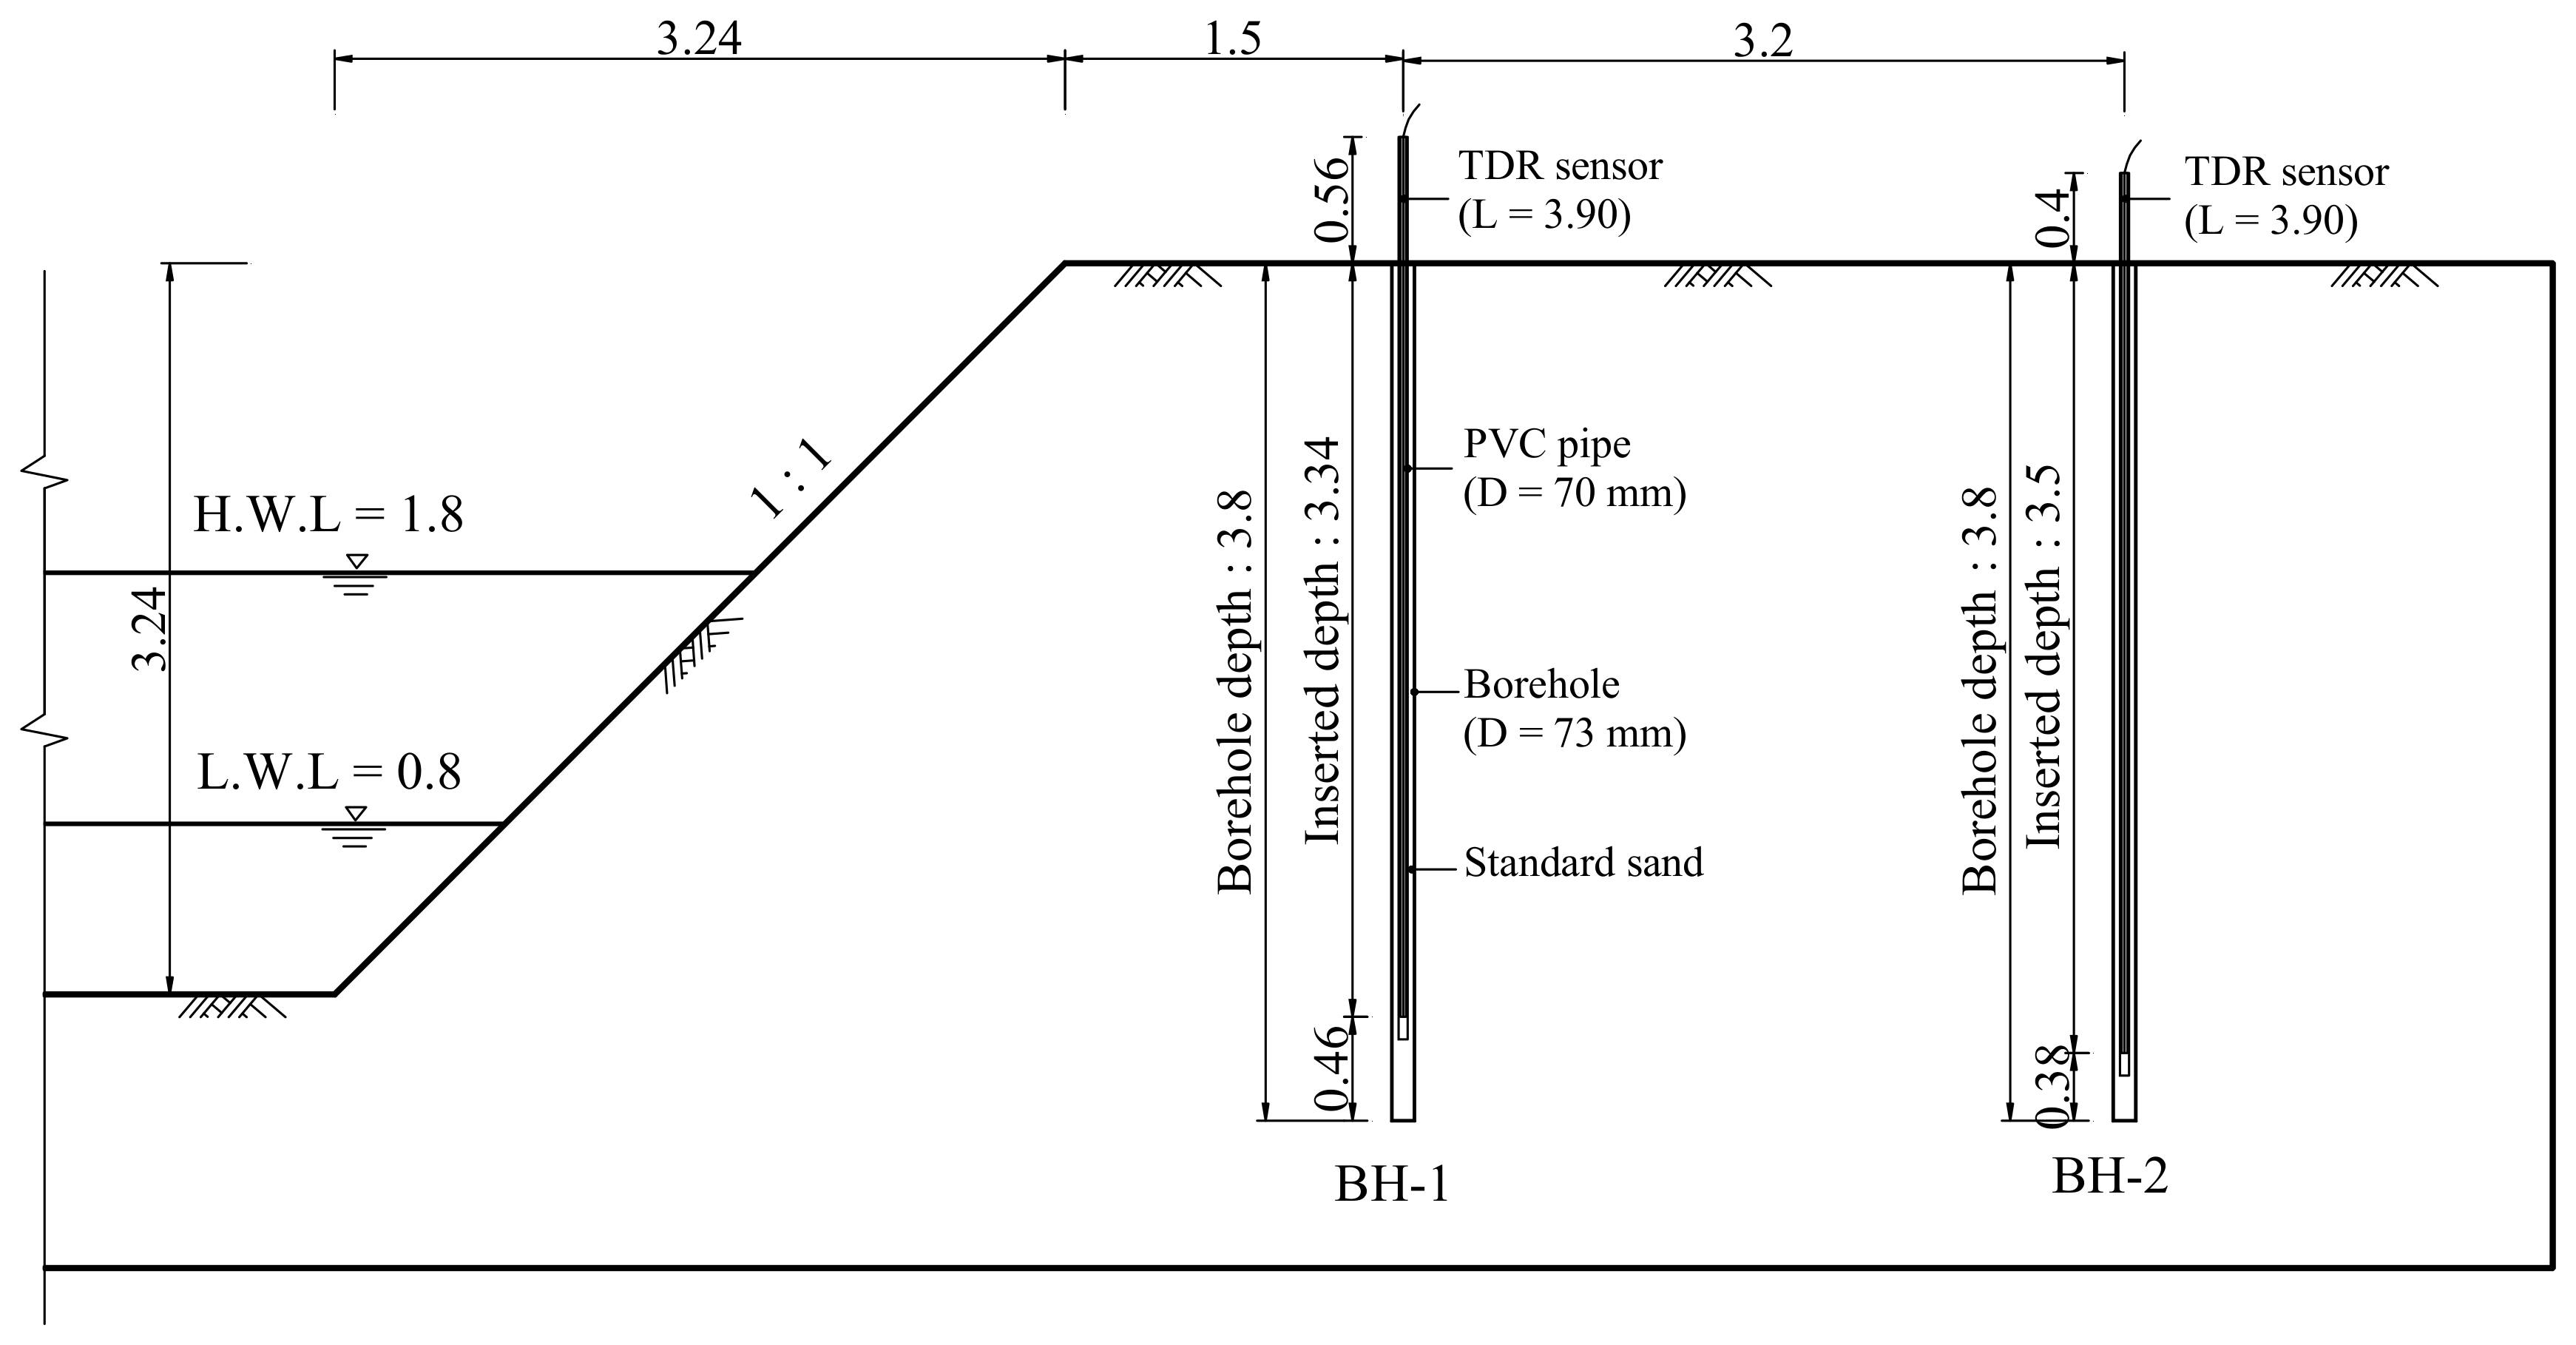
Figure 10 is a schematic view of the field experiment using the spatial-TDR sensor. The height of the experimental levee is 3.2 m and the slope degree is 1:1. There are two measurement points provided with the spatial-TDR sensors: BH-1 is 1.5 m horizontal distance from the crest of the levee and BH-2 is 4.7 m away. The water level of the river was 1.8 m in the high water level (HWL) and in the low water level (LWL). Since it takes time to change the groundwater level according to the water level of the river, it was measured after 10 days. The diameter of the boring hole is 80 mm in NX size. After penetrating the PVC pipe to prevent the boring hole from falling, the line-type sensing line was penetrated into it and homogeneously filled with dried standard sand. Finally, the casing, the PVC pipe, was removed from the boring hole. The depth of the boring hole of BH-1 is 3.8 m, the depth of line type line is 3.34 m, and the exposed length of the ground surface is 0.56 m. The depth of the boring hole of BH-2 is 3.8 m and the depth of penetration of the measuring line is 3.5 m. The exposed length is 0.4 m. Both sensing lines of the spatial TDR sensor were constructed with a total length of 3.9 m.
4.2. Two-Dimensional Electric Waveform of the Spatial-TDR Sensor Measured in the Field Experiment
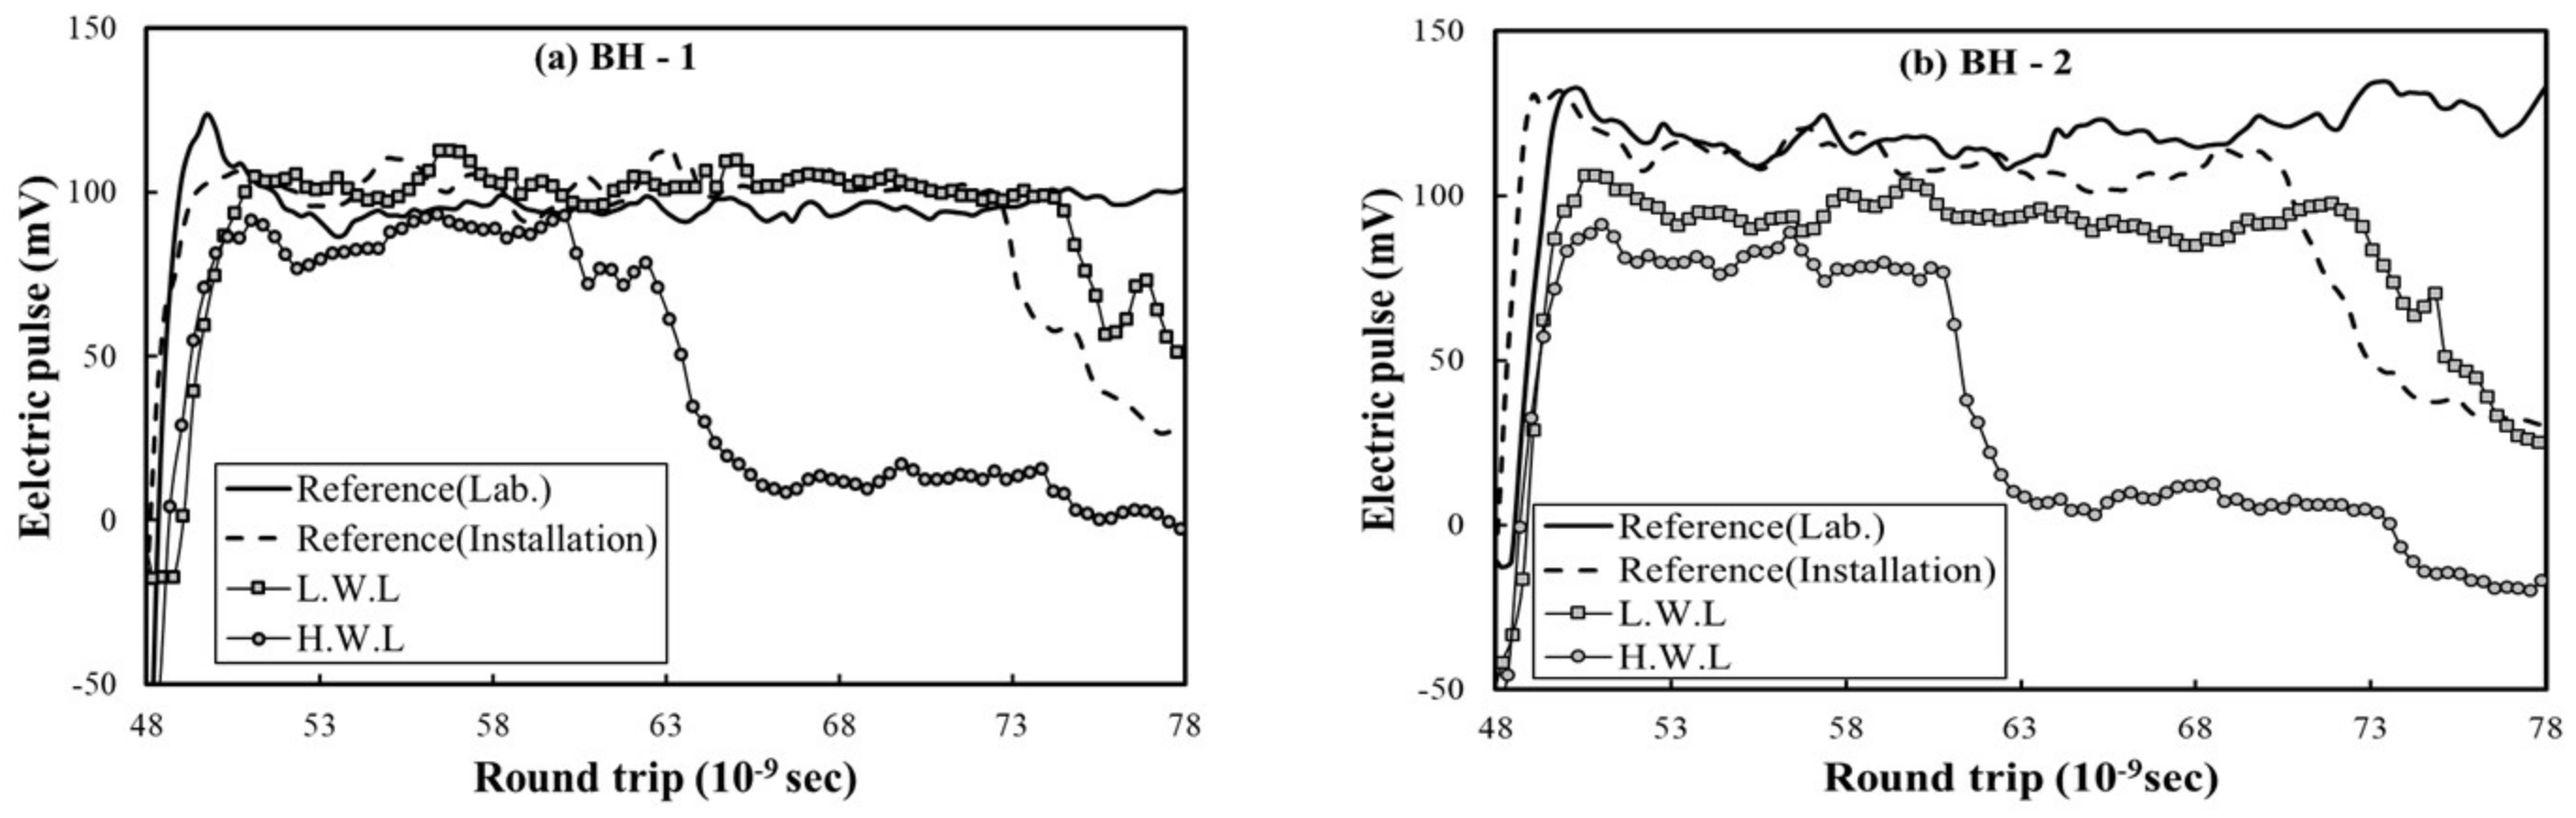
Figure 11 shows the two-dimensional electric waveforms of the spatial-TDR sensor measured in the field experiment. The electric waveform was measured at four conditions when the sensing line was prepared, the first being the initial value when installed in the laboratory experiment in Section 3.1, the second condition being immediately after installation on the levee, and the other conditions being reproduced with high water level and low water level. The initial values of BH-1 and BH-2 in Figure 11a,b all showed a constant voltage of electric pulse. Immediately after the installation on the levee, the electric pulse decreased due to the influence of groundwater. At the high water level of 1.8 m, the round-trip time, in which the electric pulse begins to decrease, was shortened to about . At the low water level of 0.8 m, the round-trip time was shortened to about .
In the electric waveforms shown in Figure 11, although the distribution of electric pulses can be roughly determined according to the change of the groundwater level, it is difficult to intuitively calculate the groundwater level and the unsaturated region because of the noise. Therefore, filtering and calibration procedures for the electric waveform must be followed.
4.3. Filtering and Calibration Algorithm for Two-Dimensional Electric Waveforms
The author developed a filtering and calibration algorithm for two-dimensional electric waveforms of distributed-TDR sensors. The two-dimensional electric waveforms measured in the laboratory model simulation showed relatively low noise and intuitively judged groundwater level and unsaturated area. However, the two-dimensional electric waveform of the spatial-TDR sensor when applied to the field generated much noise, making it difficult to intuitively judge groundwater level. Therefore, a filtering technique for two-dimensional electric waveforms was applied and a calibration algorithm was developed by applying the calibration equation calculated in the laboratory experiments. The calibration equation for the electric pulse and water content of the soil was applied considering the effect on the length of the sensing line.
In general, the raw data contained noise, which is a random signal. Therefore, to obtain accurate test results, the noise was removed. A two-stage filtering technique was adopted to remove the noise. First, a Fourier transform was used, after a moving-average method. The moving-average method is used to remove low-frequency noise and is expressed by Equation (6):
The Fourier transform is a filtering technique for the function transform of filtered data. Either an even or odd function can be used according to the function type of the initial measured data. Basically, an even function uses the “Fourier cosine series,” while an odd function uses the “Fourier sine series.” The equation to analyze an even function is expressed by
where
Likewise, an odd function can be expressed by
where
The variation of the TDR data is composed of the variation of water content of the ground and the variation of the resistance of the steel used as the measuring sensor. To find out the actual variation of the degree of saturation of the ground from the measurement, both values should be calibrated. In other words, the raw data contains not only the value of saturation variation, but also the values of the increase of the electric resistance, according to the increase of steel wire. This means that even though the ground has the same degree of saturation, the values measured at a shallow depth can be different from those at a deep depth. Figure 12 shows the procedure of saturation analysis using TDR sensors.
Figure 12 shows a flowchart of the filtering and calibration algorithm for the spatial-TDR sensors. First, a two-dimensional electric waveform is measured and data is acquired using a TDR device. The first-order filtering is performed using the moving-average method shown in Equation (7). Then, a discrete Fourier transform (DFT) is performed by the second-order filtering. Equation (7) applies if the data is an even function and Equation (8) applies if it is an odd function. A new function of rawdata is created by filtering a two-dimensional electric waveform with a moving-average method and a DFT. This corrects the calibration equation calculated in the laboratory experiment and the electrical resistance against the length of the steel wire. Finally, the degree of saturation of soil is calculated. Here, as shown in Figure 5, the conversion of the round-trip time of the electric pulse to the length of the sensing line is not included in this algorithm. This is because the conversion of the length is used to find and correct the starting and ending points of the manufactured sensing line.
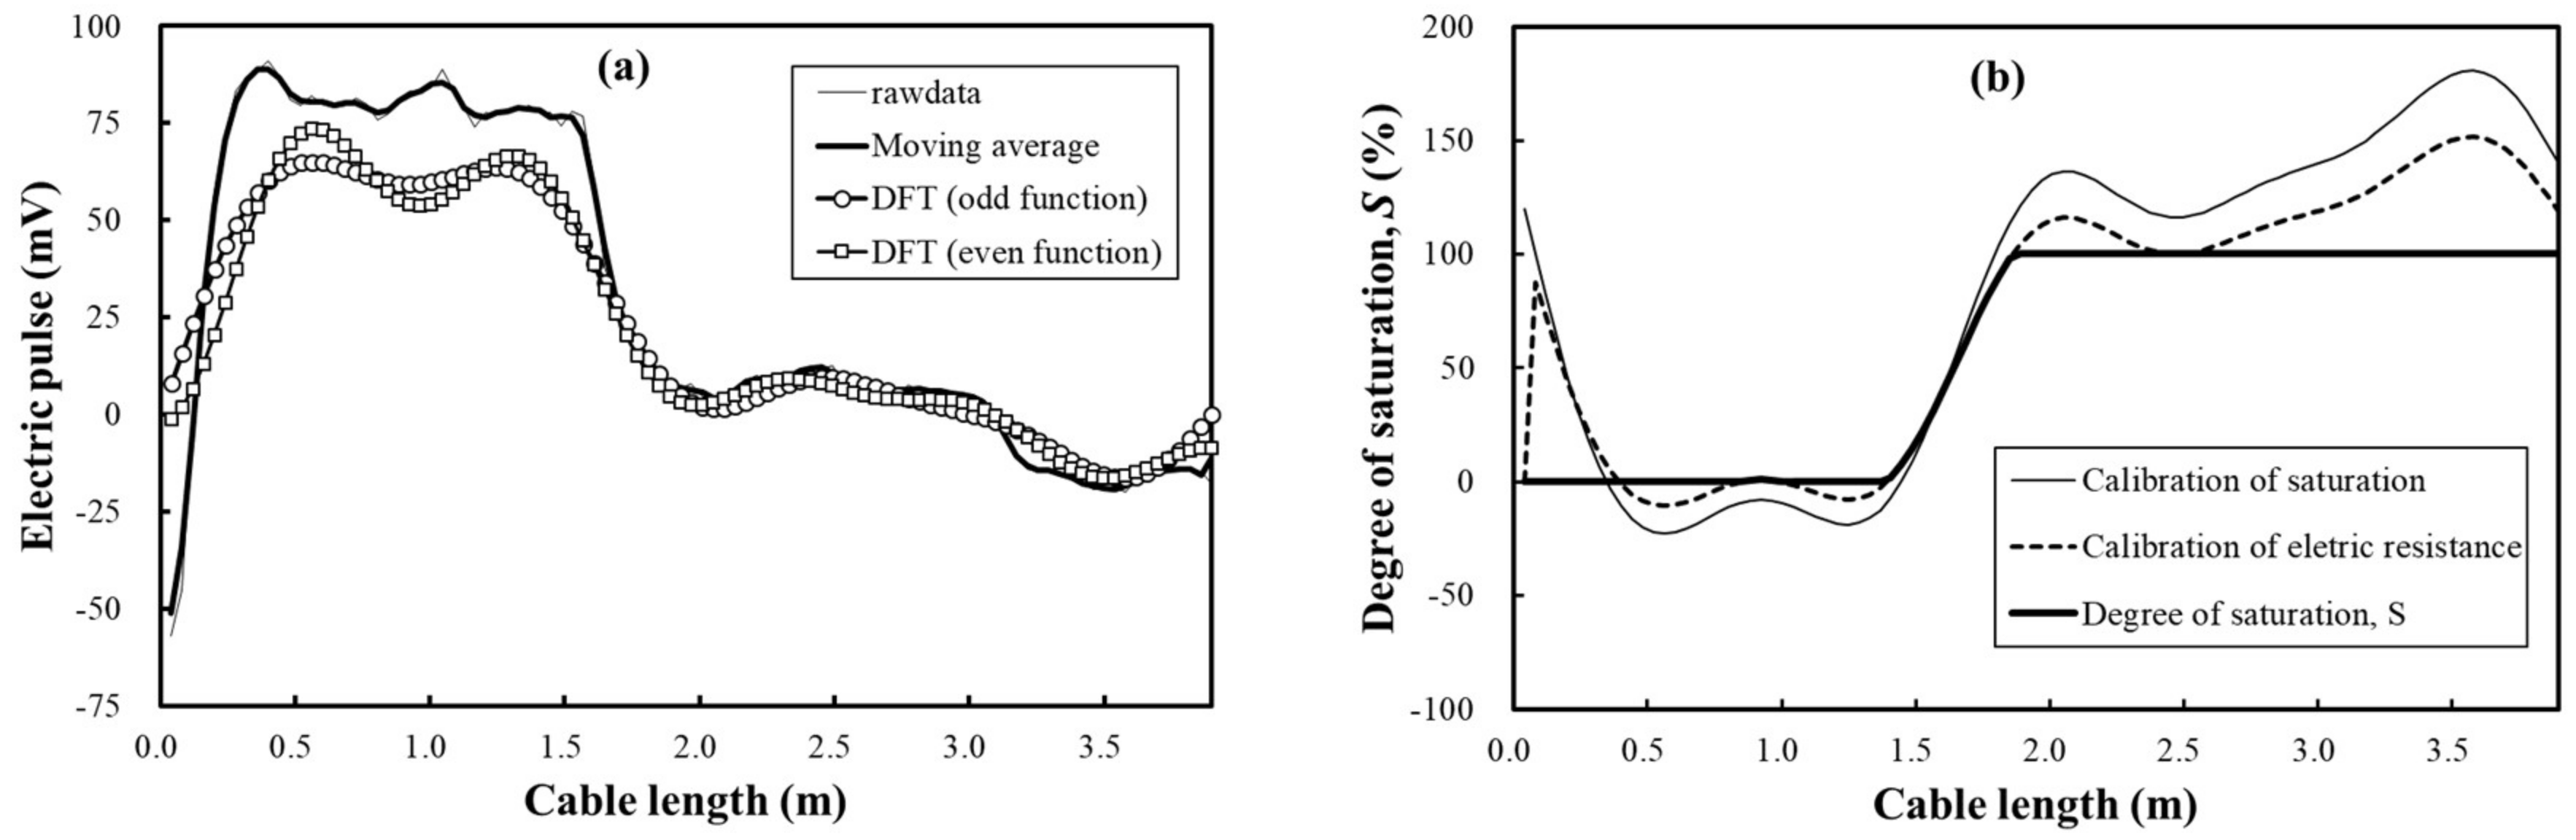
Figure 13 is the procedure of filtering and calibration for the electrical waveform of the spatial-TDR sensor. The electric waveform measured at HWL condition of BH-2 shown in Figure 11 was calibrated according to the procedure of Figure 12. Figure 13a shows the first-order filtering using the moving-average method and the second-order filtering using DFT as shown in Figure 12. When raw data is subjected to the first-order filtering by the moving-average method using Equation (6), the data is smoothed and the noise is removed. Then, the DFT performs the second-order filtering using the even function of Equation (7) and the odd function of Equation (9). As a result, more noise was removed in the second order filtering using the odd function. Therefore, the function created by the odd function was used for the calibration process. For this reason, the function created by the odd function was used for the calibration process. Thus, by using the DFT, the discrete data that is discontinuous can be made into a new function of the electric waveform. It is easy to find groundwater and unsaturated areas by making a continuous function and thus also easy to develop software in the future.
Figure 13b shows the calibration procedure for the new function of the electric waveform. First, the voltage of the electric pulse is calibrated by the degree of saturation of soil with the calibration equation calculated in the laboratory experiment. Next, calibrated the electrical resistance of the steel wire is performed. The point-TDR sensor has a rod length as short as 11 cm, so it is not necessary to calibrate the length. However, the spatial-TDR sensor has a very long length of 4.0 m for the steel wire, so the electrical resistance must be calibrated. Finally, it calculates the groundwater level with 100% of the degree of saturation and the unsaturated area between 0 and 100% of the degree of saturation.
4.4. Estimation Results of Groundwater and Unsaturated Areas
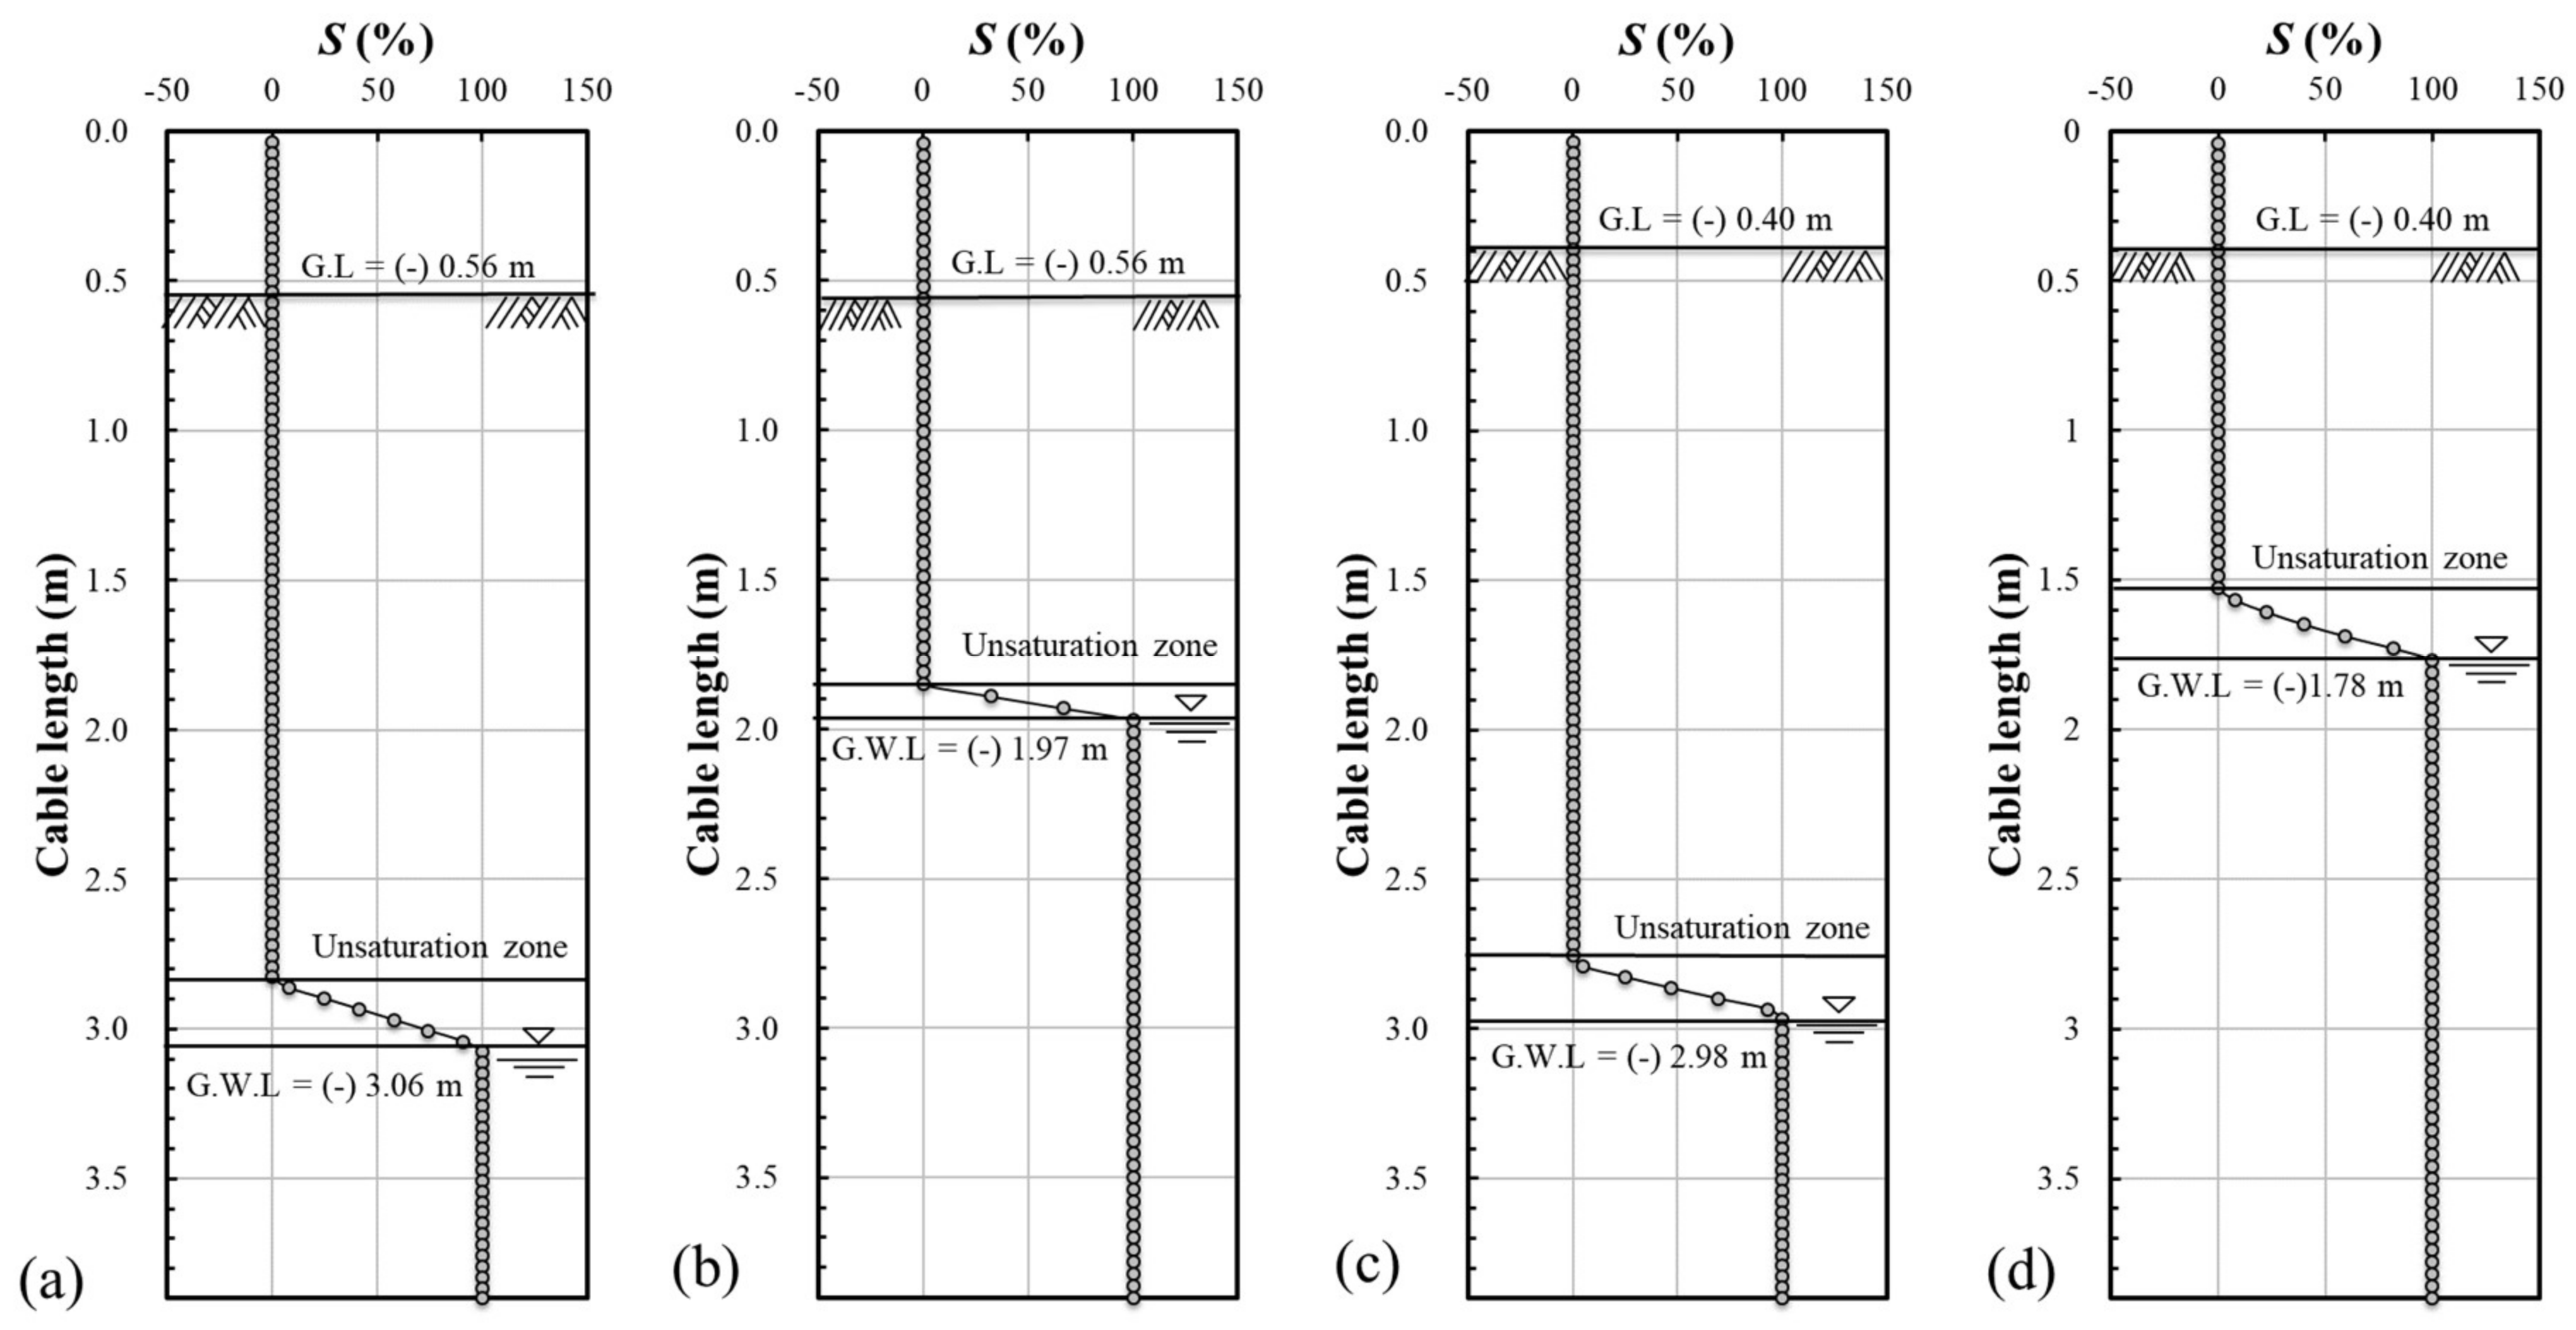
Figure 14 is the result of groundwater level and unsaturation after applying the filtering and calibration algorithms of two-dimensional electric waveforms. Figure 14 shows the result of calibration of the raw data of electric waveform shown in Figure 11 according to the flowchart shown in Figure 12. To intuitively judge the groundwater level and the unsaturated area, the horizontal axis of the electric waveform is calibrated to the length of the sensing line and displayed on the vertical axis. The voltage of the electric pulse on the vertical axis was calibrated by the degree of saturation of soil according to the flowchart shown in Figure 12.
Figure 13a,b shows the groundwater level and unsaturated area of BH-1. In the LWL condition of BH-1 in Figure 13a, the groundwater level was estimated at 3.06 m and the unsaturated area at about 25 cm. In the HWL condition of BH-1 in Figure 13b, the groundwater level was estimated at 1.97 m and the unsaturated area was estimated at about 10 cm. Figure 13c,d are the results of estimating the groundwater level and unsaturated area of BH-2. In the LWL condition of BH-2 in Figure 13c, the groundwater level was estimated at 2.98 m and the unsaturated area was estimated at about 20 cm. In the HWL condition of BH-2 in Figure 13d, the groundwater level was estimated at 1.78 m and the unsaturated area was estimated at about 20 cm.
As shown in Figure 15, the measured groundwater level in each bored hole (BH-1, BH-2) is connected to the water level of the river. The groundwater level varied with the change of the water level of the river and the spatial-type TDR sensor accurately measured it.
5. Conclusions
In this study, the author developed the spatial-TDR sensor and filtering and calibration algorithms for efficient management of groundwater at riverside and conducted laboratory and field experiments on whether groundwater level and the unsaturated area can be measured. The point-TDR sensor rod was developed to the line-type sensing line of the spatial-TDR sensor for penetrating the boring hole in the field. Although the sensing line using steel wire is excellent for transportation and installation, because the electric pulses contain a relatively large amount of noise, the filtering and calibration procedure was required. The filtering and calibration algorithms used the moving-average method, the DFT, and the calibration equation calculated by the laboratory experiments. As a result of the laboratory model simulation and the field experiment, the groundwater level and the unsaturated area were measured using the spatial-TDR sensor with line-type sensing line.
For development of the spatial-TDR sensor, a line-type sensing line using steel wire was developed to improve the rod-type probe of the point-TDR sensor. A point-TDR sensor to manage compaction and water content of soil was constructed to hit a rod with a diameter of 8 mm. The spatial-TDR sensor for measuring groundwater level and an unsaturated area in the ground was made flexible so that steel wire of 1.2 mm diameter could be penetrated into the boring hole. The laboratory and field tests demonstrated that it was convenient to carry and install the flexible sensing line using steel wire. To maintain consistent filling in the boring holes and the use of consistent calibration equations, dried standard sand was used. As a result, the filling efficiency was good and the permeability was homogeneous.
Next, the correlation between the water content of the soil and the electric pulse was determined through laboratory experiments. Since the sensing line of the spatial-TDR sensor is long, the calibration equation varies according to length, as shown in Figure 7d. However, as suggested by Topp, Davis and Annan [6], the relationship between water content and the dielectric constant of soil maintains a linear form. In the spatial-TDR sensor, the relationship between the voltage of electric pulse and the degree of saturation depends on the length due to the electrical resistance of the sensing line. Therefore, this research considered this in the calibration process.
Laboratory model simulation was carried out to measure and verify the groundwater level of a circular acrylic pipe using the spatial-TDR sensors. As a result of the laboratory model simulation, the two-dimensional electric waveforms changed according to the groundwater reproduced in the circular acrylic pipe. The degree of saturation of soil can is easily estimated by the calibration equation and line-type sensing line was made considering field application. As a result of applying it to the laboratory experiment, it was easy to penetrate the vertical boring hole because of the softness of the steel wire and the dried standard sand which was filled homogeneously. However, the calibrated degree of saturation graph contained noise and the degree of saturation exceeded the threshold of 100%. Therefore, the problems arising from the laboratory experiment were solved through field experiments
Finally, the author developed a filtering and calibration algorithm for the spatial-TDR sensor and applied it to measure the groundwater level and unsaturation area of the levee. First, a two-dimensional electric waveform was measured and data was acquired using a TDR device. The first-order filtering was performed using the moving-average method shown in Equation (7). Then, a DFT was performed by the second-order filtering. Equation (7) applies if the data is an even function and Equation (8) applies if it is an odd function. A new function of rawdata was created by filtering a two-dimensional electric waveform with a moving-average method and a DFT. This corrected the calibration equation calculated in the laboratory experiment and the electrical resistance against the length of the steel wire. Finally, the degree of saturation of soil was calculated. Here, by using the DFT, the discrete data that was discontinuous data was made into a new function of the electric waveform. It is easy to find groundwater and unsaturated areas by making a continuous function and also easy to develop software in the future. As a result of the field experiment, the groundwater level changed with the fluctuation of the river’s water level and the spatial-type TDR sensor accurately measured it.
However, the spatial-TDR sensor developed in this study requires additional experimental verification through future studies. In this study, it is not possible to perform a quantitative comparison experiment with other sensors because of experimental limitations. Therefore, it is necessary to compare and verify with a water-content sensor or groundwater level sensor in future studies. In particular, Yang, et al. [21] and Kim [22] conducted a one-dimensional seepage experiment.
Conflicts of Interest
The authors declare no conflict of interest.
References
- Indrawan, I.G.B.; Rahardjo, H.; Leong, E.-C.; Tan, P.-Y.; Fong, Y.-K.; Sim, E.-K. Field instrumentation for monitoring of water, heat, and gas transfers through unsaturated soils. Eng. Geol. 2012, 151, 24–36. [Google Scholar] [CrossRef]
- Park, M.C. Behavior analysis by model slope experiment of artificial rainfall. Nat. Hazards Earth Syst. Sci. 2016, 16, 789–800. [Google Scholar] [CrossRef]
- Tohari, A.; Nishigaki, M.; Komatsu, M. Laboratory rainfall-induced slope failure with moisture content measurement. J. Geotech. Geoenviron. Eng. 2007, 133, 575–587. [Google Scholar] [CrossRef]
- Tami, D.; Rahardjo, H.; Leong, E.-C. Effects of hysteresis on steady-state infiltration in unsaturated slopes. J. Geotech. Geoenviron. Eng. 2004, 130, 956–967. [Google Scholar] [CrossRef]
- Davis, J.; Chudobiak, W. In situ meter for measuring relative permittivity of soils. Geol. Surv. Can. Pap. 1975, 75, 75–79. [Google Scholar]
- Topp, G.C.; Davis, J.; Annan, A.P. Electromagnetic determination of soil water content: Measurements in coaxial transmission lines. Water Resour. Res. 1980, 16, 574–582. [Google Scholar] [CrossRef]
- Zegelin, S.; White, I.; Russell, G. A critique of the time domain reflectometry technique for determining field soil-water content. In Advances in Measurement of Soil Physical Properties: Bringing Theory into Practice; Soil Science Society of America: Madison, WI, USA, 1992; pp. 187–208. [Google Scholar]
- ASTM. Standard Test Method for Water Content and Density of Soil in Place by Time Domain Reflectometry (TDR); ASTM International: West Conshohocken, PA, USA, 2002; Volume 4. [Google Scholar]
- Drnevich, V.P. Some New Uses of Time Domain Reflectometry in Geotechnical Engineering. In Proceedings of the Soil Dynamics Symposium in Honor of Professor Richard D. Woods, Austin, TX, USA, 24–26 January 2005; pp. 1–16. [Google Scholar]
- Chen, R.; Drnevich, V.P.; Yu, X.; Nowack, R.L.; Chen, Y. Time domain reflectometry surface reflections for dielectric constant in highly conductive soils. J. Geotech. Geoenviron. Eng. 2007, 133, 1597–1608. [Google Scholar] [CrossRef]
- Chen, R.; Xu, W.; Chen, Y. Measuring dielectric constant in highly conductive soils based on surface reflection coefficients. J. Geotech. Geoenviron. Eng. 2009, 135, 1883–1891. [Google Scholar] [CrossRef]
- Dowding, C.; Pierce, C. Use of time domain reflectometry to detect bridge scour and monitor pier movement. In Proceedings of the Symposium on Time Domain Reflectometry in Environmental, Infrastructure, and Mining Applications, Evanston, IL, USA, 7–9 September 1994; pp. 7–9. [Google Scholar]
- Worsching, H.; Becker, R.; Schlaeger, S.; Bieberstein, A.; Kudella, P. Spatial-TDR moisture measurement in a large scale levee model made of loamy soil material. In Proceedings of the 3rd International Symposium on Time Domain Reflectometry for Innovative Soils Applications, Purdue University, West Lafayette, IN, USA, 17–20 September 2006. [Google Scholar]
- Scheuermann, A.; Huebner, C.; Schlaeger, S.; Wagner, N.; Becker, R.; Bieberstein, A. Spatial time domain reflectometry and its application for the measurement of water content distributions along flat ribbon cables in a full-scale levee model. Water Resour. Res. 2009, 45. [Google Scholar] [CrossRef]
- Wagner, N.; Trinks, E.; Kupfer, K. Determination of the spatial TDR-sensor characteristics in strong dispersive subsoil using 3D-FEM frequency domain simulations in combination with microwave dielectric spectroscopy. Meas. Sci. Technol. 2007, 18, 1137. [Google Scholar] [CrossRef]
- Graeff, T.; Zehe, E.; Schlaeger, S.; Morgner, M.; Bauer, A.; Becker, R.; Creutzfeldt, B.; Bronstert, A. A quality assessment of spatial TDR soil moisture measurements in homogenous and heterogeneous media with laboratory experiments. Hydrol. Earth Syst. Sci. 2010, 14, 1007–1020. [Google Scholar] [CrossRef] [Green Version]
- Fan, J.; Scheuermann, A.; Guyot, A.; Baumgartl, T.; Lockington, D.A. Quantifying spatiotemporal dynamics of root-zone soil water in a mixed forest on subtropical coastal sand dune using surface ERT and spatial TDR. J. Hydrol. 2015, 523, 475–488. [Google Scholar] [CrossRef]
- Giese, K.; Tiemann, R. Determination of the complex permittivity from thin-sample time domain reflectometry improved analysis of the step response waveform. Adv. Mol. Relax. Processes 1975, 7, 45–59. [Google Scholar] [CrossRef]
- Yu, X.; Drnevich, V.P. Soil water content and dry density by time domain reflectometry. J. Geotech. Geoenviron. Eng. 2004, 130, 922–934. [Google Scholar] [CrossRef]
- Das, B.M. Advanced soil Mechanics; CRC Press: Boca Raton, FL, USA, 2013. [Google Scholar]
- Yang, H.; Rahardjo, H.; Xiao, D. Laboratory Study of Steady-State Vertical Infiltration in Layered Soils. In Geo-Frontiers 2011: Advances in Geotechnical Engineering; American Society of Civil Engineers: Reston, VA, USA, 2011; pp. 1382–1391. [Google Scholar]
- Kim, Y. Soil Slope Design and Stability Evaluation Methodology Considering Hydraulic Conductivity and Rainfall Characteristics; Korea Advanced Institute of Science and Technology: Daejeon, Korea, 2009. [Google Scholar]
Figure 1.
Configuration of (a) coaxial head; (b) coaxial cylinder 1: stainless steel in the coaxial head; 2: studs; 3: stainless steel ring; 4: central rod; 5: soil or water in the mold; 6: metal mold; 7: air gap; 8: Delrin as the insulating material in the coaxial head; 9: Delrin as the base of the mold; 10: soil or water surface [10].
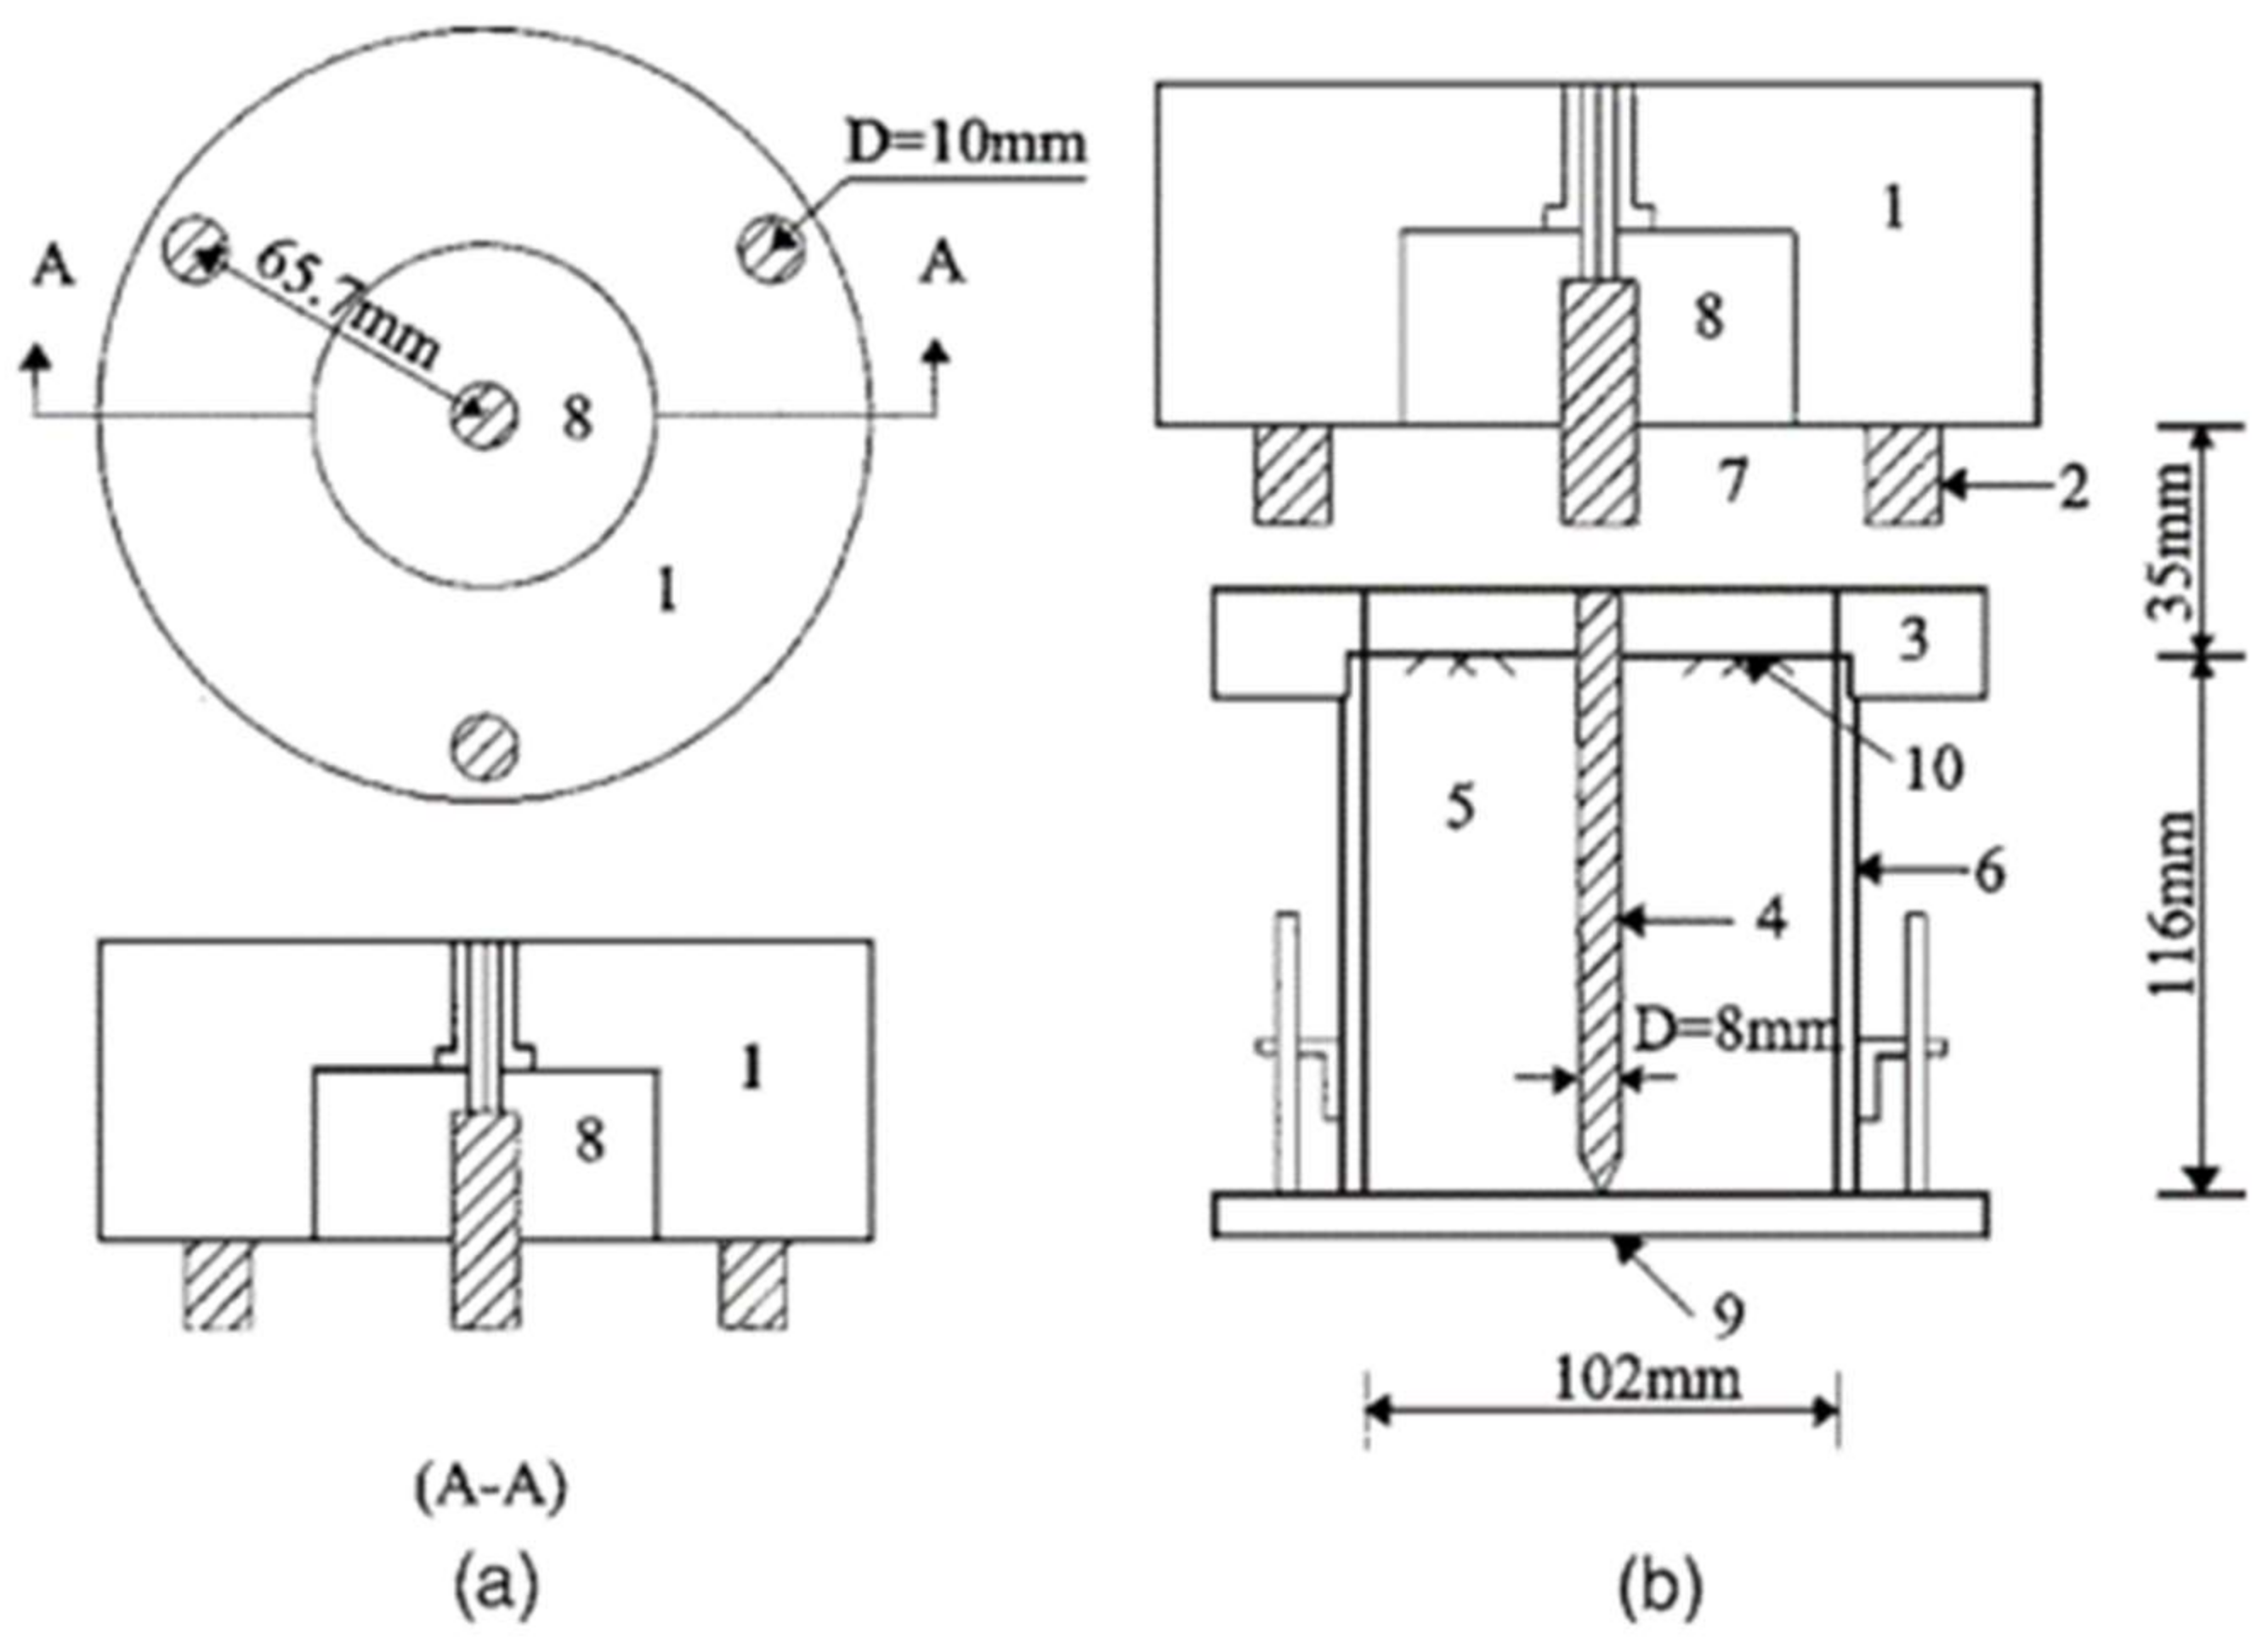
Figure 2.
Typical TDR waveform for soil showing measurements to obtain apparent dielectric constant, , and bulk D.C. electrical conductivity, [8].
Figure 2.
Typical TDR waveform for soil showing measurements to obtain apparent dielectric constant, , and bulk D.C. electrical conductivity, [8].

Figure 3.
The concept of spatial-TDR sensor for measurement of groundwater and unsaturated area at riverside.
Figure 3.
The concept of spatial-TDR sensor for measurement of groundwater and unsaturated area at riverside.

Figure 4.
The instrument and line-type sensing lines of the spatial-TDR sensor fabricated for this; (a) Line-type sensing line and TDR device (HL8200 TCP/IP; (b) Detailed photograph of line-type sensing line.
Figure 4.
The instrument and line-type sensing lines of the spatial-TDR sensor fabricated for this; (a) Line-type sensing line and TDR device (HL8200 TCP/IP; (b) Detailed photograph of line-type sensing line.

Figure 5.
The two-dimensional electrical waveform measured on a TDR device.

Figure 6.
The figure of laboratory experiments to calculate the calibration equations for voltage of electric pulse and degree of saturation of soil; (a) Sets up the equipment for the laboratory experiment; (b) For photographing, wetted standard sand with 60% of the degree of saturation was filled in a soil box in half.

Figure 7.
The electrical waveforms were measured in nine cases, with different positions and = degrees of saturation of wetted standard sand; (a) The case of location of the top of the soil box being filled with wetted standard sand; (b) middle; (c) bottom; (d) Correlation between voltage of electric pulse and degree of saturation of soil.

Figure 8.
Photographs of experimental equipment and results of laboratory model simulation; (a) Experimental view; (b) Two-dimensional electric waveform measured at the elapsed time of 5 min after injection of infiltration water at a point of 0.3 m; (c) the calibrated degree of saturation of soil at that time.

Figure 9.
In the case of infiltration at 1.3 m of circular acrylic pipe, view and experimental results of laboratory model simulation; (a) Experimental view; (b) variation in two-dimensional electric waveform after injection of infiltration water at 1.3 m; (c) the calibrated degree of saturation of soil at that time.

Figure 10.
A schematic view of field experiment using spatial-TDR sensor (unit: meter).

Figure 11.
Two-dimensional electric waveform of the spatial-TDR sensor measured in the field experiment; (a) BH-1; (b) BH-2.
Figure 11.
Two-dimensional electric waveform of the spatial-TDR sensor measured in the field experiment; (a) BH-1; (b) BH-2.

Figure 12.
A flowchart of the filtering and calibration algorithm for the spatial-TDR sensors.
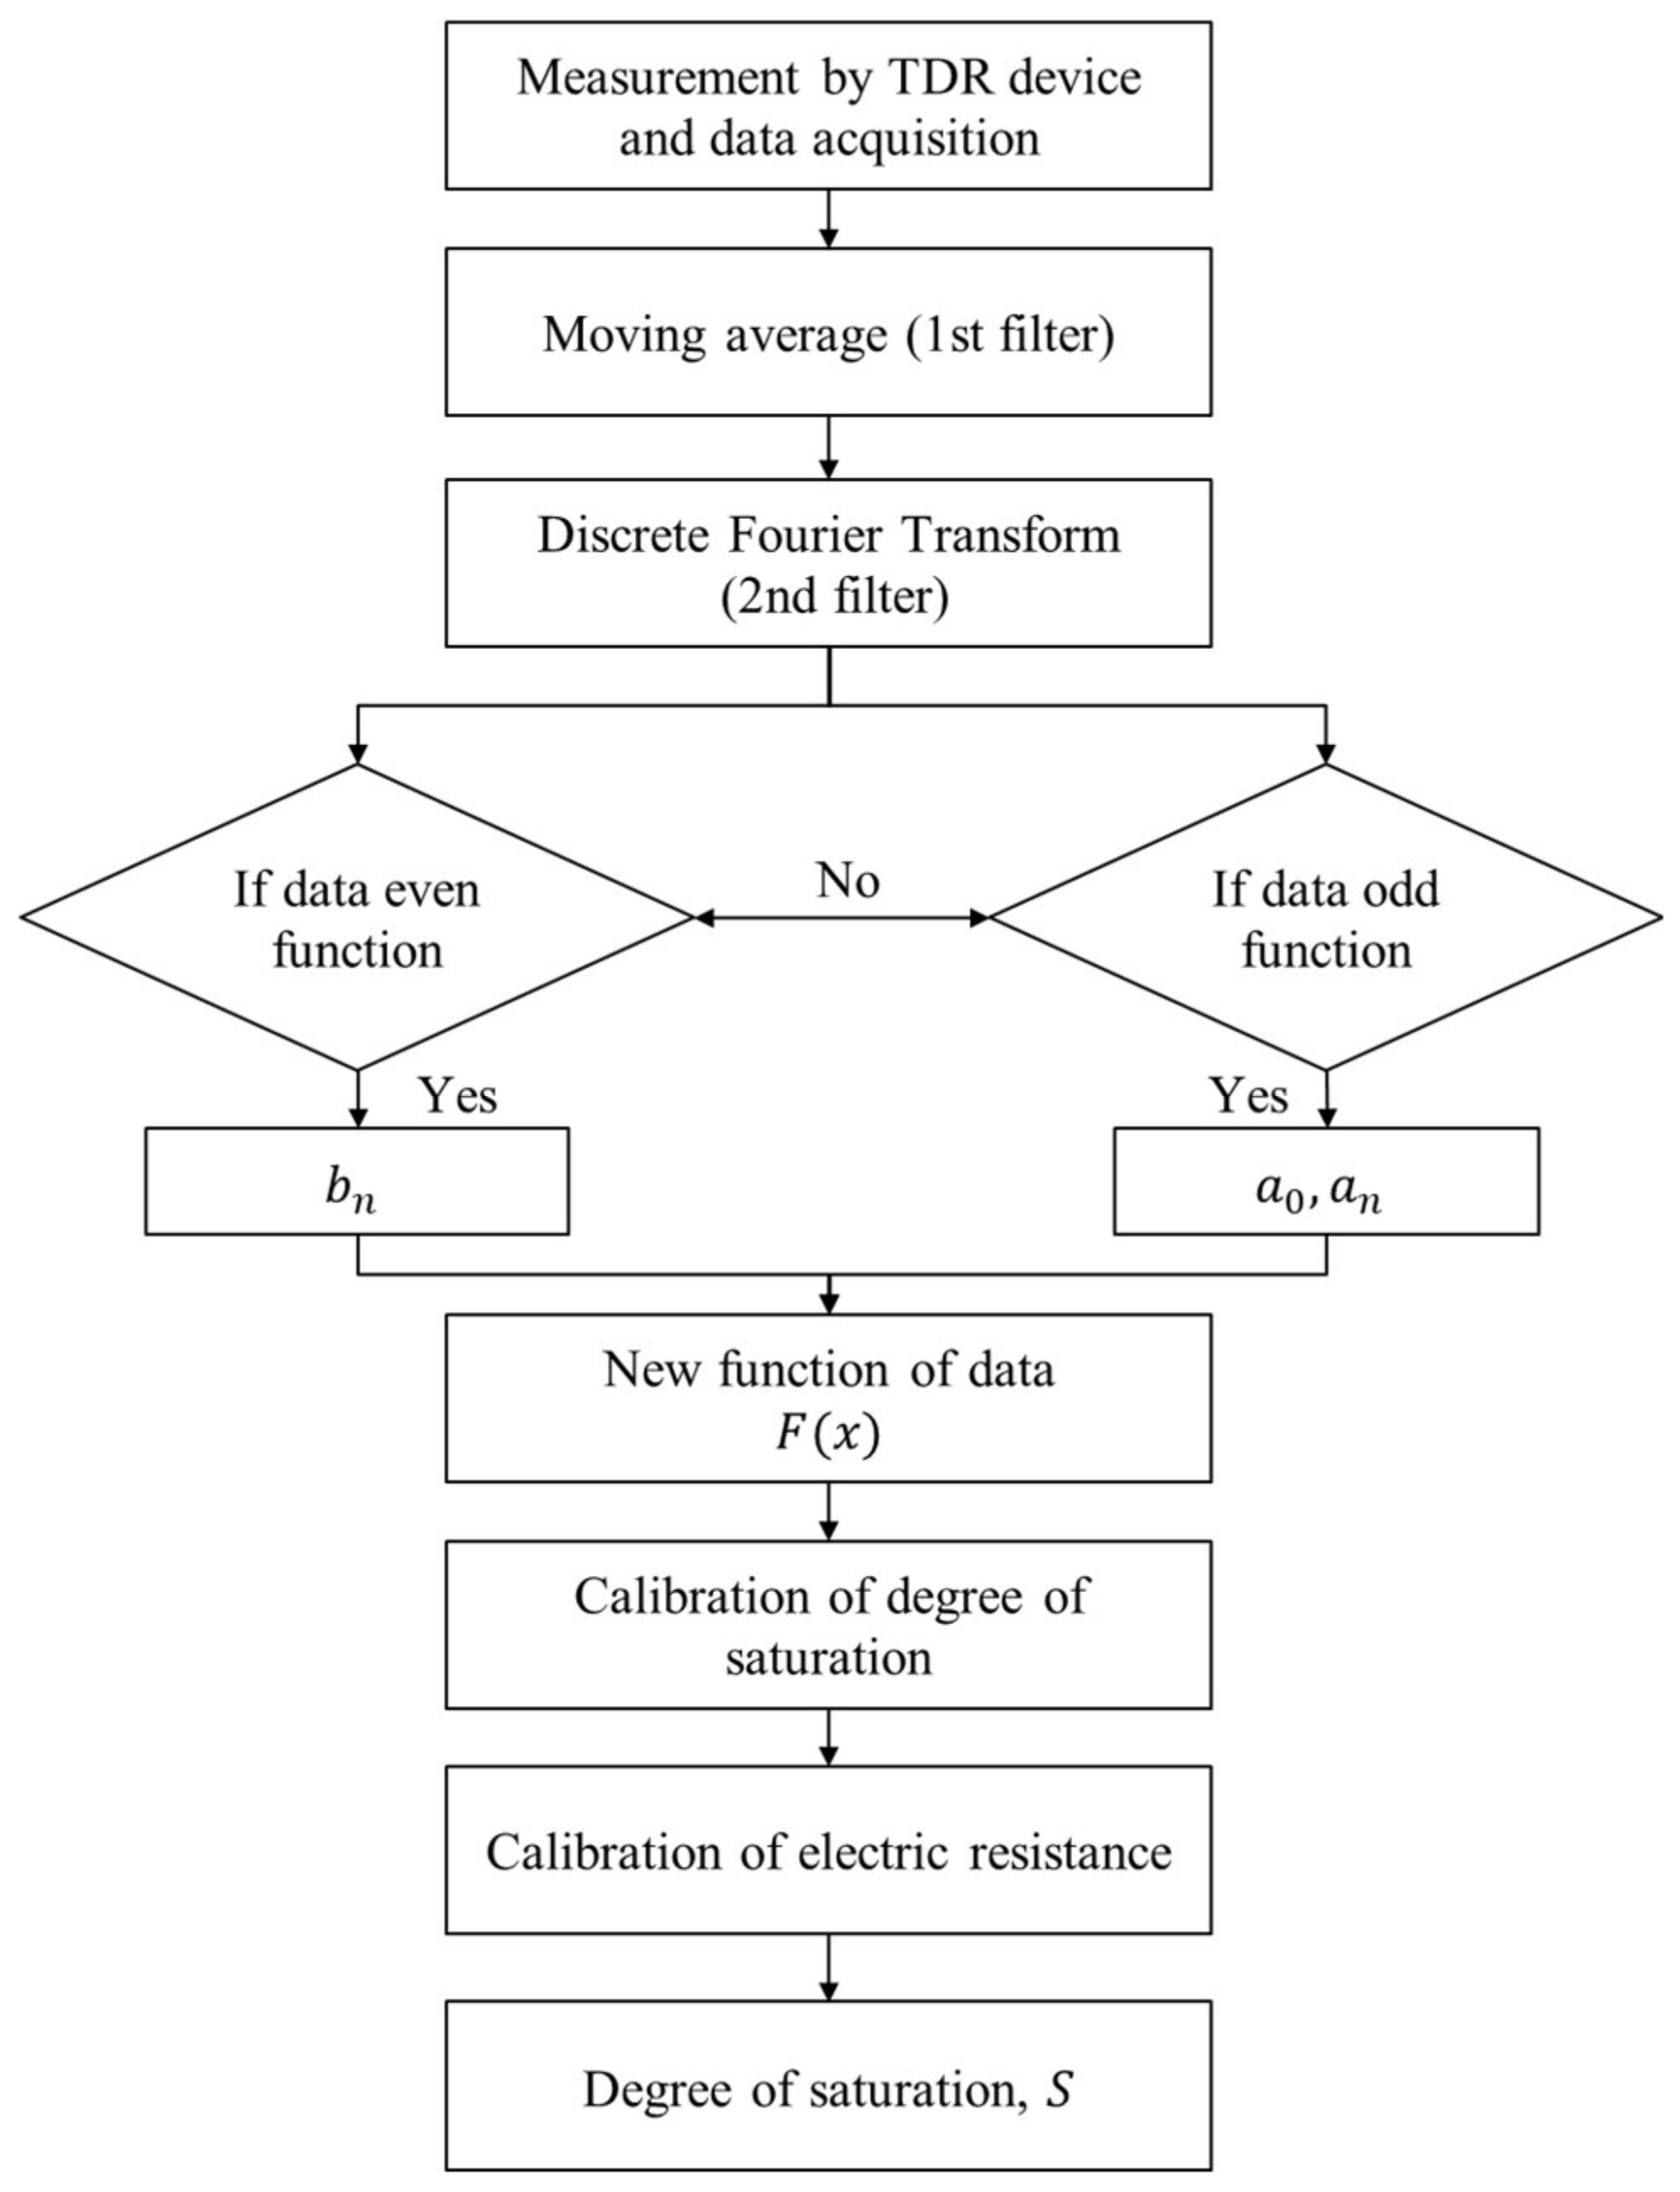
Figure 13.
The procedure of filtering and calibration for the electrical waveform of the spatial-TDR sensor; (a) moving-average and discrete Fourier transform; (b) the calibration process of the degree of saturation and electrical resistance of sensing line and, final result.
Figure 13.
The procedure of filtering and calibration for the electrical waveform of the spatial-TDR sensor; (a) moving-average and discrete Fourier transform; (b) the calibration process of the degree of saturation and electrical resistance of sensing line and, final result.

Figure 14.
The result of groundwater level and unsaturation after filtering and calibration algorithm of two-dimensional electric waveforms; (a) BH-1 in the LWL condition; (b) BH-1 in the HWL condition; (c) BH-2 in the LWL condition; and (d) BH-2 in the HWL condition.
Figure 14.
The result of groundwater level and unsaturation after filtering and calibration algorithm of two-dimensional electric waveforms; (a) BH-1 in the LWL condition; (b) BH-1 in the HWL condition; (c) BH-2 in the LWL condition; and (d) BH-2 in the HWL condition.

Figure 15.
The result of measurement of the groundwater level of the levee.

© 2018 by the author. Licensee MDPI, Basel, Switzerland. This article is an open access article distributed under the terms and conditions of the Creative Commons Attribution (CC BY) license (http://creativecommons.org/licenses/by/4.0/).
Share and Cite
MDPI and ACS Style
Park, M. A Study on the Development and Application of Spatial-TDR Sensor for the Management of Groundwater at Riverside. Sustainability 2018, 10, 1213. https://doi.org/10.3390/su10041213
AMA Style
Park M. A Study on the Development and Application of Spatial-TDR Sensor for the Management of Groundwater at Riverside. Sustainability. 2018; 10(4):1213. https://doi.org/10.3390/su10041213
Chicago/Turabian StylePark, Mincheol. 2018. "A Study on the Development and Application of Spatial-TDR Sensor for the Management of Groundwater at Riverside" Sustainability 10, no. 4: 1213. https://doi.org/10.3390/su10041213
Note that from the first issue of 2016, this journal uses article numbers instead of page numbers. See further details here.