A New Framework to Evaluate Urban Design Using Urban Microclimatic Modeling in Future Climatic Conditions

 , ,
, ,  ,
,
Abstract
1. Introduction
1.1. Changing Climate and Changing Buildings
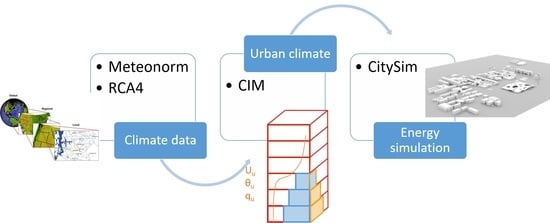
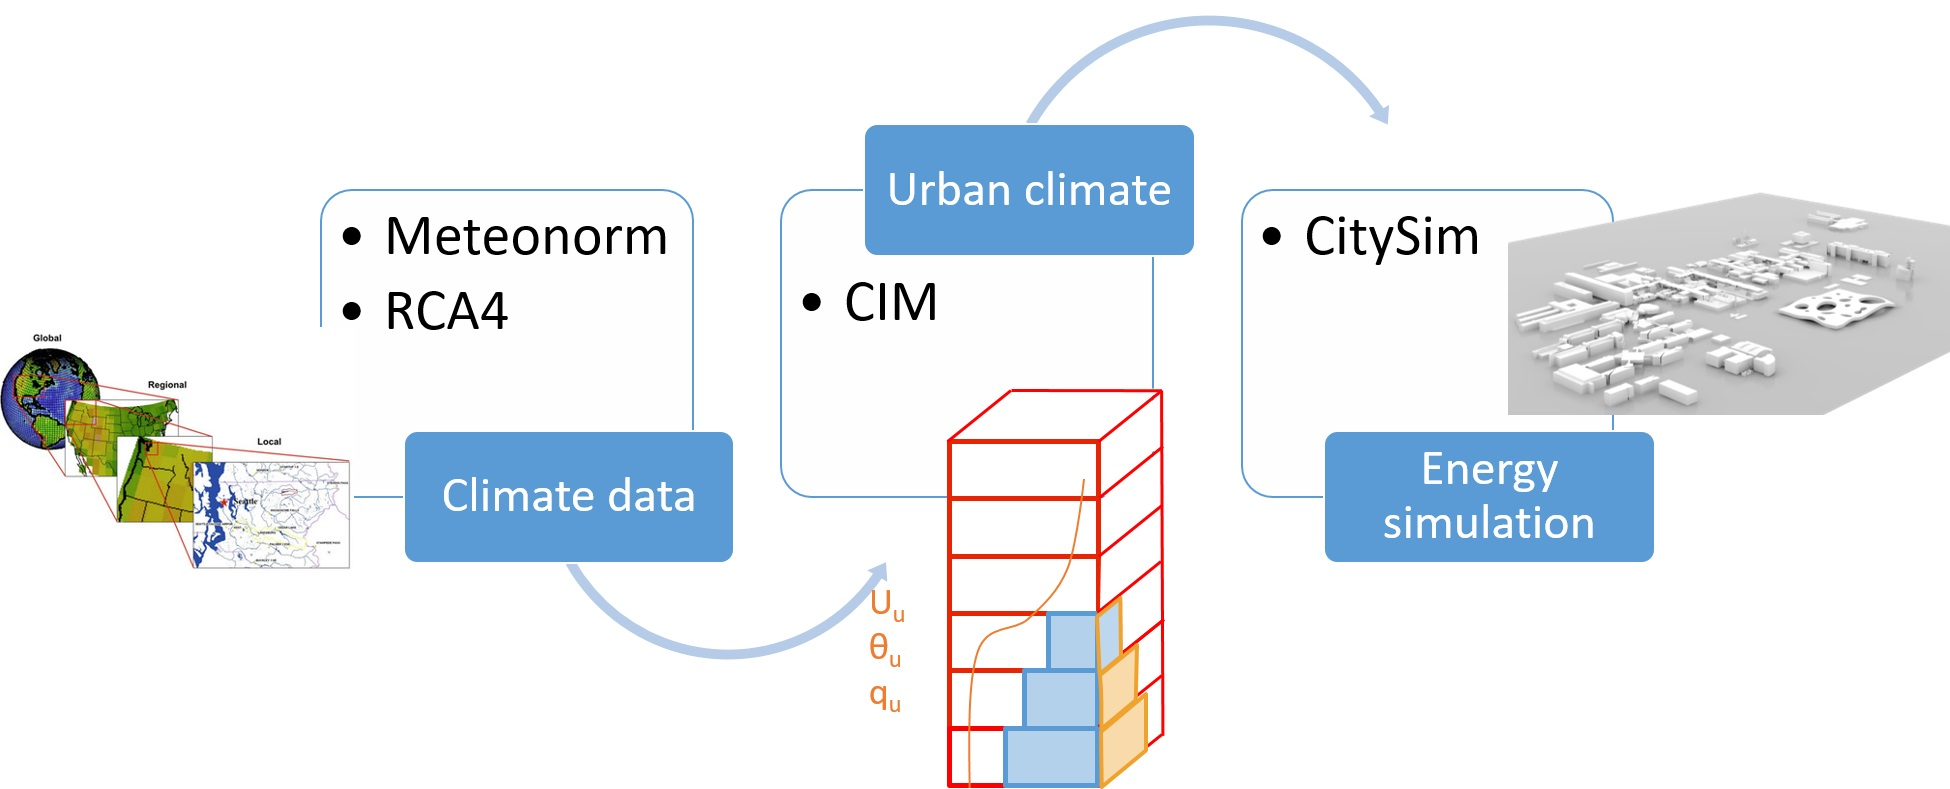
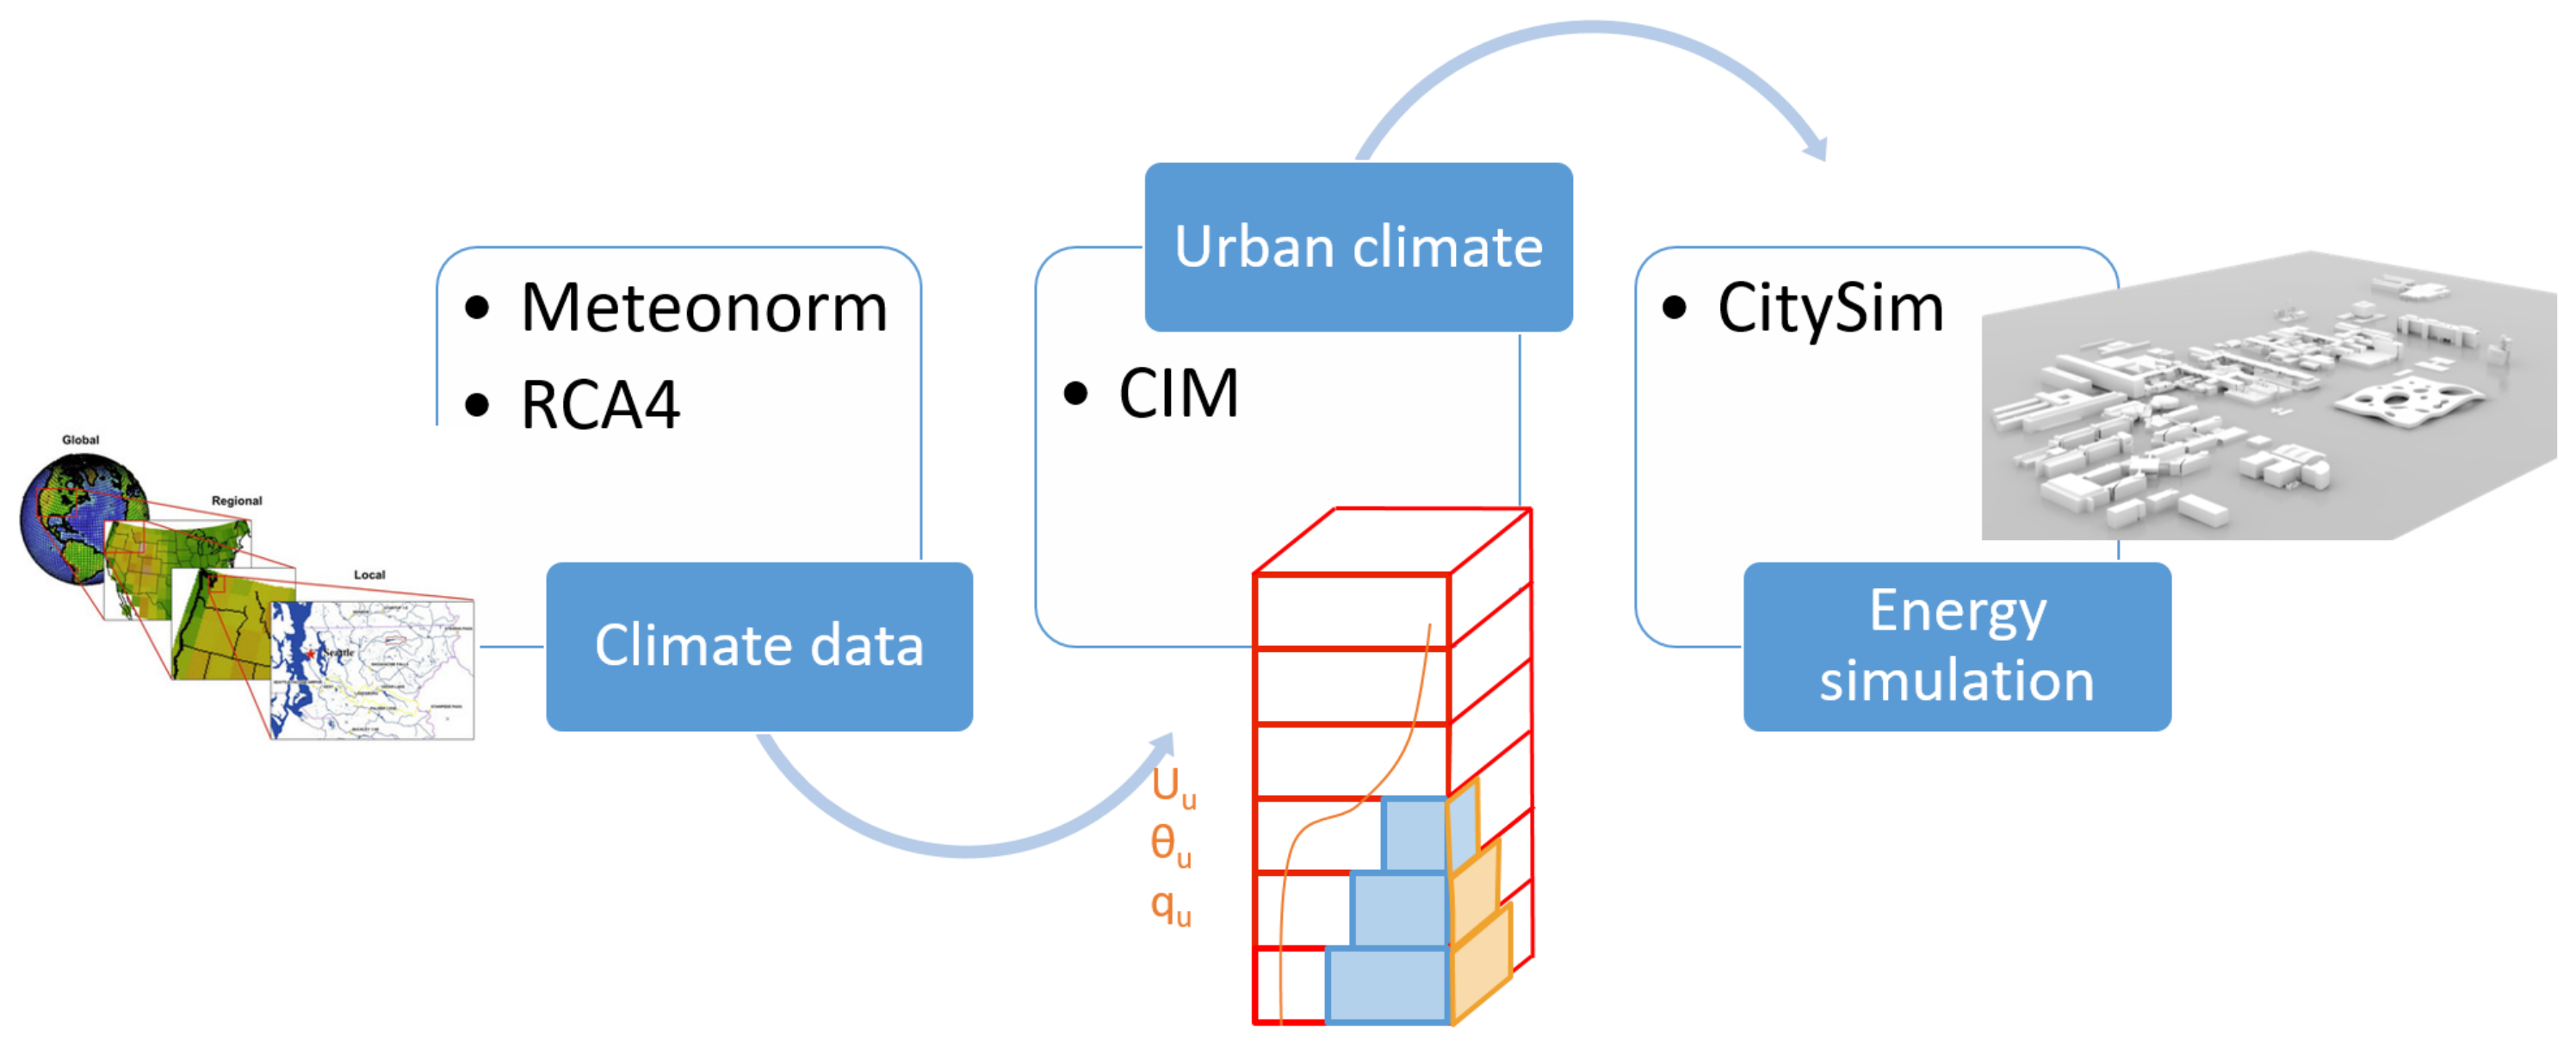
1.2. Urban Simulation Workflows for Climate Change
2. Materials and Methods
2.1. Preparation of Climate Files for Future Scenarios
2.2. CIM
2.3. CitySim
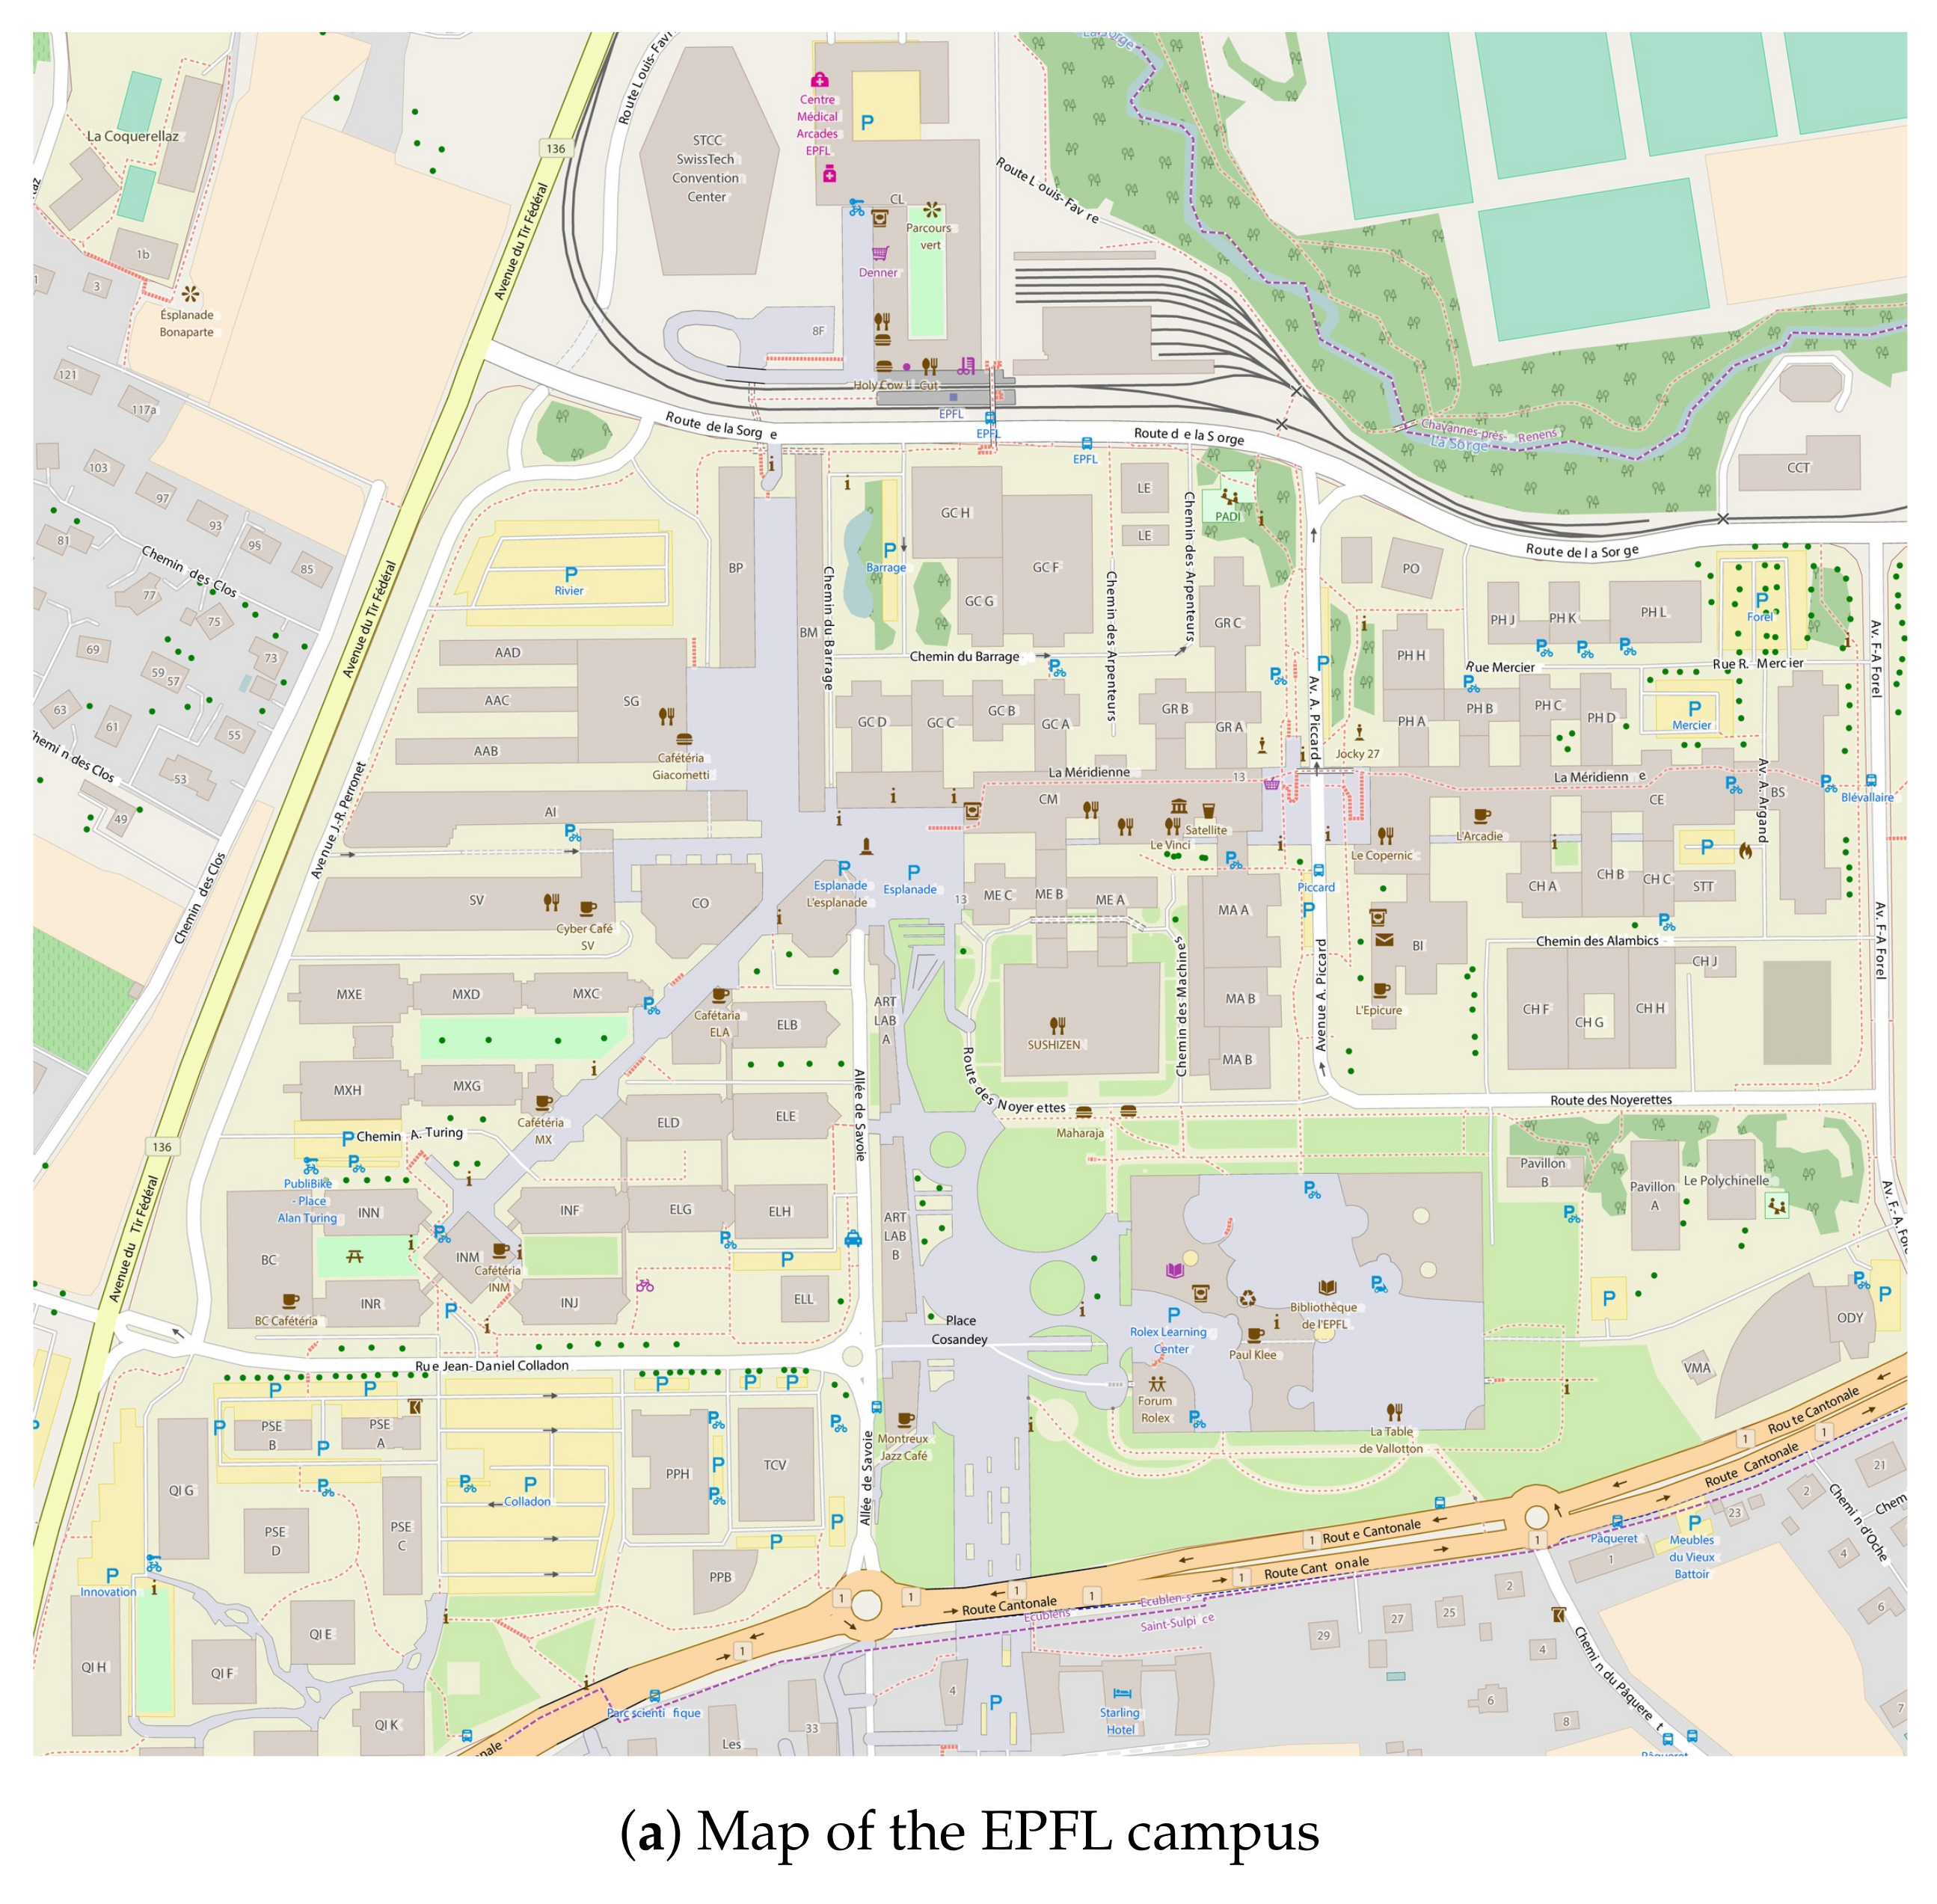
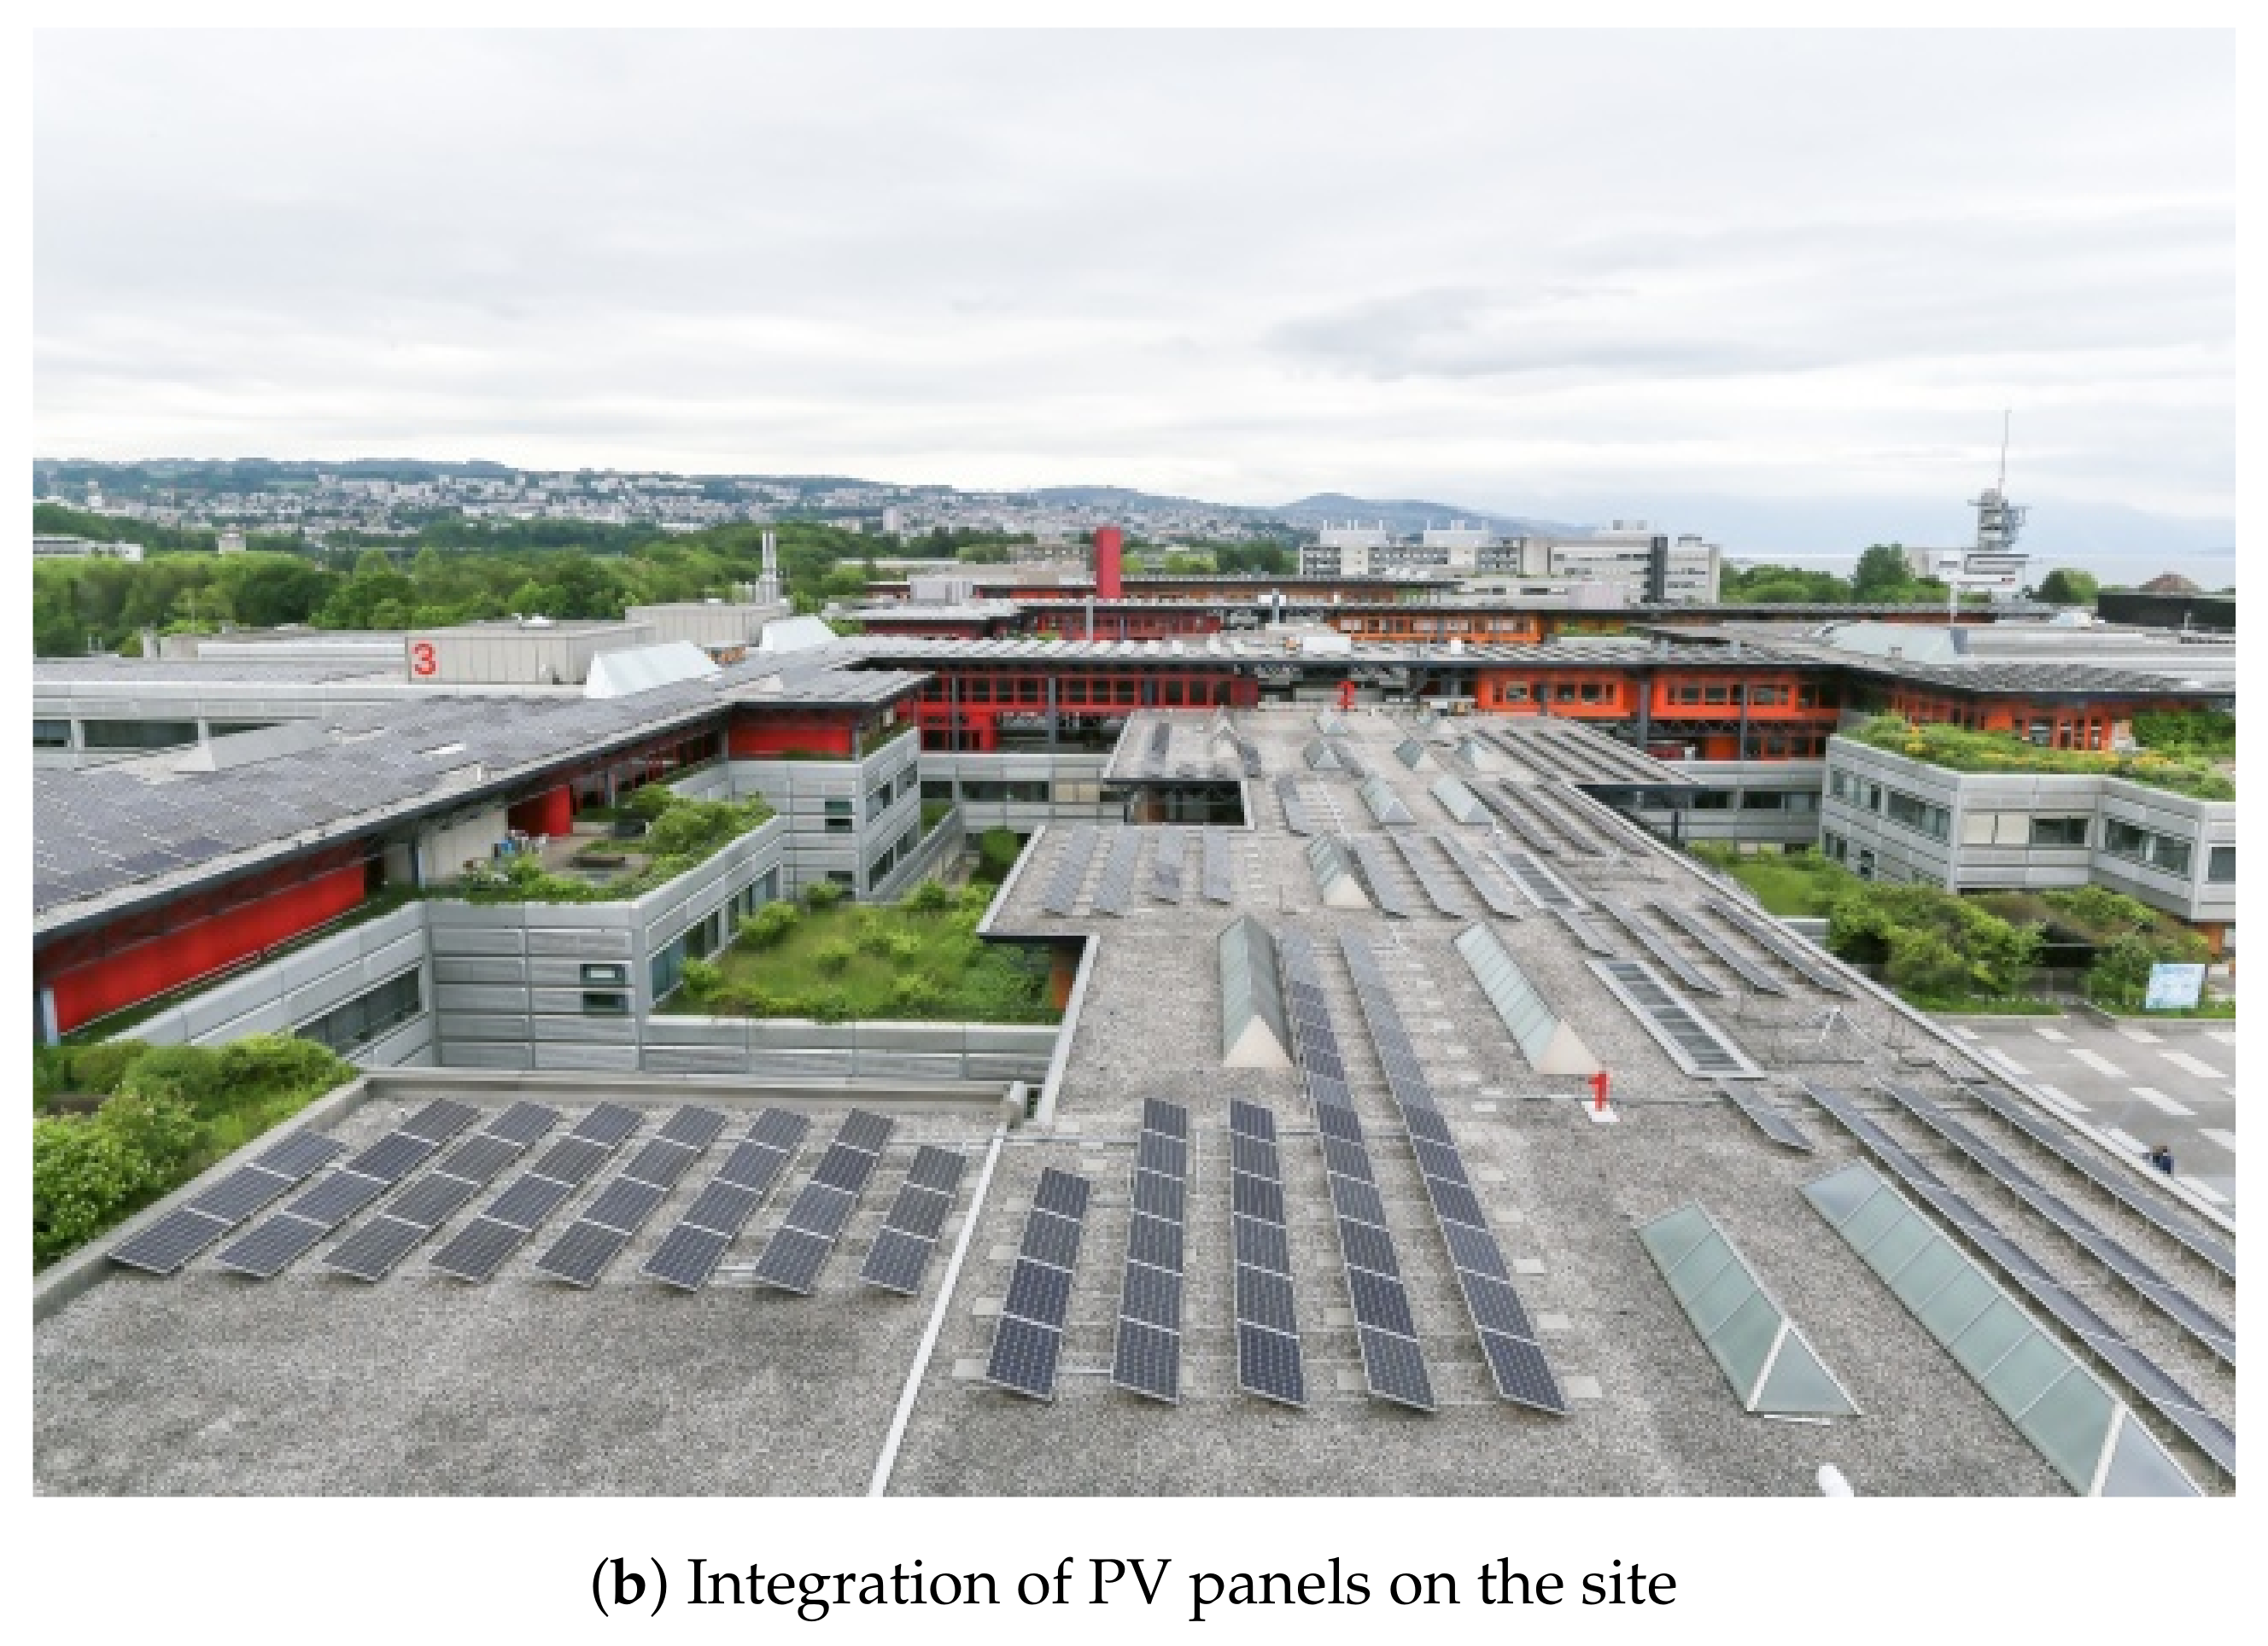
2.4. Study Case
2.5. Renovation Scenarios
3. Results
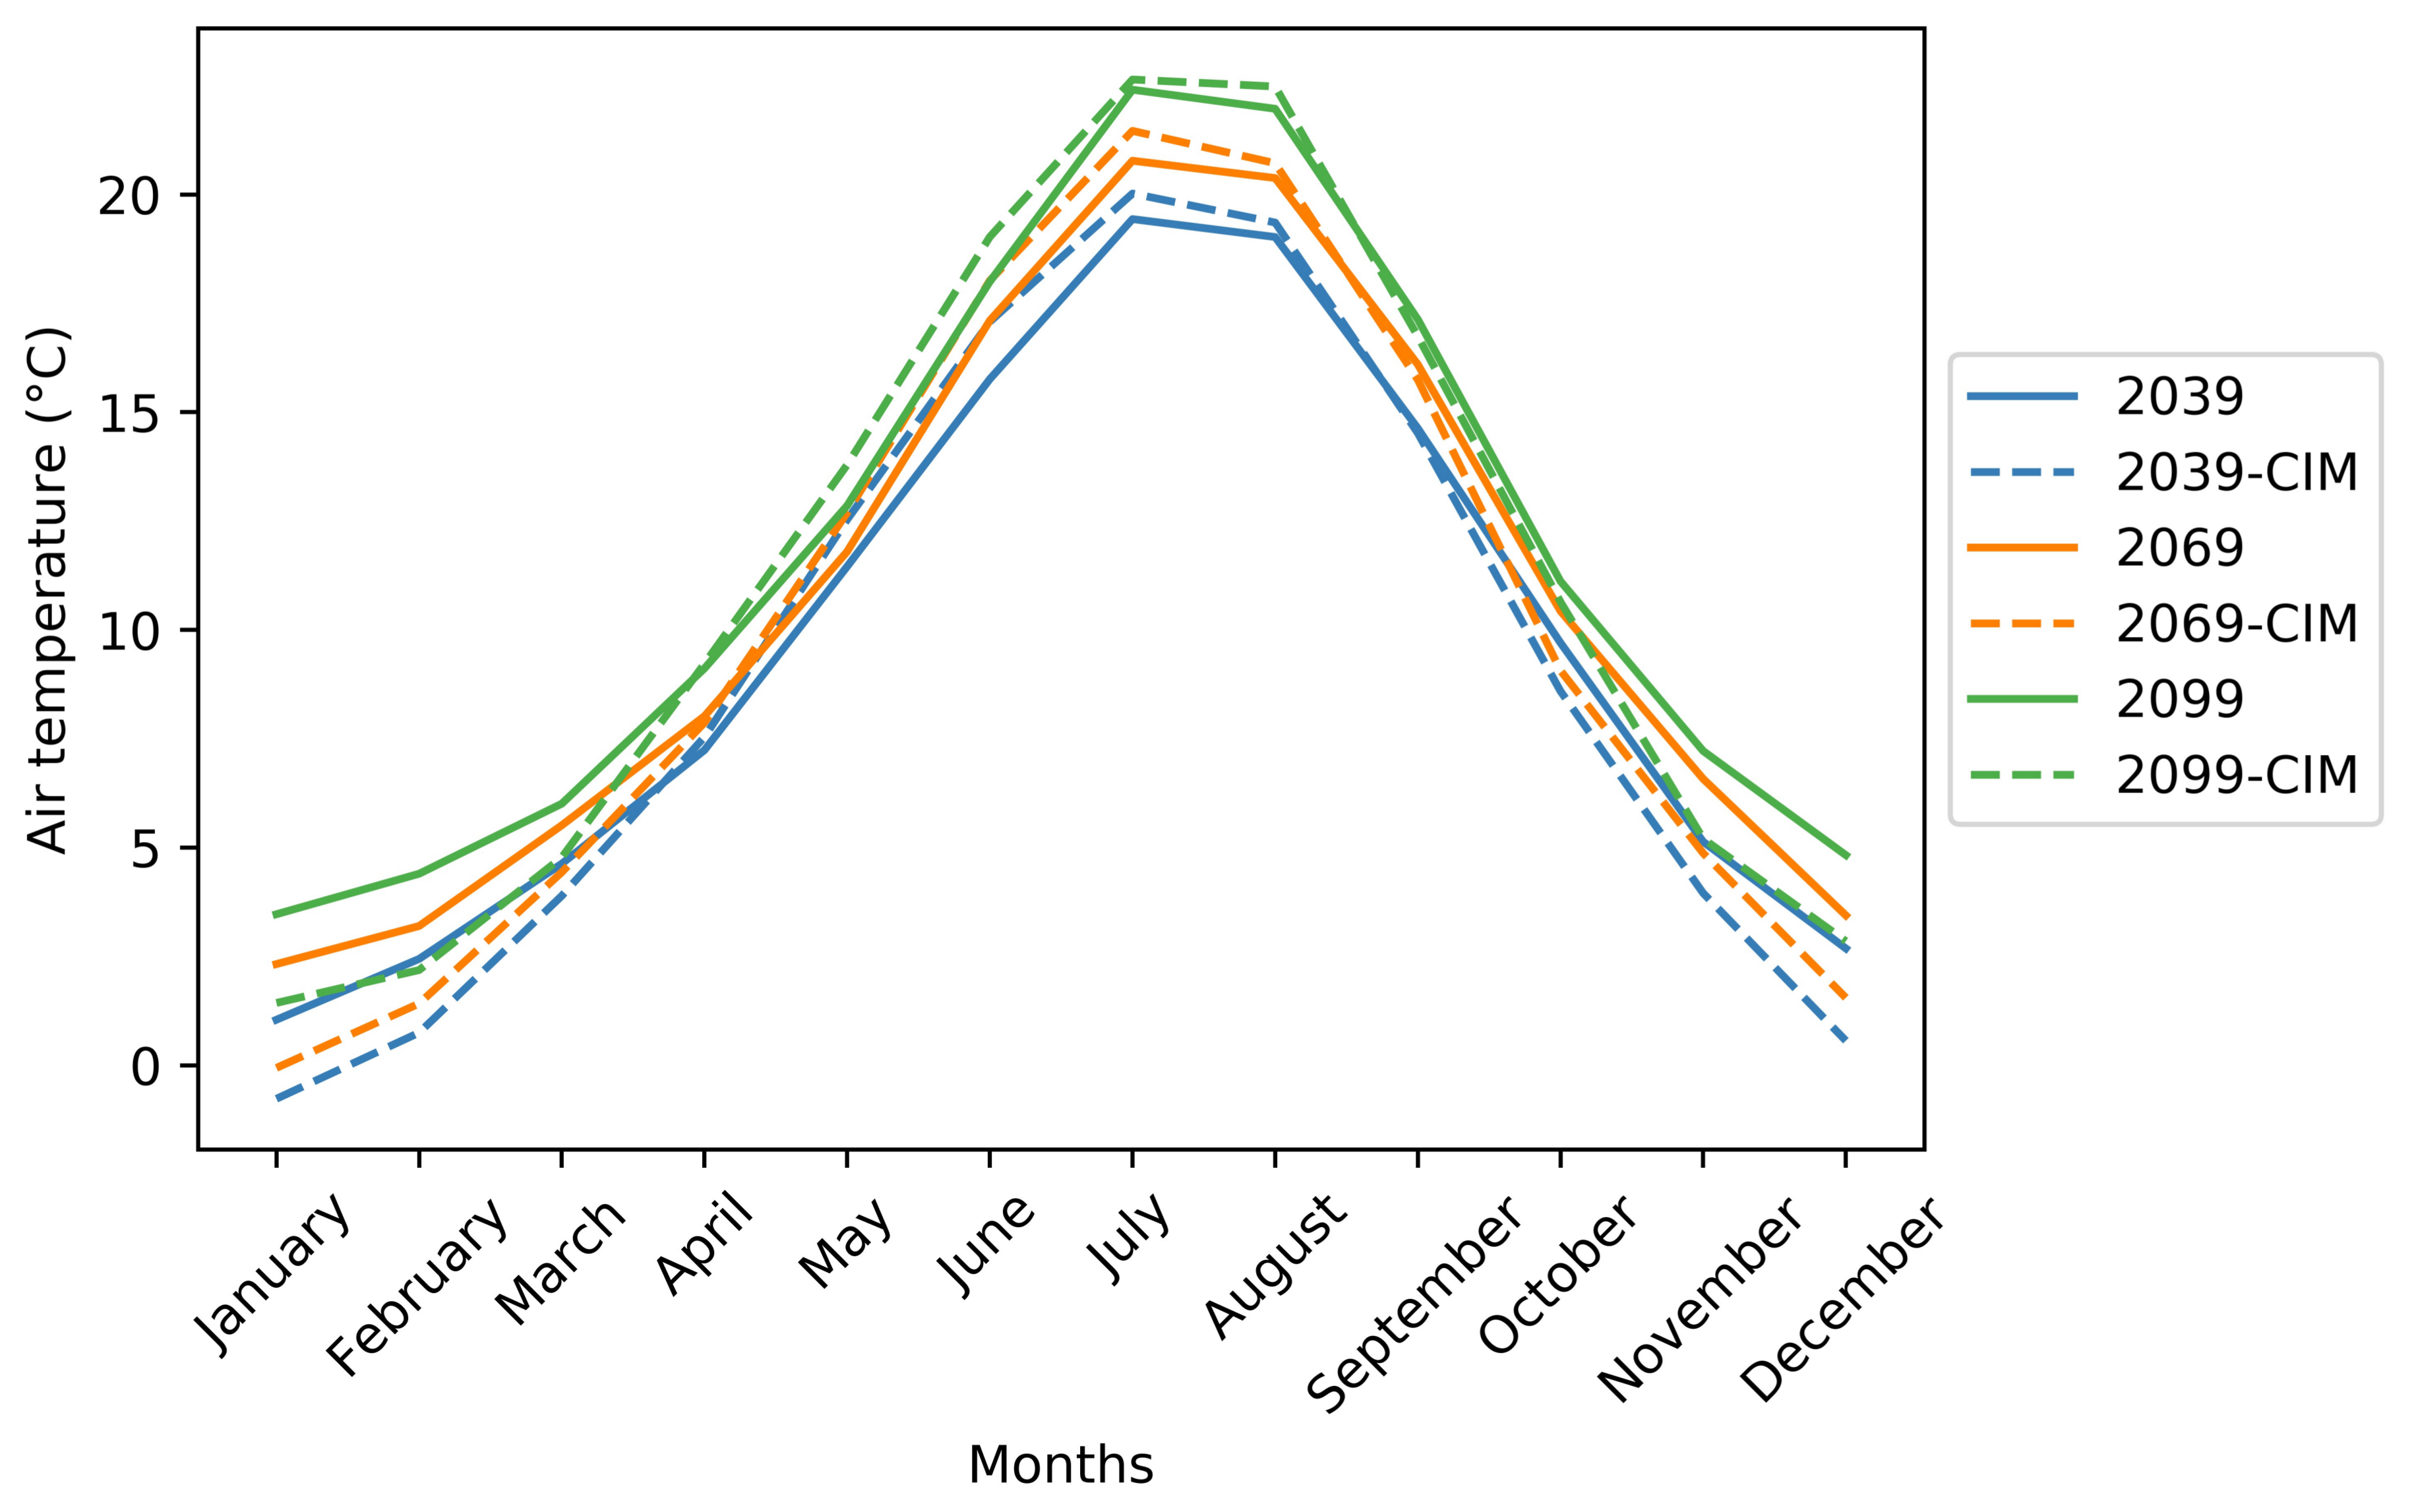
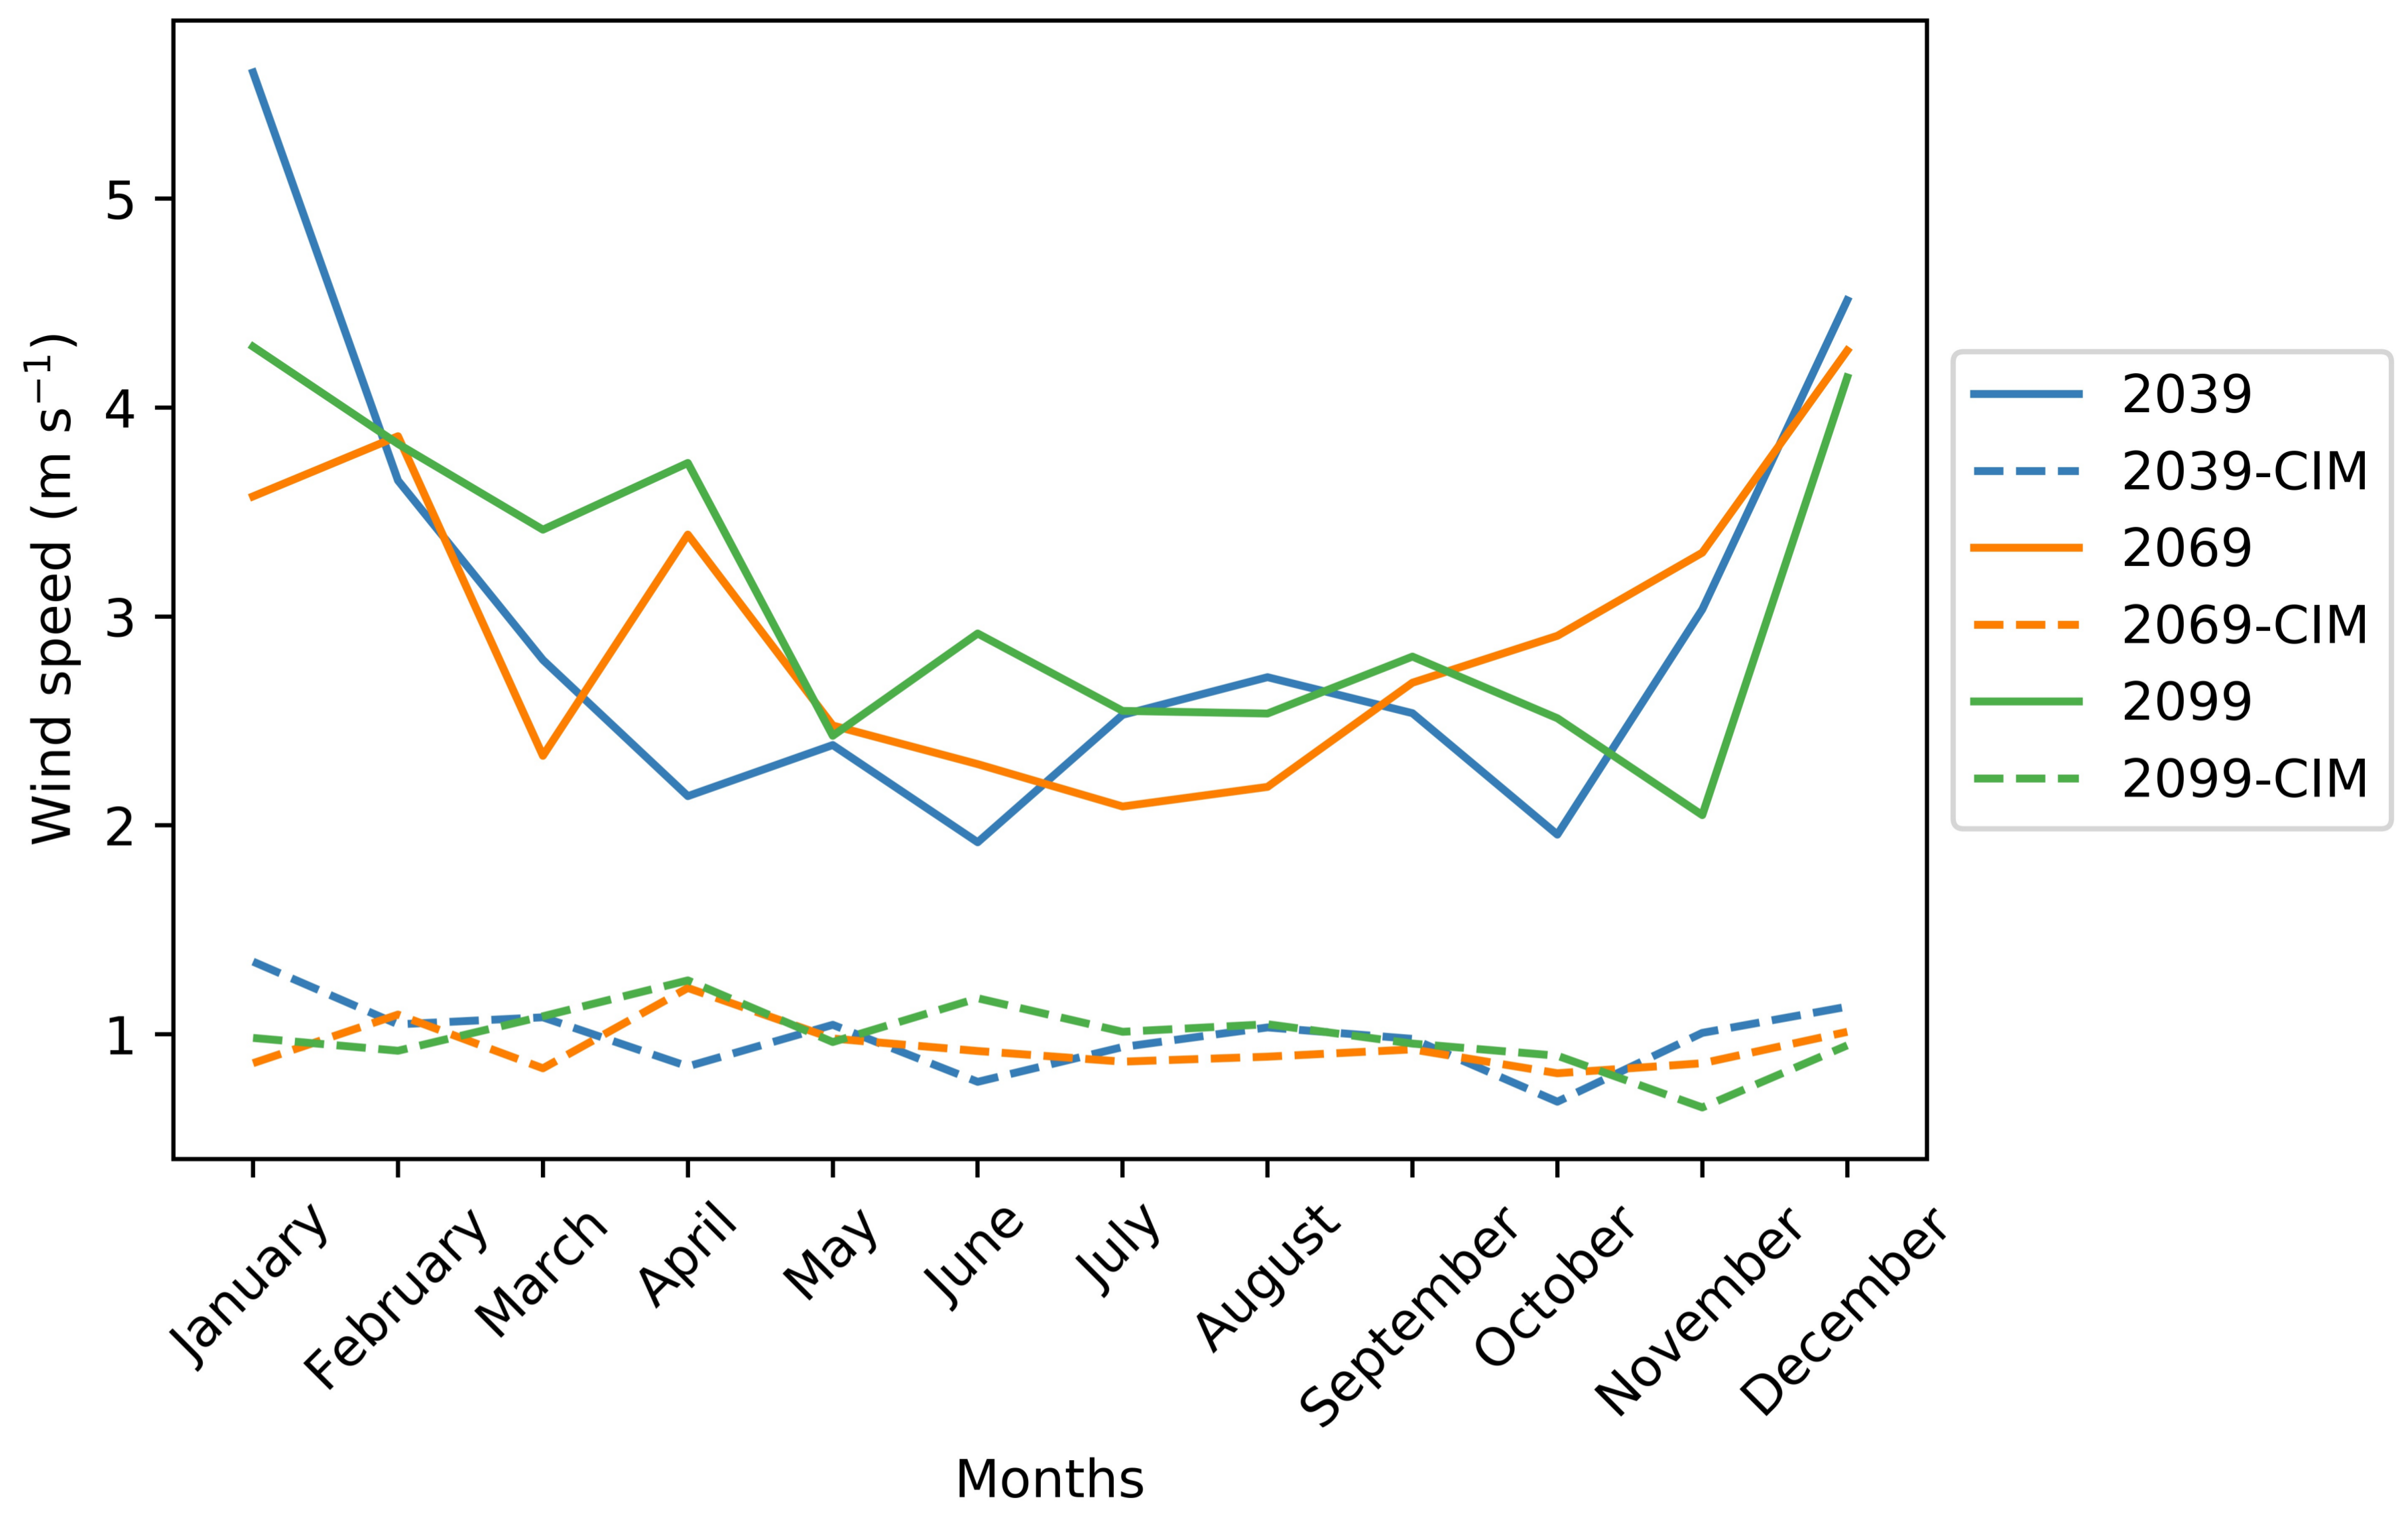
3.1. Analysis of the Future Climate in an Urban Context
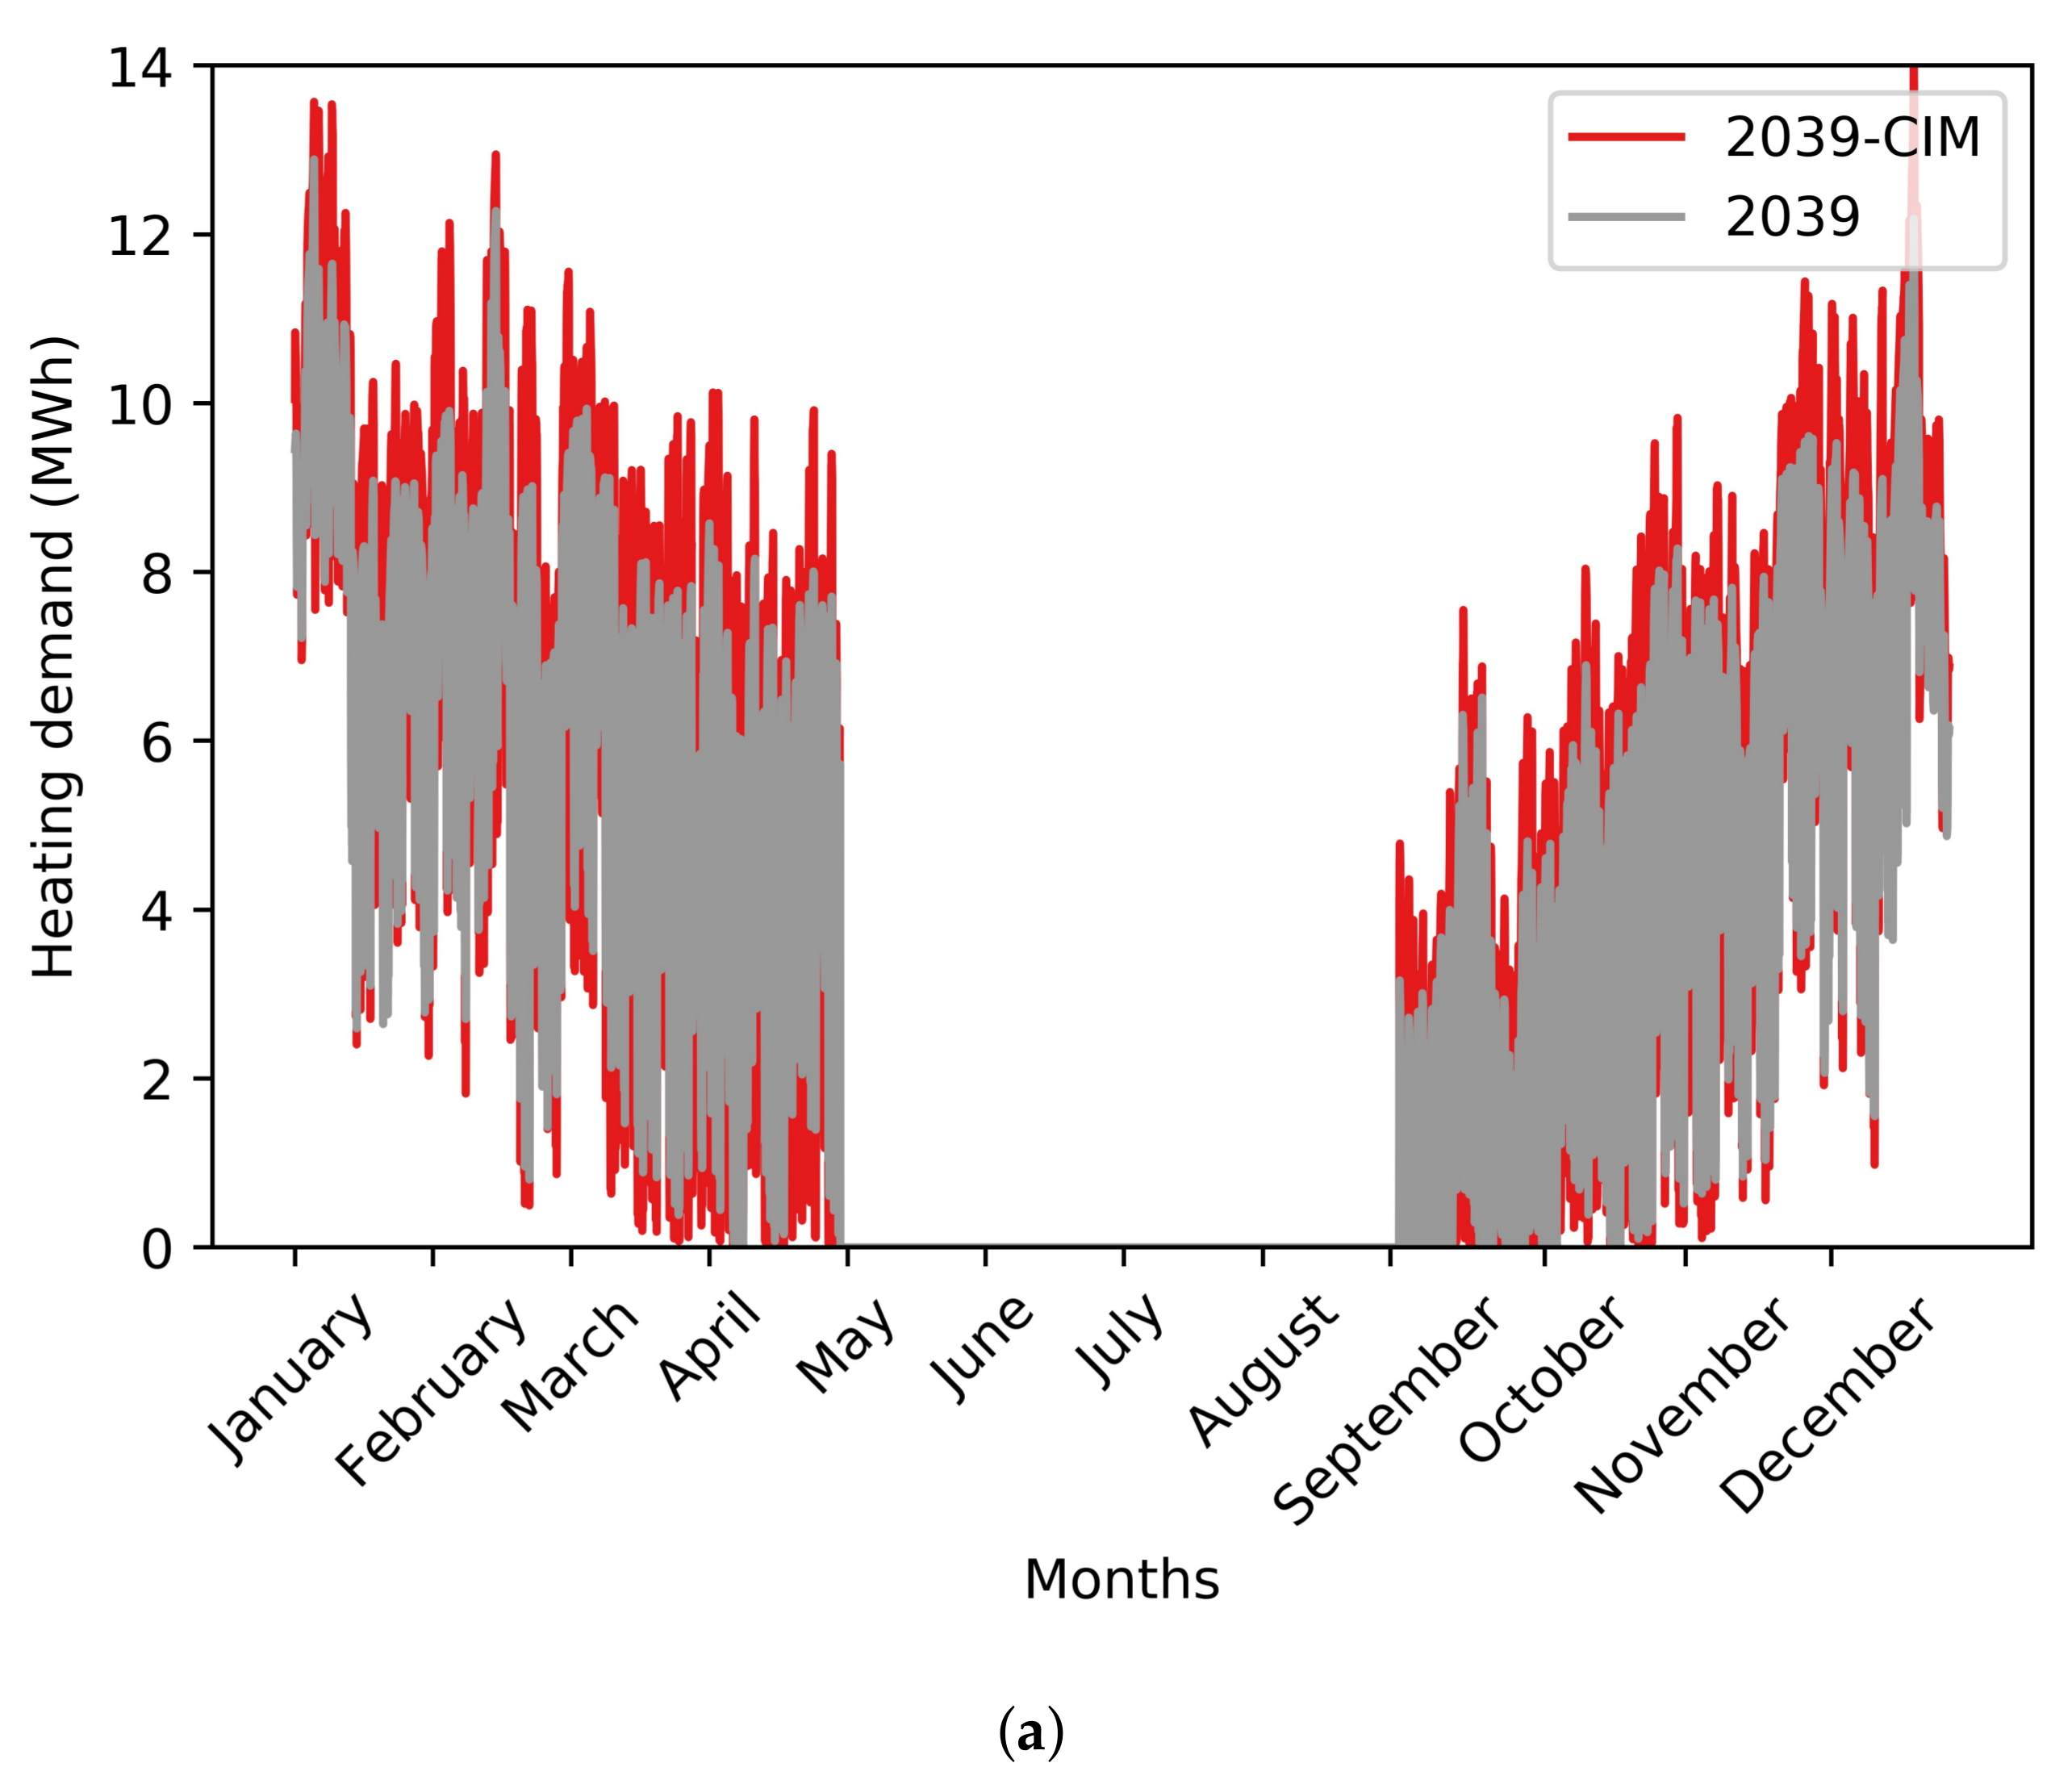
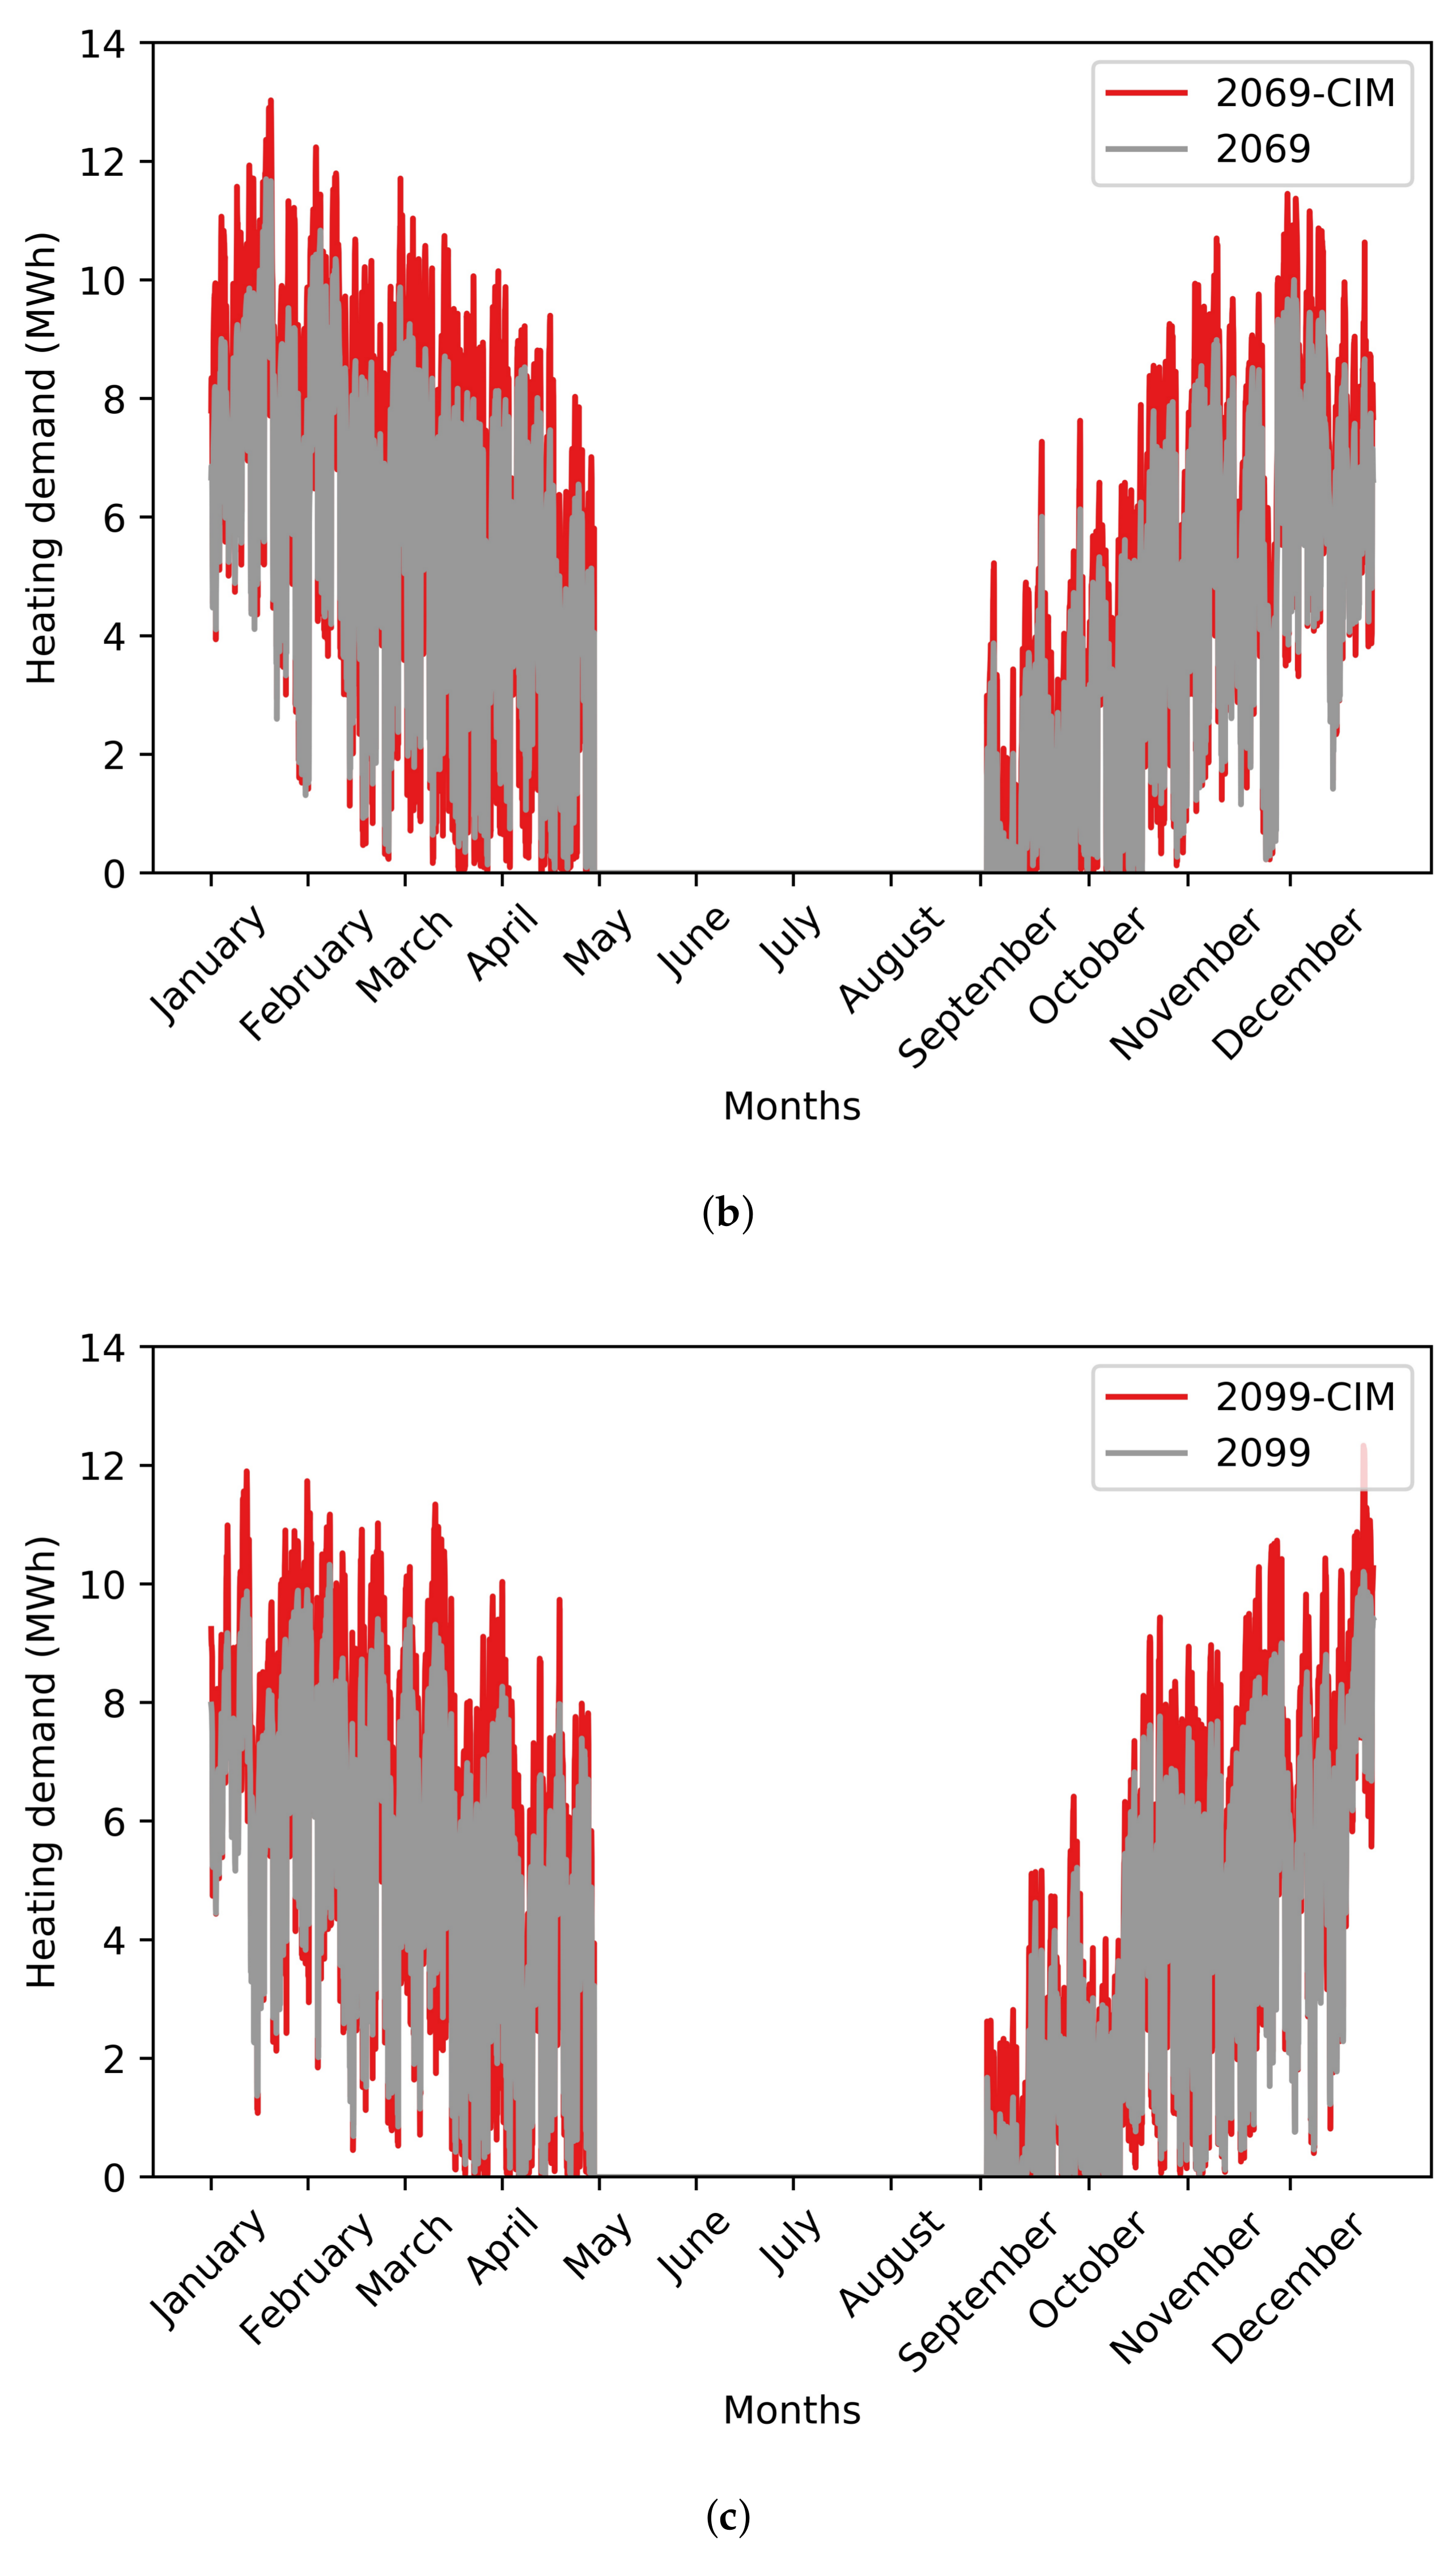
3.2. Energy Consumption for the EPFL Campus
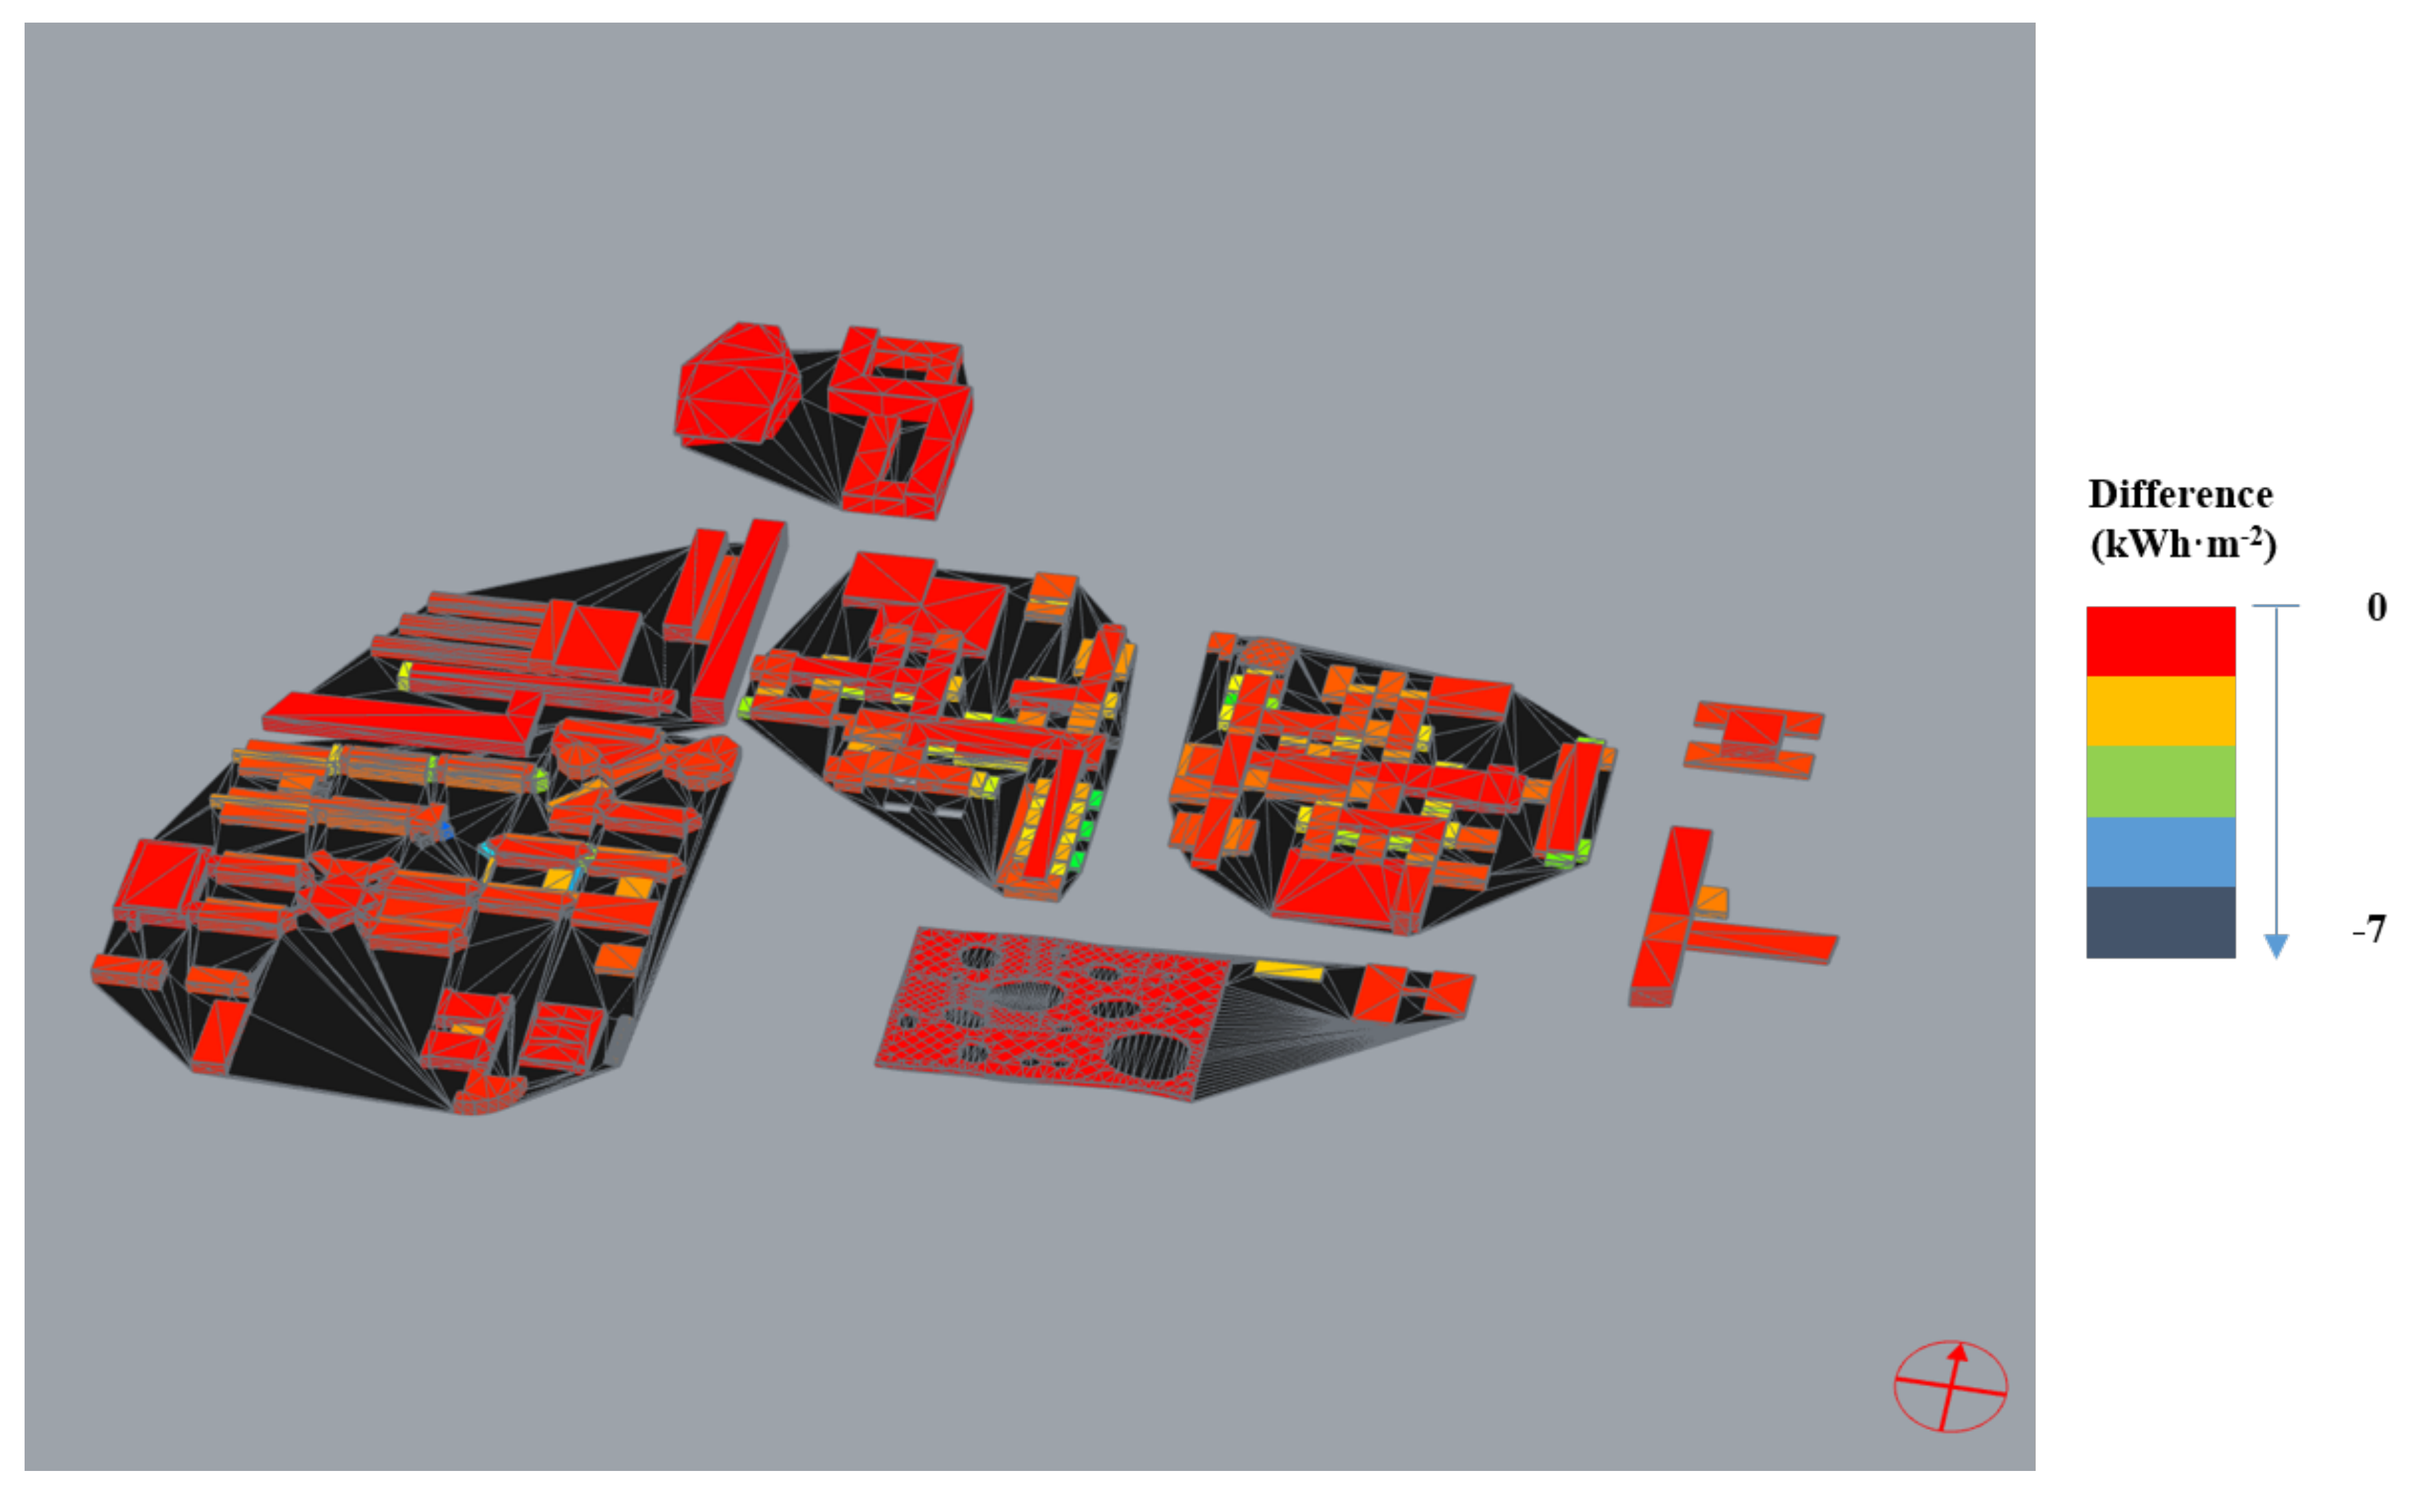
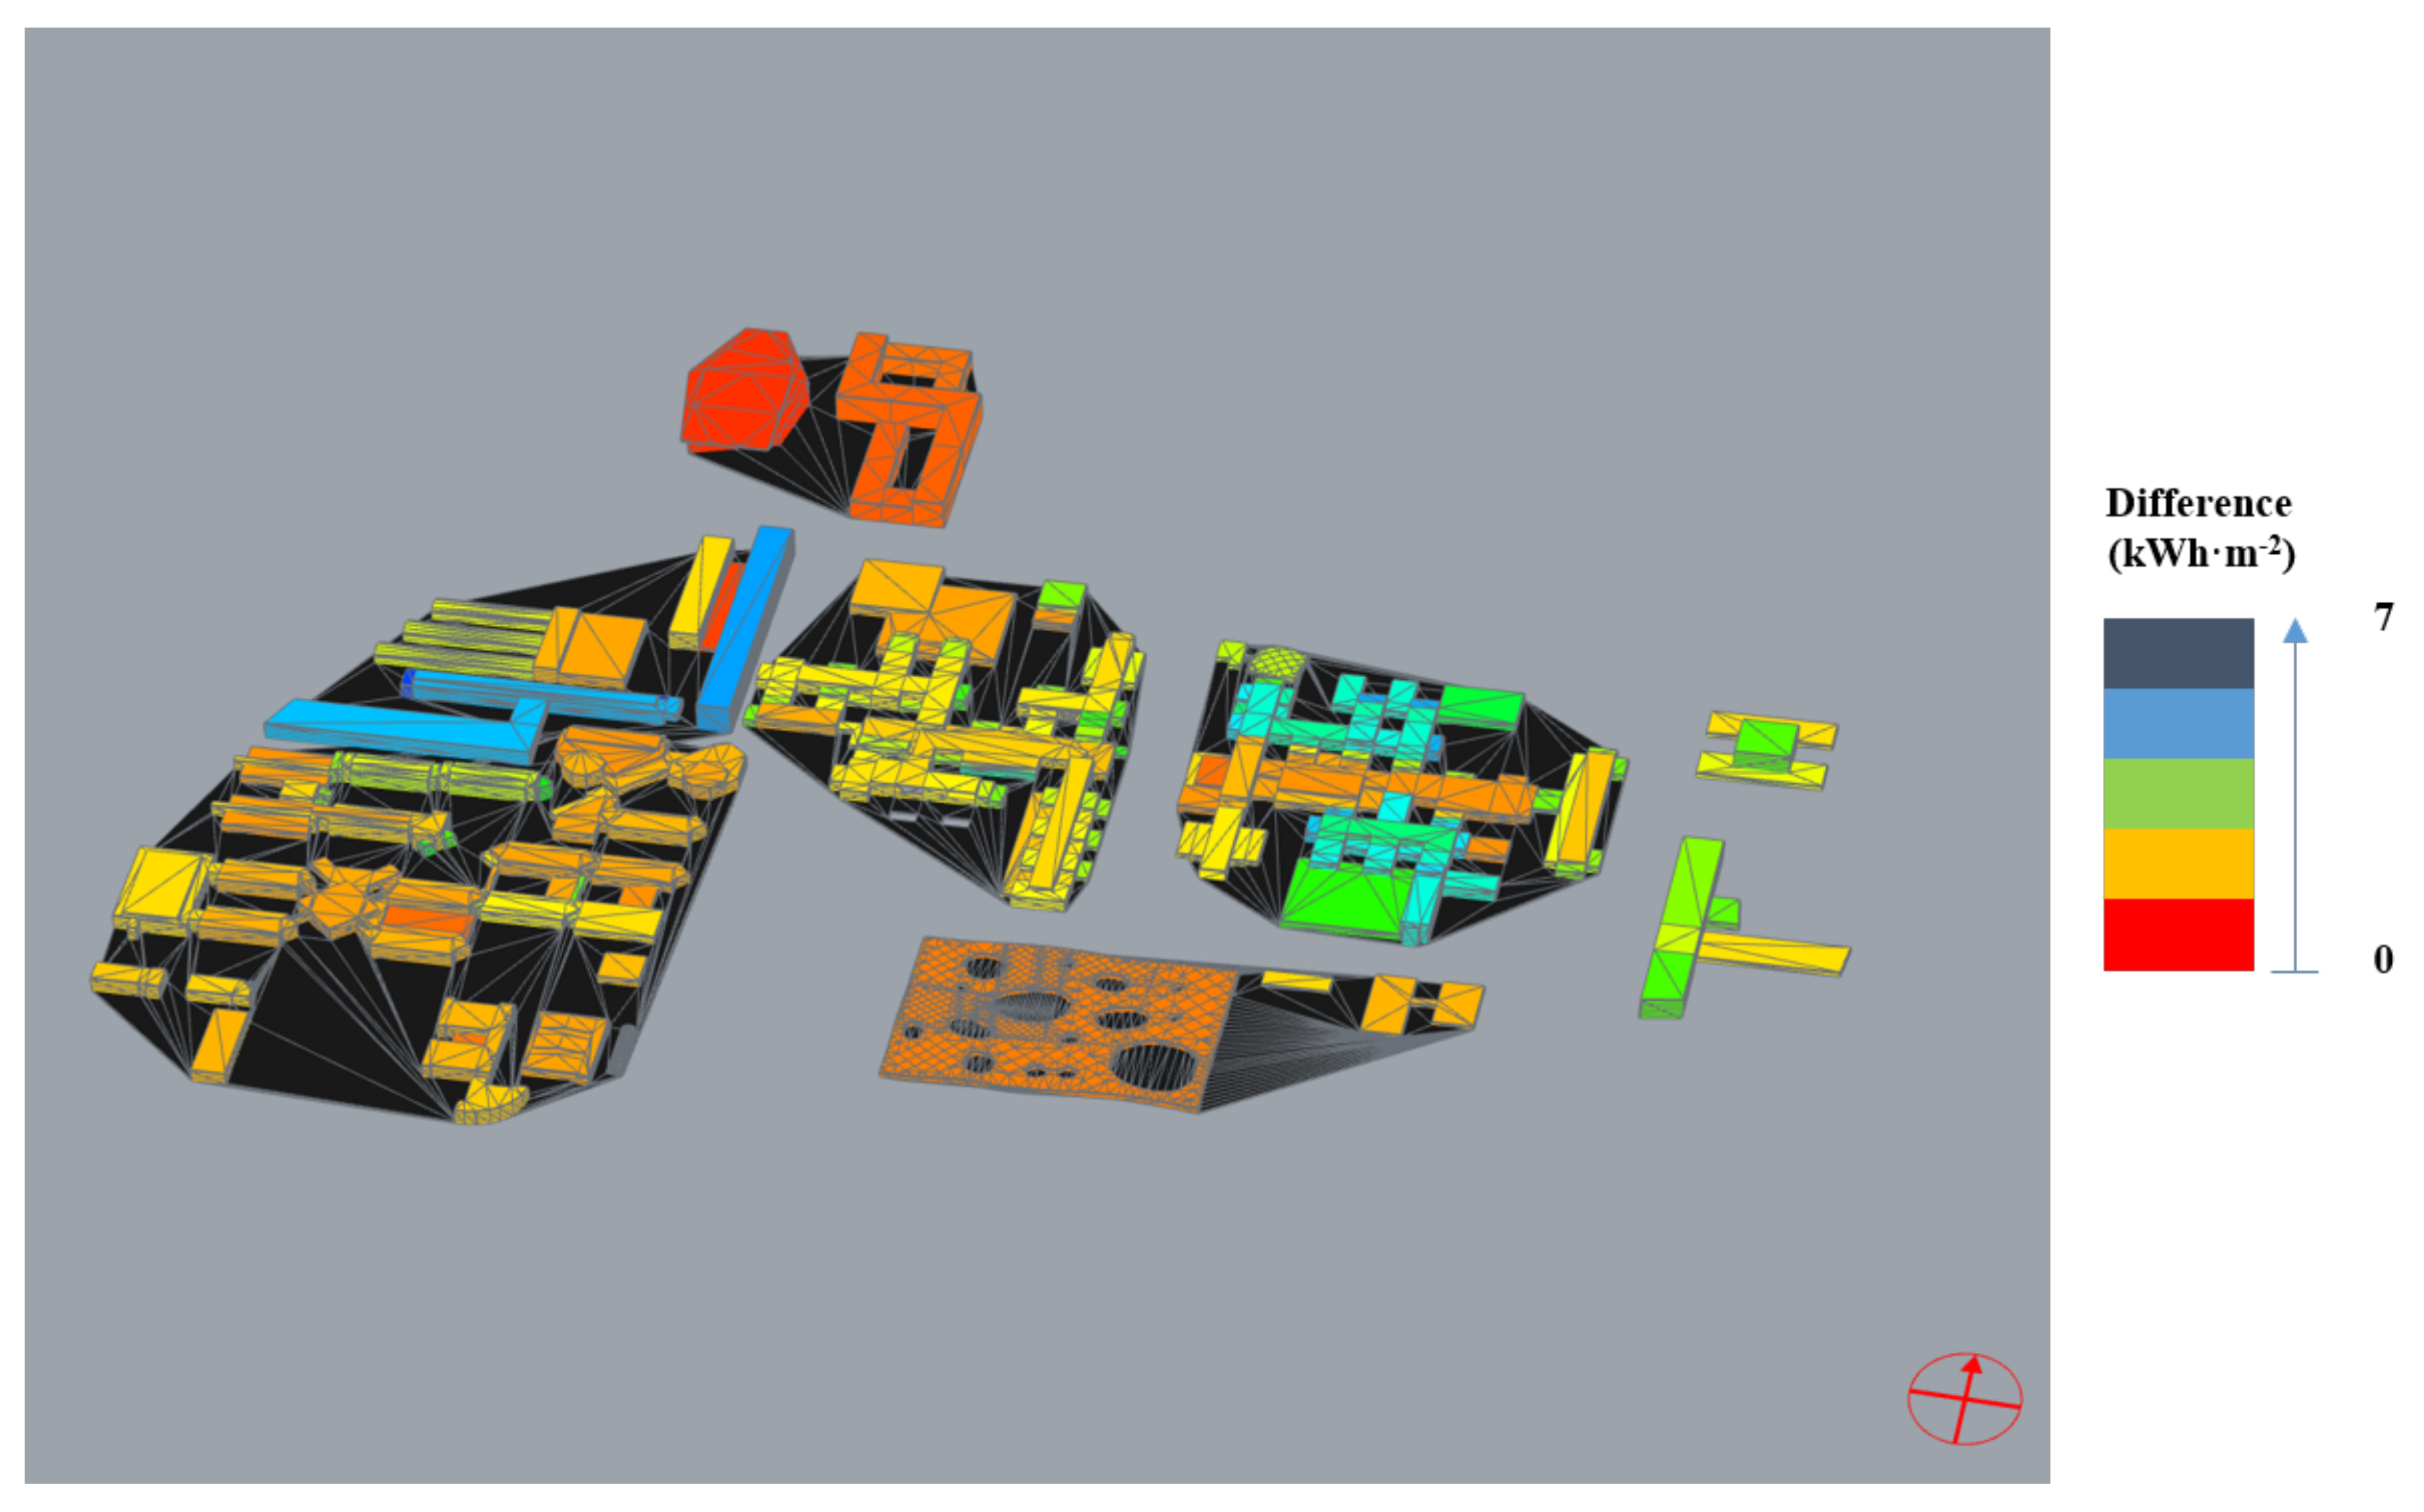
3.3. Renovation Scenario
4. Discussions and Conclusions
4.1. Impact of Considering the Urban Microclimate
4.2. Energy System Design
4.3. Improved Urban Design and Future Transition Pathways
4.4. Perspectives
Acknowledgments
Author Contributions
Conflicts of Interest
References
- IPCC. Working Group I Contribution to the IPCC Fifth Assessment Report on Climate Change 2013: The Physical Science Basis; Intergovernmental Panel on Climate Change: Geneva, Switzerland, 2013. [Google Scholar]
- Zhou, Y.; Shepherd, J.M. Atlanta’s urban heat island under extreme heat conditions and potential mitigation strategies. Nat. Hazards 2010, 52, 639–668. [Google Scholar] [CrossRef]
- Li, D.; Bou-Zeid, E.; Oppenheimer, M. The effectiveness of cool and green roofs as urban heat island mitigation strategies. Environ. Res. Lett. 2014, 9, 055002. [Google Scholar] [CrossRef]
- Santamouris, M. Cooling the cities—A review of reflective and green roof mitigation technologies to fight heat island and improve comfort in urban environments. Sol. Energy 2014, 103, 682–703. [Google Scholar] [CrossRef]
- Norton, B.A.; Coutts, A.M.; Livesley, S.J.; Harris, R.J.; Hunter, A.M.; Williams, N.S.G. Planning for cooler cities: A framework to prioritise green infrastructure to mitigate high temperatures in urban landscapes. Landsc. Urban Plan. 2015, 134, 127–138. [Google Scholar] [CrossRef]
- Sharma, A.; Conry, P.; Fernando, H.J.S.; Hamlet, A.F.; Hellmann, J.J.; Chen, F. Green and cool roofs to mitigate urban heat island effects in the Chicago metropolitan area: Evaluation with a regional climate model. Environ. Res. Lett. 2016, 11, 064004. [Google Scholar] [CrossRef]
- Georgescu, M.; Morefield, P.E.; Bierwagen, B.G.; Weaver, C.P. Urban adaptation can roll back warming of emerging megapolitan regions. Proc. Natl. Acad. Sci. USA 2014, 111, 2909–2914. [Google Scholar] [CrossRef] [PubMed]
- Masson, V.; Marchadier, C.; Adolphe, L.; Aguejdad, R.; Avner, P.; Bonhomme, M.; Bretagne, G.; Briottet, X.; Bueno, B.; de Munck, C.; et al. Adapting cities to climate change: A systemic modeling approach. Urban Clim. 2014, 10, 407–429. [Google Scholar] [CrossRef]
- Frank, T. Climate change impacts on building heating and cooling energy demand in Switzerland. Energy Build. 2015, 37, 1175–1185. [Google Scholar] [CrossRef]
- Christenson, M.; Manz, H.; Gyalistras, D. Climate warming impact on degree-days and building energy demand in Switzerland. Energy Convers. Manag. 2006, 47, 671–686. [Google Scholar] [CrossRef]
- Santamouris, M.; Papanikolaou, N.; Livada, I.; Koronakis, I.; Georgakis, C.; Argiriou, A.; Assimakopoulos, D. On the impact of urban climate on the energy consumption of buildings. Sol. Energy 2001, 70, 201–216. [Google Scholar] [CrossRef]
- Mauree, D.; Coccolo, S.; Kämpf, J.; Scartezzini, J.L. Multi-scale modeling to assess human comfort in urban canyons. In Expanding Boundaries—Systems Thinking in the Built Environment, Proceedings of the Sustainable Built Environment (SBE) Regional Conference, Zurich, Switzerland, 15–17 June 2016; vdf Hochschulverlag AG ETH Zurich: Zurich, Switzerland, 2016. [Google Scholar]
- Coccolo, S.; Mauree, D.; Naboni, E.; Kaempf, J.; Scartezzini, J.L. On the impact of the wind speed on the outdoor human comfort: A sensitivity analysis. Energy Procedia 2017, 122, 481–486. [Google Scholar] [CrossRef]
- Alonso, C.; Martín-Consuegra, F.; Oteiza, I.; Asensio, E.; Pérez, G.; Martínez, I.; Frutos, B. Effect of façade surface finish on building energy rehabilitation. Sol. Energy 2017, 146, 470–483. [Google Scholar] [CrossRef]
- Nik, V.M.; Sasic Kalagasidis, A.; Kjellström, E. Assessment of hygrothermal performance and mould growth risk in ventilated attics in respect to possible climate changes in Sweden. Build. Environ. 2012, 55, 96–109. [Google Scholar] [CrossRef]
- Nik, V.M.; Sasic Kalagasidis, A. Impact study of the climate change on the energy performance of the building stock in Stockholm considering four climate uncertainties. Build. Environ. 2013, 60, 291–304. [Google Scholar] [CrossRef]
- Dirks, J.A.; Gorrissen, W.J.; Hathaway, J.H.; Skorski, D.C.; Scott, M.J.; Pulsipher, T.C.; Huang, M.; Liu, Y.; Rice, J.S. Impacts of climate change on energy consumption and peak demand in buildings: A detailed regional approach. Energy 2015, 79, 20–32. [Google Scholar] [CrossRef]
- Mauree, D.; Perera, A.T.D.; Scartezzini, J.L. Influence of Buildings Configuration on the Energy Demand and Sizing of Energy Systems in an Urban Context. Energy Procedia 2017, 142, 2648–2654. [Google Scholar] [CrossRef]
- Perera, A.T.D.; Nik, V.M.; Mauree, D.; Scartezzini, J.L. An integrated approach to design site specific distributed electrical hubs combining optimization, multi-criterion assessment and decision making. Energy 2017, 134, 103–120. [Google Scholar] [CrossRef]
- De Wilde, P.; Coley, D. The implications of a changing climate for buildings. Build. Environ. 2012, 55, 1–7. [Google Scholar] [CrossRef]
- Nik, V. Hygrothermal Simulations of Buildings Concerning Uncertainties of the Future Climate. Ph.D. Thesis, Chalmers University of Technology, Göteborg, Sweden, 2012. [Google Scholar]
- Braun, M.R.; Beck, S.B.M.; Walton, P.; Mayfield, M. Estimating the impact of climate change and local operational procedures on the energy use in several supermarkets throughout Great Britain. Energy Build. 2016, 111, 109–119. [Google Scholar] [CrossRef]
- Chow, D.H.C.; Li, Z.; Darkwa, J. The effectiveness of retrofitting existing public buildings in face of future climate change in the hot summer cold winter region of China. Energy Build. 2013, 57, 176–186. [Google Scholar] [CrossRef]
- Nik, V.M.; Mata, E.; Sasic Kalagasidis, A.; Scartezzini, J.L. Effective and robust energy retrofitting measures for future climatic conditions—Reduced heating demand of Swedish households. Energy Build. 2016, 121, 176–187. [Google Scholar] [CrossRef]
- Sehizadeh, A.; Ge, H. Impact of future climates on the durability of typical residential wall assemblies retrofitted to the PassiveHaus for the Eastern Canada region. Build. Environ. 2016, 97, 111–125. [Google Scholar] [CrossRef]
- Reid, J.; Garvin, S. Wind Driven Rain: Assessment of the Need for New Guidance; BRE Scotland-Scottish Enterprise Technology Park A, 2011; 1533015. Available online: http://www.gov.scot/resource/0040/00402330.pdf (accessed on 5 April 2018).
- Steenbergen, R.D.J.M.; Koster, T.; Geurts, C.P.W. The effect of climate change and natural variability on wind loading values for buildings. Build. Environ. 2012, 55, 178–186. [Google Scholar] [CrossRef]
- Emmanuel, R.; Krüger, E. Urban heat island and its impact on climate change resilience in a shrinking city: The case of Glasgow, UK. Build. Environ. 2012, 53, 137–149. [Google Scholar] [CrossRef]
- Nik, V.M.; Sasic Kalagasidis, A.; De Wilde, P. Climate Change and Wind-Driven Rain—A Preliminary Study about Climate Uncertainties: Future Build; Lund University Publications: Lund, Sweden, 2013. [Google Scholar]
- Busuioc, A.; Giorgi, F.; Bi, X.; Ionita, M. Comparison of regional climate model and statistical downscaling simulations of different winter precipitation change scenarios over Romania. Theor. Appl. Climatol. 2006, 86, 101–123. [Google Scholar] [CrossRef]
- Cioffi, F.; Conticello, F.; Lall, U.; Marotta, L.; Telesca, V. Large scale climate and rainfall seasonality in a Mediterranean Area: Insights from a non-homogeneous Markov model applied to the Agro-Pontino plain. Hydrol. Process. 2006, 31, 668–686. [Google Scholar] [CrossRef]
- Diaz-Pacheco, J.; Gutiérrez, J. Exploring the limitations of CORINE Land Cover for monitoring urban land-use dynamics in metropolitan areas. J. Land Use Sci. 2014, 9, 243–259. [Google Scholar] [CrossRef]
- Giorgio, G.; Ragosta, M.; Telesca, V. Climate Variability and Industrial-Suburban Heat Environment in a Mediterranean Area. Sustainability 2017, 9, 775. [Google Scholar] [CrossRef]
- Shen, H.; Leblanc, M.; Frappart, F.; Seoane, L.; O’Grady, D.; Olioso, A.; Tweed, S. A Comparative Study of GRACE with Continental Evapotranspiration Estimates in Australian Semi-Arid and Arid Basins: Sensitivity to Climate Variability and Extremes. Sustainability 2017, 9, 614. [Google Scholar] [CrossRef]
- Skamarock, W.C.; Klemp, J.B.; Dudhia, J.; Gill, D.O.; Barker, D.M.; Duda, M.G.; Huang, X.H.; Wang, W.; Powers, J.G. A Description of the Advanced Research WRF Version 3; NCAR Tech. Note NCAR/TN-475+STR; Mesoscale and Microscale Meteorology Division National Center for Atmospheric Research: Boulder, CO, USA, 2008; 113p. [Google Scholar]
- Lafore, J.; Stein, J.; Asencio, N.; Bougeault, P.; Ducrocq, V.; Duron, J.; Fischer, C.; Héreil, P.; Mascart, P.; Masson, V.; et al. The Meso-NH Atmospheric Simulation System. Part I: Adiabatic formulation and control simulations. Ann. Geophys. 1997, 16, 90–109. [Google Scholar] [CrossRef]
- Martilli, A.; Clappier, A.; Rotach, M.W. An Urban Surface Exchange Parameterisation for Mesoscale Models. Bound.-Layer Meteorol. 2002, 104, 261–304. [Google Scholar] [CrossRef]
- Krpo, A.; Salamanca, F.; Martilli, A.; Clappier, A. On the Impact of Anthropogenic Heat Fluxes on the Urban Boundary Layer: A Two-Dimensional Numerical Study. Bound.-Layer Meteorol. 2010, 136, 105–127. [Google Scholar] [CrossRef]
- Salamanca, F.; Martilli, A.; Tewari, M.; Chen, F. A study of the urban boundary layer using different urban parameterizations and high-resolution urban canopy parameters with WRF. J. Appl. Meteorol. Climatol. 2011, 50, 1107–1128. [Google Scholar] [CrossRef]
- Masson, V. A Physically-Based Scheme for the Urban Energy Budget in Atmospheric Models. Bound.-Layer Meteorol. 2000, 94, 357–397. [Google Scholar] [CrossRef]
- Kusaka, H.; Kondo, H.; Kikegawa, Y.; Kimura, F. A Simple Single-Layer Urban Canopy Model for Atmospheric Models: Comparison with Multi-Layer and Slab Models. Bound.-Layer Meteorol. 2001, 101, 329–358. [Google Scholar] [CrossRef]
- Oke, T.R. The energetic basis of the urban heat island. Q. J. R. Meteorol. Soc. 1982, 108, 1–24. [Google Scholar] [CrossRef]
- Miao, S.; Chen, F.; LeMone, M.A.; Tewari, M.; Li, Q.; Wang, Y. An Observational and Modeling Study of Characteristics of Urban Heat Island and Boundary Layer Structures in Beijing. J. Appl. Meteorol. Climatol. 2009, 48, 484–501. [Google Scholar] [CrossRef]
- Chemel, C.; Sokhi, R.S. Response of London’s Urban Heat Island to a Marine Air Intrusion in an Easterly Wind Regime. Bound.-Layer Meteorol. 2012, 144, 65–81. [Google Scholar] [CrossRef]
- Mauree, D.; Blond, N.; Clappier, A. Multi-scale modeling of the urban meteorology: Integration of a new canopy model in the WRF model. eartharxiv.org 2018. [Google Scholar] [CrossRef]
- Martilli, A. Current research and future challenges in urban mesoscale modeling. Int. J. Climatol. 2007, 27, 1909–1918. [Google Scholar] [CrossRef]
- Robinson, D. Computer Modelling for Sustainable Urban Design: Physical Principles, Methods and Applications; Routledge: Abingdon, UK, 2012. [Google Scholar]
- Bruse, M.; Fleer, H. Simulating surface–plant–air interactions inside urban environments with a three dimensional numerical model. Environ. Model. Softw. 1998, 13, 373–384. [Google Scholar] [CrossRef]
- Salata, F.; Golasi, I.; de Lieto Vollaro, R.; de Lieto Vollaro, A. Urban microclimate and outdoor thermal comfort. A proper procedure to fit ENVI-met simulation outputs to experimental data. Sustain. Cities Soc. 2016, 26, 318–343. [Google Scholar] [CrossRef]
- Martin, M.; Wong, N.H.; Hii, D.J.C.; Ignatius, M. Comparison between simplified and detailed EnergyPlus models coupled with an urban canopy model. Energy Build. 2017, 157, 116–125. [Google Scholar] [CrossRef]
- Palme, M.; Inostroza, L.; Villacreses, G.; Lobato-Cordero, A.; Carrasco, C. From urban climate to energy consumption. Enhancing building performance simulation by including the urban heat island effect. Energy Build. 2017, 145, 107–120. [Google Scholar] [CrossRef]
- Allegrini, J.; Dorer, V.; Carmeliet, J. Wind tunnel measurements of buoyant flows in street canyons. Build. Environ. 2013, 59, 315–326. [Google Scholar] [CrossRef]
- Dorer, V.; Allegrini, J.; Orehounig, K.; Moonen, P.; Upadhyay, G.; Kämpf, J.; Carmeliet, J. Modelling the urban microclimate and its impact on the energy demand of buildings and building clusters. In Proceedings of the 13th Conference of the International Building Performance Simulation Association, Chambery, France, 26–28 August 2013. [Google Scholar]
- Allegrini, J.; Carmeliet, J. Simulations of local heat islands in Zürich with coupled CFD and building energy models. Urban Clim. 2017. [Google Scholar] [CrossRef]
- Mauree, D. Development of a Multi-Scale Meteorological System to Improve Urban Climate Modeling. Ph.D. Thesis, Université de Strasbourg, Strasbourg, France, 2014. [Google Scholar]
- Mauree, D.; Blond, N.; Kohler, M.; Clappier, A. On the Coherence in the Boundary Layer: Development of a Canopy Interface Model. Front. Earth Sci. 2017, 1. [Google Scholar] [CrossRef]
- Mauree, D.; Coccolo, S.; Kaempf, J.; Scartezzini, J.L. Multi-scale modeling to evaluate building energy consumption at the neighborhood scale. PLoS ONE 2017, 12, e0183437. [Google Scholar] [CrossRef] [PubMed]
- Conry, P.; Sharma, A.; Potosnak, M.J.; Leo, L.S.; Bensman, E.; Hellmann, J.J.; Fernando, H.J.S. Chicago’s Heat Island and Climate Change: Bridging the Scales via Dynamical Downscaling. J. Appl. Meteorol. Climatol. 2015, 54, 1430–1448. [Google Scholar] [CrossRef]
- Mauree, D.; Kämpf, J.H.; Scartezzini, J.L. Multi-scale modeling to improve climate data for building energy models. In Proceedings of the 14th International Conference of the International Building Performance Simulation Association, Hyderabad, India, 6–9 December 2015. [Google Scholar]
- Lim, T.K.; Ignatius, M.; Miguel, M.; Wong, N.H.; Juang, H.M.H. Multi-scale urban system modeling for sustainable planning and design. Build. Environ. 2017, 157, 78–91. [Google Scholar] [CrossRef]
- Nik, V. Climate Simulation of an Attic Using Future Weather Data Sets—Statistical Methods for Data Processing and Analysis. Ph.D. Thesis, Chalmers University of Technology, Gothenburg, Sweden, 2010. [Google Scholar]
- Jentsch, M.F.; James, P.A.B.; Bourikas, L.; Bahaj, A.S. Transforming existing weather data for worldwide locations to enable energy and building performance simulation under future climates. Renew. Energy 2013, 55, 514–524. [Google Scholar] [CrossRef]
- Nik, V.M.; Coccolo, S.; Kämpf, J.; Scartezzini, J.L. Investigating the importance of future climate typology on estimating the energy performance of buildings in the EPFL campus. Energy Procedia 2017, 122, 1087–1092. [Google Scholar] [CrossRef]
- Samuelsson, P.; Gollvik, S.; Kupiainen, M.; Kourzeneva, E.; Berg, V.D.; Jan, W. The Surface Processes of the Rossby Centre Regional Atmospheric Climate Model (RCA4); SMHI: Norrköping, Sweden, 2015. [Google Scholar]
- Nik, V.M. Making energy simulation easier for future climate—Synthesizing typical and extreme weather datasets out of regional climate models (RCMs). Appl. Energy 2016, 177, 204–226. [Google Scholar] [CrossRef]
- Nik, V.M.; Sasic Kalagasidis, A.; Kjellström, E. Statistical methods for assessing and analyzing the building performance in respect to the future climate. Build. Environ. 2012, 53, 107–118. [Google Scholar] [CrossRef]
- Nik, V.M.; Arfvidsson, J. Using Typical and Extreme Weather Files for Impact Assessment of Climate Change on Buildings. Energy Procedia 2017, 132, 616–621. [Google Scholar] [CrossRef]
- Nik, V.M. Application of typical and extreme weather datasets in the hygrothermal simulation of building components for future climate—A case study for a wooden frame wall. Energy Build. 2017, 154, 30–45. [Google Scholar] [CrossRef]
- Robinson, D.; Haldi, F.; Kämpf, J.; Leroux, P.; Perez, D.; Rasheed, A.; Wilke, U. CitySim: Comprehensive micro-simulation of resource flows for sustainable urban planning. In Proceedings of the Eleventh International IBPSA Conference, Glasgow, UK, 27–30 July 2009. [Google Scholar]
- Kämpf, J.H.; Robinson, D. A simplified thermal model to support analysis of urban resource flows. Energy Build. 2007, 39, 445–453. [Google Scholar] [CrossRef]
- Robinson, D.; Stone, A. Solar radiation modeling in the urban context. Sol. Energy 2004, 77, 295–309. [Google Scholar] [CrossRef]
- Remund, J. Quality of Meteonorm Version 6.0. 2008. Available online: https://www.researchgate.net/profile/Jan_Remund/publication/241491372_Quality_of_Meteonorm_Version_60/links/0f31753282b4a2400c000000.pdf (accessed on 5 April 2018).
- Walter, E.; Kämpf, J.H. A verification of CitySim results using the BESTEST and monitored consumption values. In Proceedings of the 2nd Building Simulation Applications Conference, Bolzano, Italy, 4–6 February 2015; pp. 215–222. [Google Scholar]
- Upadhyay, G.; Mauree, D.; Kämpf, J.H.; Scartezzini, J.L. Evapotranspiration model to evaluate the cooling potential in urban areas—A case study in Switzerland. In Proceedings of the 14th International Conference of the International Building Performance Simulation Association, Hyderabad, India, 6–9 December 2015. [Google Scholar]
- Coccolo, S.; Kaempf, J.; Mauree, D.; Scartezzini, J.L. Cooling potential of greening in the urban environment, a step further towards practice. Sustain. Cities Soc. 2018, 38, 543–559. [Google Scholar] [CrossRef]
- Coccolo, S. Bioclimatic Design of Sustainable Campuses Using Advanced Optimisation Methods; Ecole Polytechnique Fédérale de Lausanne: Lausanne, Switzerland, 2017; submitted. [Google Scholar]
- Coccolo, S.; Kaempf, J.; Scartezzini, J.L. The EPFL Campus in Lausanne: New Energy Strategies for 2050. Energy Procedia 2015, 78, 3174–3179. [Google Scholar] [CrossRef]
- Magalhães Carneiro, C. Extraction of Urban Environmental Quality Indicators Using LiDAR-Based Digital Surface Models. Ph.D. Thesis, EPFL, Lausanne, Switzerland, 2011. [Google Scholar]
- Minergie. Règlement de la marque MINERGIE. Available online: https://www.minergie.ch/media/180109_produktreglement_minergie_p_a_v2017.3_fr.pdf (accessed on 5 April 2018).
- Perera, A.T.D.; Nik, V.M.; Mauree, D.; Scartezzini, J.L. Electrical hubs: An effective way to integrate non-dispatchable renewable energy sources with minimum impact to the grid. Appl. Energy 2017, 190, 232–248. [Google Scholar] [CrossRef]
- Guen, M.L.; Mosca, L.; Perera, A.T.D.; Coccolo, S.; Mohajeri, N.; Scartezzini, J.L. Improving the energy sustainability of a Swiss village through building renovation and renewable energy integration. Energy Build. 2018, 158, 906–923. [Google Scholar] [CrossRef]
- Vandevyvere, H.; Stremke, S. Urban Planning for a Renewable Energy Future: Methodological Challenges and Opportunities from a Design Perspective. Sustainability 2012, 4, 1309–1328. [Google Scholar] [CrossRef]
- Ambrosini, D.; Galli, G.; Mancini, B.; Nardi, I.; Sfarra, S. Evaluating Mitigation Effects of Urban Heat Islands in a Historical Small Center with the ENVI-Met® Climate Model. Sustainability 2014, 6, 7013–7029. [Google Scholar] [CrossRef]
- Lundgren, K.; Kjellstrom, T. Sustainability Challenges from Climate Change and Air Conditioning Use in Urban Areas. Sustainability 2013, 5, 3116–3128. [Google Scholar] [CrossRef]
- Williams, K.; Gupta, R.; Hopkins, D.; Gregg, M.; Payne, C.; Joynt, J.L.R.; Smith, I.; Bates-Brkljac, N. Retrofitting England’s suburbs to adapt to climate change. Build. Res. Inf. 2013, 41, 517–531. [Google Scholar] [CrossRef]


| Years | Meteonorm | CIM | Renovation |
|---|---|---|---|
| 2039 | X | X | |
| 2069 | X | X | |
| 2999 | X | X | X |
| Wind Speed (m s−1) | Air Temperature (°C) | |||
|---|---|---|---|---|
| Meteonorm | CIM | Meteonorm | CIM | |
| Mean | 1.94 | 0.37 | 10.28 | 9.92 |
| St. Dev. | 1.94 | 0.48 | 7.74 | 9.97 |
| Min. | 0.00 | 0.02 | −9.50 | −14.30 |
| Max. | 16.2 | 4.74 | 30.00 | 40.60 |
| Climatic Data | Heating Total Demand | Cooling Total Demand |
|---|---|---|
| (GWh) | (GWh) | |
| 2039 | 32.42 | −2.79 |
| 2069 | 30.19 | −3.99 |
| 2099 | 28.05 | −5.83 |
| 2099-MinP | 18.41 | −9.62 |
| 2039-CIM | 35.22 | −5.81 |
| 2069-CIM | 33.52 | −7.26 |
| 2099-CIM | 31.33 | −9.12 |
| 2099-MinP-CIM | 21.29 | −14.60 |
| Climatic Data | Heating Demand | Cooling Demand |
|---|---|---|
| (MWh) | (MWh) | |
| 2039 | 12.9 | −10.4 |
| 2069 | 11.7 | −14.4 |
| 2099 | 10.3 | −13.9 |
| 2099-MinP | 7.5 | −16.7 |
| 2039-CIM | 14.0 | −14.5 |
| 2069-CIM | 13.0 | −18.0 |
| 2099-CIM | 12.3 | −18.1 |
| 2099-MinP-CIM | 9.0 | −21.4 |
© 2018 by the authors. Licensee MDPI, Basel, Switzerland. This article is an open access article distributed under the terms and conditions of the Creative Commons Attribution (CC BY) license (http://creativecommons.org/licenses/by/4.0/).
Share and Cite
Mauree, D.; Coccolo, S.; Perera, A.T.D.; Nik, V.; Scartezzini, J.-L.; Naboni, E. A New Framework to Evaluate Urban Design Using Urban Microclimatic Modeling in Future Climatic Conditions. Sustainability 2018, 10, 1134. https://doi.org/10.3390/su10041134
Mauree D, Coccolo S, Perera ATD, Nik V, Scartezzini J-L, Naboni E. A New Framework to Evaluate Urban Design Using Urban Microclimatic Modeling in Future Climatic Conditions. Sustainability. 2018; 10(4):1134. https://doi.org/10.3390/su10041134
Chicago/Turabian StyleMauree, Dasaraden, Silvia Coccolo, Amarasinghage Tharindu Dasun Perera, Vahid Nik, Jean-Louis Scartezzini, and Emanuele Naboni. 2018. "A New Framework to Evaluate Urban Design Using Urban Microclimatic Modeling in Future Climatic Conditions" Sustainability 10, no. 4: 1134. https://doi.org/10.3390/su10041134
APA StyleMauree, D., Coccolo, S., Perera, A. T. D., Nik, V., Scartezzini, J.-L., & Naboni, E. (2018). A New Framework to Evaluate Urban Design Using Urban Microclimatic Modeling in Future Climatic Conditions. Sustainability, 10(4), 1134. https://doi.org/10.3390/su10041134