1. Introduction
In recent decades, the green environment has been a developing trend and a global topic. For example, the Earth Summit in 1992 proposed the phrase “environment and development” to protect the integrity of the global environmental and developmental system [
1]. After that, in 2012, at the United Nations Conference on Sustainable Development held in Rio de Janeiro, the phrase was extended to “economic, social, and environmental” and it was made clear that sustainability consists of at least the economic, social, and environmental pillars [
2]. Accordingly, many efforts have integrated environmental and social outcomes related to economic development. For instance, the Waste Electrical and Electronic Equipment Directive requires all original equipment manufacturers (OEMs) to “extend producer responsibility” by establishing a take-back system for electrical and electronic waste. Recently, the Home Appliance Recycling Law in Japan and the Regulations on the Administration of the Recovery and Disposal of Waste Electrical and Electronic Products in China have also reflected this consciousness.
Due to increasing consciousness of sustainability and pressure from legislation, numerous studies and managers have sought to integrate traditional operations management with green environment and Earth resource preservation. One of the lasting effects from such efforts is that remanufacturing has emerged as a growing topic, generally perceived as a profitable and environmentally friendly operations option for many products. As a cost-saving alternative to traditional producing, remanufacturing has manufacturing costs that are 40% to 65% lower than those for producing new products [
3]. Overall, Xerox Corporation saved around
$200 million by remanufacturing copiers returned at the expiration of their lease contracts [
4]. Furthermore, along with energy recovery, material recycling, and possible reuse of components, remanufacturing links to the green reputation [
5]. In total, compared to sourcing new parts from suppliers, IBM saved nearly 80% per part by dismantling returned components [
6].
Lacking the advantages of collecting used cores [
4], most OEMs, especially those in developed countries such as the United States, European countries, and Japan, prefer to outsource remanufacturing operations to other agents [
7,
8]. For example, Land Rover formed a strategic alliance with Caterpillar Remanufacturing Services, in which Land Rover outsourced its remanufacturing operations to the latter [
9]. It should be noted that since the third-party remanufacturer (TPR) is an independent member that maximizes profits from remanufacturing only, the potential for cannibalization of new products becomes a concern when OEMs outsource their remanufacturing to TPRs [
10,
11]. As a result, in recent years, many brand-name OEMs have outsourced remanufacturing operations to suppliers that have a common interest in embracing profits from new products. For example, Apple signed a Memorandum of Understanding in which Foxconn, the largest supplier of Apple’s portable and desktop products, would offer remanufacturing services for iPhone mobile phones in the Chinese market [
12]. A similar case appeared in the automobile industry: In 2008, the China National Development and Reform Commission launched a pilot program for automobile parts remanufacturing, in which half of the assigned firms are automobile parts suppliers [
13].
Intuitively, outsourcing remanufacturing to suppliers seems reasonably beneficial for suppliers and could mitigate the adverse effects of cannibalization between products. For industry, the environment, and social welfare, however, the implications of such strategic decisions are not all that clear. To understand this fundamental question related to green operations, in this paper, we develop two models that allow an OEM with the potential flexibility to (1) outsource remanufacturing operations to a TPR (Model T) or (2) outsource remanufacturing operations to a supplier (Model S). Using both models, we focus on the following questions:
- (1)
From the profit-maximization perspective, which is better for the OEM, supplier, TPR, and industry?
- (2)
From the environmental perspective, which is better for the environment?
- (3)
From the social welfare perspective, which is better for society?
- (4)
Finally, for a decision-maker, is there any effective method for the OEM that can achieve a “win-win-win” outcome that meets the economic, social, and environmental requirements?
Our results show that, although Model T creates more potentially sustainable economic, social, and environmental situations, this strategy is not supported by the supplier because it always leaves the supplier worse off. In order to achieve a “win-win-win” outcome that meets economic, social, and environmental requirements for all parties, a revenue-sharing contract is proposed and incorporated into Model T.
Our overall contribution is therefore twofold. On the one hand, although the many brand name OEMs has outsourced the remanufacturing operations to its suppliers in recent years, research has focused primarily on the remanufacturing outsourcing strategy between OEMs and TPRs (see, e.g., [
7,
8,
11,
14]). In this paper, we allow the OEM the flexibility to outsource remanufacturing to two different agents, a TPR, and a supplier. In other words, we provide an alternative and somewhat complementary approach to consider how different strategic choices in remanufacturing outsourcing affect the sustainability issues in a supply chain. On the other hand, although a few studies, including [
15,
16,
17], have recently begun to analyze how outsourcing the remanufacturing operations to the supplier has strategic implications for OEM’s profit-maximization behaviors, we lack a more differentiated and nuanced understanding of whether the OEM should outsource its remanufacturing operations to the supplier have important strategic implications for sustainable issues related to the green environment and the social welfare, respectively. These are exactly the issues we address here. Furthermore, our aim and model setting are quite different: we extend them to address and compare the sustainability implications of supplier remanufacturing and third-party remanufacturing.
The rest of the paper is organized as follows.
Section 2 reviews the related literature and explains our contributions in more detail.
Section 3 describes both models and outlines our assumptions.
Section 4 formulates our models and analyzes optimal decisions.
Section 5 examines both models from the sustainability perspective and presents the main results.
Section 6 concludes our work and provides future research directions.
2. Literature Review
In recent decades, sustainability has had significant importance in supply chain management. For instance, Carter and Rogers [
18] presented a framework of sustainable supply chain management based on resource dependence theory and a resource-based view of the firm. Shen [
19] studied the case of the Swedish fast-fashion company H&M, which constructed a sustainable supply chain developing eco-materials, providing safety training, monitoring sustainable manufacturing, reducing carbon emissions in distribution, and promoting eco-fashion. Recently, Wang et al. [
20] built a stylized dual-channel model with price competition and demand uncertainty to characterize the main properties of a fashion supply chain, showing that fierce price competition will lead to a relatively sustainable supply chain. More recently, Madani and Rasti-Barzoki [
21] found that the impact of raising subsidy rates is more than that of raising the tax rate, and it leads to an increase in government profit and the sustainability of supply chains. We refer the interested reader to De and Van [
22] for a complete literature review on supply chain management and sustainability. Our work contributes to this line of literature by addressing sustainability issues related to economic, environmental, and social requirements in remanufacturing areas.
In recent decades, a great deal of research has shown that remanufacturing plays an important role in the green sustainability. For example, Atasu et al. [
23] propose a complementary approach to consider several demand-related issues involving the existence of green segments, original equipment manufacturer competition, and product life-cycle effects. Quarisguasi and Bloemhof [
24] analyzed the total energy consumed in the life cycle of these products under the conditions of remanufacturing computers and mobile phones through transaction datasets acquired from eBay. Parra et al. [
25] propose that price and environmental issues often constitute positive incentives for customers to purchase remanufactured products. Recently, Xiao et al. [
26] take the loading machine as a case study and use life cycle analysis to compare the environmental impacts and cost of a manufactured loading machine with its remanufactured counterparts. Although interest in the issues related to the remanufacturing has increased noticeably in the past decade, little is known about how the OEM’s strategic choice between different remanufacturers affects sustainability issues in a supply chain.
The third related area of literature is on remanufacturing, particularly the outsourcing strategy between the manufacturer and the TPR. For example, Oraiopoulos and Toktay [
27] developed a model where the OEM can directly affect the resale value of its product through a relicensing fee charged to the buyer of the refurbished equipment, and drew conclusions about the conditions that favor stimulating or deterring the secondary market. Zou et al. [
8] compared these two modes by modeling a game between an OEM and a TPR on equilibrium outcomes, and suggested that when consumers perceive remanufactured products to have low value, the TPR prefers the authorization approach; otherwise, the TPR prefers the outsourcing approach. Liu et al. [
28] explored three certification contracts, lump-sum payment, profit-sharing payment, and piece-rate payment, and showed that when TPRs have a high profit margin and there is no significant difference in consumers’ preferences between certified and noncertified remanufacturing channels, the profit-sharing payment contract yields the highest profit. In addition, several authors have studied the competition between OEM and TPR. For example, Ferguson et al. studied the strategic of competition between the OEM and TPR when there was a difference between the new and remanufactured products. Orsdemir et al. studied the production quality competition between OEM and TPR in equilibrium. And, Wu and Han [
29] showed that OEM and TPR compete closely in the recycling market and compete for prices in the market. As mentioned earlier, when an OEM outsources remanufacturing to its TPRs, the potential for cannibalization of new products becomes a concern. But, outsourcing remanufacturing to suppliers can mitigate the adverse effects of cannibalization between products because both parties have a common interest in embracing profits from new products. In this paper, we allow the OEM the flexibility to outsource remanufacturing to its suppliers and/or TPRs. Put differently, we complement this line of thought by addressing how outsourcing remanufacturing to the supplier creates strategic issues that are different from those of outsourcing to TPRs.
To our knowledge, a few studies have begun to analyze the implications of supplier remanufacturing. For example, Xiong et al. [
15] made the first attempt to highlight how the interaction between OEM and TPR on production of new products impacts sustainability outcomes related to the remanufacturing undertaken by the OEMs. They [
16] further addressed sustainability issues of manufacturer remanufacturing and supplier remanufacturing. Meanwhile, Huang and Wang [
17] investigated the value of information sharing in supplier remanufacturing and manufacturer remanufacturing scenarios where the retailer possesses private demand information. Our aim and model settings are quite different. First, rather than focusing on the different effects on manufacturer remanufacturing and supplier remanufacturing, unlike those authors, we assume that all remanufacturing is outsourced to TPRs and/or suppliers. Such an alternative and somewhat complementary research perspective is consistent with the fact that not all OEMs possess the infrastructure and expertise to remanufacture used products in a profitable manner [
4], which is also supported by a survey from the US remanufacturing industry showing that out of 2000 remanufacturing firms, only 6% were OEMs [
30]. Second, although the implications of manufacturer remanufacturing and supplier remanufacturing have been analyzed, little is known about how the OEM’s strategic choice between different remanufacturers affects the sustainability issues in a supply chain. These are exactly the issues we address here. Put differently, we extend them to address and compare the sustainability implications of supplier remanufacturing and third-party remanufacturing.
3. Model Description and Assumption
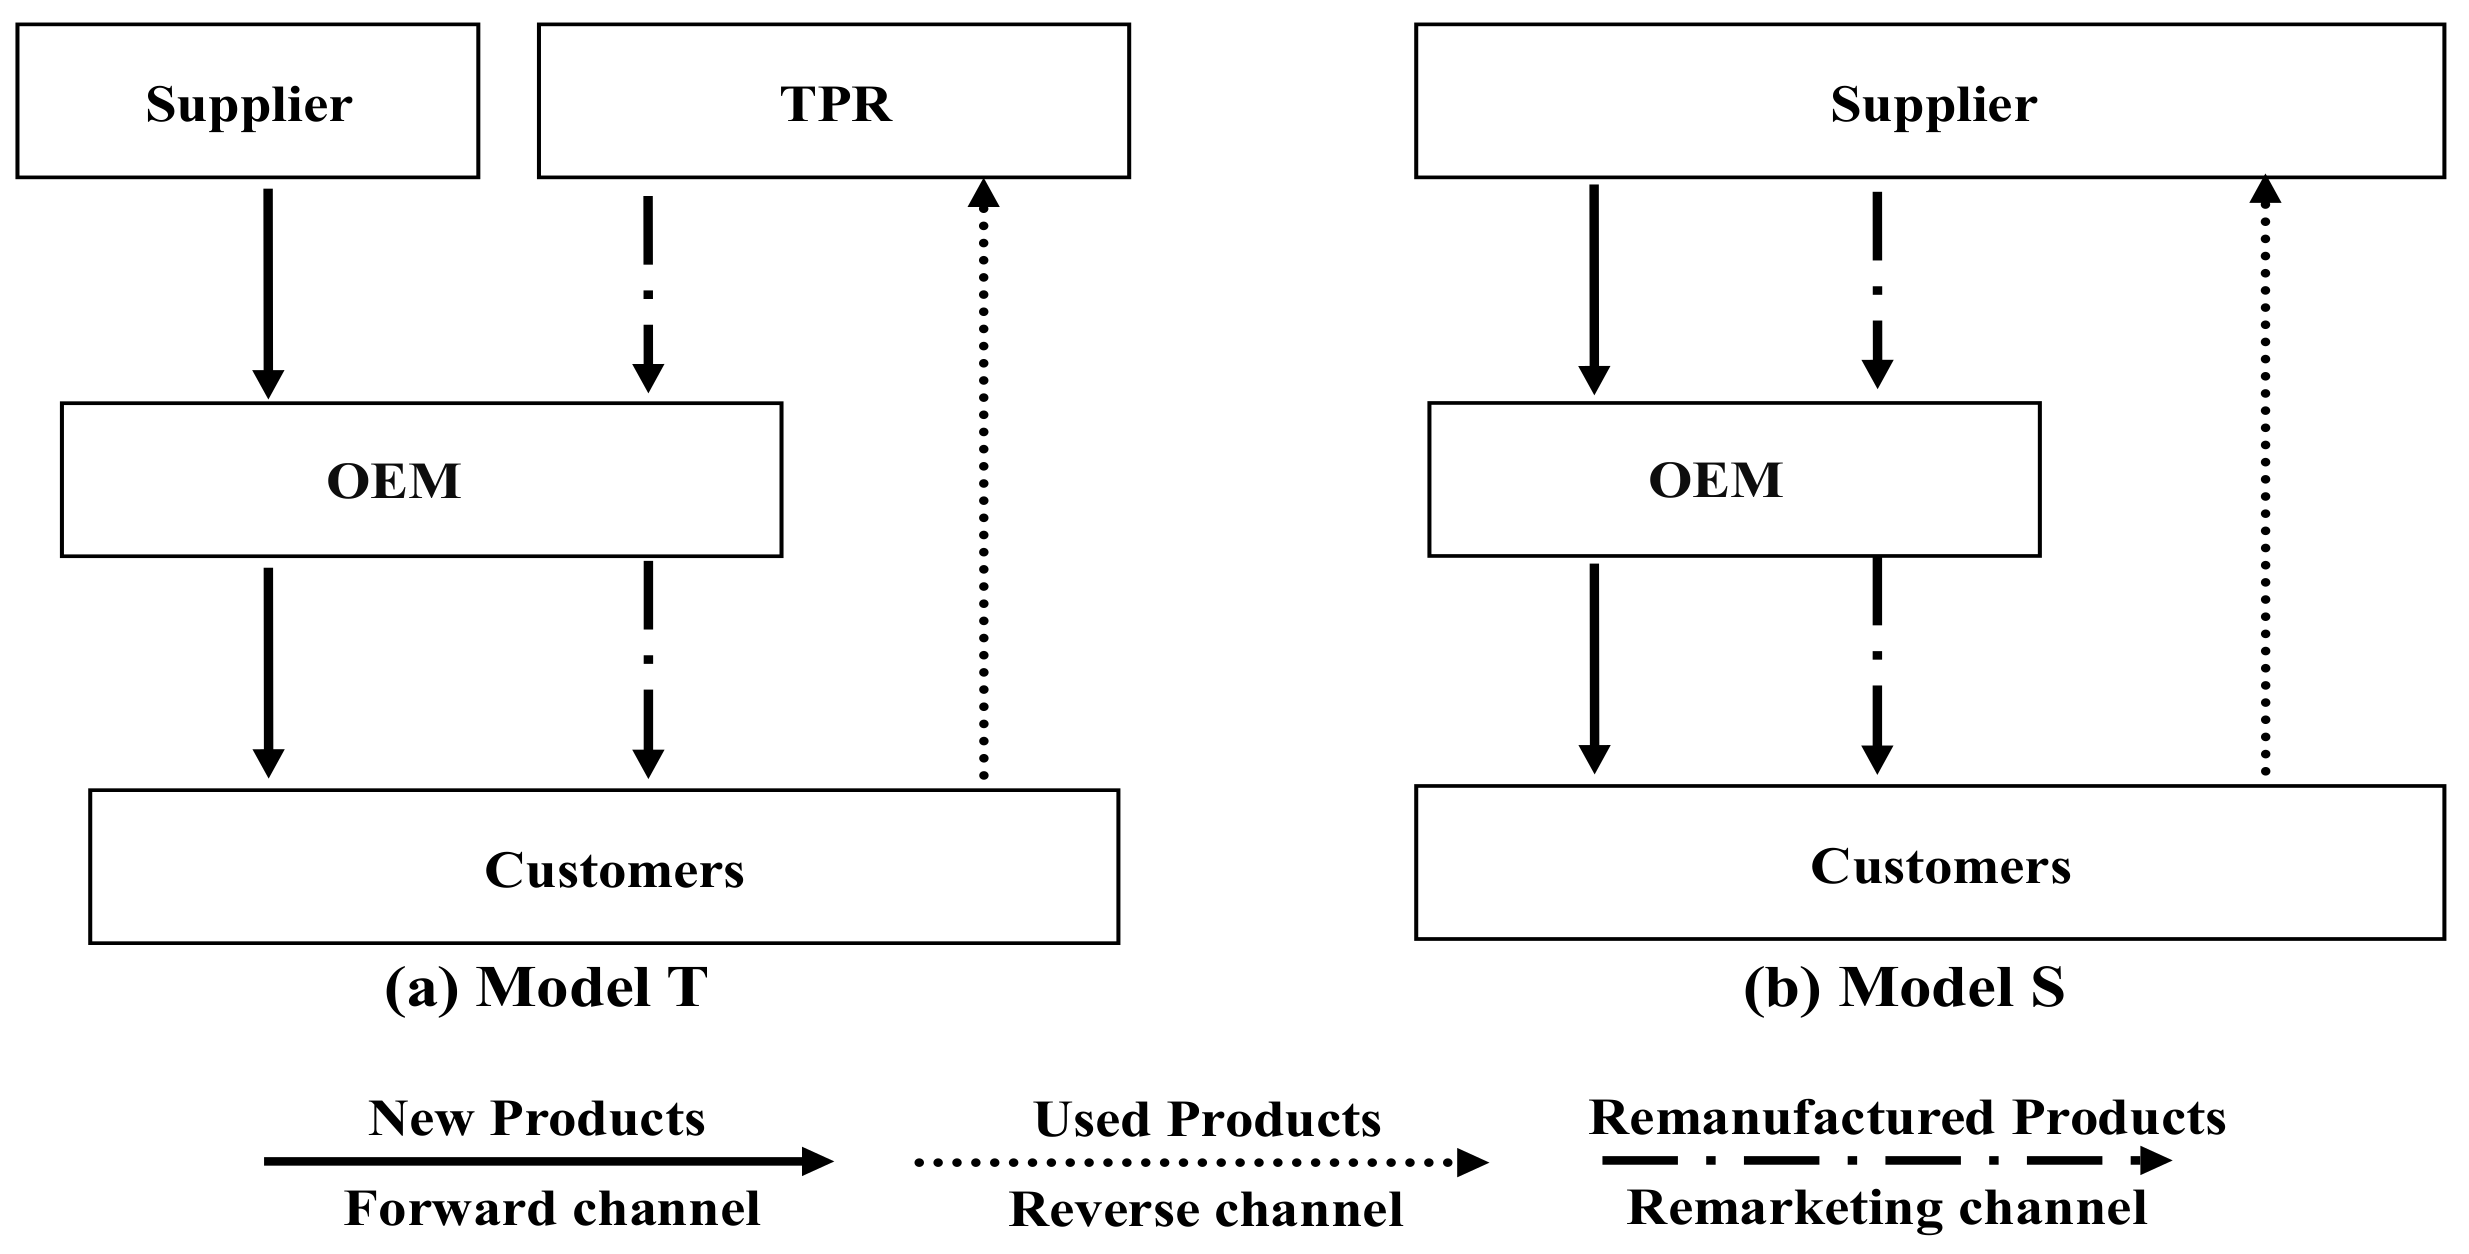
In this study, we consider a closed-loop supply chain consisting of three members, the OEM, the TPR, and the supplier. We assume that both new and remanufactured products are distributed by the OEM, but with two options for the outsourcing of remanufacturing operations: (1) to the TPR (see
Figure 1a, Model T) or (2) to the supplier (see
Figure 1b, Model S).
In order to formulate the model, we first lay out our assumptions regarding the product and all players as follows.
Assumption 1. In both models, all players have access to the same information.
To focus on the impacts of the OEM’s different strategies on sustainability issues and control for information asymmetry, like Xiong et al. [
16] and Yan et al. [
31], we assume that all parties can choose the optimal response given complete information.
Assumption 2. Consumers are heterogeneous in their willingness to pay () for a new product, which is uniformly distributed in a market with the size normalized to one.
Assumption 3. Each consumer value discount for the remanufactured product is a fraction () of the willingness to pay for the new product.
Consumers exhibiting vertical heterogeneity over new and remanufactured products is generally employed in the remanufacturing literature (see, for example, References [
16,
31,
32]). Such vertical heterogeneity is backed by the empirical evidence of Li [
33], whose experimental results argued that consumers’ willingness to pay for remanufactured consumer products is about 15.3% lower than their willingness to pay for new ones.
It should be noted that the value discount for remanufactured products () would contribute to the cannibalization of new product sales by remanufactured sales. More specifically, represents the remanufactured product as an imperfect substitute for the new one; as a result, consumers would pay nothing for any remanufactured product. But represents the remanufactured product as a perfect substitute for the new one, resulting in consumers paying the same amount for the remanufactured one.
Based on Assumptions 2 and 3, the utility for each consumer that derives from a new product depends on their valuation and the price, that is, a consumer can obtain the net utility of
from the new product. Given the consumer values the new product at
and values the remanufactured product with
, the consumer’s net utility from the remanufactured products is
. From these two net utility functions, we can obtain that, when
, a consumer is indifferent between buying a remanufactured product and not buying. That is, the consumers with
would buy the product. And, when
, a consumer would be indifferent between buying a remanufactured product and buying a new one. Hence, the consumers with
prefer to the new product than the remanufactured one. Based on the net utilities at two different points, we can derive the inverse demand functions for new and remanufactured products as follows:
Assumption 4. The unit cost of producing a new product is and the unit cost of remanufacturing a used product is ; furthermore, .
The unit cost of remanufacturing is lower than that of producing new products, reflecting the fact that remanufacturing is a low-cost alternative to traditional manufacturing because it requires less material and energy [
5].
Assumption 5. All decisions are analyzed in a single-period model: the supplier and/or TPR first announces the wholesale price (/), and then the OEM determines the optimal units of new and/or remanufactured products ( and/or ).
With the single-period model, the previous existence of the products in the market means those products sold in previous periods can be returned for reuse [
16,
34] .
5. Analysis
Our analysis in this section serves one purpose: To show TPR vs. supplier, which remanufacturer is better for the economic, environment and social responsibility. To do so, we start by analyzing the difference in optimal decisions between the two models. Subsequently, we enrich our analysis to capture the differences in sustainability issues between the models from the economic, social, and environmental perspectives. Finally, to achieve a “win-win-win” outcome that meets economic, social, and environmental requirements for all parties, we propose a revenue-sharing contract.
5.1. Comparison of Optimal Outcomes
We first highlight the difference in optimal decisions between Model T and Model S. Based on the outcomes in
Table 1, we make the following proposition:
Proposition 1. Both products’ wholesale prices in Model T are always lower than those in Model S; that is, and .
In Model T, remanufactured products are provided by the TPR, while new products are offered by the supplier. Said differently, in Model T, all the TPR’s profits are obtained from remanufactured products only. As a result, in Model T, the TPR would be likely to choose a relative lower wholesale price () for remanufactured products to ensure increased output for remanufactured products sales. Although such a lower wholesale price () for remanufactured products would be highly detrimental to the sales and the unit wholesale price of the new products, the TPR would care nothing about the potential for cannibalization of new products, because all its profits are obtained from remanufactured products only. However, in Model S, both products are offered by the supplier. Put differently, in Model S, the supplier’s revenue comes from both products; as a result, unlike the TPR in Model T, the supplier cares more about the potential for cannibalization of new products and is less likely to set higher wholesale prices for remanufactured products, a strategy that reduces the demand for the units of remanufactured product and mitigates the adverse effects of the potential for cannibalization of new products by remanufactured products.
To gain a deeper understanding, we go a step further to reveal variations in the optimal wholesale prices in both models in numerical experiments (in all numerical examples, the parameters of the producing cost and the consumer value discount for remanufactured products are characterized by
and
). First, from
Figure 2, we observe that, as Proposition 1 shows, both products’ wholesale prices in Model T are always lower than those in Model S, that is,
and
. Second,
Figure 2 shows that in Model S, the wholesale price for new products is independent of the remanufactured cost, i.e.,
; however, the wholesale price of remanufactured products increases with the remanufactured cost. This can be interpreted as follows. Intuitively, the wholesale price for remanufactured products naturally increases with the cost of remanufacturing. On the other hand, in order to obtain more profit, the supplier would set a monopolistic wholesale price for new products, a strategy that not only can keep the monopolistic profits in the new product market, but also can limit the used cores for remanufactured products and mitigate the adverse effects of the potential for cannibalization of new products by remanufactured products. Third,
Figure 2 shows that in Model T, wholesale prices for both products increase with the remanufactured cost. First, the remanufactured products’ wholesale price increasing with the cost of remanufacturing is consistent with Model S. Second, in order to obtain more profit, the supplier would increase the wholesale price for new products as the competitor (i.e., the TPR) increases the wholesale price for remanufactured products.
We then pay attention to the difference in optimal quantities of both products between the two models. The following proposition summarizes our key finding.
Proposition 2. The optimal quantities of both products in Model T are always higher than those in Model S (i.e., , ).
Proposition 2 reveals that compared to Model T, the OEM provides fewer units of both products (
,
) in Model S. The supplier does so for three reasons: First, as Proposition 1 shows, wholesale prices for both products are higher than those in Model T. Second, as mentioned earlier, in Model T, remanufactured products are provided by the TPR, while new products are offered by the supplier. However, in Model S, both products are wholesaled by the supplier. Consistent with conventional wisdom, in Model T, the competition between the two parties (i.e., the supplier and the TPR) would increase the availability of both products. Third, compared to Model S, competition mitigates the adverse effects of the double marginalization problem between the supplier and the OEM and further increases the availability of new products.
Figure 3 illustrates these findings.
5.2. Comparison of Economic Sustainability
In this section, we mainly focus on sustainability issues from the economic perspective: which is better for the OEM, the supplier, and, in particular, the industry? We first turn our attention to the difference in OEM profitability between the two models (see
Figure 3).
Proposition 3. The OEM benefits more in Model T than in Model S; that is, .
It is widely acknowledged that remanufacturing operations undertaken by the TPR is usually detrimental to the OEM [
14]. Conventional wisdom also suggests that the OEM’s profitability increases with the TPR’s remanufacturing cost (e.g., [
11,
35]). In fact, the opposite is true when the OEM considers outsourcing remanufacturing operations to the TPR and its supplier. Said differently, compared to the remanufacturing operations undertaken by the supplier, outsourcing remanufacturing operations to the TPR is more beneficial for the OEM. The underlying intuition behind Proposition 3 is as follows. In Model T, remanufactured products are provided by the TPR, while new products are offered by the supplier. However, in Model S, both products are offered by the supplier. Thus, the OEM would benefit from the competition between the TPR and the supplier. More specifically, such competition can increase the manufacturer’s profitability in two ways. On the one hand, it causes the OEM to derive more revenue from remanufacturing due to the reduced the wholesale price and the increased availability of remanufactured products (see Proposition 2); on the other hand, confronting the competition from the TPR, the supplier is more likely to decrease the wholesale price for the new products (see Proposition 1), which leads the OEM to derive more revenue from per new product. Hence, the manufacturer can benefit more in Model T than in Model S.
Figure 3 illustrates two phenomena. First, as expected, compared to Model S, Model T is more beneficial for the OEM. Second, and perhaps less expected, the OEM’s profits in both models would decrease with the cost of remanufacturing. The latter finding, it should be noted, differs from the findings of [
35], a difference that we believe stems from our models’ focus on the OEM, with the flexibility to outsource remanufacturing to two different agents (i.e., TPR and supplier) rather than competition in remanufacturing between the OEM and the TPR.
We are now in a position to address the differences in supplier profitability between the two models.
Proposition 4. The supplier is worse off in Model T than in Model S; that is, .
Proposition 4 indicates that, although the supplier is more likely to provide more units of new products in Model T (i.e.,
), the profitability in Model S is higher than that in Model T. This can be interpreted as follows: On the one hand, in Model T, remanufactured products are provided by the TPR, while new products are offered by the supplier. However, in Model S, both products are offered by the supplier. As a result, in Model S, besides the profit from new products, the supplier would obtain the additional profit from remanufactured products sales. Said differently, in Model S, in addition to the optimal quantities of new products, the supplier has more flexibility to choose the units of the remanufactured products; such flexibility leads to more benefits for the supplier from remanufacturing. On the other hand, as Proposition 1 shows, compared to Model S, the TPR would choose a relative lower wholesale price (
) for remanufactured products in Model T, that would be highly detrimental to the sales of the new products, meaning that the supplier earns more profit from new products sales in Model S than that in Model T due to
. As a result, the supplier would benefit more in Model S than in Model T.
Figure 4 illustrates these findings.
Regarding the variations in industry profit, i.e., the difference in industry profit between the two models, based on the outcomes in
Table 1, we provide the following proposition.
Proposition 5. Outsourcing remanufacturing to TPR is always beneficial for the industry; that is, .
Recall that outsourcing remanufacturing to the TPR is always beneficial for the OEM but detrimental to the supplier (i.e., and ). Proposition 5 further indicates that the benefits to the OEM’s profitability in Model T (see Proposition 3) are sufficient to “compensate” for the supplier’s profit “loss” (see Proposition 4). The intuition for Proposition 5 is analyzed in Propositions 1, 2, 3, and 4 and is not repeated here.
5.3. Comparison of Environmental Sustainability
In this subsection, we intend to address the differences in environmental impact between the two models. More specifically, we try to answer the question posed at the beginning of this paper: From the green environment perspective, which is better for the environment?
A strategy’s environmental impact depends on the product volume in each phase multiplied by its per-unit impact in each phase [
32]. Accordingly, we use
(
) to represent the per-unit disposal impact of new (remanufactured) products and draw on the previous analysis to derive the following assumption.
Assumption 7. The per-unit environmental impact of a new product is larger than that of a remanufactured one; that is, .
Along with energy recovery, material recycling, and possibly reusing components, one unit of a remanufactured product’s environmental impact is lower than that of a new product [
5]. For simplification, like Xiong et al. [
15], we normalize the one unit remanufactured product’s environmental impact to zero. Let
and
represent the environmental impacts of Models T and S, respectively. Then, based on the outcomes in
Table 1, we offer the following proposition:
Proposition 6. Outsourcing the remanufacturing to the TPR is always beneficial for the environment; that is, .
Note that the environmental impacts of not only depend on the optimal quantities of new products but also are related to the units of remanufactured products. Hence, Proposition 6 can be interpreted as follows: although the supplier provides more quantities of new products in Model T (i.e., ), the remanufacturer in Model T would remanufacture even more units than in Model S (i.e., ). Said differently, Proposition 6 reflects the fact that, the source saving from remanufacturing in Model T is sufficient to “compensate” for the source waste from new products producing.
Figure 5 illustrates three phenomena. First, we observe that, as Proposition 6 shows, although the supplier provides more quantities of new products in Model T (i.e.,
), the remanufacturer in Model T would remanufacture even more units than in Model S (i.e.,
). Second, intuitively, the level of remanufacturing in Model T and Model S are both decreased with the cost of remanufacturing. However,
Figure 6 shows that, the level of
increases with the cost of remanufacturing. Meaning that, the impact of rising remanufacturing costs on the level of remanufacturing in Model S is heavier than that in Model T. That is, as the cost of remanufacturing increases, the decreasing level of remanufacturing in Model S is faster than that in Model T. Third,
Figure 5 shows that, the level of
decreases with the cost of remanufacturing. This reflects the fact that, as the cost of remanufacturing increases, the OEM has a higher incentive to increase the new products availability in Model S than in Model T. As a result, as the cost of remanufacturing increases, the difference of the availability of new products in both models, i.e.,
decreases.
Figure 5 illustrates these findings.
5.4. Comparison of Social Responsibility
Corporate social responsibility can be defined as a doctrine that promotes the expansion of social stewardship by businesses and organizations [
36,
37,
38]. Panda et al. [
39], Yenipazarli [
40], and Liu et al. [
41] suggest that, besides the regular financial obligations to stockholders, corporations should embrace responsibility by adding social issues such as consumer surplus and environmental damage in their profit. Following this line of research, we can answer the question posed at the beginning of this paper: From the social welfare perspective, which is better for society as follows:provide the following proposition:
Proposition 7. Outsourcing remanufacturing to the supplier is less likely to be socially responsible than when the TPR engages in remanufacturing; that is, .
We should note that, like Orsdemir et al. [
14] and Yenipazarli [
40], our social responsibility function consists of three components: industry profit, consumer surplus, and environmental impact; that is,
. As a result, Proposition 7 can easily be derived from the consumer surplus function and Propositions 5 and 6. In particular, Proposition 7 indicates that outsourcing remanufacturing to the supplier not only is always detrimental to industry profit (see Proposition 5) and environmental sustainability (see Proposition 6), but also leads a lower social responsibility outcome. Based on Proposition 2, we can obtain that, Compared to Model S, availability of both products in Model T is always higher (i.e.,
,
). Based the demand function in Equation (1), we can easily derive that selling prices for both products are lower than those in Model S; as a result, the consumer surplus in Model T is higher than that in Model S (
) [
42,
43,
44,
45,
46,
47,
48].
It should be noted that, in Model T, remanufactured products are provided by the TPR, while new products are offered by the supplier. However, in Model S, both products are offered by the supplier. Proposition 7, therefore, reveals that, the equilibrium social welfare is higher in a remanufacturing-setting competition (i.e., Model T) than in a remanufacturing-setting monopolist (i.e., Model S), an argument supported by [
49,
50,
51,
52,
53,
54,
55,
56].
The equilibrium social welfare can be higher in competitive-setting than in a monopolistic-setting because the relatively large total output levels in the former yield a strictly positive influence on equilibrium social welfare.
5.5. A Revenue-Sharing Contract
In
Section 5.2,
Section 5.3, and
Section 5.4, our analysis reveals that, although Model T potentially creates more sustainable economic (see Proposition 5), environmental (see Proposition 6), and social (see Proposition 7) situations, this strategy is not supported by the supplier, because it always leaves the supplier worse off (see Proposition 4). To help all parties support Model T, according to our observations, a revenue-sharing contract is proposed.
Proposition 8. When the manufacturer agrees to a revenue-sharing contract with the sharing parameter of , the supplier would prefer to choose Model T; as a result, compared to Model S, the revenue-sharing contract can achieve a “win-win-win” outcome for the economic, social, and environmental requirements.
The revenue-sharing contract leads the OEM to share revenue generated from each unit with the supplier, but does not change the optimal decisions for all parties; as a result, if we adopt a revenue-sharing contract to coordinate Model T, it would have no impact on social and environmental requirements. That is, social responsibility and environmental sustainability under Model T with a revenue-sharing contract are still higher than in Model S.
On the other hand, we find that if the sharing parameter is
, the OEM’s profitability in Model T is still higher than in Model S. Put differently, when
, the manufacturer still prefers Model T over Model S. In addition, we further find that if the sharing parameter
, the supplier can share so much revenue from the OEM that its profitability in Model T is also higher than in Model S. As a result, the retailer would also prefer Model T over Model S. In addition, we find that Model T is always the optimal response for TPR. In sum, as
Figure 6 shows, compared to Model S, we can design a revenue-sharing contract with
that would achieve a “win-win-win”.
6. Conclusions
Due to increasing consciousness of sustainability and pressure from legislation, numerous studies and managers have sought to integrate traditional operations management with green environment and Earth resource preservation. One of the lasting effects of such sustainability consciousness is that remanufacturing has emerged as a growing topic. Although outsourcing has been well studied in the remanufacturing literature, the research has focused primarily on outsourcing strategies between manufacturers and third-party remanufacturers; as a result, it has ignored the OEM’s flexibility to outsource remanufacturing operations to other agents, such as its supplier. In practice, however, in recent years, Apple signed the remanufacturing operations for iPhone mobile phones to its supplier of Foxconn in the Chinese market. Similar cases also appear in many other industries. To fill this gap, we strive to understand supplier vs. TPR, which remanufacturer is better for creating more benefit for economic, environmental and social responsibility?
More specifically, in this paper, we developed two models that allow an OEM to have the potential flexibility to (1) outsource remanufacturing operations to a TPR (Model T) or (2) outsource remanufacturing operations to a supplier (Model S). Using these models, we sought to address the following research question in remanufacturing outsourcing: How does the OEM outsourcing remanufacturing to different agents (i.e., a TPR or a supplier) affect the green operational issues related to economic, environmental, and social requirements? And finally, for decision-makers, is there any effective method by which the OEM can achieve a “win-win-win” outcome that meets economic, social, and environmental requirements?
We start by studying differences in the economic performance between both models. Our key finding is that outsourcing remanufacturing to a supplier is beneficial for the supplier but detrimental to the OEM, TPR, and industry. We next examine, from the green environment perspective, which is better for the environment? Our analysis reveals that Model T is always more environmentally sustainable than Model S. We then highlight, from the social welfare perspective, which is better for society by adding social issues such as consumer surplus and environment impacts in profits. We find that the outsourcing of the remanufacturing to the supplier would lead a lower social welfare than outsourcing the remanufacturing to TPRs. Finally, a revenue-sharing contract is proposed and incorporated in Model T, which can lead a “win-win-win” outcome for the economic, social and environmental requirements for all parties.
Therefore, our paper makes the following contributions to the remanufacturing literature. First, our main contribution is that we model an OEM with the flexibility to outsource remanufacturing to two different remanufacturing providers, a TPR, and a supplier. Second, although the question of whether an OEM should outsource remanufacturing operations to a TPR has been well studied in the remanufacturing literature, little is known about how the OEM’s strategic choice between different remanufacturers affects sustainability issues in a supply chain. In particular, our proposal of a revenue-sharing contract for Model T to achieve a “win-win-win” outcome for economic, social, and environmental situations has implications for both academics and managers.
This research can be extended in several directions. First, we assume that the manufacturer is limited to outsourcing remanufacturing operations to a TPR or supplier. An extension to our model would be to address whether the OEM should outsource remanufacturing operations to other agents such as retailers. Second, our models assume that all remanufacturing operations are undertaken by one agent (i.e., TPRs and/or suppliers). Thus, extending this approach to highlight of the competition in remanufacturing operations would bring forth additional issues not considered in this paper. Third, given our focus on sustainability issues, we abstracted away other factors, including power structure, government policies, and asymmetric information. Future research could be done on how relaxing these assumptions can affect sustainability issues in a supply chain.

 ,
, 


