Article

The Performance of Early-Generation Perennial Winter Cereals at 21 Sites across Four Continents

by
Richard C. Hayes
1,*,
Shuwen Wang
2,
Matthew T. Newell
3,
Kathryn Turner
2,4,
Jamie Larsen
5,
Laura Gazza
6,
James A. Anderson
4,
Lindsay W. Bell
7,
Douglas J. Cattani
8,
Katherine Frels
4,
Elena Galassi
6,
Alexey I. Morgounov
9,
Clinton K. Revell
10,
Dhruba B. Thapa
11,
Erik J. Sacks
12,
Mohammad Sameri
13,
Len J. Wade
14,
Anna Westerbergh
13,
Vladimir Shamanin
15,
Amir Amanov
16 and
Guangdi D. Li
1
add Show full author list remove Hide full author list
1
NSW Department of Primary Industries, Wagga Wagga Agricultural Institute, PMB, Wagga Wagga, NSW 2650, Australia
2
The Land Institute, 2440 E. Water Well Rd., Salina, KS 67401, USA
3
NSW Department of Primary Industries, Cowra Research and Advisory Station, Binni Creek Rd., Cowra, NSW 2795, Australia
4
Department of Agronomy and Plant Genetics, University of Minnesota, 1991 Upper Buford Cir, St. Paul, MN 55108, USA
5
Agriculture and Agri-Food Canada, Lethbridge Research and Development Centre, 5403 1st Avenue South, Lethbridge, AB T1J 4B1, Canada
6
CREA Research Centre for Engineering and Agro-Food Processing, Via Manziana, 30, 00189 Rome, Italy
7
CSIRO Agriculture and Food, PO Box 102, Toowoomba, QLD 4350, Australia
8
Department of Plant Science, Room 222 Agriculture, University of Manitoba, Winnipeg, MB R3T 2N2, Canada
9
International Maize and Wheat Improvement Center (CIMMYT), P.O. Box 39 Emek, Ankara 06511, Turkey
10
Department of Primary Industries and Regional Development (Western Australia), 3 Baron-Hay Court, South Perth, WA 6151, Australia
11
Agriculture Botany Division, National Agriculture Research Institute, Nepal Agricultural Research Council, Khumaltar, Lalitpur 44700, Nepal
12
Department of Crop Sciences, University of Illinois, 1201 W. Gregory Dr., Urbana, IL 61801, USA
13
Department of Plant Biology, Uppsala BioCenter, Linnean Centre for Plant Biology in Uppsala, Swedish University of Agricultural Sciences, SE-75007 Uppsala, Sweden
14
School of Agriculture and Food Sciences, The University of Queensland, Brisbane, QLD 4072, Australia
15
Omsk State Agrarian University Named after P.A. Stolypin, 1 Institutskaya Square, 644008 Omsk, Russia
16
Research Institute of Plant Industry, VIR, Botanika, Kibray District, Tashkent Region 111202, Uzbekistan
*
Author to whom correspondence should be addressed.
Sustainability 2018, 10(4), 1124; https://doi.org/10.3390/su10041124
Submission received: 27 February 2018 / Revised: 2 April 2018 / Accepted: 3 April 2018 / Published: 9 April 2018
(This article belongs to the Special Issue Strategies, Advances and Challenges of Breeding Perennial Grain Crops)

Abstract

:
A network of 21 experiments was established across nine countries on four continents and spanning both hemispheres, to evaluate the relative performance of early generation perennial cereal material derived from wheat, rye, and barley and to inform future breeding strategies. The experimental lines were grown in replicated single rows, and first year production and phenology characteristics as well as yield and persistence for up to three years were monitored. The study showed that the existing experimental material is all relatively short-lived (≤3 years), with environments that are milder in summer and winter generally conferring greater longevity. No pedigree was superior across this diverse network of sites although better performing lines at the higher latitude sites were generally derived from Thinopyrum intermedium. By contrast, at lower latitudes the superior lines were generally derived from Th. ponticum and Th. elongatum parentage. The study observed a poor relationship between year 1 performance and productivity in later years, highlighting the need for perennial cereal material with greater longevity to underpin future experimental evaluation, and the importance for breeding programs to emphasize post-year 1 performance in their selections. Hybrid lines derived from the tetraploid durum wheat generally showed greater longevity than derivatives of hexaploid wheat, highlighting potential for greater use of Triticum turgidum in perennial wheat breeding. We advocate a model in future breeding initiatives that develops perennial cereal genotypes for specific target environments rather than a generic product for one global market. These products may include a diversity of cultivars derived from locally adapted annual and perennial parents. In this scenario the breeding program may have access to only a limited range of adapted perennial grass parents. In other situations, such as at very high latitude environments, perennial crops derived from barley or rye may have a better chance of success than those derived from wheat. In either case, development and selection of the perennial parent for adaptation to local environments would seem fundamental to success.

1. Introduction

Efforts to develop perennial wheat date back to a major initiative in Omsk, Russia, commencing in the 1920’s that pioneered the hybridization of annual wheat (Triticum aestivum L.) with perennial relatives. The first successful cross between annual and perennial Triticeae species was from the Russian program in 1930 and is attributed to N. V. Tsitsin [1]. Since that time there has been sporadic activity around the globe to generate further wheat × wheatgrass hybrids [2]. Whilst in some instances, such as in the early Russian work, the intent was undoubtedly to create a new plant form through wide hybridization [1,3], other outputs of successful wide hybridization were merely a product of wheat breeding programs seeking to introgress heritable traits from perennial relative species into conventional wheat [4].
In more recent times there has been a renewed focus on developing forms of perennialized wheat to achieve environmental sustainability outcomes in wheat production systems. At The Land Institute (Salina, KS, USA) for example, there has been an ongoing effort since 2002 to hybridize wheat and perennial wheatgrass species in order to develop a genuine perennial grain crop [5]. A similar program was established independently at around the same time at Washington State University [2]. Concurrently The Land Institute has also sought to “domesticate” the perennial species, intermediate wheatgrass (Thinopyrum intermedium (Host) Barkworth & Dewey), as a grain crop through breeding and selection on the basis of grain production attributes [5,6]. In general, the key challenges of the wide hybridization approach are in achieving reliable grain yield and longevity; the key challenges of the domestication approach are in achieving sustained grain yields and meeting the necessary benchmarks in grain quality, including kernel size [7]. The term “perennial wheat” is used in this paper as a loose amalgam that includes all perennial material derived from hybrids between wheat and perennial relatives, as distinct from selections from within perennial wheat relatives such as intermediate wheatgrass (IWG).
Wheat is not the only winter cereal to be hybridized with a perennial relative. Efforts to cross barley (Hordeum vulgare L.) with the perennial Hordeum bulbosum L. date back to the 1880’s [1]. There have also been various attempts to cross cereal rye (Secale cereale L.) with the perennial Secale strictum (C. Presl) C. Presl [8]. However, in recent times these alternative species have not received the same attention as wheat, resulting in a narrower range of material presently being available for testing.
A key challenge in contemporary perennial cereal research is the poor longevity of most of the existing breeding material across a range of environments. Although Larkin et al. [9] identified two perennial wheat lines that survived and yielded grain over four successive years at Cowra, Australia, plots in that study had declined to only single individual survivors. Poor longevity often limits the timeframe of evaluation to no more than two years [10,11], hampering the ability to explore the broader ecosystem benefits of perennial cereal crops.
Another challenge of perennial wheat development is limited grain yield as a result of infertility. A few lines, including Montana-2 (MT-2; × Agrotriticum intermediodurum Khizhnyak), have persisted for at least seven years in the field in Salina, KS, but produce almost no seed (S. Wang, unpublished data). Perennial wheat F1 crosses have poor chromosome pairing in meiosis and as a result have a limited seed set [12,13,14]. By the F6 and F7 generations regular pairing occurs [15] and they are more likely to have higher grain yield.
Several recent studies have evaluated a range of perennial wheat breeding lines and quantified the longevity and grain yield of the material in specific environments. However, to date there has been little effort to coordinate evaluations across different environments. An understanding of genetic interactions with environment is essential for breeding programs to develop material that is broadly adapted. Four hybrid wheat × Th. elongatum ([Host] D. R. Dewey) lines developed at Washington State University were tested in three studies run independently of each other; one in Michigan, USA [10], one in Washington, USA [16], and one in New South Wales, Australia [17]. Attempted comparisons between these discrete studies are problematic for a number of reasons, not least of all, the different objectives and methodologies undertaken. The inherent genetic variability of the hybrid lines can also confound comparisons. Prior to the evaluation in New South Wales, seed was imported to Australia from the USA. To comply with strict federal quarantine protocols, progeny of an individual plant grown in a quarantine glasshouse facility was used for subsequent field testing of a particular line [17]. Space constraints dictated that the progeny of only two individual seeds was used to approximate the performance of a particular line, meaning that the material in the Australian evaluation probably had less intra-line variation than that tested in the USA. Larkin et al. [9] later demonstrated the inherent variability between individuals sourced from the same original line from the perennial wheat breeding programs, which is consistent with the variability found in a range of other crops [18].
A study of 31 wheat × Th. ponticum lines conducted at three locations in Washington State in 2005–06 found no genotype × environment interaction in post-sexual cycle regrowth (PSCR) of the material, and concluded that selection for broad adaptation of the PSCR trait across locations and years would be possible [16]. The present study aimed to explore this further by examining the performance of a greater diversity of wheat-derived material, as well as a small number of barley and rye lines, over a broader range of global environments. The objective of the study was to assess the impact of environment on the performance of existing material in order to inform future perennial cereal breeding initiatives.

2. Materials and Methods
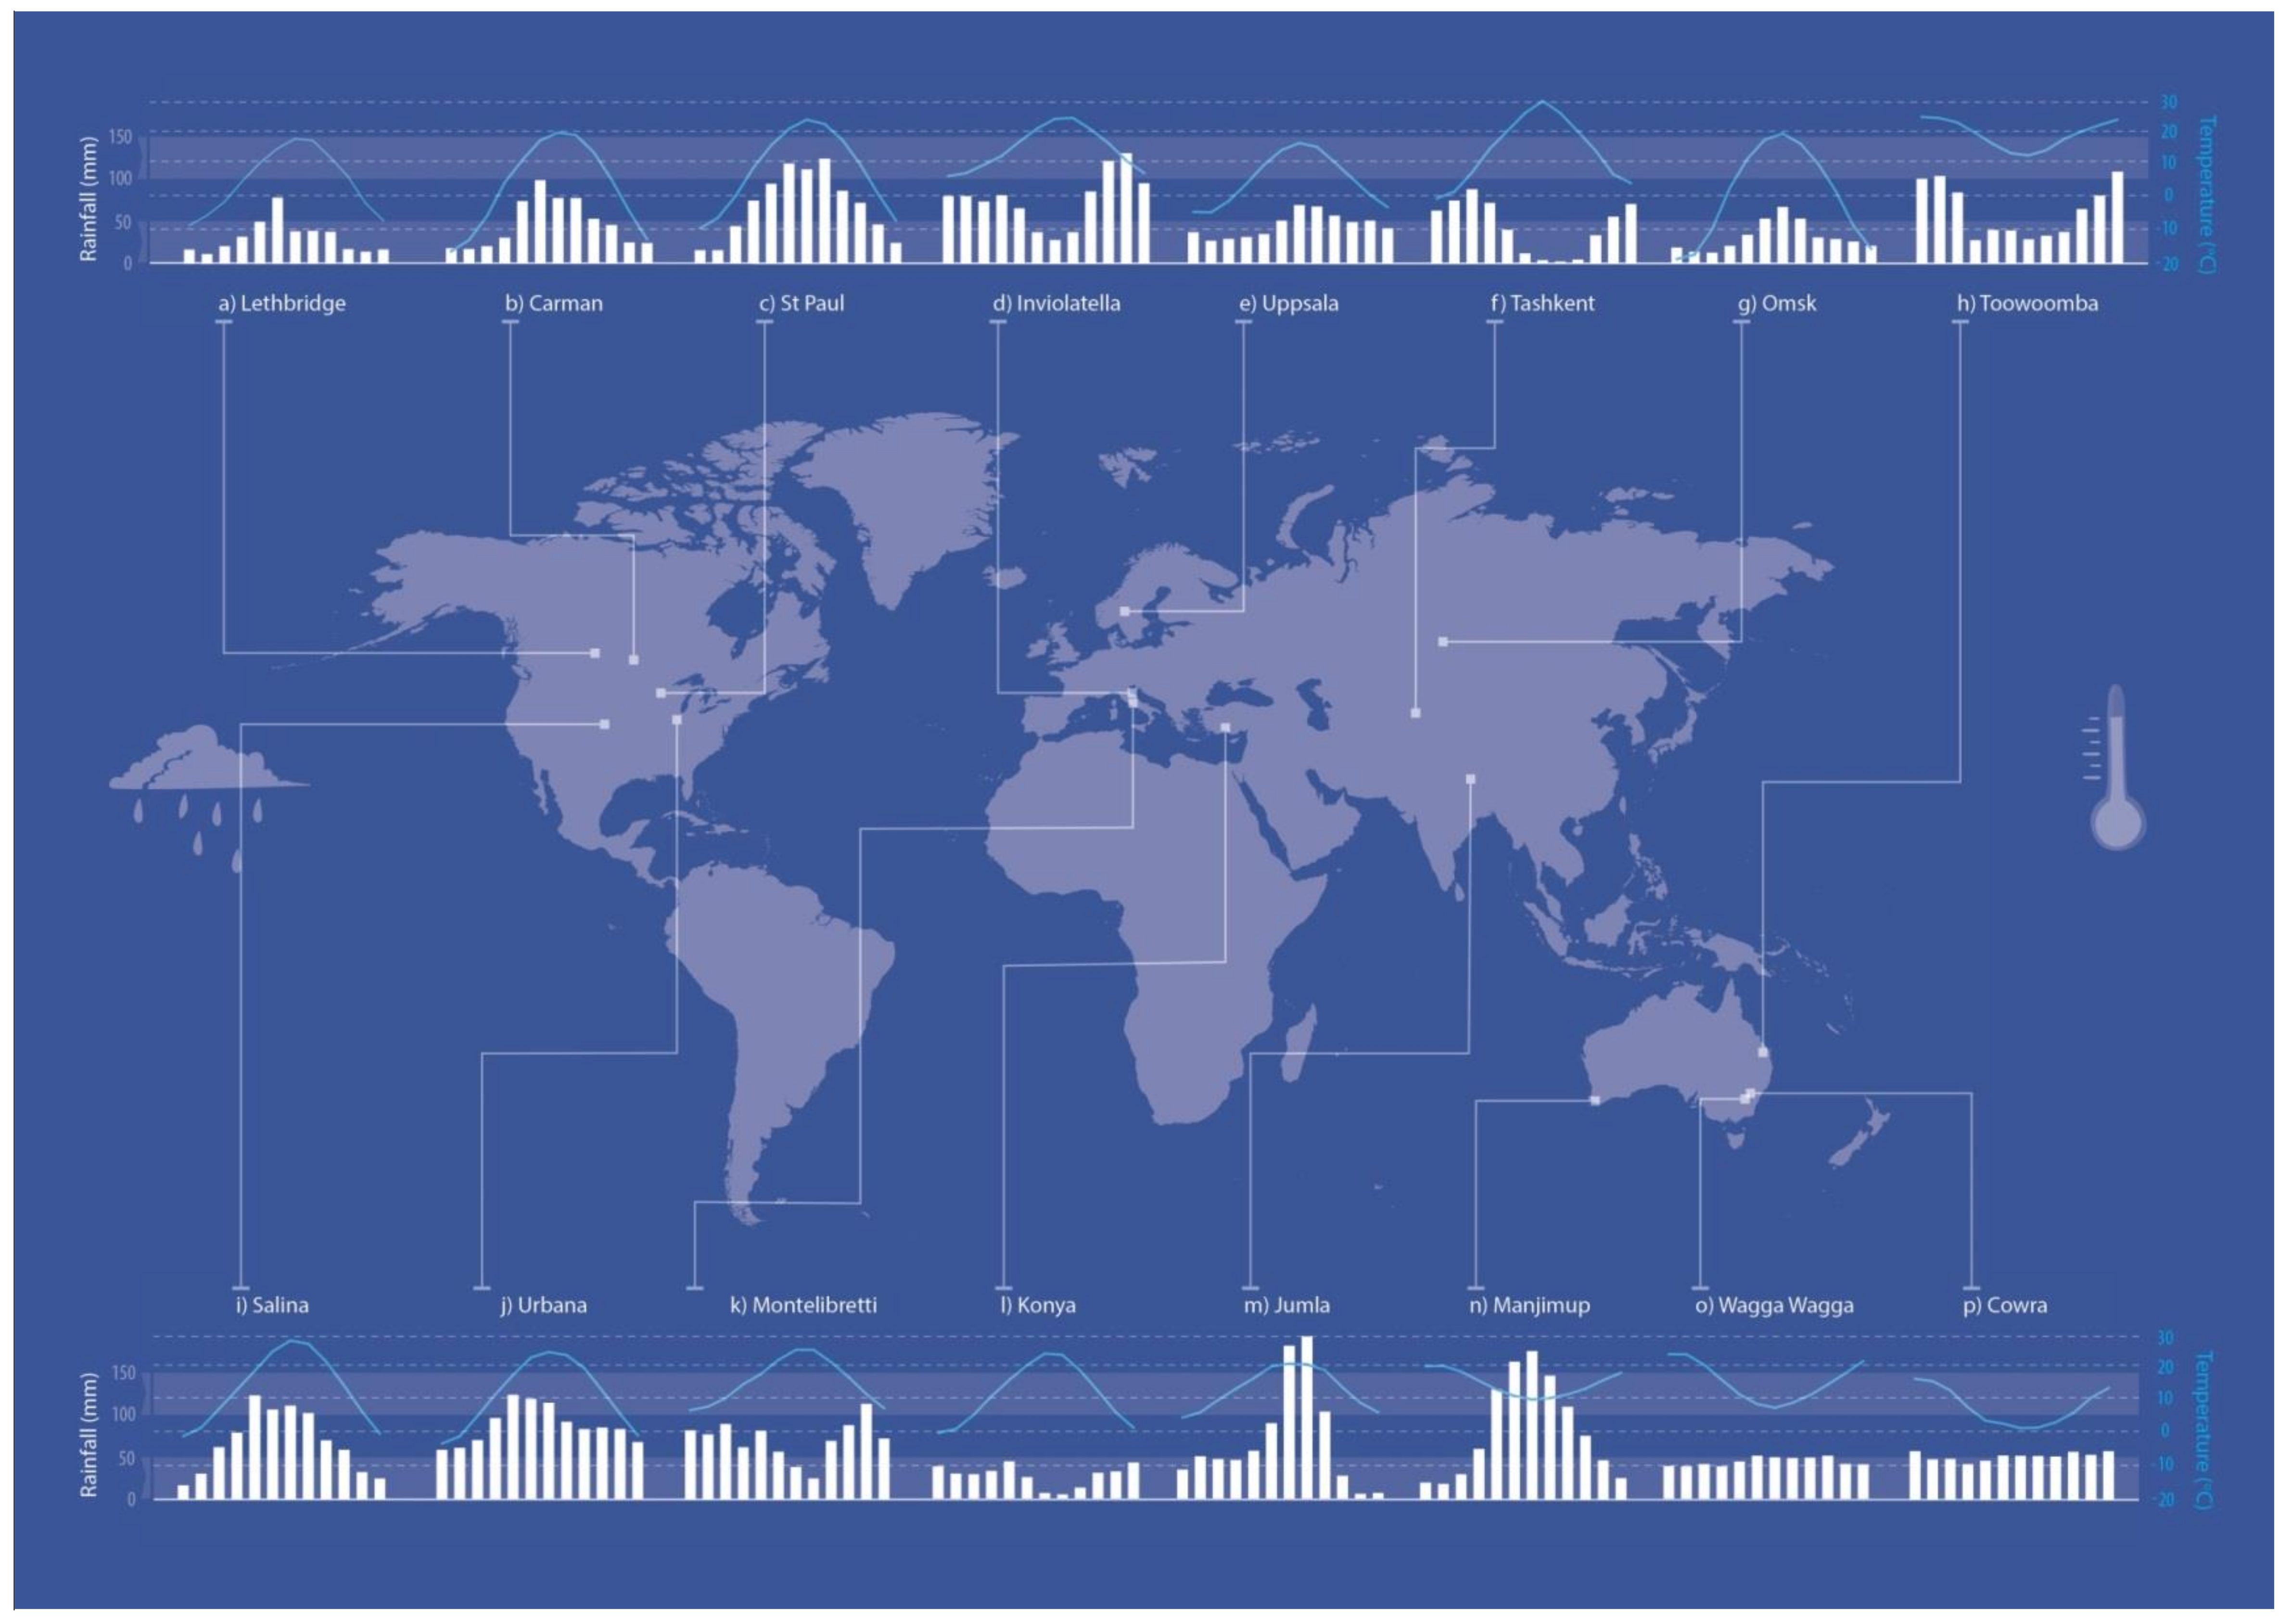
2.1. Sites

Experiments were conducted between 2011 and 2017 at a total of 21 sites, across 9 countries on 4 continents, including two unreplicated “demonstration sites”. Sites were selected by individual site leaders as being broadly representative of local agricultural environments, where perennial grains were judged to offer reasonable prospects of adding value to existing production systems. Site locations are marked on Figure 1, along with long-term rainfall and temperature data. The network of sites represents a diverse range of climates from subtropical to cold temperate, a range of soil types [19], and includes a broad spectrum of rainfall quantity and seasonal distribution. Further details of each site are provided in Table 1. In this paper we name each experimental site after the nearest locality or township. In instances where multiple experiments were sown at the same location, we refer to them sequentially as experiments A, B, and C. Sites were grouped for some analysis into “cold” or “mild” winter environments. The cold environments were those that had sub-zero winter monthly average temperatures.
The mild environments located in Australia, Italy, and Turkey generally had relatively mild winters, although summers would typically experience periods of hot and dry conditions (Table 1).

2.2. Experiment Design and Germplasm

Each experiment was laid out in a randomised design replicated three times, with ‘entry’ as the treatment. Here, the term ‘entry’ refers to any line, accession, or cultivar included in the experiment for evaluation. Plots comprised one single 1 m furrow sown with 25 germinable seeds of a particular entry, surrounded by 0.5 m of buffer (bare ground) on all sides. Seed was sown by hand into a cultivated seed bed at the normal time of sowing for winter wheat at each respective site. There was a consistent treatment list for as many sites as possible to allow cross-site comparison, however, in some instances there was some variation in the entries included at a particular site. For example, state quarantine regulations in Western Australia at the time of experimentation precluded the import of some wheatgrass derivatives, and limited the range of pedigrees that could be tested at that site. A full list of entries and the sites at which each were tested is provided in Table 2.
Seed for this study was obtained from a small number of sources and distributed to the global network of sites. Seed for the 2011 experiments was predominantly sourced from the Cowra Agricultural Research and Advisory Station, New South Wales, Australia [9,17,20]. Seed for the experiments in the northern hemisphere in 2015 was sourced from The Land Institute, Kansas, USA. Seeds of experimental lines for perennial barley and perennial rye were provided by the Swedish University of Agricultural Sciences, Uppsala, Sweden, and Agriculture and Agri-Food Canada, Lethbridge Research and Development Centre, Lethbridge, Canada, respectively. Seeds of the control lines of wheat cv. Wedgetail and of the perennial grass, mountain rye (S. strictum), were also harvested from plots in previous experiments in Australia. Seed of the perennial forage grass, tall wheatgrass (Th. ponticum) cv. Dundas, was sourced in Australia from a commercial supplier. Each experiment included a “local grass” and a “local wheat” control. These were lines or cultivars considered to be well-adapted to the local environment. Seeds of the local controls were sourced for each experiment separately from local suppliers.
Seed for this study was dispatched in two discrete batches or “cohorts”, the first in 2011–2012; the second in 2015. A broader range of pedigrees was tested in the second cohort compared to the first, including a small number of lines derived from barley (H. vulgare) or cereal rye (S. sereale). Two demonstration sites (Figure 1) were not replicated due to a paucity of seed. Seed for these experiments was harvested from the experiment at Konya, Turkey, and sown at the new sites the following year. The demonstration sites included only a subset of entries from the experiment in Konya (cohort 2).

2.3. Management

In general, plots were managed according to what was considered standard local practice for growing wheat, or for the particular requirements of the respective sites. As such, there were no fixed protocols for the application of irrigation, pesticides, or fertilisers, but the over-arching philosophy at each site was to manage so as to maximise the performance of the entries tested. Specific details of irrigation, pesticides, and fertilisers applied to each site are provided in Table 3. Sites were maintained for up to three years but more commonly for two years beyond which few experimental lines persisted.

2.4. Sampling

Seedling density was counted several weeks after sowing, when seedlings of most entries had developed their third leaf. Relative density over time was estimated by assessing basal frequency. Basal frequency is a measure used to assess density of perennial plants where individuals cannot be reliably distinguished using non-destructive means [21]. The method was adapted for the present study to accommodate the single sowing row, and the large quantity of standing stubble following grain harvest that prevented a quadrat being laid on the soil surface directly over the plot. A 1 m length of mesh divided into 40 squares, each 25 × 25 mm, was laid beside the plot. The number of squares that lay directly beside the base of a live plant was counted with values expressed as a percentage. Basal frequency was assessed in spring year 1, and then at the end of summer in subsequent years. Phenology was assessed by recording the date at which anthesis first occurred in each plot. Plots were harvested when plants of a particular entry had reached full maturity. Plants were deemed mature when the peduncle had undergone complete colour change. All plots sown to a particular entry were harvested on the same day, but there was usually a period of several weeks between when the first and final entries were harvested. Once mature, herbage was cut at a height of approximately 100 mm above the soil surface, dried at air temperature over several weeks, if required, and weighed. Grain was threshed from the complete plot, weighed, and the harvest index was calculated. A subset of 100 grains was taken from each plot and weighed to calculate the mass of 1000 kernels (TKW). Grain yield data is expressed on a per plant basis in year 1 only, as individuals could be reliably distinguished and so grain yield values were not confounded by differences in plant density. Beyond year 1 grain yield is expressed on a per plot basis.

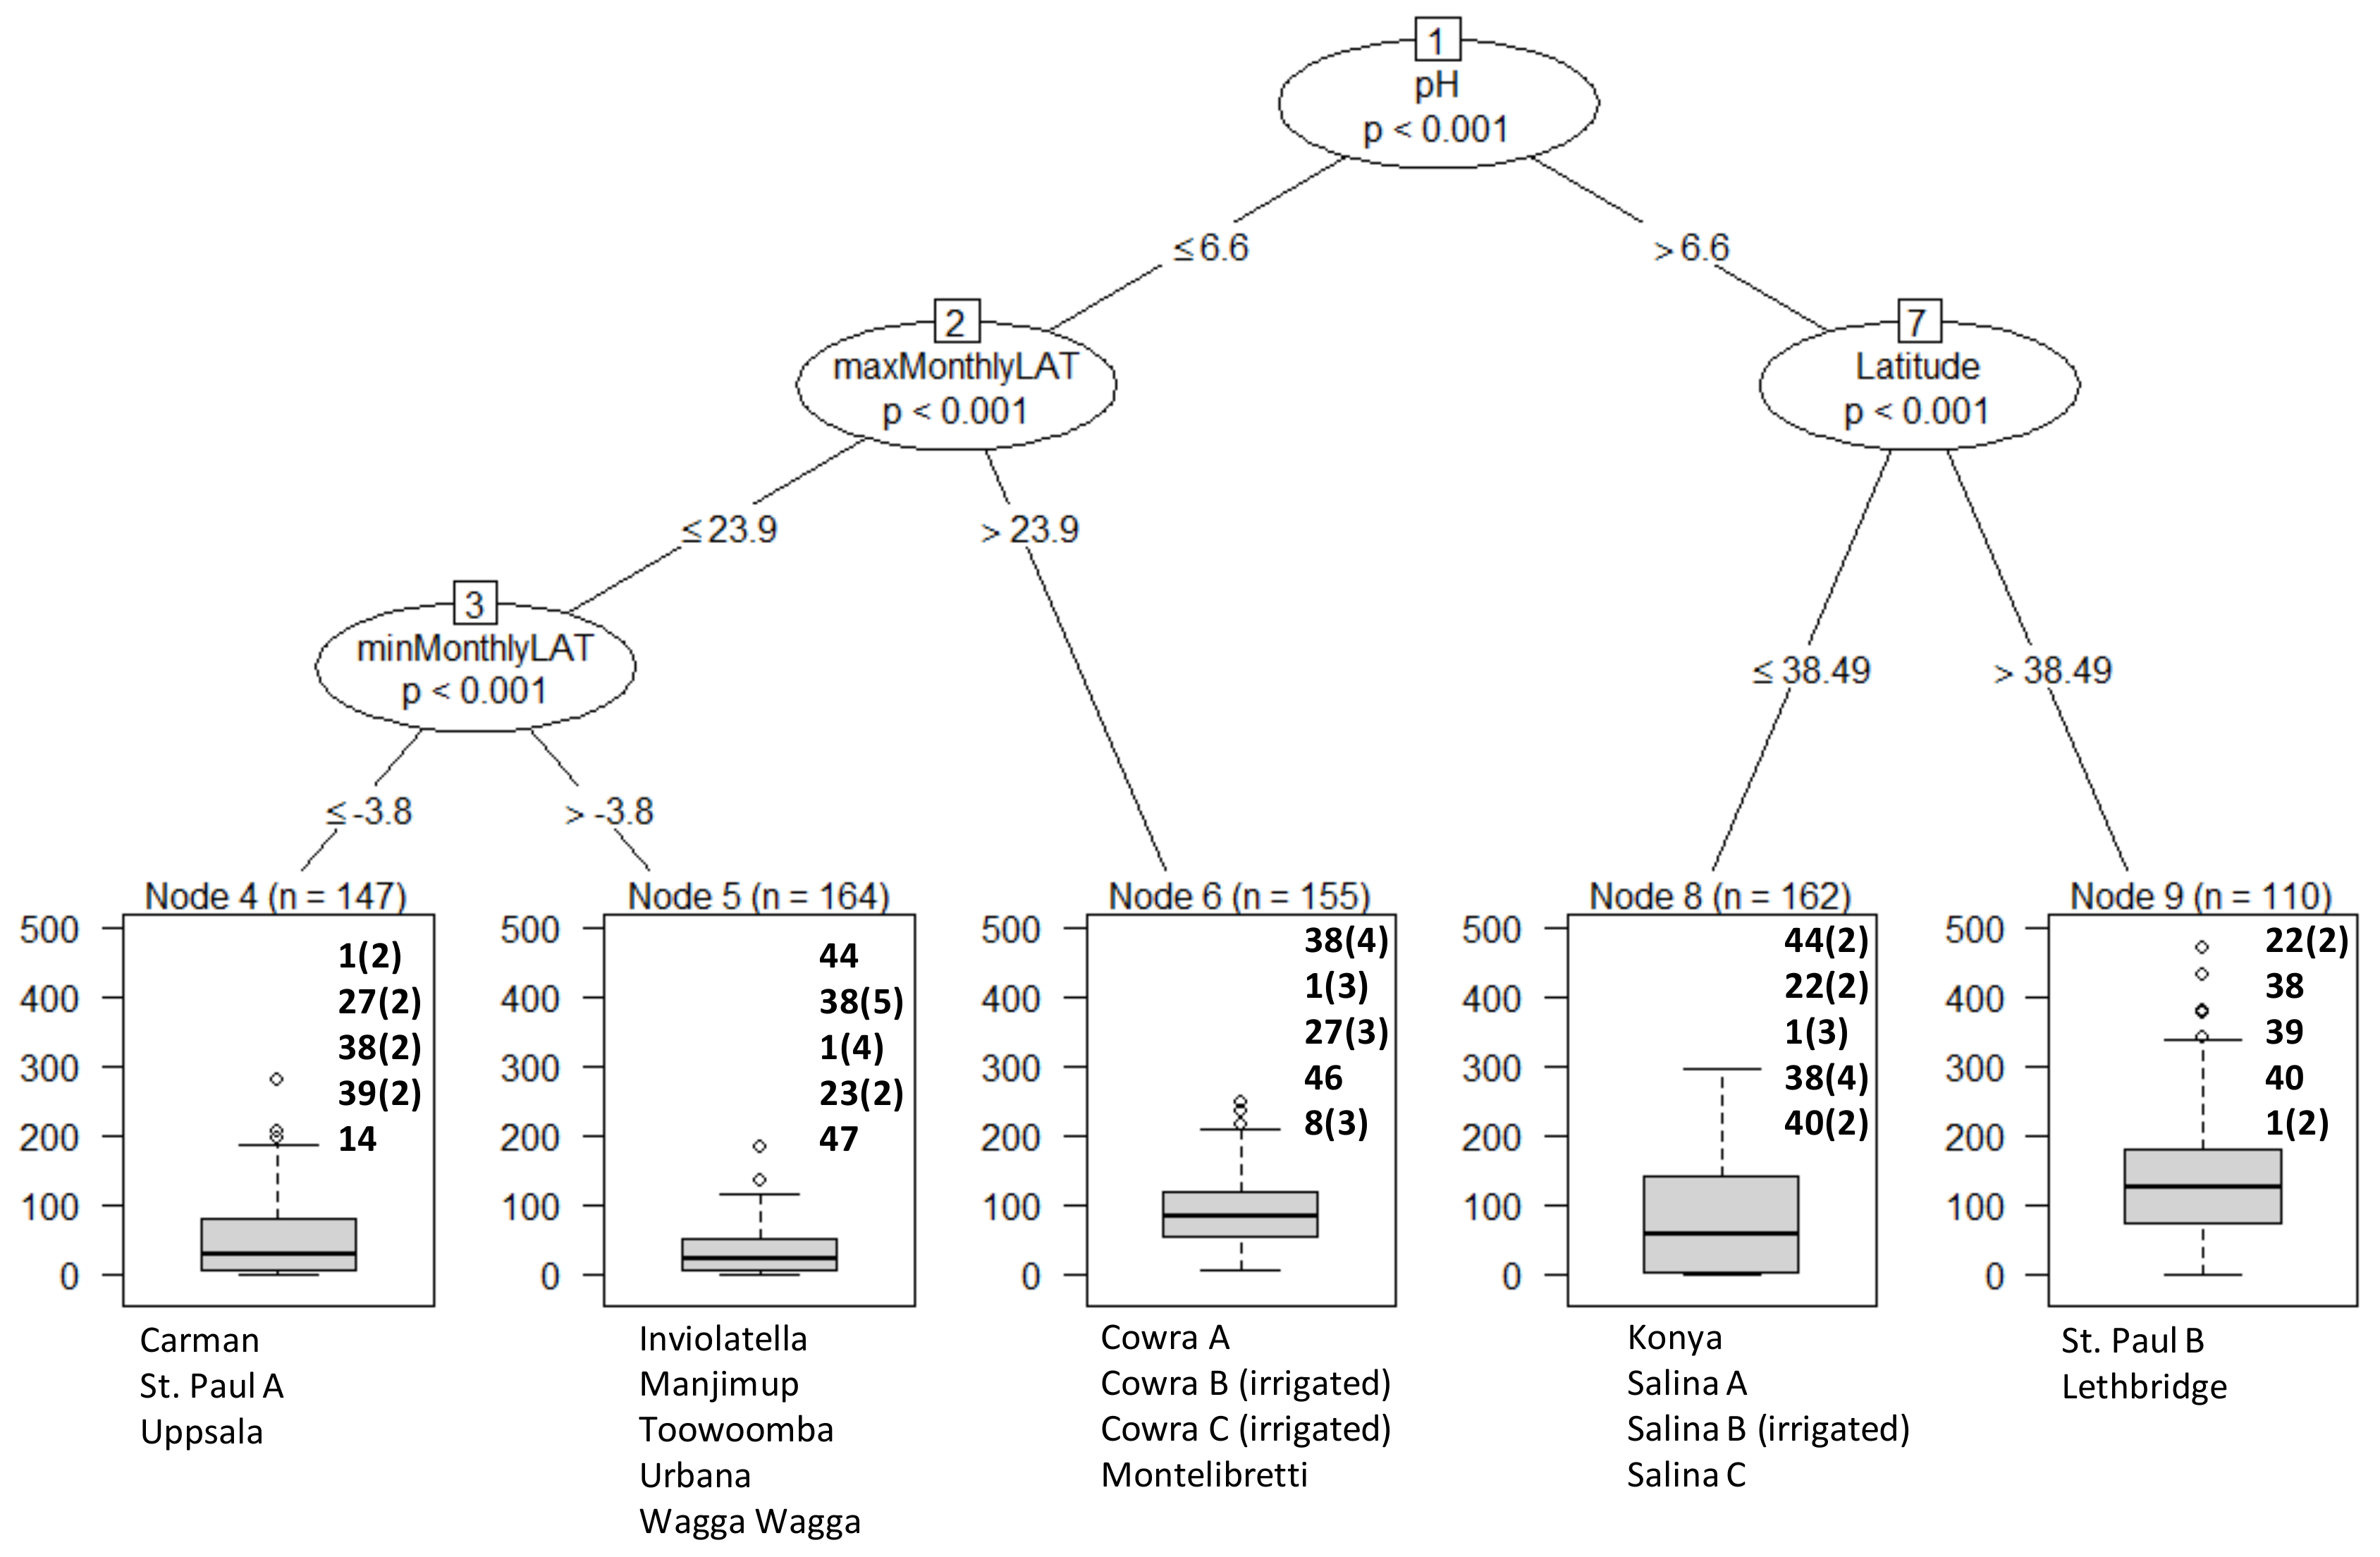
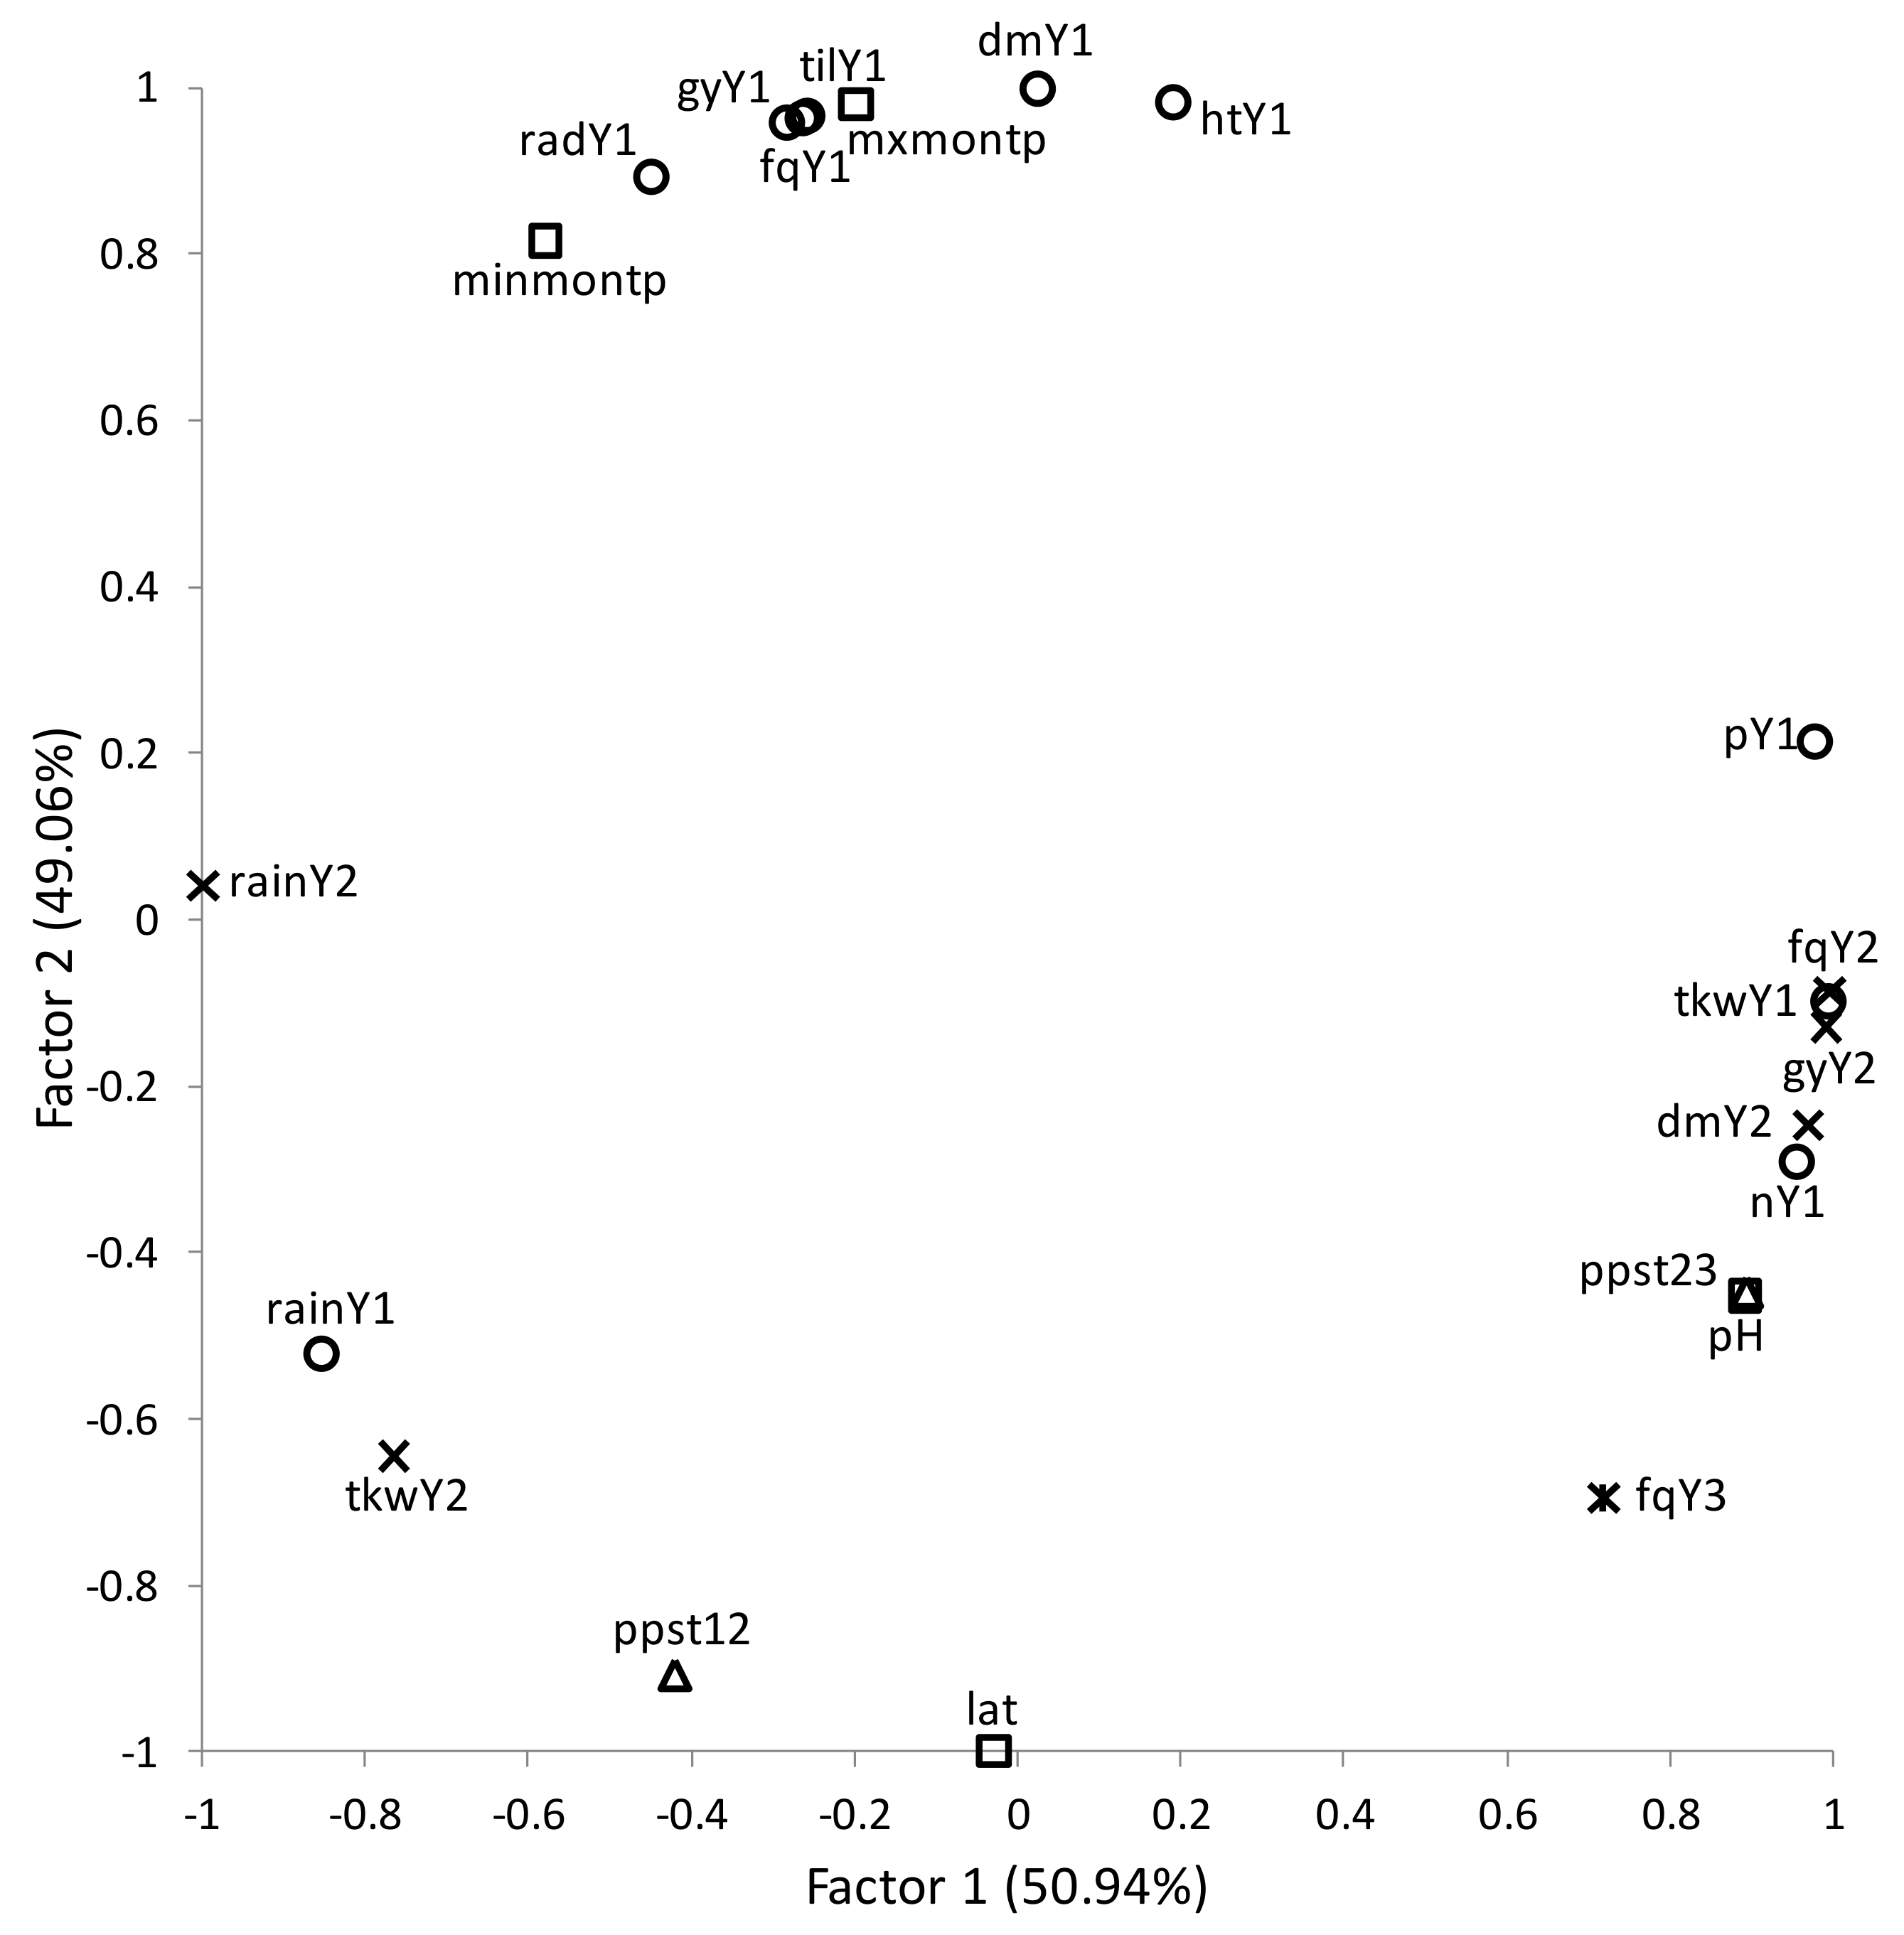
2.5. Statistical Analysis
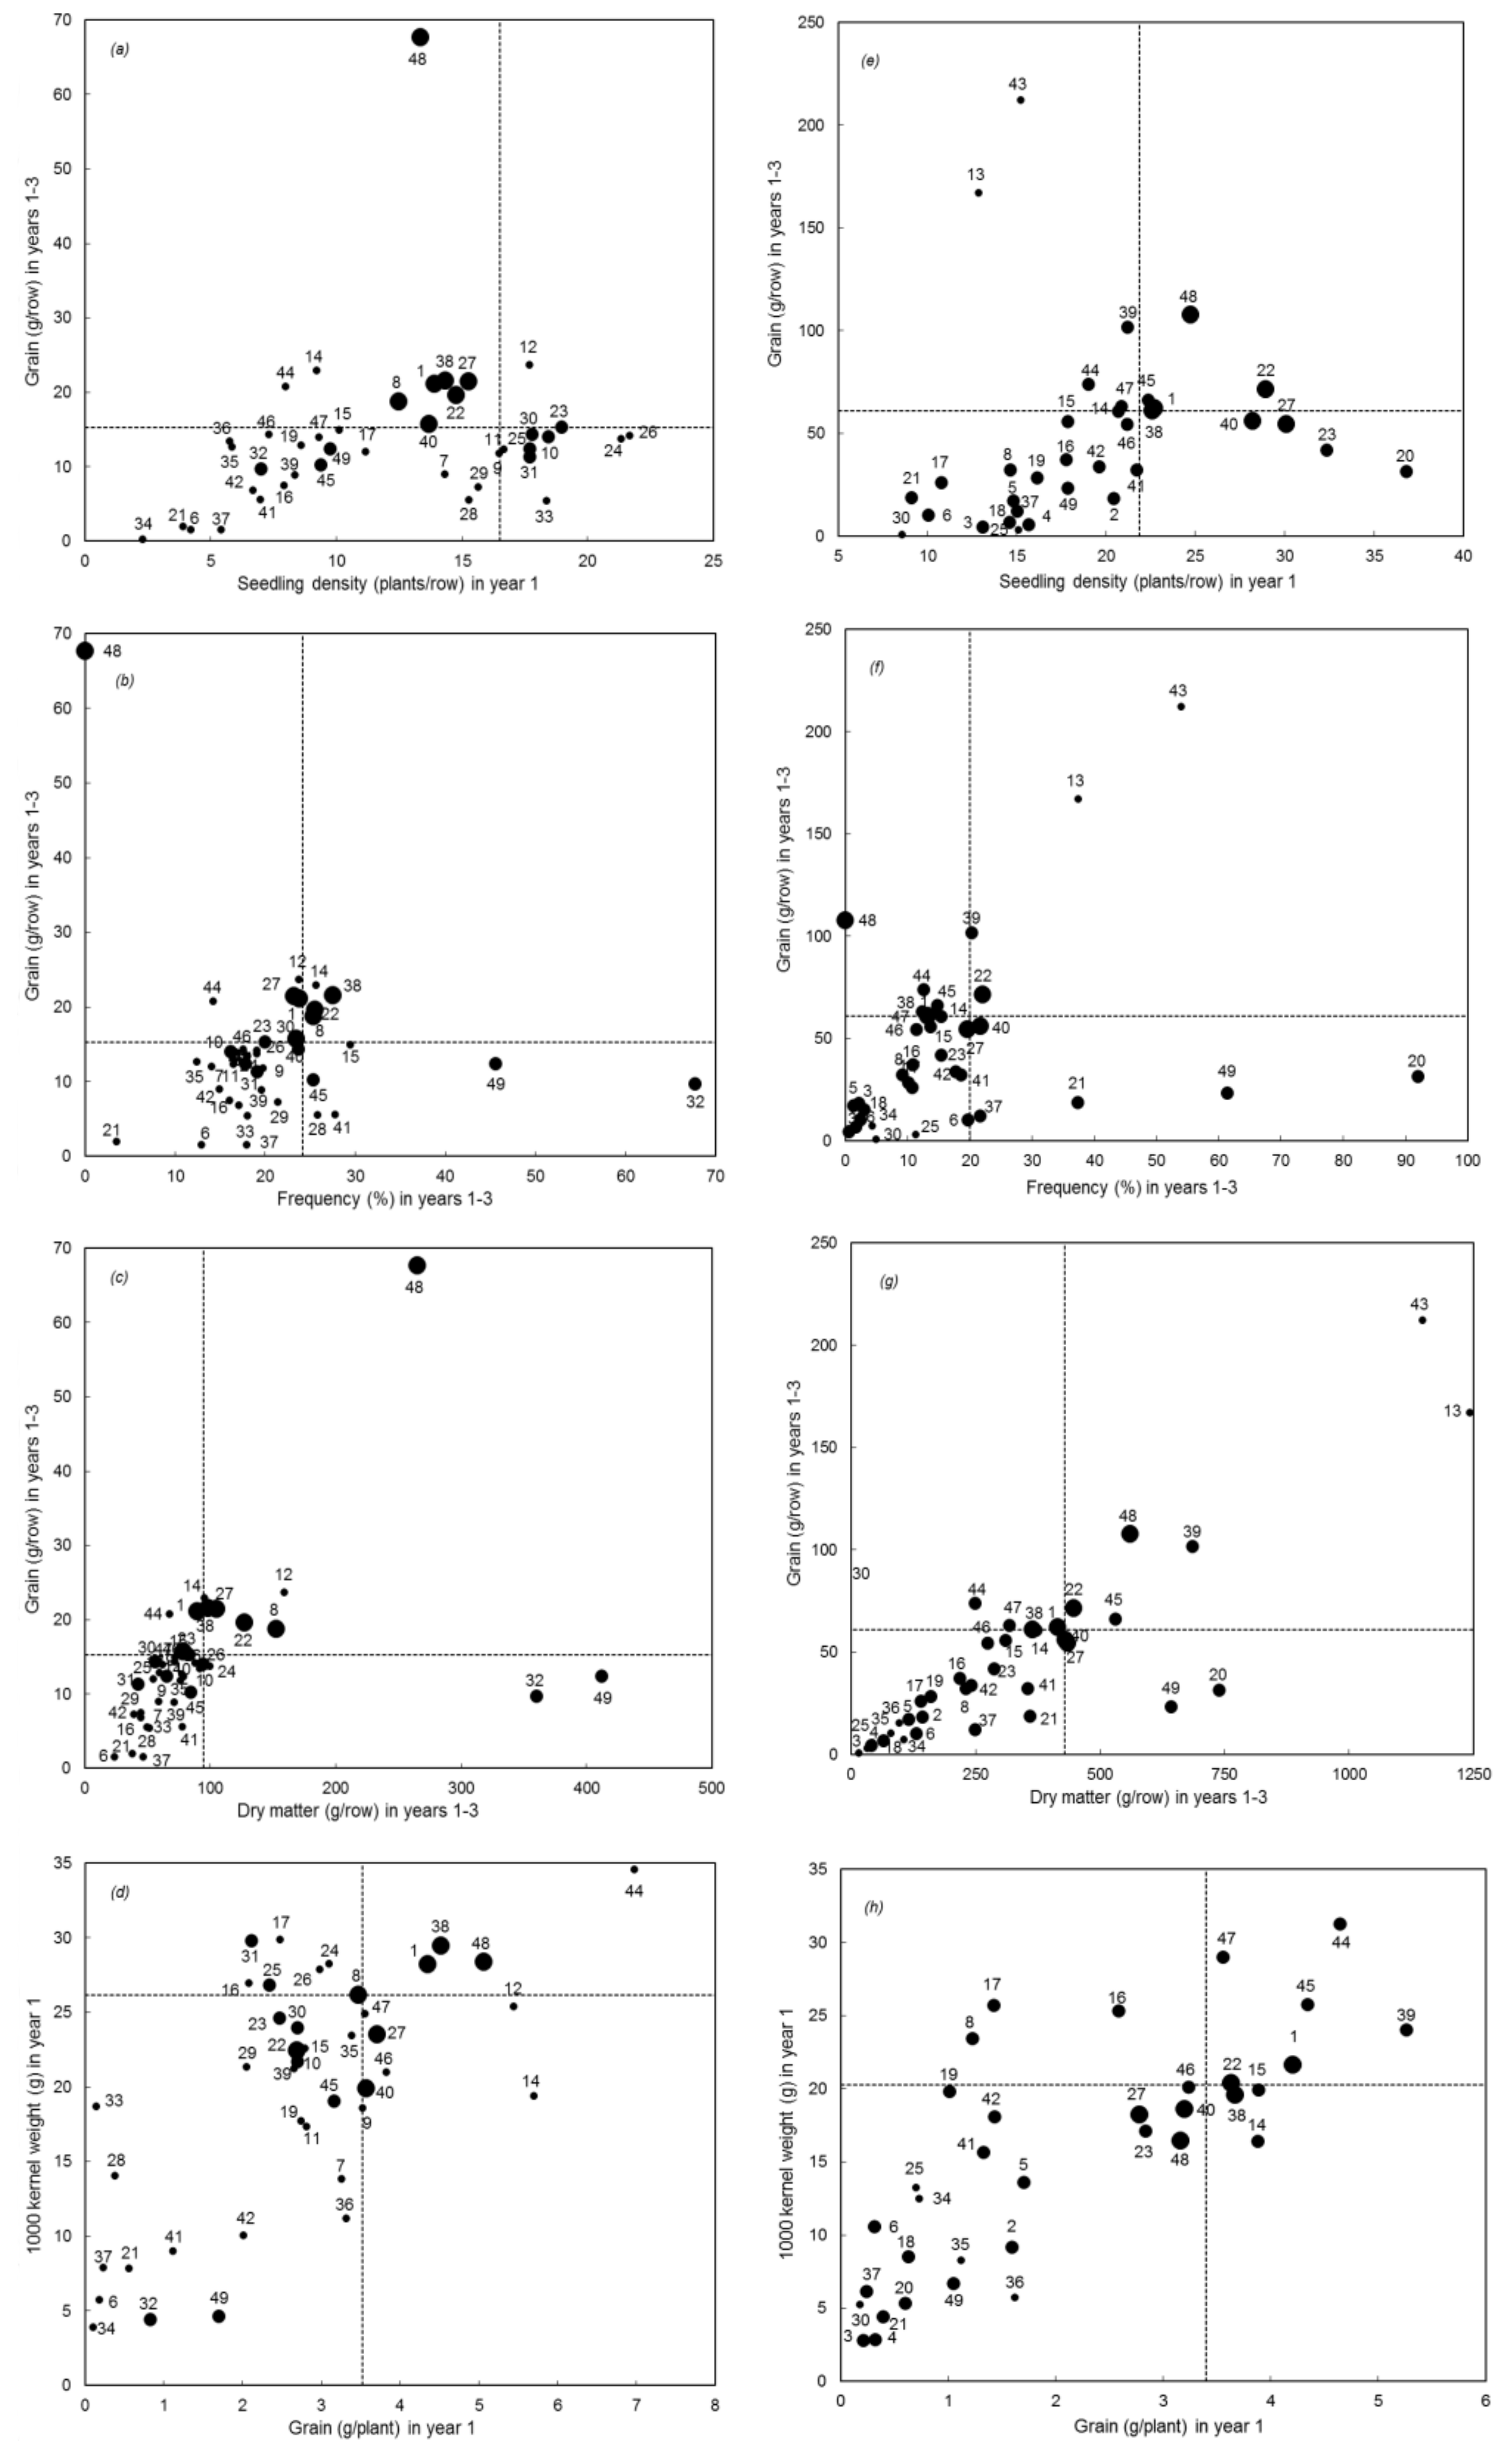
Principal component analysis (PCA) was completed to reduce the large number of observed variables measured in this experiment—that were in some cases correlated—into a small set of uncorrelated artificial factors where relationships from the large number of variables could still be deciphered. Data used in this analysis was unbalanced. Four perennial wheat lines (ID numbers 1, 22, 27, 38; Table 2) out of a total of 44 entries tested were consistent across all trials, and the combined mean of these lines for each trait was used to generate relative percent values for each line at each location. This was the case for all traits except for year one heading date, where the heading date of perennial lines was calculated as the relative difference to the locally adapted wheat check in each experiment. Data from 18 sites was used in the analysis; Omsk, Jumla and Tashkent data was not used due to a reduced number of variables measured at those locations. The PROC FACTOR procedure in SAS (ver. 9.3) using the Method=Principal statement was used to complete the analysis with the prior communality estimate set to one. The mineigen = 1 statement was used to ensure components with eigenvalues >1 were used in the model. The rotate = varimax statement was used which specifies that uncorrelated components are generated. The scree plot indicated that only two principal component factors were required to explain 100% of the total variance (PC1 = 50.94% and PC2 = 49.06%).
To explore the influence of environmental factors on the performance of the perennial hybrid lines, the data was filtered to include only the perennial wheat hybrid lines, excluding the perennial and annual check entries. Environmental factors tested in the linear model included maximum and minimum monthly long term average temperatures, the 12 months accumulated rainfall from the date of planting, the site latitude, elevation, and pH (Table 1). The factors were tested in the model for multicolinearity by calculating the variable inflation factor for each factor in the ‘car’ package in R [22]. Elevation was removed from the model due to collinearity with latitude. The response variable of year 1–2 persistence—that is the change in persistence from year 1 to year 2—was calculated by dividing the 2nd year basal frequency by the 1st year basal frequency. Persistence data was available for 11 of the 21 experiments. Conditional inference tree framework from the R package “party” was used in unbiased recursive partitioning of environments [23] for comparisons of a conserved set of genotypes planted in at least six experiments. A Bonferroni multiplicity adjusted P-value of α = 0.05 was used as a stop criterion.
A scatterplot was created using the “ggplot” package in R to investigate the relationship between the persistence of lines between years 1 and 2 and the Thinopyrum parental species of all 42 perennial wheat hybrid lines based on the pedigrees presented in Table 2. First and second year basal frequency was recorded in 11 of the 21 trials. The observations of persistence were plotted across the latitude of the trials. If multiple trials were planted in the same location, 0.01 degree was added to subsequent trials with duplicated latitudes to distinguish the trials.
The site at which these entries have previously been most evaluated is Cowra, Australia, where the present experiments at that site were sown in the same field immediately adjacent to the location of several previous experiments. A comparison of relative yields between the previous and present experiments was conducted for this site with an unbalanced analysis of variance (ANOVA) in Genstat Nineteenth Edition [24] that compared genotype, experiment (defined by the year of planting), year of measurement, plus all two and three-way interactions.
Further analysis was performed to summarize the performance of individual lines across environmental groupings. We grouped the experiments by temperature because of its close relationship to many plant growth factors including grain yield, biomass, and heading date (further discussion in the results). The two environmental groupings included mild and cold winter environments, cold environments being defined as having at least one month with an average temperature of less than 0 °C. A number of attributes, including initial seedling density, grain yield, and kernel size in year 1 as well as plant frequency, dry matter, and annual grain yield over 1–3 years, were used for evaluation of the performance of entries using the approach of Smith et al. [25] for the analysis of multi-environment trial data in ASReml [26]. For the data from one year of measurement only, such as seedling density, grain weight per plant, and 1000 kernel weight, each site was treated as an environment. For the data of multiple measurements across 2–3 years, such as plant frequency, dry matter, and grain yield, each site and year combination was regarded as an environment. All data was square-root transformed before analysis to normalize variance. The predicted means from the multi-environment analysis for individual attributes were back-transformed and presented in a number of pair-plots for visual assessment of both attributes selected. Genotypes above the 75th percentile are to the right of, or above, the dotted lines for the selected attributes. Therefore, genotypes in the upper right quadrant of the graph were among the top 25% of performers for both attributes, while those in the lower left quadrant were among the bottom 25% of performers for both attributes. The genotype with a large dot in the final figure represents the data from more than 7 sites, thus taking more weight than those with small dots (1–3 sites) and medium dots (4–6 sites).
An overall performance index was calculated by averaging the plant frequency (persistence), grain yield, and grain size for each site-year under mild and cold winter environments, respectively, and ranking the relative performance of each genotype within each environmental grouping by giving each of the three traits an equal weighting. The index of each individual genotype was compared with the crop and grass controls separately under each climate environment. A P-level was provided to indicate the probability of a genotype being superior or inferior to the crop or grass control using the ANOVA Contrasts procedure in Genstat Nineteenth Edition [24]. Genotypes that were present at only a single site within a climatic grouping were included in the analysis, but excluded from the ranking because of their low level of overall representation. Genotypes excluded from ranking included the barley-derived lines (IL107 and IL118) at the Cowra C and Konya sites, respectively, and, in the cold winter environments, the perennial rye lines ACE-1 and Reimann-Phillips at the Lethbridge site, and CPI147281b and CPI148055 at the Jumla site.

3. Results

Principal component analysis (PCA) of the site variables was completed to decipher the relationship between specific environmental and measured variables at each location. In examining the biplot (Figure 2) three cluster groupings can be observed. First year production variables including grain and biomass yield, number of tillers, height, and frequency were largely explained by principal component 2. The environmental variables, minimum and maximum monthly temperatures, were also clustered within this grouping, indicating a relationship with high first year productivity and warmer temperatures. The second cluster of variables associated with high positive eigenvalues for principal component 1 can be observed, and was generally associated with production traits measured after year 1, such as second year grain and dry matter yields and frequency in years 2 and 3. Fertilizer nitrogen and phosphorus inputs also cluster with these variables. A third, less tightly grouped cluster with negative eigenvalues for both PC1 and PC2 was observed which included the environmental variable of precipitation, but also provides an indication of variables that are inversely related to the two other clusters such as grain size in year 2.
Latitude was the most significant environmental parameter impacting persistence between years 1 and 2. The Uppsala and Lethbridge sites at high latitude had a slightly higher mean and a greater proportion of observations with high persistence (third quartile ≈ 1; Figure 3). The experiments grown at lower latitude sites (≤44.59°) were distinguished by maximum average monthly temperature, with milder (≤23.2 °C) sites (Manjimup, St. Paul A & B and Toowoomba) exhibiting lower mean persistence. In lower latitude warmer conditions, sites with higher rainfall accumulation (>512.8 mm in Cowra C, Inviolatella, and Urbana) had slightly higher mean persistence than the lower latitude warmer sites with less rainfall (Cowra A [not irrigated] and Cowra B). Some individual genotypes, such as ID numbers 6 (12G401 F2), 8 (20238), 37 (Mt-2), 22 (CPI147235a), and 41 (P15) were observed to be in the top 5 lines for persistence across multiple groupings of environments. Three of these highly persistent lines (6, 8, and 37) were derived from Triticum turgidum subsp. durum (Desf) Husnot as the annual parent (see Table 2). Others had high persistence within a specific grouping of experiments, such as lines 23 (CPI147236a) and 27 (B373) in the low latitude, lower temperature environments. The only lines that ranked in the top five in multiple environments for average persistence between years 2 and 3 in were genotypes 6 (12G401 F2), 8 (20238), and 37 (Mt-2; data not shown), all durum derived perennial wheat lines.
As latitude increased, persistence generally increased and Figure 4 plots the relative persistence of all lines at the 11 sites at which the persistence data is available, distinguished on the basis of the perennial wheatgrass species from which the line was derived. Although somewhat site dependent, a trend was observed where the better persisting genotypes at higher latitudes were generally lines derived from Th. intermedium. At lower latitudes (<41.57°), lines derived from either Th. ponticum or Th. elongatum tended to have higher persistence. A notable exception to this trend was the Cowra A site that was not irrigated, where primarily Th. intermedium derived lines persisted, albeit at low levels.
The most significant environmental factor affecting first year grain yield was soil pH, with high pH (>6.6), higher latitude (>38.49°) environments producing higher yields than the experiments at higher pH and lower latitudes (Figure 5). For lower pH sites, higher maximum temperature (>23.9 °C) sites had higher yield. Lower temperature, lower pH sites were differentiated by minimum monthly temperature with cooler minimum temperature sites having marginally higher yields. Entries 1 (11955) and 38 (OK7211542) ranked in the five highest yielding lines in all environmental groupings.
An analysis that divided sites into two environmental groupings based on the relative severity of the winter stress imposed showed that there was little consistency in the grain yield of lines between the cold and mild environments. Line 22 (CPI147235a) was the only entry in the top quartile for both grain yield and persistence (frequency) over the experimental period (up to 3 years) in both the mild and cold winter environments (Figure 6b,f). There was generally a positive linear relationship between aboveground biomass (dry matter) and grain yield over the experimental period in both groupings, although the perennial grass check (line 49) as well as the intermediate wheatgrass selections (lines 20, 21, and 32) tended to be outliers with lower grain yields (Figure 6c,g). A large number of lines produced grains in year 1 that were as big or bigger than the crop control in the cold winter environments, including entries 1, 22, 39, 44, 45, and 47 which all appeared in the top quartile for grain size and year 1 grain yield (Figure 6h). In the mild environments lines 1, 38, and 44 were similar to the crop control for year 1 grain yield and grain size (Figure 6d). The intermediate wheatgrass and perennial grass controls ranked amongst the lowest for grain size in both cold and mild environments, although hybrid lines such as 3, 4, 6, 30, 34, 36, and 37 also ranked poorly for these attributes.
A significant (P < 0.001) genotype × site year × sampling year interaction was observed for grain yields compared at the Cowra site between present and previous experiments (Table 4). Yields of all hybrid entries generally declined with time, in contrast to the perennial grass lines (entries 32 and 49) which often increased beyond year 1. On two occasions the crop control (entry 48) was resown into the same row in year 2, and in both instances the grain yield was numerically lower in year 2 compared to year 1, although in 2013 differences between years were not significant (P > 0.05). Only in the experiment sown in 2008 were four successive grain yields observed for any of the hybrid lines. In all other experiments only two successive grain yields were achieved, including for the two lines (entries 27 and 28) previously observed to be longer lived.

Overall Performance

Based on an index that gives equal ranking to grain size in year 1, total grain yield over the experimental period (1–3 years), and persistence (frequency in years 2 and 3), there was some commonality in performance of lines between cold and mild environments (Table 5). Entries 1 (11955) and 44 (Summer 1) were ranked in the top five of both climatic groups. At the cold environments, the top two ranking lines, 39 and 44, were superior to the perennial grass and the annual crop controls (P < 0.05). The 12 lowest ranking entries in the cold environments were inferior (P < 0.05) to both the crop and perennial grass controls. Only one entry in the mild winter group, 38 (OK7211542), was found to significantly outperform the crop control (P < 0.05) but 11 entries performed significantly better (P < 0.05) than the perennial grass control. The seven lowest ranking lines in the mild environments were inferior to the perennial grass control, with the crop control performing significantly better than the 17 lowest ranking entries in this group. There was little consistency in the lowest ranked entries between the two climate groupings.

4. Discussion

4.1. Wheat Derivatives

This large study was conducted over multiple sites across nine countries in four continents and showed that the existing experimental material is all relatively short-lived (≤3 years). One of the goals was to expand perennial cereal testing to determine if some of these early generation perennial lines showed adaptation to specific locations throughout the world. Principal component analysis (PCA) indicates that first year grain and biomass yield are grouped with regions of higher maximum and minimum monthly temperatures and lower latitude (Figure 2). Furthermore, frequency in year 3 is inversely related to minimum monthly temperature. This indicates that, generally, the present lines are more adapted to mild climates. Anthesis date has been shown to be one of the major factors in determining adaptation of wheat varieties to specific regions, particularly to avoid heat stress during the summer growing season [27]. In the PCA, heading date clustered with year 1 grain and biomass yield variables as well as average monthly temperatures, and was inversely related to latitude, meaning that as perennial wheat lines moved to more northern or southern climates the heading date of perennial wheat lines became closer to the adapted wheat check. Although first year grain yield was higher in mild climates where there was a greater separation between adapted wheat checks and the perennial lines, this may be related to the lines surviving the first winter better in mild climates. This difference relative to adapted wheat checks should be examined further to determine if selecting heading dates more similar to the adapted checks might benefit the development of perennial wheat. It also means that breeding for perennial wheat in Sweden or Canada may not provide adapted germplasm for Italy or Australia.
The PCA provides an indication of variables that may influence productivity of early generation perennial cereal material. The lack of a relationship between grain and biomass yield variables measured between the first and second years is noteworthy (Figure 2) and seems to indicate that, based on the germplasm evaluated, second year grain and biomass yield cannot be predicted by first year results but are more closely related to the survival (density) of plants in year 2. This learning is broadly consistent with perennial forage research more generally, where first year performance rarely provides an indication of performance over the life of the plant (for example, [28]). This highlights the importance of developing better adapted and longer lived perennial cereal material in order to fully understand the prospects and potential of this novel perennial cereal technology. It seems inevitable that the production potential and ecosystem services that perennial cereals might confer to farming systems and to the broader agro-ecosystem will remain poorly understood until the agronomic traits of longer-lived breeding material can be evaluated.For plant breeders, this also means that development of perennial wheat lines may be considerably slower than conventional cereal breeding and will require at least two years per breeding cycle, but this challenge has long been met by perennial forage plant breeders.
Several environmental variables clustered with grain and biomass productivity variables in the PCA. Variables for nitrogen and phosphorus fertilizer inputs as well as soil pH, which may be used as a proxy for soil type, grouped together with second year grain and biomass yield variables (Figure 2) and soil pH was the primary factor in partitioning variation for grain yield (Figure 5). Clustering of these variables provides an indication that agronomic management may play a role in improving productivity beyond year 1. The analysis also revealed a relationship with increased yields and lower rainfall in year 2. This was somewhat surprising, however, one hypothesis is that increased second year moisture might encourage higher levels of biomass on these perennial lines during the fall and winter months and reduce the resource allocation to grain yield in year 2. This seems contrary to what is observed in perennial grasses, however, a number of the hybrid lines evaluated show a perpetual flowering phenotype in the field and high moisture may encourage regrowth and an exhaustion of resources for the following year. Similar to previous studies [17,20,29] we observed that once the conditions of vernalisation and photoperiod were met to induce flowering in year 1, there was no reset to a vegetative phase following grain harvest. Under certain environmental conditions these plants were able to persist. A better understanding of this relationship may help derive hybrid perennial wheats which remain vegetative through the fall and winter, leading to improved persistence, similar to perennial rye (see later section).
Another unexpected result was that grain size was not correlated with yield in either year of production (Figure 2 and Figure 6d,h). Since grain size is a yield component, we expected it to cluster with grain yield. Tightly correlated with grain yield in year 1 was the number of tillers, indicating the importance of this trait in perennial wheat grain yield. In annual cereals, grain yield formation is relatively straightforward with yield per unit area determined by the number of tillers per unit area × seeds per spike × seed size. In the case of perennial cereals, issues with chromosome pairing during meiosis means that there is a high level of floret sterility and a complete seed set in the spike is rare [13]. This reduces the influence of seed size and number of seeds per spike as yield components making the number of tillers the predominant yield component in perennial cereals.
This study was unable to identify a particular pedigree that was shown to confer consistent superiority across environments. Although not all lines from a particular pedigree behaved similarly there were lines derived from Th. intermedium, Th. ponticum, and Th. elongatum crossed with a diversity of wheat parents, that were superior in terms of grain yield, grain size, and plant persistence [17,30,31]. We did observe a trend across this network of sites where lines derived from Th. intermedium were at an apparent advantage at higher latitudes compared to Th. ponticum and Th. elongatum material which were generally more persistent at lower latitudes, but this was by no means universal as other site factors obviously contributed to the results (Figure 4).
The data highlights the importance of using locally adapted material for conferring superior performance in progeny in similar environments, which suggests sourcing parent lines locally when developing a perennial cereal for a specific environment. For example, both lines sourced from the Russian program (39 & 40) ranked favourably in the cold winter environments in the present study that likely share some similarity to the Russian winter, compared to the environments with milder winters where these lines ranked relatively poorly. Similarly, the top ranking entry in the mild environments (38) was developed in Oklahoma, USA [32] which is a milder winter environment than Washington State or even Kansas, where perennial wheat is presently being developed. To date the majority of perennial wheat breeding work has been accomplished in Russia, USA, and China. The different wheatgrass species used in previous breeding originated from Eurasia and were introduced to the USA and China initially for forage production or the transfer of useful genes into annual wheat. None of them was initially grown for high grain yield [6,33]. Recent progress in the domestication of Th. intermedium reflects how diverse this species is [6]. It would generally be easy to find locally adapted wheat cultivars due to decades of development by a large number of wheat breeders operating across the globe, but identifying adapted perennial wheatgrass may be problematic in many environments where active development of these species is not ongoing, and in many cases, has not been undertaken to date. Careful selection for wheatgrass plants in hybridization could be critical as the final performance of perennial wheat will be heavily influenced by the parent material.
Success in developing forage grasses for multiple challenging environments offers hope that the same can be achieved for the wheatgrasses. Orchardgrass (syn. Cocksfoot; Dactylis glomerata L.) is an example of a species that has been successfully developed to withstand the winter freeze of Canada through the selection of winter-hardiness and the development of the cultivar, Arctic [34], but also selected to withstand the harsh summers of a Mediterranean climate in cultivars such as Kasbah that exhibit a pronounced summer-dormancy mechanism [35]. In this example, broad adaptation of this same species was achieved by concerted breeding efforts to develop adapted cultivars by beginning with material that had naturally adapted to those environments. In the case of cultivar Arctic, breeding of D. glomerata subsp. glomerata material sourced from Russia (via Wales) was undertaken in Canada by Dr P. Jones (D. J. Cattani pers. comms). Breeding and selection of D. glomerata subsp. hispanica material collected in Morocco was undertaken in the semi-arid environment of South Australia by Dr J.A. Carpenter to develop cultivar Kasbah [36]. A sound understanding of the important traits required for specific environments is fundamental to achieving broad adaptation. In more Mediterranean climates, a tolerance of summer drought might be achieved by a level of summer dormancy that allows the plant to ‘avoid’ the drought by reducing plant growth at that time and/or deep roots to increase access to soil water to keep aboveground structures hydrated [37]. At higher latitudes adaptation is primarily driven by winter survival. Winter survival is a very complex trait determined by combinations of frost, desiccation, water logging, ice-encasement, anoxia, and snow cover [38]. Plant processes of cold acclimation (development of cold induced dormancy) and de-acclimation (breaking of the dormancy) represent the beginning and end of the plant processes of winter survival [39]. Light and temperature influence both of these processes [38,39,40] and there can be an interaction between day length and temperature with respect to the success of cold acclimation [40].
Applying this experience to the development of perennial wheat, we suggest a model of breeding and selection which aims to deliver multiple products (or cultivars) to service a diversity of environments around the world. Our study demonstrated that no one pedigree was superior across environments. Local breeding efforts will likely stand a better chance of delivering a successful cultivar if breeding and selection is based upon material that is already naturally adapted to the target environment, and there is a sound understanding of the key traits conferring adaptation. In some cases, this may inform the parent species to be used. For example, in Australia no forage cultivar of Th. intermedium or Th. elongatum has been developed. It therefore may be a more sensible approach to develop a breeding strategy around Th. ponticum for which two forage cultivars have long existed [36]. Native wheatgrass species such as Elymus scaber [41] or even other cereal species that have a longer history of breeding and development in the local environment such as S. strictum [42] may also be considered to underpin a perennial cereal breeding strategy. By contrast, Th. intermedium would seem the logical choice of wheatgrass parent for the winter-cold North American environments due to the breeding efforts in Kernza currently being carried out in Kansas, Minnesota, and Manitoba. However, forage varieties of Th. ponticum [43] have been selected for the North American environments and could also provide adapted germplasm as a base for perennial wheat development. As perennial cereals edge closer to commercial reality, it is likely that breeding initiatives will need to move beyond the small number of disparate institutions that have championed this “blue-sky” research at different times over the last century, to a more collaborative ongoing effort of multiple agencies across the globe working collectively and sharing material to deliver better adapted genotypes to a broad diversity of environments [9].
All three T. turgidum derived perennial wheat lines, Mt-2 (Entry 37), 12G401F2 (6), and 20238 (8) exhibited strong persistence across multiple environmental groupings (Figure 3). Mt-2, a hybrid between durum wheat and Th. intermedium, was released by Montana State University in the USA as a forage crop [44]. Cytological work indicates this line carried about 28 wheatgrass chromosomes in addition to about 26 wheat chromosomes [44,45,46]. Similarly, 12G401F2 was recently developed by The Land Institute through winter durum wheat and Th. intermedium hybridization. Still at its early stage of breeding, the plants carried most of the wheatgrass chromsomes from Th. intermedium (K. Turner unpublished data). Entry 20238, developed in Mexico from a cross between durum wheat (2n = 28) and Th. elongatum (2n = 14), was previously found to have a chromosome number 2n = 42 and is therefore presumed to be a complete amphiploid with probable genome composition AABBEE [17]. Larkin et al. [9] concluded that the best near-term prospect for a perennial wheat was a full or partial amphiploid containing the full set of tetraploid (AABB) or hexaploid (AABBDD) wheat chromosomes plus one genome equivalent (XX) from the perennial donor. Where the perennial donor is a polyploid, the extra genome is usually a mixture of chromosomes from the parent genomes, but where each of the seven homoeologous groups are represented in the synthetic genome [9]. However, as in the case of genotype 20238 where the parent is a diploid, the resulting progeny contains the complete genomes of both parents which, in a breeding program, may overcome some of the fertility problems associated with intercrossing partial amphiploids [13]. The relatively high persistence of the entries derived by durum wheat in the present study may be explained by a reduced ratio of wheat: wheatgrass chromosomes [6,46]. Entry 20238 (8) was found to perform well in the mild winter environments in particular, one of the few lines appearing in the top quartile for grain yield and persistence (Figure 6c). It performed less well in cold winter environments, perhaps another example of reduced performance in environments vastly different from that in which it was developed although the particular traits that apparently make it better suited to milder winter environments have not been well characterised. T. turgidum is generally well suited to semi-arid Mediterranean environments [47] and this may be an advantage in the development of perennial wheat for similar climates. Both Mt-2 and 12G401F2 were low in grain yield in this study due to some factors such as poor germination, low seed fertility, and small grain size. Therefore, further breeding for these traits is necessary while the present level of persistence is further enhanced. The durum derived crosses present a new strategy for breeding perennial wheat lines with greater persistence.
As might be expected, crop performance is highly influenced by seasonal conditions. The detailed examination of the Cowra data across seven separate experiments sown between 2008 and 2016 (Table 4) revealed that yields of a particular line could more than triple in a different year, apparently due to seasonal conditions. It should be noted that in Table 4, year 1 grain yields are presented on a g/row basis rather than g/plant, which means that different plant densities could also impact year 1 yields in this analysis. Season also impacts other traits such as persistence, which undoubtedly explains why persistence observed over four years for entries 27 and 28 sown in 2008 was not repeated in future experiments at the same site. The Cowra data indicates that in most instances the grain yields of the perennial wheat lines decrease with time which has since been demonstrated to be primarily attributed to plant mortality [20]. Indeed, when assessed on a yield/plant basis, grain yield potential can increase with time in perennial wheat [20], which is similar to the observed yields in the perennial grass lines in the current study which were often very low in year 1, perhaps due to slower growth rates and a partitioning of resources into non-reproductive plant structures. The apparent decline in grain yield of the wheat control re-sown into its own stubble noted in this study and a previous study at Cowra [20] is worthy of some consideration. Consecutive wheat crops are known to be exposed to increased pest and disease burdens and therefore yield declines are anticipated [48]. The fact that individual perennial wheat plants appear not to respond in the same way is potentially a major contrast with conventional wheat, with far-reaching implications for future grain production systems. This is clearly an area of work requiring further research and understanding.

4.2. Rye Derivatives

The present study concentrated mostly on perennial wheat although a small number of perennial cereal rye and barley lines were included at a minority of sites. The superior performance of the perennial cereal rye lines (entries 13 & 43) at the one site in Canada in which they were evaluated is noteworthy and warrants further investigation. Success of these lines is most likely tied to their adaptation to the growing conditions, in particular their winter-hardiness, but also due to the lines being derived from crosses between closely related annual (S. cereale) and perennial (S. strictum) species, enabling genetic improvement in relatively meiotically stable material. Observations at Lethbridge indicate that perennial cereal rye behaves similarly to native and tame perennial grasses, in that it cycles each season between vegetative and reproductive growth, whereas perennial wheat lines tend to remain reproductive well into the fall [17]. For perennial wheat this may indicate either a lack of adaptation or a lack of a typical perennial growth habit, which may be critical at this location. Cultivation of perennial cereal rye has occurred since ancient times in parts of Eastern Europe [1], and the impressive performance of the rye lines compared to the range of perennial wheats, in terms of persistence and grain yield (see Figure 6f), at the one site in the present study is consistent with the favourable performance of perennial rye compared to perennial wheat at Michigan, USA [10]. Currently, perennial cereal rye has better prospects as a near-term commercial crop than perennial wheat from a North American and European perspective. ACE-1 [49], a tetraploid variety of perennial cereal rye similar to Permontra [50], was released to livestock farmers in Western Canada as a forage variety for grazing and biomass production. Grain yield potential is reduced compared to annual rye due to division of photosynthetic resources between two sinks—regrowth for the following season and grain yield—but there are also issues with floret fertility and chromosome pairing during meiosis. In Germany, the diploid line Reimann-Philipp (entry 43) was compared to annual and tetraploid perennial cereal rye varieties and yielded a similar amount of grain and more biomass than one of the open-pollinated annual lines in the trial [51]. Furthermore, Reimann-Philipp showed good spike fertility, indicating the commercial potential of this crop, but also that breeding perennial cereal rye in a diploid form might be the best approach. A challenge with the perennial cereal rye crop will be marketing of the rye grain. In comparison to wheat, the rye market for grain is much smaller and perennial cereal rye grain would be in competition with high yielding annual rye hybrid varieties which are being cultivated in Europe and North America. A potential fit for perennial cereal rye is as a dual purpose crop for biomass and grain or a low input or organic system. Further research in this area is required to build the case for perennial cereal rye being a successful option for producers.

4.3. Barley Derivatives

In comparison to the development of perennial wheat, perennial barley is at an earlier stage [52]. Barley and its wild relatives in the genus Hordeum are widespread among various climates, and barley is the cereal which is grown in the most northern agricultural areas. In this study, four genotypes (IL107, IL118, IL24, IL46; ID 33–36) of barley that are introgression lines (ILs) between spring barley cultivars and H. bulbosum [53] were included. H. bulbosum is considered to be the genetically closest wild perennial relative to barley. These four introgression lines harbor different segments of H. bulbosum [52,54] and they were chosen for this study since they also indicated promising performance in trials carried out by Westerbergh et al. [52]. Similar to many of the wheat hybrid lines, the barley ILs did not show persistence from year 2 to year 3 in the cold winter climate (data from two sites) or the mild winter climate conditions (data from two sites). However, two of the entries (IL 46 and IL 118) in the cold winter climate and one (IL 107) in the mild winter environments showed some persistence from year 1 to year 2, seen as production of tillers in the fall after harvest, indicating potential for regrowth. One IL showed different responses in mild and cold climates indicating an interaction between the genotype and environmental factors. The poor persistence to year 3 among the plant material in this initial study may be attributable to several factors including several genetically controlled plant traits. As the genomes of the ILs consist of different chromosomal segments originating from the perennial H. bulbosum parent present in an annual barley genetic background, all of the necessary genes controlling the quantitative perennial growth habit may not have been transferred. Even if they carried necessary genes for perenniality, there could be several reasons why they would not survive. The segments of H. bulbosum that were introgressed into the barley background may not harbor genes for proper adaptation to photoperiod and/or winter hardiness. The environmental and latitude differences between the sites in mild and cold climates may affect the plants’ responses to photoperiod and ability to induce winter hardiness.
Among several traits, adaptation to photoperiod and temperature at the cultivation site is essential for the transition from vegetative to reproductive stage as well as the induction of dormancy and winter hardiness, and thereby affects persistence and production by perennial plants. Plants may also differ in their need for vernalization to flower as for winter type plants. In contrast, spring type plants do not require vernalization to flower, but are more sensitive to cold and may not survive the winter when planted late in the season. If there is diversity for vernalization and photoperiod in the plant material used in the present study, this could help explain the various responses in traits under mild and cold climates. The complexity of the perennial growth habit, however, requires that this type of multisite study, with a range of climatic and other conditions, is carried out to learn about the plant responses in relation to their genetic background. The knowledge about the genetic controls of photoperiod response, vernalization response, and cold tolerance in cereals should be used in future work to improve the performance of barley-H. bulbosum ILs as well as the performance of the wheat hybrid lines.

5. Conclusions

This unique study compared a range of early generation perennial cereal material derived from wheat, rye, and barley grown in single rows and monitored for up to three years at 21 sites across nine countries on four continents. The primary aim was to inform future perennial cereal breeding initiatives and identify key elements of environments that impact perennial crop performance. The study showed that, of the material tested, no one pedigree conferred superiority across this range of environments, although it was observed that material derived from Th. intermedium was often superior in persistence at higher latitude environments in contrast to sites at lower latitude where material from Th. ponticum and Th. elongatum often dominated. The present material was generally shown to be relatively short-lived but better adapted to milder environments, although other environmental factors such as soil type clearly influenced crop performance. Our study demonstrated the importance of tillering in increasing grain yields of perennial cereals due to increased floret sterility in the hybrid lines reducing the importance of grain size on relative yields, compared to conventional cereals. We observed little relationship between grain and biomass yield in year 2 and first year crop performance. This highlights a key challenge in perennial crop development more broadly as productivity and environmental impacts of this novel cropping system will likely remain poorly understood until germplasm exists with sufficient longevity across a diversity of target environments. Hybrid lines derived from durum wheat generally showed greater longevity than lines derived from bread wheat, highlighting an opportunity to better explore the potential that T. turgidum might offer a perennial wheat breeding program. Future breeding initiatives will more likely achieve success in delivering adapted material to market by targeting specific environments and sourcing locally adapted annual and perennial parent material. For this to occur there needs to be a sound understanding of the key traits required for adaptation to a particular environment. In some regions such as Australia, the breeding program may be limited by a relatively narrow range of naturally adapted candidate parent grasses. In other instances, such as at high latitude environments, there may be a case for achieving a viable perennial crop by selecting an alternative species to wheat upon which to develop a breeding program, such as barley or rye. In either instance, the careful selection for well-adapted perennial grass parent material would seem an important component of a future breeding initiative.
This study invites further research to understand the effects of particular environmental factors more fully. Much of the site characterization in the present study is quite broad and although adequate for contrasting the sites in this initial study, understates the diversity of environments and the range of environmental niches that perennial crops will likely confront on a global scale. Future studies would benefit from examining aspects such as seasonal distribution of rainfall, evapotranspiration rates and soil attributes in particular as these environmental factors will undoubtedly have a substantial impact on crop performance.

Acknowledgments

We fondly remember the late Norberto Pogna, formerly CREA, Italy, for his enthusiastic support of this research. Resources to conduct this study were provided by the many agencies around the world that contributed the time of their staff to this initiative. We acknowledge the many other researchers around the planet that were initially involved with this initiative but, for a variety of reasons, were unable to continue to monitor their experiments. We are grateful for the efforts of the institutions that developed the lines that were evaluated, especially The Land Institute, Kansas, and Washington State University, USA, who shared their material freely. We thank the numerous technical staff that assisted with the management of the field experiments and collection of data, including S. Langfield (Cowra), P. Cacciatori (Inviolatella & Montelibretti), K. Foster (Manjimup), K. Schirmer (Wagga Wagga), L. Smith (Urbana), A. Slama (Carman) and J. Mai (Salina). We thank Eddy Archer (NSW DPI) for assistance with the graphics in Figure 1. The financial support from the Perennial Agriculture Project, a joint project between The Land Institute and The Malone Family Land Preservation Foundation, is gratefully acknowledged. The experiment in Konya (Turkey) was conducted on the field of Bahri Dagdas International Agricultural Research Centre and its staff contribution is acknowledged. CIMMYT-Turkey is financially supported by CRP WHEAT and the Ministry of Food, Agriculture and Livestock of the Republic of Turkey. The demonstration site at Omsk State Agrarian University was supported by Russian Science Foundation. (Project No. 16-16-10005 signed 10.05.2016).

Author Contributions

Richard C. Hayes and Shuwen Wang conceived the study, facilitated the large network of sites and drew the results together in drafting the manuscript. Guangdi D. Li, Matthew T. Newell, Kathryn Turner, and Jamie Larsen collated the data and conducted the statistical analysis, the latter three also coordinating one or more of the field experiments reported. The remaining authors, James A. Anderson, Lindsay W. Bell, Douglas J. Cattani, Katherine Frels, Elena Galassi, Alexey I. Morgounov, Clinton K. Revell, Dhruba B. Thapa, Erik J. Sacks, Mohammad Sameri, Len J. Wade, Anna Westerbergh, Vladimir Shamanin and Amir Amanov facilitated the establishment of a field experiment in their local environment which included oversight of experimental protocols, collation of data, integration of local site characteristics, and other revisions to the manuscript to ensure interpretations of results were consistent with local observations.

Conflicts of Interest

The authors declare no conflict of interest.

References

  1. Wagoner, P. Perennial grain development: Past efforts and potential for the future. Crit. Rev. Plant Sci. 1990, 9, 381–408. [Google Scholar] [CrossRef]
  2. Curwen-McAdams, C.; Jones, S.S. Breeding Perennial Grain Crops Based on Wheat. Crop Sci. 2017, 57, 1172–1188. [Google Scholar] [CrossRef]
  3. Tsitsin, N.V. The significance of wide hybridization in the evolution and production of new species and forms of plants and animals. In Wide Hybridization in Plants; Tsitsin, N.V., Ed.; Isreal Program for Science Translations: Jerusalem, Isreal, 1960. [Google Scholar]
  4. Sharma, H.C.; Gill, B.S. Current status of wide hybridization in wheat. Euphytica 1983, 32, 17–31. [Google Scholar] [CrossRef]
  5. Cox, T.S.; Van Tassel, D.L.; Cox, C.M.; DeHaan, L.R. Progress in breeding perennial grains. Crop Pasture Sci. 2010, 61, 513–521. [Google Scholar] [CrossRef]
  6. DeHaan, L.R.; Wang, S.; Larsen, S.R.; Cattani, D.J.; Zhang, X.; Kantarski, T. Current efforts to develop perennial wheat and domesticate Thinopyrum intermedium as a perennial grain. In Proceedings of the Perennial Crops for Food Security FAO Expert Workshop, Rome, Italy, 28–30 August 2014. [Google Scholar]
  7. Zhang, X.; Larsen, S.R.; Gao, L.; Teh, S.L.; DeHaan, L.R.; Fraser, M.; Sallam, A.; Kantarski, T.; Frels, K.; Poland, J.; et al. Uncovering the genetic architecture of seed weight and size in intermediate wheatgrass through linkage and association mapping. Plant Genome 2017, 10. [Google Scholar] [CrossRef] [PubMed]
  8. Reimann-Philipp, R. Breeding perennial rye. Plant Breed. Rev. 1995, 13, 265–292. [Google Scholar]
  9. Larkin, P.J.; Newell, M.T.; Hayes, R.C.; Aktar, J.; Norton, M.R.; Moroni, S.J.; Wade, L.J. Progress in developing perennial wheats for grain and grazing. Crop Pasture Sci. 2014, 65, 1147–1164. [Google Scholar] [CrossRef]
  10. Jaikumar, N.S.; Snapp, S.S.; Murphy, K.; Jones, S.S. Agronomic Assessment of perennial wheat and perennial rye as cereal crops. Agron. J. 2012, 104, 1716–1726. [Google Scholar] [CrossRef]
  11. Hayes, R.C.; Newell, M.T.; Crews, T.E.; Peoples, M.B. Perennial cereal crops: An initial evaluation of wheat derivatives grown in mixtures with a regenerating legume. Renew. Agric. Food Syst. 2016, 32, 276–290. [Google Scholar] [CrossRef]
  12. Zhang, D.; Bowden, R.L.; Yu, J.; Carver, B.F.; Bai, G. Association Analysis of Stem Rust Resistance in U.S. Winter Wheat. PLoS ONE 2014, 9, e103747. [Google Scholar] [CrossRef]
  13. Banks, P.M.; Xu, S.J.; Wang, R.R.C.; Larkin, P.J. Varying chromosome composition of 56-chromosome wheat x Thinopyrum intermedium partial amphiploids. Genome 1993, 36, 207–215. [Google Scholar] [CrossRef] [PubMed]
  14. Jauhar, P.P.; Peterson, T.S.; Xu, S.S. Cytogenetic and molecular characterization of a durum alien disomic addition line with enhanced tolerance to Fusarium head blight. Genome 2009, 52, 467–483. [Google Scholar] [CrossRef] [PubMed]
  15. Larter, E.N.; Elliot, F.C. An evaluation of different ionizing radiations for possible use in the genetic transfer of bunt resistance from Agropyron to wheat. Can. J. Bot. 1956, 34, 817–823. [Google Scholar] [CrossRef]
  16. Murphy, K.M.; Lyon, S.R.; Balow, K.A.; Jones, S.S. Post-sexual cycle regrowth and grain yield in Thinopyrum elongatum × Triticum aestivum amphiploids. Plant Breed. 2010, 129, 480–483. [Google Scholar] [CrossRef]
  17. Hayes, R.C.; Newell, M.T.; DeHaan, L.R.; Murphy, K.M.; Crane, S.; Norton, M.R.; Wade, L.J.; Newberry, M.; Fahim, M.; Jones, S.S.; et al. Perennial cereal crops: An initial evaluation of wheat derivatives. Field Crops Res. 2012, 133, 68–89. [Google Scholar] [CrossRef]
  18. Fasoula, V.A.; Fasoula, D.A. Honeycomb breeding: Principles and applications. In Plant Breeding Reviews; Janick, J., Ed.; John Wiley & Sons Inc.: Hoboken, NJ, USA, 2000. [Google Scholar]
  19. WRB. World Reference Base for Soil Resources 2014, Update 2015. International Soil Classification System for Naming Soils and Creating Legends for Soil Maps; World Soil Resources Reports No. 106; Food and Agriculture Organization of the United Nations: Rome, Italy, 2015. [Google Scholar]
  20. Newell, M.T.; Hayes, R.C. An initial investigation of forage production and feed quality of perennial wheat derivatives. Crop Pasture Sci. 2017, 68, 1141–1148. [Google Scholar] [CrossRef]
  21. Lodge, G.; Gleeson, A. A comparison of methods of estimating lucerne population for monitoring persistence. Aust. J. Exp. Agric. 1984, 24, 174–177. [Google Scholar] [CrossRef]
  22. Fox, J.; Weisburg, S. An {R} Companion to Applied Regression, 2nd ed.; Sage: Thousand Oaks, CA, USA, 2011. [Google Scholar]
  23. Hothorn, T.; Hornik, K.; Zeileis, A. Unbiased Recursive Partitioning: A Conditional Inference Framework. J. Comput. Graph. Stat. 2006, 15, 651–674. [Google Scholar] [CrossRef]
  24. VSN International. Genstat for Windows, 19th ed.; VSN International: Hemel Hempstead, UK, 2018. [Google Scholar]
  25. Smith, A.B.; Cullis, B.R.; Gilmour, A.R. The analysis of crop variety evaluation data in Australia. Aust. N. Z. J. Stat. 2001, 43, 129–145. [Google Scholar] [CrossRef]
  26. Gilmour, A.R.; Gogel, B.J.; Cullis, B.R.; Thompson, R. ASReml User Guide, Release 3; VSN International: Hemel Hempstead, UK, 2009. [Google Scholar]
  27. Tewolde, H.; Fernandez, C.J.; Erickson, C.A. Wheat Cultivars Adapted to Post-Heading High Temperature Stress. J. Agron. Crop Sci. 2006, 192, 111–120. [Google Scholar] [CrossRef]
  28. Li, G.D.; Lodge, G.M.; Moore, G.A.; Craig, A.D.; Dear, B.S.; Boschma, S.P.; Albertson, T.O.; Miller, S.M.; Harden, S.; Hayes, R.C.; et al. Evaluation of perennial pasture legumes and herbs to identify species with high herbage production and persistence in mixed farming zones in southern Australia. Aust. J. Exp. Agric. 2008, 48, 449–466. [Google Scholar] [CrossRef]
  29. Gazza, L.; Galassi, E.; Ciccoritti, R.; Cacciatori, P.; Pogna, N.E. Qualitative traits of perennial wheat lines derived from different Thinopyrum species. Genet. Res. Crop Evol. 2016, 63, 209–219. [Google Scholar] [CrossRef]
  30. Fedak, G.; Chen, Q.; Conner, R.L.; Laroche, A.; Petroski, R.; Armstrong, K.W. Characterization of wheat-Thinopyrum partial amphiploids by meiotic analysis and genomic in situ hybridization. Genome 2000, 43, 712–719. [Google Scholar] [CrossRef] [PubMed]
  31. Chen, Q. Detection of alien chromatin introgression from Thinopyrum into wheat using S genomic DNA as a probe—A landmark approach for Thinopyrum genome research. Cytogenet. Genome Res. 2005, 109, 350–359. [Google Scholar] [CrossRef] [PubMed]
  32. Chen, Q.; Ahmad, F.; Collin, J.; Comeau, A.; Fedak, G.; St-Pierre, C.; Chen, Q. Genomic constitution of a partial amphiploid OK7211542 used as a source of immunity to barley yellow dwarf virus for bread wheat. Plant Breed. 1998, 117, 1–6. [Google Scholar] [CrossRef]
  33. Wang, R.R.C. Agropyron and Psathyrostachys. In Wild Crop Relatives: Genomic and Breeding Resources; Springer: Berlin/Heidelberg, Germany, 2011; pp. 77–108. [Google Scholar]
  34. USDA. Grass Varieties in the United States; Alderson, J.A.S.W.C., Ed.; CRC-Lewis Publishers: New York, NY, USA, 1994.
  35. Norton, M.R.; Lelièvre, F.; Volaire, F. Summer dormancy in Dactylis glomerata L.: The influence of season of sowing and a simulated mid-summer storm on two contrasting cultivars. Aust. J. Agric. Res. 2006, 57, 565–575. [Google Scholar] [CrossRef]
  36. Oram, R.N. Register of Australian Herbage Plant Cultivars, 3rd ed.; CSIRO Division of Plant Industries: Canberra, Australia, 1990. [Google Scholar]
  37. Hoen, K. The effect of plant size and developmental stage on summer survival of some perennial grasses. Aust. J. Exp. Agric. Anim. Husb. 1968, 8, 190–196. [Google Scholar] [CrossRef]
  38. Sandve, S.R.; Kosmal, A.; Rudi, H.; Fjellheim, S.; Rapacz, M.; Yamada, T.; Rognli, O.A. Molecular mechanisms underlying frost tolerance in perennial grasses adapted to cold climates. Plant Sci. 2011, 180, 69–77. [Google Scholar] [CrossRef] [PubMed]
  39. Egron, A. Optimal Regulation of the Balance between Productivity and Overwintering of Perennial Grasses in a Warmer Climate. Agronomy 2017, 7, 19. [Google Scholar] [CrossRef]
  40. Dalmannsdottir, S.; Jørgensen, M.; Rapacz, M.; Østrem, L.; Larsen, A.; Rødven, R.; Rognli, O.A. Cold acclimation in warmer extended autumns impairs freezing tolerance of perennial ryegrass (Lolium perenne) and timothy (Phleum pratense). Physiol. Plant. 2017, 160, 266–281. [Google Scholar] [CrossRef] [PubMed]
  41. Newell, M.T.; Hayes, R.C.; Virgona, J.M.; Larkin, P.J. Summer dormancy in Elymus scaber and its hybridity with wheat. Euphytica 2015, 204, 535–556. [Google Scholar] [CrossRef]
  42. Oram, R.N. Secale montanum—A wider role in Australasia? N. Z. J. Agric. Res. 1996, 39, 629–633. [Google Scholar] [CrossRef]
  43. Lawrence, T. Orbit tall wheatgrass. Can. J. Plant Sci. 1967, 47, 611–612. [Google Scholar] [CrossRef]
  44. Schulz-Schaeffer, J.; Haller, S.E. Registration of Montana-2 Perennial × Agrotriticum Intermediodurum Khizhnyak. Crop Sci. 1987, 22, 822. [Google Scholar] [CrossRef]
  45. Schulz-Schaeffer, J.; Friebe, B. Karyological characterization of a partial amphiploid, Triticum turgidum L. var. durum Agropyron intermedium (Host) P.B. Euphytica 1992, 62, 83–88. [Google Scholar] [CrossRef]
  46. Jones, T.; Zhang, X.; Wang, R. Genome characterization of MT-2 perennial and OK-906 annual wheat × intermediate wheatgrass hybrids. Crop Sci. 1999, 39, 1041–1043. [Google Scholar] [CrossRef]
  47. Monneveux, P.; Jing, R.; Misra, S.C. Phenotyping for drought tolerance in wheat using physiological traits. Front. Physiol. 2012, 3, 1–12. [Google Scholar] [CrossRef] [PubMed]
  48. Angus, J.F.; Kirkegaard, J.A.; Hunt, J.R.; Ryan, M.H.; Ohlander, L.; Peoples, M.B. Break crops and rotations for wheat. Crop Pasture Sci. 2015, 66, 523–552. [Google Scholar] [CrossRef]
  49. Acharya, S.N.; Mir, Z.; Moyer, J.R. ACE-1 perennial cereal rye. Can. J. Plant Sci. 2004, 84, 819–821. [Google Scholar] [CrossRef]
  50. Reimann-Philipp, R. Perennial spring rye as a crop alternative. J. Agron. Crop Sci. 1986, 157, 281–285. [Google Scholar] [CrossRef]
  51. Miedaner, T.; Longin, F. St. John’s Rye-Definitely too good for Goats and Sheep. In Neglected Cereals: From Ancient Grains to Superfood; Erling Verlag GmbH & Co. KG. EU: Clenze, Germany, 2017. [Google Scholar]
  52. Westerbergh, A.; Lerceteau-Köhler, E.; Sameri, M.; Bedada, G.; Lundquist, P. Towards development of perennial barley for cold temperate climates—Implications from wild barley relatives and barley-Hordeum bulbosum introgression lines. Sustainability 2018. under review. [Google Scholar]
  53. Pickering, R. The production of fertile triploid hybrids between Hordeum vulgare L. (2n = 2x = 14) and H. bulbosum L. (2n = 4x = 28). Barley Genet. Newsl. 1988, 18, 25–29. [Google Scholar] [CrossRef]
  54. Johnston, P.A.; Timmerman-Vaughan, G.M.; Farnden, K.J.F.; Pickering, R. Marker development and characterisation of Hordeum bulbosum introgression lines: A resource for barley improvement. Theor. Appl. Genet. 2009, 118, 1429–1437. [Google Scholar] [CrossRef] [PubMed]
Figure 1. Approximate location of each experimental site together with long term averages for rainfall (mm; bar chart) and temperature (°C; line graph) for each month from January–December (average monthly temperature calculated from daily maximum and minimum temperatures).
Sustainability 10 01124 g001
Figure 2. Principal component biplot of environmental and perennial cereal agronomic variables summarized across 18 locations. Abbreviations for the variables in the figure are as follows; Year 1 variables (open circle) rainfall (rainY1), N fertilizer (nY1), P fertilizer (pY1), grain yield (gyY1), dry matter yield (dmY1), frequency (fqY1), thousand kernel weight (tkwY1), plant height (htY1), tiller number (tilY1), relative anthesis date (radY1); Year 2 variables (×) rainfall (rainY2), grain yield (gyY2), dry matter yield (dmY2), frequency (fqY2), thousand kernel weight (tkwY2); Year 3 variables (asterisk) frequency (fqY3); Persistence—change in frequency—(open triangle) years 1 to 2 (ppst12), years 2 to 3 (ppst23); Non-specific environmental measurements (open square) maximum monthly temperature (mxmontp), minimum monthly temperature (minmontp), latitude (lat), soil pH (pH).
Sustainability 10 01124 g002
Figure 3. Conditional inference tree of environmental factors related to year 1–2 persistence (proportion of year 1 frequency). The top five genotypes for each boxplot of grouped trials are listed by the genotype ID in bold; parentheses indicate if the line mean was in the top 5 in more than one trial within the environmental grouping. “y1.accmltdRF12mo” is the 12 month accumulated rainfall from the date of planting. “maxMonthlyLAT” and “minMonthlyLAT” are the maximum and minimum monthly long term average temperature in degrees °C, respectively. (n = number of observed replicates in each environmental grouping node).
Sustainability 10 01124 g003
Figure 4. Scatterplot of persistence from years 1–2 of genotypes derived from four Thinopyrum species across trials ordered by latitude. (irr) indicates the trial was irrigated.
Sustainability 10 01124 g004
Figure 5. Conditional inference tree of environmental factors related to year 1 grain yield (g). The top five genotypes for each boxplot of grouped trials are listed by the genotype ID in bold; parentheses indicate if the line mean was in the top 5 in more than one trial within the environmental grouping. “maxMonthlyLAT“ and “minMonthlyLAT“ are the maximum and minimum monthly long term average temperature in degrees °C, respectively. (n = number of observed replicates in each environmental grouping node).
Sustainability 10 01124 g005
Figure 6. Pair-plots between seedling density and grain yield per row (a,e); plant frequency and grain yield per row (b,f); dry matter and grain yield per row (c,g); and grain weight per plant and thousand kernel weight (d,h) under mild (ad) and cold (eh) climate environments. Vertical and horizontal dotted lines mark the 75th percentile of each attribute assessed. The small dot represents data from 1–3 sites; the medium dot from 4–6 sites and the large dot from more than 7 sites. The number above or beside each dot is the genotype ID as listed in Table 2.
Sustainability 10 01124 g006
Table 1. Description of the experimental sites. RF, rainfall; LAR, Long term annual rainfall; LAT, Long term annual average temperature.
CountrySite IDSiteLatitudeLongitudeKoppen ClassificationElevation (m)Planting DateSoil Type §Accumulated RF 12mths from Sowing (mm)LAR (mm)LAT (°C)Historical RecordSoil pH Water
Mild winter environment Year 1Year 2Year 3
Australia1Cowra A33°48.21’ S148°42.23’ ECsc38527/04/2012Lixisol41451344262316.21961–19906.1
Australia2Cowra B33°48.21’ S148°42.23’ ECsc38525/04/2013Lixisol513442-62316.21961–19906.1
Australia3Cowra C33°48.21’ S148°42.23’ ECsc38511/04/2016Lixisol858613-62316.21961–19906.1
Australia4Manjimup34°18.38’ S116°07.60’ ECsb26214/06/2012Luvisol871946-99415.11915–20175.1
Australia5Toowoomba27°56’ S151°95’ ECsc64015/05/2012Nitisol1145606-72217.91996–20176.1
Australia6Wagga Wagga35°05’ S147°35’ ECsc22013/06/2012Ferralsol293417-53015.81898–20165.2
Italy7Montelibretti42°08’ N12°44’ ECsa2030/12/2011Arenosol6941069110284815.92005–20166.3
Italy8Inviolatella41°57’ N12°47’ ECsa2020/11/2015Arenosol766277-90214.71973–20166.6
Turkey9Konya37°51’ N32°33’ EBSk101110/11/2015Xerosol243264-32211.61929–20168.0
Cold winter environment
Nepal10Jumla29°17’ N82°10’ ECwb230012/10/2011Inceptisol763--79413.22000–20158.1
United States11Urbana40°3’50” N88°12’18” WCfa23017/10/2012Mollic Gleysol879962-103211.41989–20166.3
United States12Salina A38°49’ N97°36’ WCfa3735/10/2012Kastanozem750716-80013.41981–20106.7
United States13Salina B38°49’ N97°36’ WCfa3735/10/2012Kastanozem750716----7.8
United States14Salina C38°49’ N97°36’ WCfa37310/12/2015Kastanozem767-----7.8
United States15St. Paul A44°52’ N93°13’ WDfa26618/09/2012Phaeozem842959-8178.31981–20106.6
United States16St Paul B44°52’ N93°13’ WDfa2669/22/2015Phaeozem1051963-8208.31981–20106.9
Canada17Lethbridge49°07’ N112°08’ WBSk9112/10/2015Chernozem302245-3795.61961–20167.6
Canada18Carman49°30’ N98°13’ WDfb26723/09/2015Chernozem568364 5483.41981–20106.3
Sweden19Uppsala60°00’ N17°42’ ECfb2401/10/2015Cambisol609542-5275.71961–20166.6
Uzbekistan20Tashkent 41°15′52″ N69°12′58″ ECsa47020/10/2016Serozem533--51914.41923–20157.0
Russia21Omsk 54°59′32″ N73°22’06″ EDfb8719/05/2017Chernozem171 --3811.41948–20107.0
Unreplicated demonstration sites; May-September rainfall only; § IUSS Working Group (WRB 2015).
Table 2. Perennial wheat genotypes evaluated at each experimental site. Cowra A (1), Cowra B (2), Cowra C (3), Manjimup (4), Toowoomba (5), Wagga Wagga (6), Montelibretti (7), Inviolatella (8), Konya (9), Jumla (10), Urbana (11), Salina A (12), Salina B (13), Salina C (14), St Paul A (15), St Paul B (16), Lethbridge (17), Carman (18), Uppsala (19), Tashkent (20), Omsk (21). Dots indicate the sites at which each entry was evaluated.
IDGenotypePedigree123456789101112131415161718192021
111955Triticum aestivum × Thinopyron ponticum
212F3205T. aestivum × Th. intermedium
312F3256T. aestivum × Th. ponticum
412F3258T. aestivum × Th. ponticum
512F4090T. aestivum × Th. intermedium
612G401 F2T. turgidum × Th. intermedium
714894T. aestivum × Secale cereale × Agropyron elongatum
820238T. turgidum × Ag. elongatum
94014Ag. derivative
106754T. aestivum × Ag. elongatum
116755T. aestivum × Ag. elongatum
126770T. aestivum × Ag. elongatum
13ACE-1S. cereale
14AgrotanaT. aestivum × Th. ponticum
15B1126T. aestivum × Th. intermedium
16B1321T. aestivum × Th. intermedium
17B373T. aestivum × Th. intermedium
18B374-6-7sT. aestivum × Th. intermedium
19B913T. aestivum × Th. junceiforme
20C3-2627Th. intermedium
21C3-3471Th. intermedium
22CPI147235aT. aestivum × Th. ponticum × T. aestivum
23CPI147236aT. aestivum × Th. ponticum × T. aestivum
24CPI147242bT. aestivum × Th. ponticum × T. aestivum
25CPI147244bT. aestivum × Th. ponticum × T. aestivum
26CPI147247aT. aestivum × Th. ponticum × T. aestivum
27CPI147251bT. aestivum × Th. ponticum × T. aestivum
28CPI147257bT. carthlicum × Th. intermedium × T. aestivum
29CPI147279aT. carthlicum × Th. intermedium × T. aestivum
30CPI147280bT. aestivum × Th. intermedium
31CPI147281bT. aestivum × Th. intermedium
32CPI148055Th. intermedium
33IL107Hordeum vulgare × H. bulbosum
34IL118H. vulgare × H. bulbosum
35IL24H. vulgare × H. bulbosum
36IL46H. vulgare × H. bulbosum
37Mt-2T. turgidum × Th. intermedium
38OK7211542T. aestivum × Th. ponticum
39OstankinskayaT. aestivum × Th. intermedium
40Otrastajuscaja 38T. aestivum × Th. intermedium
41P15T. aestivum × Th. ponticum × T. aestivum
42PWM706/PWM3T. aestivum × Th. ponticum
43Reimann-PhillipS. cereale
44Summer 1T. aestivum × Th. intermedium
45TAF 46T. aestivum × Th. intermedium
46Zhong 3T. aestivum × Th. intermedium
47Zhong 7T. aestivum × Th. intermedium
48Crop control
ArapahoeT. aestivum
Bezostaya1T. aestivum
EnscoT. aestivum
EverestT. aestivum
FalconT. aestivum
FullerT. aestivum
GregoryT. aestivum
MaceT. aestivum
Pioneer_25R47T. aestivum
StavaT. aestivum
TAM_SOFT700T. aestivum
UKR-OD 952.92/AE.1 Squarrosa (1031)T. aestivum
W512T. aestivum
WedgetailT. aestivum
WK1204T. aestivum
HindmarshH. vulgare
P-845H. vulgare
49Grass control
Accession (Turkey)H. bulbosum
BarcelFestuca arundinacea
C3-3864Th. intermedium
DundasTh. ponticum
Family10S. montanum
Local variety (Minnesota)Th. intermedium
Local variety (Turkey)Th. intermedium
TLI_C3-2925Th. intermedium
Total 242424161616152227151818182718222422251212
Table 3. Description of pesticides, fertilizers, and irrigation used during the experimental period.
SiteYear 1Year 2
PesticidesFertilizersIrrigationPesticidesFertilizersIrrigation
Cowra A250 mL/ha Propiconazole (fungicide)18 kg/ha N, 20 kg/ha PNilNil18 kg/ha N, 20 kg/ha PNil
Cowra B250 mL/ha Propiconazole (fungicide)18 kg/ha N, 20 kg/ha PSummer irrigationNil18 kg/ha N, 20 kg/ha PSummer irrigation
Cowra CNil18 kg/ha N, 20 kg/ha Pat establishment & summerNil18 kg/ha N, 20 kg/ha PSummer irrigation
Manjimup12.5 g/ha bifenthrin (insecticide); 129 g/ha tebuconazole (fungicide)80 kg/ha N, 22 kg/ha P, 60 kg/ha KNilNil37 kg/ha N, 6 k g/ha P, 22 kg/ha KNil
ToowoombaNil18 kg/ha N, 20 kg/ha Pat establishmentNil18 kg/ha N, 20 kg/ha PNil
Wagga WaggaNil26 kg/ha N, 28 kg/ha PSummer & autumn irrigationNil26 kg/ha N, 28 kg/ha PSummer & autumn irrigation
MontelibrettiNil31 kg/ha N, 20 kg/ha PSummer irrigationNil31 kg/ha N, 20 kg/ha PNil
InviolatellaNil31 kg/ha N, 20 kg/ha PNilNil31 kg/ha N, 20 kg/ha PNil
KonyaNil30 kg/ha NNilNilNilNil
JumlaNil60 kg/ha N, 30 kg/ha P, 30 kg/ha Kat establishment---
UrbanaNil30 kg/ha N; 20 kg/ha PNil175 kg/ha Pendamethalin (herbicide)NilNil
Salina ANil34 kg/ha Nat establishment & summerNilNilNil
Salina BNil34 kg/ha Nat establishment---
Salina CNil34 kg/ha Nat establishmentNilNilNil
St. Paul ANilNilat establishmentNilNilNil
St Paul Bestablishment: 1.1 L/ha 2-4-D (herbicide); 145 mL/ha Tebuconazole (fungicide); 109 mL/ha lambda-cyhalothrin (insecticide); 2 L/ha Fenoxaprop-p-Ethyl, Pyrasulfotole, Bromoxynil Octanoate, Bromoxynil Heptanoate (herbicide)NilNilNil56 kg/ha NNil
Lethbridge500 mL/ha pyroxsulam87 kg/ha N, 58 kg/ha P, 24 kg/ha KSpring & Summer (152.4 mm)0.007 kg/ha metsulfuron-methyl87 kg/ha N, 58 kg/ha P, 24 kg/ha KAutumn, Spring & summer (292.1 mm)
CarmanNilNilNilNilNilNil
UppsalaNil30 kg/ha NNilNilNilNil
TashkentNil184 kg/ha N total applied 3 times1 after planting + 3 during the season (total 235 mm); 1 irrigation after harvest (70 mm)---
OmskNilNilNil---
Table 4. Grain yield (g/row) of entries sown at Cowra, Australia, compared to previous experiments sown in the same field. For experiments sown in 2008–2010 see Hayes et al. [17]; for 2011 see Larkin et al. [9]; 2012–2016 are Cowra A, B, and C in the present study, respectively.
Planting Year2008200920102011201220132016
Sampling YearYr. 1Yr. 2Yr. 3Yr. 4Yr. 1Yr. 2Yr. 1Yr. 2Yr. 1Yr. 2Yr. 1Yr. 2Yr. 3Yr. 1Yr. 2Yr. 1Yr. 2
IDGenotype
111955------117.115.1178.566197.900104.9084.63.7
714894------68.10.3--97.60046.60--
820238------136.323.9152.816.2153.70062.90123.230.7
94014------108.84.6--193.70010.20--
106754------151.73.2--170.1008.35--
116755------175.63.5253.653.2240006.50--
126770------158.30.3--169.100460--
22CPI147235a73.525.90033.7120.182.64.4102.158.3107.40044.41.960.243.5
23CPI147236a81.745.911.2032.236.274.50.1152.520.11170052.50--
24CPI147242b----24.49.847.33.2107.313.1128.20069.71.5--
25CPI147244b----9.537.731.3036.95.173.90052.20--
26CPI147247a----40.50626.31450137.40053.70--
27CPI147251b70.99.40.50.458.5056.32.8150.416.5142.10089.80160.626.7
28CPI147257b7.812.64.70.72.64.30.2013.94.111.43.802.92.4--
29CPI147279a----34.330.5----72.1009.50--
30CPI147280b----2131----993.3028.90--
31CPI147281b----22.812.1----70.8009.40--
32CPI1480550.43.657.70--81.7013.543.54.955.22.8162.17.726.7
38OK721154293.613.30010717.683.34.1196.778.9203.10080.50138.90
39Ostankinskaya--------101.854.8-----54.31.2
40Otrastajuscaja 3829.711.20033.863.683.90--810050.11.4362.2
44Summer 1128000217.10---------105.10
45TAF46----1.543.820.60.443.557.949.87.6042.5047.10
48Wedgetail204.1000264.90319.50352.90392.500145.6137.5 263137.4
49Dundas09.4207.7268.96.4128.520.70.618.4729.61018.417.96.2--
49Family1012.50.98200.266.946.50.2--79.642.7126.512.1--
Yr. = Year; Genotype.planting year.sampling year l.s.d.0.05 = 24.37; re-planted from seed in year 2.
Table 5. Overall performance of genotype evaluated under mild and cold climate environments. The index (%) is an average of relative percentage of frequency, grain yield, and grain size across all sites and years. The index of each genotype was compared with crop control and grass control separately under each climate environment with a P-level provided for each contrast comparison.
IDGenotypeIndexRankCrop ControlGrass ControlIDGenotypeIndexRankCrop ControlGrass Control
Mild winterCold winter
38OK721154246.310.035<0.00139Ostankinskaya53.11<0.001<0.001
11195545.220.082<0.00144Summer 152.22<0.001<0.001
12677045.030.092<0.00111195546.930.0080.003
24CPI147242b43.140.2940.00122CPI147235a46.540.0100.005
44Summer 142.950.3340.00247Zhong 745.550.0210.010
82023842.360.4390.00345TAF 4645.060.0290.014
26CPI147247a42.270.4670.00438OK721154244.670.0360.019
27CPI147251b40.480.8940.02020C3-262744.080.0540.028
31CPI147281b40.190.9870.02640Otrastajuscaja 3843.290.0850.047
48Crop control40.010NA0.02727CPI147251b41.0100.2470.153
22CPI147235a39.8110.9400.03323CPI147236a38.2110.6860.496
23CPI147236a38.3120.5740.09646Zhong 337.8120.7760.575
25CPI147244b38.3130.5700.09715B112637.3130.8640.654
30CPI147280b37.6140.4160.15616B132137.2140.8960.683
17B37335.9150.1720.38617B37337.2150.8980.686
15B112635.9160.1630.40248Crop control36.716NA0.782
45TAF 4635.8170.1610.40614Agrotana36.0170.8460.934
10675435.6180.1410.44649Grass control35.7180.782NA
47Zhong 735.4190.1250.48542PWM706/PWM334.9190.6380.847
14Agrotana35.2200.1070.53782023834.4200.5430.740
32CPI14805534.4210.0610.72541P1533.7210.4180.593
40Otrastajuscaja 3834.3220.0550.76219B91331.3220.1470.239
35IL2433.8230.0390.88021C3-347130.0230.0740.129
49Grass control33.4240.027NA25CPI147244b27.5240.0160.032
29CPI147279a33.3250.0250.978512F409024.8250.0020.005
9401432.5260.0130.76234IL11824.0260.0010.003
16B132132.2270.0100.694612G401 F223.527<0.0010.002
46Zhong 331.8280.0070.59437Mt-222.128<0.001<0.001
11675530.3290.0010.29435IL2420.129<0.001<0.001
39Ostankinskaya30.1300.0010.271212F320520.130<0.001<0.001
19B91328.731<0.0010.11736IL4618.131<0.001<0.001
36IL4628.432<0.0010.09818B374-6-7s14.932<0.001<0.001
28CPI147257b26.433<0.0010.02030CPI147280b12.033<0.001<0.001
71489424.934<0.0010.005412F32587.434<0.001<0.001
41P1524.635<0.0010.004312F32566.935<0.001<0.001
42PWM706/PWM322.336<0.001<0.001
37Mt-220.537<0.001<0.001
612G401 F215.438<0.001<0.001
21C3-34719.739<0.001<0.001
l.s.d.5.87 l.s.d.7.41
l.s.d., least significant difference at P = 0.05. NA, not applicable.

