Article

Performance, Economics and Potential Impact of Perennial Rice PR23 Relative to Annual Rice Cultivars at Multiple Locations in Yunnan Province of China

1
State Key Laboratory for Conservation and Utilization of Bio-Resources in Yunnan, Research Center of Perennial Rice Engineering and Technology in Yunnan, School of Agriculture, Yunnan University, Kunming 650500, China
2
Yunnan Agricultural Technology Extension Centre, Gaoxinqu District, Kunming 650106, China
3
Department of Agronomy, Ubon Ratchathani Rajabhat University, Ubon Ratchathani 34000, Thailand
4
School of Agriculture and Food Sciences, The University of Queensland, Brisbane, QLD 4072, Australia
*
Authors to whom correspondence should be addressed.
These authors contributed equally to this paper.
Sustainability 2018, 10(4), 1086; https://doi.org/10.3390/su10041086
Submission received: 13 February 2018 / Revised: 27 March 2018 / Accepted: 27 March 2018 / Published: 5 April 2018
(This article belongs to the Special Issue Strategies, Advances and Challenges of Breeding Perennial Grain Crops)

Abstract

:
Perennial grain crops hold the promise of stabilizing fragile lands, while contributing grain and grazing in mixed farming systems. Recently, perennial rice was reported to successfully survive, regrow, and yield across a diverse range of environments in Southern China and Laos, with perennial rice PR23 being identified as a prime candidate for release to farmers. This paper reports the evaluation of PR23 for release, by (1) comparing its survival, regrowth, performance, and adaptation with preferred annual rices across nine ecological regions in southern Yunnan Province of China; (2) examining the economic costs and benefits of perennial versus annual rice there; and (3) discussing the evidence for the release of PR23 as a broadly adapted and acceptable cultivar for farmers. Overall, the grain yield of PR23 was similar to those of the preferred annual rice cultivars RD23 and HXR7, but the economic analysis indicated substantial labour savings for farmers by growing the perennial instead of the annual. PR23 was comparable to the annuals in phenology, plant height, grain yield, and grain size, and was acceptable in grain and cooking quality. Farmers were keen to grow it because of reduced costs and especially savings in labour. PR23 is proposed for release to farmers because of its comparable grain yields to annual rices, its acceptable grain and milling quality, its cost and labour savings, and the likely benefits to soil stability and ecological sustainability, along with more flexible farming systems.

1. Introduction

Perennial crops can regrow after normal harvest, and have been adopted as part of the global toolkit for climate change mitigation and food security in the long term [1,2]. The potential benefits of perennial crops in sustainable farming systems are now drawing the attention of scientific researchers and government officials, not only because of the likely positive ecological effects on landscape and biodiversity conservation, but also the likely significant economic benefits for smallholder farmers [3,4,5,6]. In particular, the rice-growing lands in Asia are largely threatened due to pressure on soil resources [1]. Thus, the development of high-yielding perennial rice cultivars would address the environmental limitations of annual rice while helping to feed the rapidly increasing human population.
With a successful wide hybrid being reported between the wild perennial rice Oryza longistaminata and the annual rice Oryza sativa [7], it was originally proposed that perennial rice should be developed in order to stabilize fragile upland farming systems. Greater understanding of the genetic architecture of perenniality [8,9] was obtained from the study of viable progeny from the wide hybrid segregating for perenniality [10,11]. This led to proposals to introgress additional traits from the wild perennial species into the annual cultivated rice germplasm, and to the perennial rice breeding programs at Yunnan Academy of Agricultural Sciences and Yunnan University.
Rice is one of the most important crops grown worldwide, so the opportunity for the successful development of perennial rice has great potential. Viable progeny from the wide-hybrid segregating for perenniality also acquired nematode resistance and drought tolerance from the wild species, through linkage drag [10,11]. For the development of perennial rice to stabilize the fragile soils of rice-based farming systems, perennial rice breeding using derivatives of the original wide-hybrid and research on the genetic control of perenniality in rice have been continued [1,8,9,10,11]. These efforts offer the opportunity not only for the commercial use of perennial rice, but also for further understanding of the genetic architecture of perenniality in rice.
A successful perennial rice breeding program has been established in the Yunnan Academy of Agricultural Sciences and Yunnan University, with the high-yielding and broadly-adapted experimental line PR23 recommended for pre-release testing under paddy conditions in southern China and Laos [12,13]. Consequently, this paper reports the field evaluation of PR23 in comparison with the main conventional rice cultivars in pre-release testing under paddy conditions in nine ecological regions of Yunnan Province in China, between 2011 and 2017. The objectives were: (1) to compare the survival, regrowth, field performance, and adaptation of perennial rice PR23 with two conventional rice varieties across nine ecological regions of Yunnan; (2) to consider the economic costs and benefits in cultivation of perennial rice relative to annual rice; and (3) to discuss evidence for the commercial release of PR23 as a high-yielding and broadly-adapted perennial rice cultivar for farmers in the Yunnan Province of China.

2. Materials and Methods

Three experiments were conducted in 45 site-year (Environment E) combinations in the Yunnan Province of China (Table 1). Eleven sites were used: Jinghong (21°59′ N, 100°44′ E), Xingping (24°02′ N, 101°34′ E), Dehong (24°26′ N, 98°35′ E), Menghai (21°58′ N, 100°25′ E), Menglian (22°33′ N, 99°59′ E), Mengzhe (21°57′ N, 100°14′ E), Wenshan (23°23′ N, 104°13′ E), Honghe (23°07′ N, 102°40′ E), Puer (22°45′ N, 100°51′ E), Lancang (22°26′ N, 99°58′ E), and Yiliang (24°58′ N, 103°11′ E). Minimum temperature was generally lower at the higher-altitude sites (Supplementary Table S1), with rainfall generally lower December to April, and higher May to November (Supplementary Table S2), according to long-term weather data.

2.1. Experiment 1

In Experiment 1, a randomized complete blocks design with three genotypes and three replicates was used at each site. Plot size was 4.0 × 5.0 m, with 0.2 m row spacing and 0.4 m between hills. Environments are indicated by their environment code; e.g., Jinghong in the first harvest season of 2011 is JH11F (Table 1).
The three genotypes (G) comprised two Oryza sativa cultivars (RD23 and HXR7), and one perennial rice hybrid (PR23) obtained from the cross between Oryza sativa cv. RD23 and Oryza longistaminata (Table 2). RD23 is a popular Indica lowland rice cultivar from Thailand, and is grown widely across south-east Asia because of its broad adaptation, high yield potential, good disease resistance, and high grain quality [14]. In contrast, Oryza longistaminata is a wild rhizomatous perennial with poor agronomic characteristics which comes from swampy areas. The cross between the two species was made in 1997 to combine the perennial habit of O. longistaminata with the agronomic features, broad adaptation, and yield potential of RD23 [7,11,12] via iterative selection in segregating populations from F2 in 2003 to F10 in 2010. HXR7 is another locally popular Indica lowland rice cultivar grown widely by farmers in Yunnan Province due to its high grain yield and its exceptional grain quality. Further details of HXR7 and other Chinese cultivars are available from the China Rice Data Center (http://www.ricedata.cn/variety/varis/). At some sites, farmers substituted a local cultivar with reputedly similar genetic background due to local preference or for greater cold tolerance at higher altitude (Supplementary Table S3). Nevertheless, the substituted cultivars were similar in phenotypic characteristics to the designated cultivar they replaced, so for analytical purposes, were considered this consistent with the designated cultivar. The perennial rice derivative PR23 was not substituted in any environment. Genotypes are referred to by their genotype code (Table 2).
The basal soil fertility of the nine sites used in Experiment 1 is shown in Table 3. Each site received a basal dressing of 30, 30, and 30 kg ha−1 of N, P, and K, respectively, and was established by transplanting from nearby seed beds. After harvest, stubble was cut to 10 cm, so regrowth was consistent. The perennial rice PR23 was allowed to regrow, while RD23 and HXR7 were replanted in each subsequent cycle (Table 1). Each site had access to irrigation, which was used to minimize any yield reduction resulting from any periods of rainfall deficit. Timings of key events were recorded in each environment (as indicated in Table 1), with field duration (days) being from transplanting in the initial crop or stubble cut-off in the ratoon crop to maturity. Plant survival, flowering time, plant height, and panicles per plant were recorded. Regrowth percent is the proportion of plant stand which regrew in subsequent crops. Grain yield and yield components were measured using a five-point sampling method in each location.

2.2. Experiment 2

In Experiment 2, the same three genotypes were evaluated in larger unreplicated plots of about 25.0 × 25.0 m, with similar row and plant spacing to Experiment 1, in order to evaluate the genotypes at smallholder field scale. These larger experiments were conducted at Jing Hong and Puer only (Table 1), with genotypes, management, and measurements being identical to Experiment 1.

2.3. Experiment 3

In Experiment 3, larger plots of PR23 measuring 1.0–13.0 ha in size were established for validation and official release purposes. The plantings took place from 2016 to 2017 in Mengzhe, Menghai, Menglian, and Xingping in southern Yunnan. Field management by farmers was based on the high-yield cultivation protocol devised for perennial rice by Yunnan University. Grain yield was estimated by header harvesting of these commercial areas and compared with results from Experiments 1 and 2.

2.4. Statistical Analysis

Yield data were extracted from single-site analyses in Experiment 1 and combined with data from Experiment 2, so that data for three genotypes (G) across 35 environments (E) were available for analysis. To test combinability over experiments, analyses were conducted for 3G × 23E (Experiment 1), 3G × 12E (Experiment 2), and 3G × 35E (Combined). G × E interactions were analysed using the pattern analysis tool in CropStat [15], using cluster analysis of the G × E matrix transformed by environment standardization, in order to understand genotype adaptation for breeding and variety evaluation [16]. An agglomerative hierarchical algorithm based on minimizing incremental sum of squares was used to cluster the transformed data [17]. In this paper, cluster analysis was used to identify environmental groupings for genotype × environment interaction, but the three individual genotypes were retained for G × E interpretation, as three is minimal for valid analysis [18]. Patterns of grain yield and other selected parameters were then examined for the three genotypes over environment groups. Means were compared using l.s.d. with appropriate degrees of freedom for main effects and interactions [19].

2.5. Experiment 4 and Economic Analysis

Financial data related to cost of inputs, rice cooking quality, milling, and popularity were directly obtained via a survey (Experiment 4) that was distributed to 20 farmers in Experiment 1 in 2016 to 2017. Although this was a small sample, the results reflected the situation throughout the study area, where farmers generally faced similar prices and costs. However, variability of these parameters in time and space must be considered, and this was examined via analysis of variance [19]. The cost of inputs for rice production included diesel, water, fertilizer, pesticide, seed, and human labour required to perform arable farming related to crop production processes such as land preparation, sowing, transplanting, irrigating, spraying, and harvesting. Output and profit were calculated as follows:
Output = Grain yield (kg) × The unit price of grain (Yuan/kg),
Profit = Output (Yuan) − Input (Yuan).
Four parameters were obtained to assess cost–benefit ratios and returns to investment per unit of financial input and per unit of labour, as shown below:
Cost–Benefit by Investment in Inputs = Output (Yuan)/Input (Yuan),
Cost–Benefit by Investment in Labour = Output (Yuan)/days of labour (Yuan),
Return to Investment from Inputs = Profit (Yuan)/Input (Yuan)
Return to Investment from Labour = Profit (Yuan)/days of labour (Yuan).
Means of the parameters were again compared using l.s.d. with appropriate degrees of freedom for main effects and interactions [19].

3. Results

Throughout the duration of the study, long-term mean monthly maximum temperature was generally favourable at all sites, exceeding 30 °C only at Honghe in August and Jing Hong in February–March (Supplementary Table S1). In contrast, long-term mean monthly minimum temperature was below 15 °C for 3 months in Jing Hong (550 m), 4 months in Honghe (1300 m), 5 months in Wenshang and Dehong (900 and 1260 m), 6 months in Lancang and Mengzhe (1150 and 1255 m), and 7 months in Puer and Yiliang (1305 and 1600 m), respectively (Supplementary Table S2). Overall, Jinghong at the lowest altitude was warmest with higher evaporative demand, and Yiliang at the highest altitude was coldest with lower evaporative demand (Supplementary Table S1). Rainfall was higher in 2017 than 2016 at all sites, with December–April generally drier than May–November (Supplementary Table S2). Soils were generally mildly acidic and sufficient in soil organic matter, total N, and available N, P, and K (Table 3).
Data were available for G × E analysis from three genotypes at 23 environments (Experiment 1), 12 environments (Experiment 2), and 35 environments (Combined) (Table 1 and Supplementary Table S3). Site mean yield ranged from 4.81 to 9.71 t ha−1, with yields in the first season generally higher than in the second season, and with yields gradually declining in successive crops (Table 1). Field duration ranged from 100 to 169 days, with longer durations generally at cooler, higher-altitude sites (Table 1). The three genotypes were quite similar in mean field duration and mean grain yield, averaging 108 days and 6.12 t ha−1, respectively, but only PR23 was able to successfully regrow in subsequent seasons, averaging 89.8% regrowth over its 23 crops (Table 2).
Data were analysed separately for Experiments 1 and 2, as well as combined over all environments. In all three analyses, genotype main effects accounted for less than 5% of the total sum of squares, environment main effects accounted for more than 70% of the total sum of squares, while the genotype by environment interactions accounted for 11.4%, 17.3%, and 25.7% of the total sum of squares, for three genotypes by 12, 23, and 35 environments, respectively.
Membership of environment groupings from the three analyses is shown in Table 4, with groupings aligned by environment membership. Remarkably, groupings from the separate analyses are retained in the combined analysis, with two groups in combined (E58 and E56) being composed solely of groups from Experiment 1 (E38 and E36), one group in combined (E34) being composed solely of one group from Experiment 2 (E11), and the remainder combining groups from both Experiments 1 and 2. There were only 3 of 35 environments which were exceptions, as underlines in Table 4. Consequently, combined analysis was chosen for interpretation of the data.
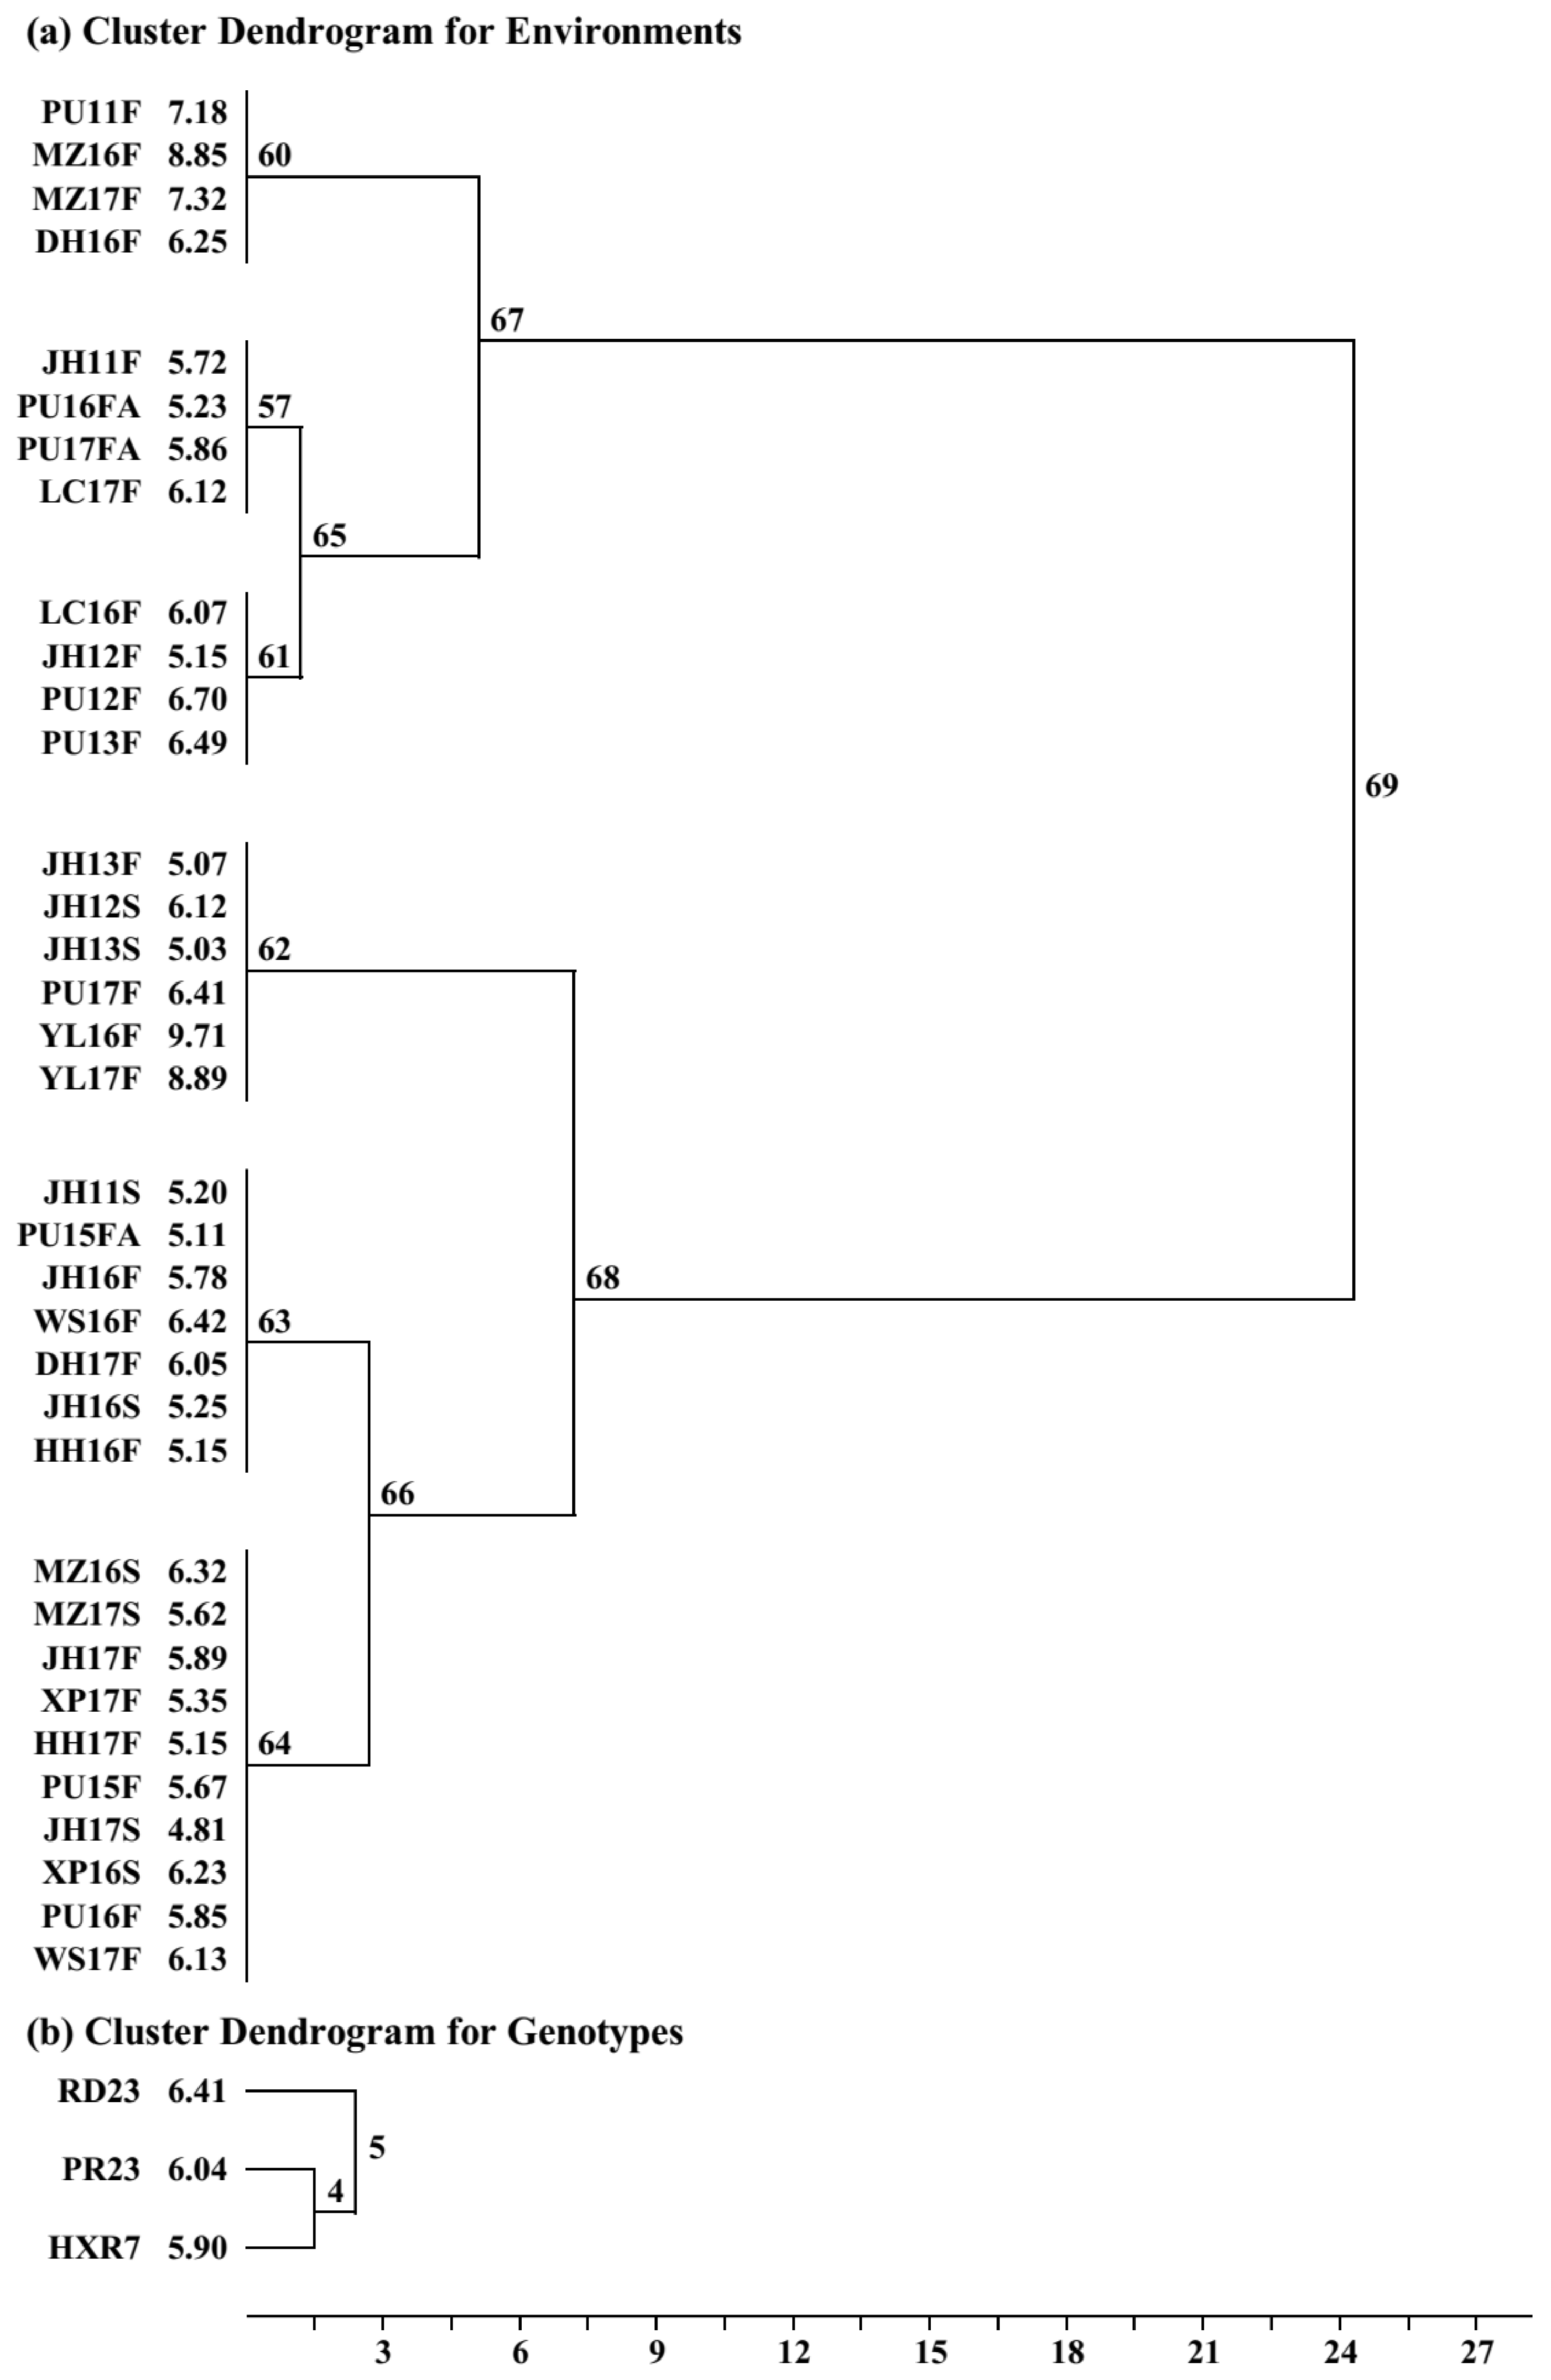
Cluster analysis on environment-standardized residuals was used to identify six environment groups for the three genotypes, which preserved 95.8% of the G × E sum of squares. The cluster dendrogram for environments (Figure 1a) initially separated a set of 12 environments (Fusion 67) from the other 23 environments (Fusion 68). Among the 12-environment set (Fusion 67), a group of four environments separated first (Environment group E60), then the remainder split into two groups of four environments (E61 and E57). Likewise, among the 23-environment set (Fusion 68), a group of six environments separated first (E62), then the remainder split into groups of seven and ten (E63 and E64), respectively. Membership of these groups is shown in Table 4, with E62 comprising E34 and E59, and E64 comprising E58 and E56. Although RD23 separated from PR23 and HRX7 in the cluster dendrogram for genotypes (Figure 1b), all three genotypes were retained for interpretation. Consequently, cluster analysis reduced the matrix from 3 genotypes × 35 individual environments (=105) to 3 genotypes × 6 environment groups (=18), whilst retaining the repeatable G × E variation (95.8%) for interpretation.
Grain yields, growth durations and regrowth percentages are shown for all three genotypes across each of six environmental groups in Table 5, Table 6 and Table 7, respectively. On average, grain yields were highest (7.40 t ha−1) in E60 (PU11F, MZ16F, MZ17F, DH16F) and lowest (5.66 t ha−1) in E64 (ten sites), E63 (seven sites), and E57 (four sites) (Table 5). RD23 yielded 6.41 t ha−1 on average, was highest yielding in E62, E64, and E63, and was lowest yielding in E61 and E60. HXR7 yielded 5.90 t ha−1 on average, was highest yielding in E61 and E57, but lowest in E64 and E63. In contrast, PR23 was more stable in grain yield, averaging 6.04 t ha−1, and was generally intermediate in yield, except in E62 and E60, where it ranked third and first, respectively. On average, growth duration was longest at E60, where yields were highest (Table 6). HXR7 was longer in growth duration (151–171 days), RD23 was intermediate (145–161 days), and PR23 was shortest in growth duration (137–147 days), except in E60, where PR23 took 163 days and was highest yielding (8.49 t ha−1). PR23 successfully regrew in all six environment groups, whereas RD23 and HXR7 did not (Table 7).
Cost–benefit analysis of perennial and annual rice across eight locations in Yunnan in Experiment 1 was compared by location (Table 8) and by growth habit and season (Table 9). Although locations did not differ significantly in cost–benefit per unit of investment, cost–benefit per unit of labour, or profit per unit of investment, locations did differ significantly in profit per day (Table 8), with Yiliang (226 Yuan/d) being the most profitable, and Puer the least profitable (118.5 Yuan/d). In contrast, all four parameters were statistically significant for the interaction between growth habit and season (Table 9). In each case, the ratoon crop of PPR23 was more profitable than the re-sown crop of HXR7 in the second season. As a consequence, the second crop was more profitable than the first, and PR23 was more profitable than HXR7 on average. Thus, allowing the perennial rice PR23 to ratoon resulted in greater profit, especially per unit of labour, due to substantial savings in the amount and cost of labour.
Different traits of perennial rice PR23 and annual rice RD23 and HXR7 are presented in Table 10. The grain yield of PR23 (7.05 t ha−1) was significantly higher than RD23 (5.69 t ha−1) and HXR7 (5.89 t ha−1) in Experiment 1 in both seasons. The major causes for this result were the lower number of panicles and the higher 1000-grain weight of PR23 in comparison with RD23 and HXR7. However, the number of spikelets per panicle of PR23 was slightly fewer than those of RD23 and HXR7. The growth duration of PR23 (135 d) was shorter than RD23 (152 d) and HXR7 (152 d) in the second season, though they were similar in the first season (157 d). Panicle length of PR23 (20.0 cm) was less than RD23 (25.4 cm) and HXR7 (22.9 cm) in both seasons. There was no significant difference in plant height. The duration of flowering in PR23 was longer than RD23 and HXR7 in both seasons, which may be conducive to adequate pollination and fertilization in PR23. Grain quality of PR23 was similar to RD23, although it ranked behind HXR7, which farmers prefer. Nevertheless, the cooking quality of PR23 was comparable with HXR7, and higher than RD23. In addition, PR23 was preferred by millers due to its high rice yield and high milling percentage (73%). Overall, farmers preferred PR23 due to the savings of labour and decreased intensity of labour, as a result of not having to till and replant each season. Thus, PR23 had obvious economic benefits, resulting in its growing popularity with farmers.
Finally, perennial rice PR23 was successfully grown and mechanically harvested from four large demonstration areas of 1.0 to 13.0 ha on-farm in southern Yunnan (Table 11). Total grain yield of PR23 per year exceeded 13 t/ha in each demonstration area, with Mengzhe yielding 17.4 t ha−1 in 2006 from seasons 1 and 2, and 15.1 t ha−1 in 2017 from seasons 3 and 4. Ratoon percentage of PR23 ranged from 90.0–98.2%, including 93.3% and 90.0% in seasons 3 and 4 at Mengzhe, indicating its strong perenniality across a range of irrigated environments. Grain yield of PR23 was higher in the first season than in the second season, due to the shorter growth duration, fewer panicles, and fewer spikelets per panicle in the second season. These results confirmed that PR23 produced high yield, excellent regrowth, and adaptability when grown at commercial scale on-farm. Consequently, there has been an upsurge in demand for PR23 among local subsistence farmers and large commercial growers, indicating a bright future for perennial rice production and application across wider areas. This evidence is consistent with the need to release PR23 to farmers in Yunnan, as the first-ever perennial rice grain crop.

4. Discussion

4.1. Survival, Regrowth, Performance, and Adaptation of PR23 versus Preferred Annual Rices

The performance of perennial rice (PR23) relative to two popular annual rice cultivars (RD23 and HXR7) was examined across 35 environments in Yunnan Province of China, with cluster analysis confirming the validity of this combined analysis over experiments 1 and 2 (Table 4). On average, the three genotypes were quite similar (Table 2), which is not surprising since all three genotypes were considered to be well-adapted from previous evidence [12,13]. Nevertheless, the G × E interaction accounted for 25.7% of the total sum of squares in the combined analysis of variance, while cluster analysis identified six environmental groups from the 35 environments (Figure 1), which retained 95.8% of the G × E sum of squares.
While genotype mean yields were similar on average, the rankings changed among environmental groups (Table 5). In environmental groups E62, E63, and E64 (Fusion 68), RD23 was highest yielding on average (6.68 t ha−1), while in E60, E61, and E57 (Fusion 68), PR23 or HXR7 were highest yielding (Figure 1 and Table 5).
Environment group E60 was the highest yielding on average (7.40 t ha−1), with PR23 performing best there (8.49 t ha−1). The four environments in E60 (Table 4) were all first-season, mostly first crops in the cycle, and at altitudes of 900–1300 m (Table 1). This suggested PR23 had a higher yield potential in the first crop (also evident in Table 10), perhaps due to a higher seedling vigour in the interspecific hybrid, as shown by its reduced time in the seedling nursery up to transplanting (Table 2). Higher altitude and cooler temperature would also favour a high yield potential there. HXR7 was highest yielding in environmental groups E61 and E57 (Table 5), which featured predominately later-cycle crops (second and third crops; Table 1) and substitute cultivars for HXR7, especially in E61 (Supplementary Table S3). The slightly lower yield of PR23 in E61 and E57 could be associated with ratoon crops of the perennial (also evident in Table 10), while HXR7 may have benefited from farmer selection of locally-adapted cultivars—especially in E61.
Conversely, in environment groups E63, E64, and E62 (where RD23 was highest yielding), its performance would also have benefited from farmer selection of locally-adapted cultivars, which occurred in most of these environments (Supplementary Table S3). Given that the comparison is always among well-adapted genotypes, it is not surprising that such changes can alter the rankings within an environment group. However, it must be emphasized that all in cases, grain yields were universally high, again emphasizing the broad adaptation of PR23 relative to leading popular cultivars, and even locally preferred cultivars at individual locations. These data suggest that PR23 can be grown successfully across this range of environments, though it can be slightly exceeded at individual locations by a locally-preferred genotype. Nevertheless, PR23 would be a good choice at all locations tested.
Interestingly, the effects of cooler temperatures were less apparent in this data set than in previous reports [12]. This appears to be due to improved management, with times of sowing and resowing in the nursery (under cover for warmth during seedling establishment), allowing growth after transplanting (annual rices RD23 and HXR7) or regrowth after cut-off (perennial rice PR23) to avoid coincidence of sensitive growth stages with temperatures below 15 °C (Supplementary Table S1 and Table 1). Likewise, with irrigation, and in the absence of lower latitude sites with higher evaporative demand [13], rainfall deficit was not an issue here. As a result, the grain yields recorded here were generally much higher than in previous reports [12,13].
The major difference between genotypes was in capacity for regrowth, with PR23 able to regrow at every location in every environmental group. In contrast, RD23, HXR7, and the substitute genotypes were universally poor in regrowth, lacking in vigour, and failing to contribute grain from any border sections not resown as intended. Phenology was generally quite similar among the three genotypes overall, although sowing to transplanting was less in PR23, allowing it a little extra time in flowering duration and grain filling (Table 2 and Table 6). The three genotypes were also similar in plant height (Table 2).
Importantly, the evidence in Table 11 clearly confirms the transferability of perennial rice technology across scales from small experimental plots of 20 m2 (Experiment 1) to smallholder fields of about 1 mu or 625 m2 (Experiment 2), to large fields of 1.0 to 13.0 ha on commercial farms with header harvesting (Experiment 3). This is strong evidence supporting the need to release PR23 to farmers.

4.2. Economics and Farmer Preference of PR23 Perennial Rice versus Annual Rice Cultivars

The results from economic analysis demonstrate the economic advantages to the farmer of growing perennial rice, which accrue predominately via savings in labour and labour intensity by not having to sow and transplant in each crop cycle (Table 8 and Table 9). Labour scarcity is increasingly an issue in rice production [20,21,22], so it is not surprising that farmers liked the capacity of PR23 to regrow after harvest (Table 10), thereby reducing labour demand, and also the drudgery implicit in transplanting, especially for women and children.
Consequently, the first preference of the farmers was for perenniality, as it saved labour and labour intensity by removing the need for tillage, sowing, and transplanting in subsequent crop cycles. Second, the grain yield of PR23 was stable and similar to those of the currently preferred annual rice cultivars (Table 10). Third, the farmers were happy with the grain, cooking, and milling quality of PR23 (Table 10). In addition, the farmers observed that PR23 was more tolerant of rice blast, which has caused serious damage in their rice fields, and is now included as a criterion for cultivar release by government.
It is important to note that the observed regrowth in PR23 was never less than 65% (Table 1), which was still sufficient to support a grain yield of 6.13 t ha−1 at Wenshang 2017F. Further research is needed to determine a minimum regrowth percentage at which grain yield may be compromised, and hence, a further cycle of regrowth may become uneconomic. Nevertheless, the results presented here are consistent with the viability of up to a six-crop cycle, at least under the conditions of test. The results also suggest that a perennial rice, whilst retaining the advantages of ratooning a conventional rice cultivar for reduced costs [23], should accrue even greater benefit to the farmers, as a result of the sustained regrowth capacity in the perennial (Table 1).

4.3. The Case for Release for PR23 to Farmers

This paper clearly confirms the broad adaptation of PR23 at levels comparable to or better than popular annual rice cultivars RD23 and HXR7. Consistently high yields were attained by PR23 across sites, years, and cycles of regrowth, with the perennial habit, reduced labour requirement, and greater economic returns seen as major advantages. Grain quality was equal to RD23, and milling quality exceptional, so farmers and millers were happy with PR23. Consequently, we conclude that PR23 should be released to farmers because of its high yield performance, suitable quality, labour savings, economic advantages, and likely benefits to system flexibility and sustainability, as a result of the perennial growth habit.

Supplementary Materials

The following are available online at https://www.mdpi.com/2071-1050/10/4/1086/s1, Table S1: Long-term mean monthly maximum & minimum temperature (°C) & pan evaporation (mm) for 9 locations in Yunnan Province; Table S2: Monthly rainfall (mm) in 2016 and 2017 relative to the long-term mean monthly rainfall (mm) at 9 locations in Yunnan province; Table S3: Identities and mean grain yields (t ha−1) of 3 genotypes in each of 35 environments in Yunnan Province.

Acknowledgments

National key research and development plan of China (2016YFD0300508), the Department of Sciences and Technology of Yunnan Province (2016BB001), “Yunnan University serves in Yunnan” Action Project (2016ZD03) provided financial support for this research. We thank the Prefectural Governments of Jing Hong, Mengzhe, Menglian, Puer, Dehong, Yiliang, Lancang and Wenshang in Yunnan, China for providing land, facilities and labour for the experiments.

Author Contributions

G.F.H., S.L.Z. conducted Experiments 1 and 2; X.L.C., S.K.W., J.R.D. conducted Experiment 3; J.Z., L.Y.H., S.L.Z., G.F.H. set up data; D.H. analysed data under L.J.W. guidance; S.W.Q. prepared first draft under L.J.W. guidance; L.J.W. wrote manuscript; F.Y.H. conceived the research and provided guidance throughout the study.

Conflicts of Interest

The authors declare no conflict of interest.

References

  1. Batello, C.; Wade, L.; Cox, S.; Pogna, N.; Bozzini, A.; Choptiany, J. Perennial Crops for Food Security. In FAO Expert Workshop on Perennial Crops for Food Security Rome (Italy) 28–30 Aug 2013; Food and Agriculture Organization: Rome, Italy, 2014. [Google Scholar]
  2. Whelchel, S.; Berman, E.P. Paying for perennialism a quest for food and funding. Issues Sci. Technol. 2011, 28, 63–76. [Google Scholar]
  3. Glover, J.D.; Reganold, J.P. Perennial grains food security for the future. Issues Sci. Technol. 2010, 26, 41–47. [Google Scholar]
  4. Leakey, R.R.B. Twelve Principles for Better Food and More Food from Mature Perennial Agroecosystems; Elsevier: Amsterdam, The Netherlands, 2017. [Google Scholar]
  5. Parker, L.E.; Abatzoglou, J.T. Projected changes in cold hardiness zones and suitable overwinter ranges of perennial crops over the United States. Environ. Res. Lett. 2016, 11, 034001. [Google Scholar] [CrossRef]
  6. Marquardt, K.; Vico, G.; Glynn, C.; Weih, M.; Eksvãrd, K.; Dalin, P.; Björkman, C. Farmer perspectives on introducing perennial cereal in Swedish farming systems: A sustainability analysis of plant traits, farm management, and ecological implications. J. Sustain. Agric. 2016, 40, 432–450. [Google Scholar] [CrossRef]
  7. Tao, D.Y.; Sripichitt, P. Preliminary report on transfer traits of vegetative propagation from wild rice species to Oryza sativa via distant hybridization and embryo rescue. Witthayasan Kasetsart 2000, 34, 1–11. [Google Scholar]
  8. Hu, F.Y.; Tao, D.Y.; Sacks, E.; Fu, B.Y.; Xu, P.; Li, J.; Yang, Y.; Mcnally, K.; Khush, G.S.; Paterson, A.H. Convergent evolution of perenniality in rice and sorghum. Proc. Natl. Acad. Sci. USA 2003, 100, 4050–4054. [Google Scholar] [CrossRef] [PubMed]
  9. Hu, F.; Di, W.; Zhao, X.; Zhang, T.; Sun, H.; Zhu, L.; Fan, Z.; Li, L.; Li, Q.; Tao, D. Identification of rhizome-specific genes by genome-wide differential expression Analysis in Oryza longistaminata. BMC Plant Biol. 2011, 11, 18. [Google Scholar] [CrossRef] [PubMed]
  10. Sacks, E.J.; Roxas, J.P. Developing Perennial Upland Rice II: Field Performance of S1 Families from an Intermated Oryza sativa/O. longistaminata Population. Crop Sci. 2003, 43, 129–134. [Google Scholar] [CrossRef]
  11. Sacks, E.J.; Dhanapala, M.P.; Tao, D.Y.; Cruz, M.T.S.; Sallan, R. Breeding for perennial growth and fertility in an Oryza sativa/O. longistaminata population. Field Crops Res. 2006, 95, 39–48. [Google Scholar] [CrossRef]
  12. Zhang, S.; Hu, J.; Yang, C.; Liu, H.; Yang, F.; Zhou, J.; Samson, B.K.; Boualaphanh, C.; Huang, L.; Huang, G. Genotype by environment interactions for grain yield of perennial rice derivatives (Oryza sativa L./Oryza longistaminata) in southern China and Laos. Field Crops Res. 2017, 207, 62–70. [Google Scholar] [CrossRef]
  13. Samson, B.K.; Voradeth, S.; Zhang, S.; Tao, D.; Xayavong, S.; Khammone, T.; Douangboupha, K.; Sihathep, V.; Sengxua, P.; Phimphachanhvongsod, V. Performance and survival of perennial rice derivatives (Oryza sativa L./Oryza longistaminata) in Lao PDR. Exp. Agric. 2017. [Google Scholar] [CrossRef]
  14. Chakhonkaen, S.; Pitnjam, K.; Saisuk, W.; Ukoskit, K.; Muangprom, A. Genetic structure of Thai rice and rice accessions obtained from the International Rice Research Institute. Rice 2012. [Google Scholar] [CrossRef] [PubMed]
  15. Delacy, I.H.; Basford, K.E.; Cooper, M.; Bull, J.K.; McLaren, C.G. Analysis of multi-environment trials—An historical perspective. In Plant Adaptation and Crop Improvement; Cooper, M., Hammer, G.L., Eds.; CAB International: Wallingford, UK, 1996; pp. 39–124. [Google Scholar]
  16. Cooper, M. Concepts and strategies for plant adaptation research in rainfed lowland rice. Field Crop. Res. 1999, 64, 13–34. [Google Scholar] [CrossRef]
  17. Ward, J., Jr. Hierarchical Grouping to Optimize an Objective Function. Publ. Am. Stat. Assoc. 1963, 58, 236–244. [Google Scholar] [CrossRef]
  18. Botwright Acuna, T.L.; Wade, L.J. Use of genotype x environment interactions to understand rooting depth and the ability of wheat to penetrate hard soils. Ann. Bot. 2013, 112, 359–368. [Google Scholar] [CrossRef] [PubMed]
  19. Steel, R.G.D.; Torrie, J.H. Principles and Procedures of Statistics; McGraw-Hill Book Company: New York, NY, USA, 1960; p. 481. [Google Scholar]
  20. Sengxua, P.; Samson, B.K.; Bounphanousay, C.; Xayavong, S.; Douangboupha, K.S.; Harnpichitvitaya, D.; Jackson, T.M.; Wade, L.J. Adaptation of rice (Oryza sativa L.) genotypes in the rainfed lowlands of Lao PDR. Plant Prod. Sci. 2017, 20, 477–484. [Google Scholar] [CrossRef]
  21. Sengxua, P.; Jackson, T.M.; Simali, P.; Vial, L.K.; Douangboupha, K.S.; Clarke, E.; Harnpichitvitaya, D.; Wade, L.J. Integrated nutrient-weed management under mechanized dry direct-seeding (DDS) is essential for sustained smallholder adoption in rainfed lowland rice (Oryza sativa L.). Exp. Agric. 2018, in press. [Google Scholar]
  22. Clarke, E.; Jackson, T.M.; Koeka, K.; Phimphachanvongsod, V.; Sengxua, P.; Simali, P.; Wade, L.J. Insights into adoption of farming pactices through multiple lenses: An innovation systems approach. Dev. Pract. 2018, in press. [Google Scholar]
  23. Hill, R.D. Back to the future! Thoughts on ratoon rice in Southeast and East Asia. In Perennial Crops for Food Security; Batello, C., Wade, L.J., Cox, T.S., Pogna, N., Bozzini, A., Choptiany, J., Eds.; FAO: Rome, Italy, 2014; pp. 362–375. [Google Scholar]
Figure 1. (a) Environment and (b) genotype groupings applied to standardized yield data for perennial rice PR23, and annual rice RD23 and HXR7, over 35 environments. The dendrograms show fusion levels at which the groups join. The fusion level is proportional to the increase in within-group sum of squares at each fusion. The 35 environments were truncated to six environment groups using Ward’s agglomerative clustering algorithm. Refer to Table 1 and Table 2 for environment and genotype codes. Mean grain yields (t ha−1) are also shown for each environment and genotype.
Sustainability 10 01086 g001
Table 1. The 35 environments used to discriminate the perennial rice genotypes.
EnvExptSiteAltitude (m)SeasonYearCodeSow Re-SowTP/CutFlowerMatureDuration (d)Regrowth PR23 (%)Yield (t ha−1)
11Jinghong550First2016JH16F30 Jan05 Mar19 May30 Jun117n.a.5.78
21Jinghong550Second2016JH16S 14 Jul19 Sep08 Nov11893.35.25
31Jinghong550First 2017JH17F-17 Jan18 Apr02 Jun13792.05.89
41Jinghong550Second2017JH17S-30 Jun04 Sep20 Oct11088.64.81
51Xingping600Second2016XP16S12 Jun20 Jul26 Sep06 Nov110n.a.6.23
61Xingping600First2017XP17F-19 Feb11 May15 Jun11785.35.35
71Dehong900First2016DH16F22 Apr23 May01 Aug15 Sep116n.a.6.25
81Dehong900First2017DH17F-21 Feb19 Jun13 Aug16790.06.05
91Mengzhe1255First2016MZ16F23 Dec03 Feb01 Jun11 Jul160n.a.8.85
101Mengzhe1255Second2016MZ16S-20 Jul30 Sep16 Nov12098.26.32
111Mengzhe1255First2017MZ17F-17 Feb11 Jun11 Jul14593.37.32
121Mengzhe1255Second2017MZ17S-12 Jul22 Oct25 Nov13690.05.62
131Wenshang1260First2016WS16F23 Apr25 May07 Aug01 Sep100n.a.6.42
141Wenshang1260First2017WS17F-12 May13 Aug25 Sep13765.06.13
151Honghe1300First2016HH16F17 Mar01 Apr26 Jun08 Aug130n.a.5.15
161Honghe1300First2017HH17F-14 Apr02 Jun18 Aug12792.05.15
171Puer1305First2015PU15F19 Feb04 Apr30 Jun05 Aug124n.a.5.67
181Puer1305First2016PU16F-20 Feb10 Jul10 Aug17396.05.85
191Puer1305First2017PU17F-22 Mar20 Jun05 Aug13785.06.41
201Lancang1150First2016LC16F15 Feb13 Apr04 Jul15 Aug125n.a.6.07
211Lancang1150First2017LC17F-10 Apr27 Jun11 Aug12496.16.12
221Yiliang1600First2016YL16F15 Mar20 Apr22 Jul26 Aug129n.a.9.71
231Yiliang1600First2017YL17F-28 Apr15 Aug18 Sep14480.38.89
242Puer1305First2011PU11F07 Mar15 Apr06 Jul11 Aug118n.a.7.18
252Puer1305First2012PU12F-28 Mar26 Jun12 Aug13795.06.70
262Puer1305First2013PU13F-23 Apr15 Jul20 Aug15091.06.49
272Puer1305First2015PU15FA03 Mar04 Apr28 Jun05 Aug141n.a.5.11
282Puer1305First2016PU16FA-20 Feb08 Jul10 Aug16996.05.23
292Puer1305First2017PU17FA-22 Apr06 Jul05 Aug13385.05.86
302Jinghong550First2011JH11F10 Jan20 Feb20 Apr10 Jun110n.a.5.72
312Jinghong550Second2011JH11S-13 Jun17 Aug22 Oct13193.05.20
322Jinghong550First2012JH12F-10 Feb27 Apr05 Jun11690.05.15
332Jinghong550Second2012JH12S27 Jun14 Jul12 Oct16 Nov125n.a.6.12
342Jinghong550First2013JH13F-05 Feb29 May08 Jul15394.05.07
352Jinghong550Second2013JH13S-01 Aug11 Nov05 Dec12688.05.03
363Mengzhe1255First2016MZ16F28 Dec30 Jan3 Jun11 Jul162n.a.10.9
373Mengzhe1255Second2016MZ16S-18 Jul27 Sep20 Nov12598.26.6
383Mengzhe1255First2017MZ17F-15 Feb13 Jun13 Jul14893.38.7
393Mengzhe1255Second2017MZ17S-13 Jul25 Oct29 Nov13990.06.5
403Menghai1300First2017MZ17F18 Feb31 Mar25 Jun10 Aug132n.a.8.6
413Menghai1300Second2017MZ17S-10 Aug10 Oct12 Dec12491.55.1
423Menglian980First2017MZ17F26 Dec3 Feb15 May25 Jul142n.a.10.1
433Menglian980Second2017MZ17S-25 Jul28 Sep8 Nov13694.56.3
443Xingping760First2017MZ17F20 Dec20 Feb26 May2 Jul132n.a.9.42
453Xingping760Second2017MZ17S-2 Jul23 Sep2 Nov12395.24.82
mean 13390.76.47
l.s.d. 1915.00.83
Note: Env: environment; Expt: experiment; Code: environment code used in subsequent tables and figures to designate each environment according to its site year and season; Sow/Re-sow: dates of sowing or of re-sowing of annuals; TP/Cut: dates of transplanting for initial crops or of stubble cut-off for ratoon crops; Flower: date of flowering; Mature: date of maturity; Duration: field duration from TP/Cut to Mature; Regrowth%: percent of plant stand which regrew in subsequent crops; Yield: grain yield; Code in bold type is the first crop in the cycle at each site. l.s.d. is p < 0.05.
Table 2. Genotypes evaluated in perennial rice experiments.
Number CasesGenotype CodeGrowth HabitCrop TypeRice TypeAdaptation ResponseSW-TP (d)TP-FL (d)FL-MT (d)Height (cm)Regrowth (%)Yield (t ha−1)
1 (35)PR23PerennialInterspecificjaponicaI, RL33704111089.86.04
2 (35)RD23AnnualImproved cvindicaI, N467234109n.a.6.41
3 (35)HXR7AnnualImproved cvindicaI, N487432112n.a.5.90
Mean 427236111n.a.6.12
l.s.d. 6.36.36.34.65.00.28
Note: SW-TP: duration from sowing to transplanting or cut-off; TP-FL: duration from transplanting/cut-off to flowering; FL-MT: duration from flowering to maturity. Adaptation: I = Irrigated, RL = Rainfed lowland, N = Nutrient responsive. l.s.d. is p < 0.05.
Table 3. Characterisation of soils at nine sites in Yunnan Province, China.
SitepHSOMTotal NAvail NAvail PAvail K
(g kg−1)(g kg−1)(mg kg−1)(mg kg−1)(mg kg−1)
Jinghong5.0534.002.10155.607.58139.10
Xingping5.3530.201.41112.4012.34109.15
Dehong4.9529.601.64116.0089.99177.18
Mengzhe5.2331.751.35162.8917.16120.78
Wenshang5.3429.701.40120.1213.24111.21
Honghe5.3924.491.74120.1222.38111.18
Puer6.1039.002.50123.0012.30108.00
Lancang5.7829.721.35120.1310.35110.21
Yiliang7.8133.951.47158.0018.16222.00
Mean5.6729.391.52132.7516.96147.80
Note: SOM: soil organic matter; Total N: total nitrogen; Avail N: available nitrogen; Avail P: available phosphorus; Exch K: exchangeable potassium.
Table 4. Membership of environment groups for Experiment 1(23), Experiment 2 (12) and Combined (35) analyses. Groupings from the separate analyses by individual experiment were retained in the combined analysis, with only three exceptions, as underlined.
Experiment 1 (23)Experiment 2 (12)Combined (35)
-E11 (1)E34 (1)
-JH13FJH13F
E35 (4)E14 (2)E59 (5)
PU17F, YL16F, YL17F, JH17SJH12S, JH13SJH12S, JH13S, PU17F, YL16F, YL17F
E38 (7)-E58 (7)
MZ16S, MZ17S, JH17F, XP17F, HH17F, PU15F, JH16S-MZ16S, MZ17S, JH17F, XP17F, HH17F, PU15F, JH17S
E36 (3)-E56 (3)
XP16S, PU16F, WS17F-XP16S, PU16F, WS17F
E37 (3)E17 (2)E63 (7)
JH16F, WS16F, DH17FJH11S, PU15FAJH11S, PU15FA, JH16F, WS16F, DH17F, JH16S, HH16F
E20 (1)E18 (3)E61 (4)
LC16FJH12F, PU12F, PU13FLC16F, JH12F, PU12F, PU13F
E21 (1)E16 (3)E57 (4)
LC17FJH11F, PU16FA, PU17FAJH11F, PU16FA, PU17FA, LC17F
E40 (4)E1 (1)E60 (4)
MZ16F, MZ17F, DH16F, HH16FPU11FPU11F, MZ16F, MZ17F, DH16F
Table 5. Performance of three genotypes across six environment groups: grain yield (t ha−1).
GenotypeE62 (6)E64 (10)E63 (7)E61 (4)E57 (4)E60 (4)Mean (35)l.s.d.
G1–PR236.405.205.846.095.458.496.040.28
G2–RD237.156.816.075.835.546.396.41
G3–HXR77.065.104.786.396.227.335.90
Mean6.875.705.566.105.737.406.12
l.s.d.0.48 0.68
Environment group codes are as in Figure 1a; l.s.d. are provided in each table for genotype, environment, and G × E for each trait (p < 0.05).
Table 6. Performance of three genotypes across six environment groups: field duration from transplant/cut to mature (days).
GenotypeE62 (6)E64 (10)E63 (7)E61 (4)E57 (4)E60 (4)Mean (35)l.s.d.
G1–PR231351291271271351341316.3
G2–RD23119116123119112119118
G3–HXR7112111113110114133116
Mean122119121119120129122
l.s.d.10.9 15.4
Environment group codes are as in Figure 1a; l.s.d. are provided in each table for genotype, environment, and G × E for each trait (p < 0.05).
Table 7. Performance of three genotypes across six environment groups: regrowth percent (%).
GenotypeE62 (6)E64 (10)E63 (7)E61 (4)E57 (4)E60 (4)Mean (35)l.s.d.
G1–PR2386.888.492.192.092.493.389.9n.a.
G2–RD23n.a.n.a.n.a.n.a.n.a.n.a.n.a.
G3–HXR7n.a.n.a.n.a.n.a.n.a.n.a.n.a.
Meann.a.n.a.n.a.n.a.n.a.n.a.n.a.
l.s.d.8.7 n.a.
Environment group codes are as in Figure 1a; l.s.d. are provided in each table for genotype, environment, and G × E for each trait (p < 0.05).
Table 8. Economic analysis of perennial and annual rice cropping at each of eight locations in southern Yunnan Province of China, ** p < 0.01.
ParameterDehongHongheJinghongLancangMengzhePuerWenshanYiliangMeanl.s.d.
C-B/Yuan0.5970.3990.3110.2830.3840.2000.3380.6030.3890.348 n.s.
C-B/Day69.740.242.728.841.320.934.484.245.346.24 n.s.
Profit/Yuan1.5971.3991.3111.2831.3841.2001.3381.6031.3890.348 n.s.
Profit/Day178.3138.5172.7127.2147.3118.5133.0226.4155.247.55 **
Cost–benefit per unit of investment (C-B/Yuan), cost–benefit per unit of Labour (C-B/Day), profit per unit of investment (Profit/Yuan), and profit per unit of labour (Profit/Day).
Table 9. Economic analysis of perennial and annual rice cropping for perennial rice PR23 and annual rice HXR7 in original and ratoon crops, averaged over eight locations. ** p < 0.01.
SeasonC-B/yuanC-B/yuanC-B/yuanC-B/dayC-B/dayC-B/dayProfit/yProfit/yProfit/yProfit/dProfit/dProfit/d
PR23HXR7MeanPR23HXR7MeanPR23HXR7MeanPR23HXR7Mean
Original0.2930.1780.23532.819.926.31.2931.1781.235141.5127.7134.6
Ratoon0.9720.1140.543115.912.464.21.9721.1141.543232.5119.3175.9
Mean0.6330.1460.38974.416.245.31.6331.1461.389187.0123.5155.3
GenotypeSeasonG × SGenotypeSeasonG × SGenotypeSeasonG × SGenotypeSeasonG × S
l.s.d.0.174 **0.174 **0.246 **23.12 **23.12 **32.70 **0.174 **0.174 **0.246 **23.78 **23.78 **33.63 **
Table 10. Traits of PR23, RD23 and HXR7 in Experiment 1. l.s.d. are p < 0.05.
TraitSeasonPR23RD23HXR7MeanSourcel.s.d.
Sowing–Transplanting (d)137404240S, G a6.3
2n.a.394140S × G8.9
T’plant/Cut-off–Flower (d)184858083S, G6.3
290787882S × G8.9
Flower–Mature (d)139343837S, G6.3
246363640S × G8.9
Plant height (cm)1109109115111S, G4.6
2111107113111S × G6.5
Panicle length (cm)120.925.623.323.3S, G0.6
219.125.122.522.2S × G0.8
Effective panicles (106 ha−1)12.902.402.422.57S, G0.15
23.002.202.262.49S × G0.21
Spikelets/panicle (no)1139152147146S, G7.26
2121149142137S × G10.26
Grains/spikelet (no)166.861.965.764.9S, G2.43
261.969.963.264.0S × G3.43
1000-Grain Weight (g)126.225.225.225.5S, G0.44
225.524.424.724.9S × G0.62
Grain yield17.055.695.896.21S, G0.28
25.735.595.015.44S × G0.39
Grain quality *1221n.a.S, Gn.a.
2221n.a.S × Gn.a.
Cooking Quality *1121n.a.S, Gn.a.
2222n.a.S × Gn.a.
Farmer preference **1231n.a.S, Gn.a.
2231n.a.S × Gn.a.
Miller preference **1122n.a.S, Gn.a.
2122n.a.S × Gn.a.
Regrowth1n.a.n.a.n.a.n.a.S, G5.0
287.0n.a.n.a.n.a.S × Gn.a.
l.s.d. for site, genotype and site × genotype (S × G) are shown for each trait (p < 0.05); * 1 = good, 2 = medium, 3 = ordinary ** 1 = much, 2 = better, 3 = general.
Table 11. Demonstration of PR23 in large plots for four locations. The first crop of the cycle is shown in bold. l.s.d. are p < 0.05.
YearSeasonSitesArea (ha)No. of Grain Panicle (×106/ha)Spikelets per PanicleSeeds Setting Rate (%)1000-Grain Weight (g)Ratoon (%)Grain Yield (t/ha)Total Seasons 1&2
20161Mengzhe13.3138.190.726.0-10.9
20162Mengzhe12.9110.282.924.898.26.617.4
20171Mengzhe14.5108.780.121.993.38.7
20172Mengzhe13.1108.678.825.790.06.515.1
20171Menghai133.3109.475.222.8-8.6
20172Menghai133.464.174.626.891.55.113.7
20171Menglian2.333.5141.886.023.2-10.1
20172Menglian2.333.4139.870.324.394.56.316.4
20171Xingping83.2135.782.123.6-9.4
20172Xingping82.992.794.523.795.24.814.2
Site a 0.8230.714.73.28.71.02.0
Season 0.5219.49.32.0n.a.0.61.2
S × S 1.1643.420.74.6n.a.1.32.6
a l.s.d. for site, season and site × season (S × S) are shown below the table for each trait (p < 0.05).

