Agricultural Land vs. Urbanisation in Chosen Polish Metropolitan Areas: A Spatial Analysis Based on Regression Trees


Abstract
:1. Introduction
2. Theoretical Background
2.1. Theorising Land Use as an Economic Framework
2.2. Factors of Land Use with Special Reference to Farmland
3. Materials and Methods
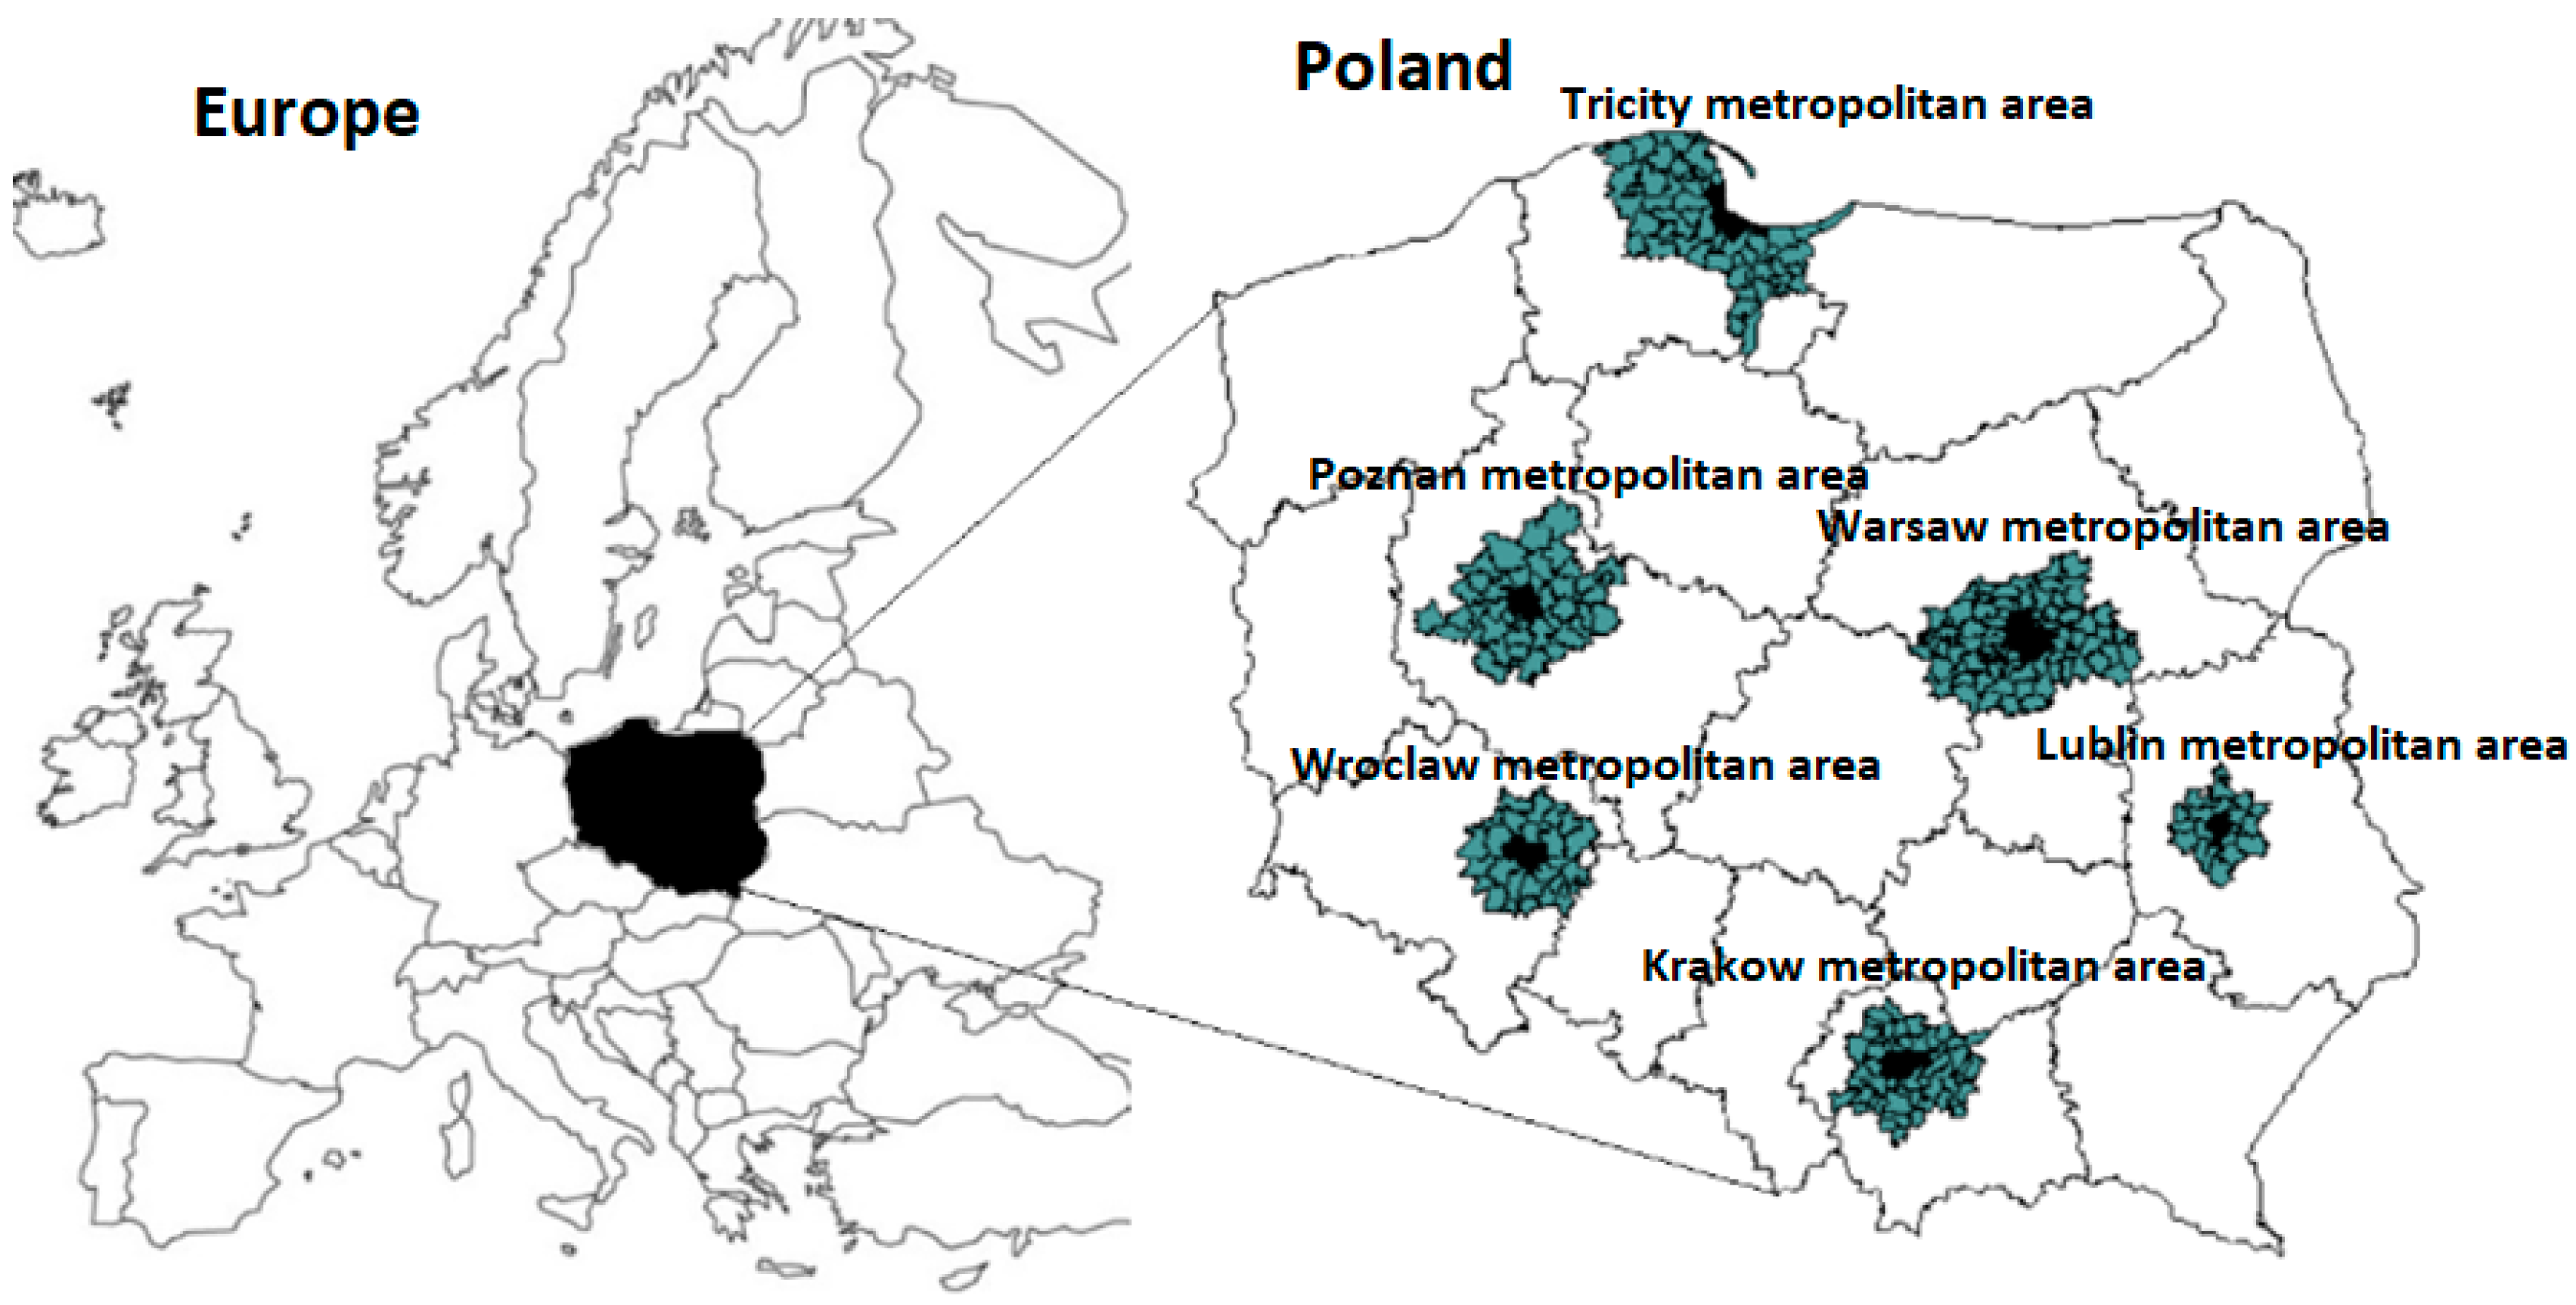
3.1. Study Area
3.2. Data Collection and Definition of Research Variables
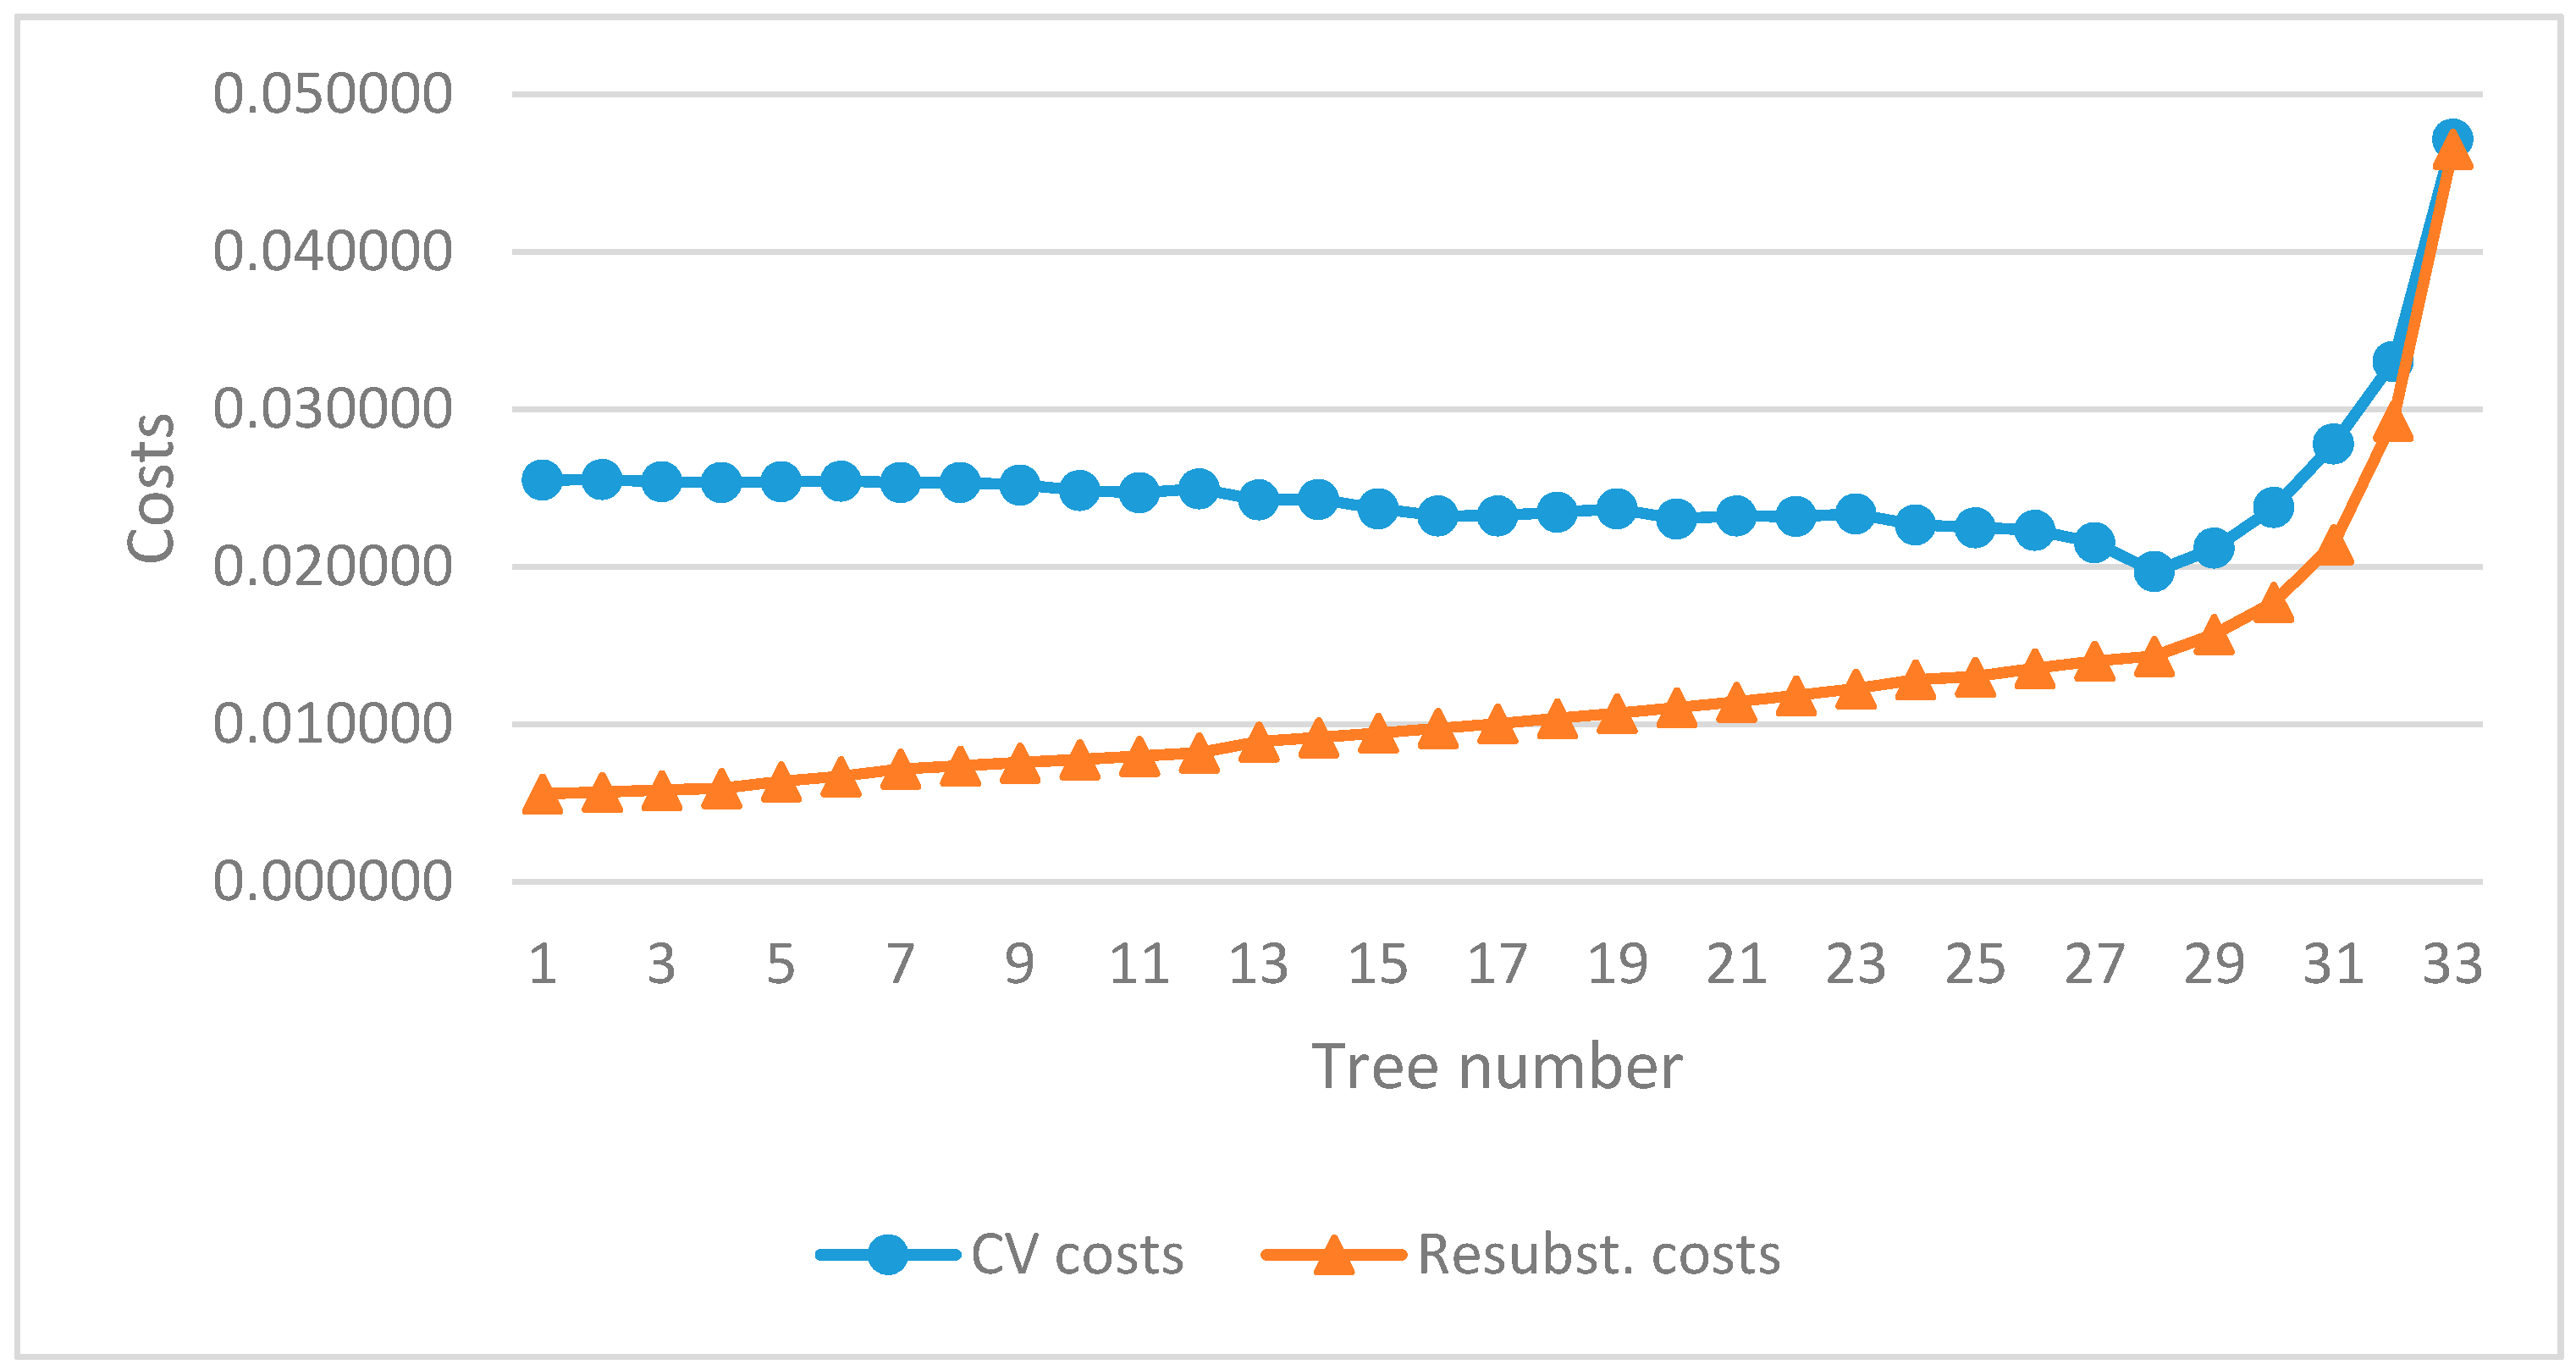
3.3. Data Analysis: Regressions Trees
4. Results
5. Discussion
6. Conclusions
Supplementary Materials
Acknowledgments
Author Contributions
Conflicts of Interest
References
- Kizos, T.; Tsilimigkas, G.; Karampela, S. What Drives Built-Up Area Expansion on Islands? Using Soil Sealing Indicators to Estimate Built-Up Area Patterns on Aegean Islands, Greece. Tijdschr. Econ. Soc. Geogr. 2017, 108, 703–886. [Google Scholar] [CrossRef]
- Piorr, A.; Ravetz, J.; Tosics, I. Peri-Urbanisation in Europe: Towards European Policies to Sustain Urban-Rural Futures; Forest & Landscape, University of Copenhagen: Copenhagen, Denmark, 2011; pp. 30–42. ISBN 8779035345. [Google Scholar]
- Krätke, S. Metropolisation of the European economic territory as a consequence of increasing specialisation of urban agglomerations in the knowledge economy. Eur. Plan. Stud. 2007, 15, 1–27. [Google Scholar] [CrossRef]
- Smętkowski, M.; Jałowiecki, B.; Gorzelak, G. Obszary Metropolitalne w Polsce. Problemy Rozwojowe i Delimitacja; Raporty i Analizy EUROREG 1; Centrum Europejskich Studiów Regionalnych i Lokalnych EUROREG: Warszawa, Poland, 2009; pp. 8–26. [Google Scholar]
- Zasada, I. Multifunctional peri-urban agriculture—A review of societal demands and the provision of goods and services by farming. Land Use Policy 2011, 28, 639–648. [Google Scholar] [CrossRef]
- Lovell, S.T. Multifunctional Urban Agriculture for Sustainable Land Use Planning in the United States. Sustainability 2010, 2, 2499–2522. [Google Scholar] [CrossRef]
- Busko, M.; Szafranska, B. Analysis of Changes in Land Use Patterns Pursuant to the Conversion of Agricultural Land to Non-Agricultural Use in the Context of the Sustainable Development of the Malopolska Region. Sustainability 2018, 10, 136. [Google Scholar] [CrossRef]
- Huang, D.; Jin, H.; Zhao, X.; Liu, S. Factors influencing the conversion of arable land to urban use and policy implications in Beijing, China. Sustainability 2015, 7, 180–194. [Google Scholar] [CrossRef]
- Mazzocchi, C.; Sali, G.; Corsi, S. Land use conversion in metropolitan areas and the permanence of agriculture: Sensitivity Index of Agricultural Land (SIAL), a tool for territorial analysis. Land Use Policy 2013, 35, 155–162. [Google Scholar] [CrossRef]
- Deng, X.; Huang, J.; Rozelle, S.; Zhang, J.; Li, Z. Impact of urbanization on cultivated land changes in China. Land Use Policy 2015, 45, 1–7. [Google Scholar] [CrossRef]
- Su, S.L.; Jiang, Z.L.; Zhang, Q.; Zhang, Y.A. Transformation of agricultural landscapes under rapid urbanization: A threat to sustainability in Hang-Jia-Hu region, China. Appl. Geogr. 2011, 31, 439–449. [Google Scholar] [CrossRef]
- Lorens, P.; Martyniuk-Pęczek, J. Zarządzanie Rozwojem Przestrzennym Miast; Wydawnictwo Urbanista: Gdańsk, Poland, 2010; pp. 16–42. ISBN 978-83-89649-30-0. [Google Scholar]
- Krzyk, P.; Tokarczuk, T.; Heczko-Hyłowa, E.; Ziobrowski, Z. Obszary Rolne Jako Element Struktury Przestrzennej Miast—Problemy Planistyczne; Instytut Rozwoju Miast: Kraków, Poland, 2013; pp. 48–69. ISBN 978-83-89440-72-3. [Google Scholar]
- Poławski, Z.F. Zmiany użytkowania ziemi w Polsce w ostatnich dwóch stuleciach. Teledetekcja Środowiska 2009, 42, 74–75. [Google Scholar]
- Sroka, W. Resources and use of agricultural land in Polish cities according to chosen theories of location of agricultural production. Acta Sci. Pol. Oecon. 2015, 14, 135–147. [Google Scholar]
- Hagedorn, K. Property rights reform on agricultural land in Central and Eastern Europe. Q. J. Int. Agric. 2004, 43, 409–438. [Google Scholar]
- Czyżewski, A.; Majchrzak, A. Regulations for the Polish agricultural land market compared with other EU member states: Implications for market efficiency. Stud. Ekon. 2014, 2, 175–195. [Google Scholar]
- Qian, J.; Peng, Y.; Luo, C.; Wu, C.; Du, Q. Urban land expansion and sustainable land use policy in Shenzhen: A case study of China’s rapid urbanization. Sustainability 2016, 8, 16. [Google Scholar] [CrossRef]
- Diogo, V.; Koomen, E.; Kuhlman, T. An economic theory-based explanatory model of agricultural land-use patterns: The Netherlands as a case study. Agric. Syst. 2015, 139, 1–16. [Google Scholar] [CrossRef]
- Van der Veen, A.; Otter, H.S. Land use changes in regional economic theory. Environ. Model. Assess. 2001, 6, 145–150. [Google Scholar] [CrossRef]
- Nalej, M. Agricultural land cover changes in metropolitan areas of Poland for the period 1990–2012. Misc. Geogr. 2016, 20, 39–45. [Google Scholar] [CrossRef]
- Abrantes, P.; Fontes, I.; Gomes, E.; Rocha, J. Compliance of land cover changes with municipal land use planning: Evidence from the Lisbon metropolitan region (1990–2007). Land Use Policy 2016, 51, 120–134. [Google Scholar] [CrossRef]
- Van Rij, E.; Dekkers, J.; Koomen, E. Analysing the success of open space preservation in the Netherlands: The midden-delfland case. Tijdschr. Econ. Soc. Geogr. 2008, 99, 115–124. [Google Scholar] [CrossRef]
- Starrett, D. Market allocations of location choice in a model with free mobility. J. Econ. Theory 1978, 17, 21–37. [Google Scholar] [CrossRef]
- Fujita, M. The evolution of spatial economics: From Thünen to the new economic geography. Jpn. Econ. Rev. 2010, 61, 1–32. [Google Scholar] [CrossRef]
- Alonso, W. Location and Land Use; Harvard University Press: Cambridge, MA, USA, 1964; ISBN 9780674730854. [Google Scholar]
- Lambin, E.F.; Rounsevell, M.D.A.; Geist, H.J. Are agricultural land-use models able to predict changes in land-use intensity? Agric. Ecosyst. Environ. 2000, 82, 321–331. [Google Scholar] [CrossRef]
- Ustaoglu, E.; Castillo, C.P.; Jacobs-Crisioni, C.; Lavalle, C. Economic evaluation of agricultural land to assess land use changes. Land Use Policy 2016, 56, 125–146. [Google Scholar] [CrossRef]
- Czyżewski, B.; Matuszczak, A. A new land rent theory for sustainable agriculture. Land Use Policy 2016, 55, 222–229. [Google Scholar] [CrossRef]
- Wästfelt, A.; Zhang, Q. Reclaiming localisation for revitalising agriculture: A case study of peri-urban agricultural change in Gothenburg, Sweden. J. Rural Stud. 2016, 47, 172–185. [Google Scholar] [CrossRef]
- O’Kelly, M.; Bryan, D. Agricultural location theory: Von Thünen’s contribution to economic geography. Prog. Hum. Geogr. 1996, 20, 457–475. [Google Scholar] [CrossRef]
- Kellerman, A. Determinants of rent from agricultural land around metropolitan areas. Geogr. Anal. 1978, 10, 1–12. [Google Scholar] [CrossRef]
- Sinclair, R. Von Thünen and urban sprawl. Ann. Assoc. Am. Geogr. 1976, 57, 72–87. [Google Scholar] [CrossRef]
- Wegener, M. Overview of Land Use Transport Models. In Handbook of Transport Geography and Spatial Systems; Hensher, D.A., Button, K.J., Haynes, K.E., Stopher, P.R., Eds.; Handbooks in Transport; Elsevier: Amsterdam, The Netherlands, 2004; Volume 5, pp. 127–146. [Google Scholar]
- Konagaya, K. The Generalised Thunen Alonso Model for Land use Change in Sumatra Island. Geogr. Environ. Model. 1999, 3, 145–162. [Google Scholar]
- Mitsuda, Y.; Ito, S. A review of spatial-explicit factors determining spatial distribution of land use/land-use change. Landsc. Ecol. Eng. 2011, 7, 117–125. [Google Scholar] [CrossRef]
- Zasada, I.; Fertner, C.; Piorr, A.; Nielsen, T.S. Peri-urbanisation and multifunctional adaptation of agriculture around Copenhagen. Dan. J. Geogr. 2011, 111, 59–72. [Google Scholar] [CrossRef]
- Ravetz, J.; Fertner, C.; Nielsen, T.S. The dynamics of peri-urbanization. In Peri-Urban Futures: Scenarios and Models for Land Use Change in Europe; Springer: Berlin/Heidelberg, Germany, 2013; pp. 13–44. ISBN 978-3-642-30528-3. [Google Scholar]
- Gellrich, M.; Zimmermann, N.E. Investigating the regional-scale pattern of agricultural land abandonment in the Swiss mountains: A spatial statistical modelling approach. Landsc. Urban Plan. 2007, 79, 65–76. [Google Scholar] [CrossRef]
- Xie, H.; Wang, P.; Yao, G. Exploring the dynamic mechanisms of farmland abandonment based on a spatially explicit economic model for environmental sustainability: A case study in Jiangxi Province, China. Sustainability 2014, 6, 1260–1282. [Google Scholar] [CrossRef]
- Grădinaru, S.R.; Iojă, C.I.; Onose, D.A.; Gavrilidis, A.A.; Pătru-Stupariu, I.; Kienast, F.; Hersperger, A.M. Land abandonment as a precursor of built-up development at the sprawling periphery of former socialist cities. Ecol. Indic. 2015, 57, 305–313. [Google Scholar] [CrossRef]
- Pölling, B.; Mergenthaler, M.; Lorleberg, W. Professional urban agriculture and its characteristic business models in Metropolis Ruhr, Germany. Land Use Policy 2016, 58, 366–379. [Google Scholar] [CrossRef]
- Kopsidis, M.; Wolf, N. Agricultural productivity across Prussia during the industrial revolution: A Thünen perspective. J. Econ. Hist. 2012, 72, 634–670. [Google Scholar] [CrossRef]
- Samorząd Województwa Lubelskiego. Plan Zagospodarowania Przestrzennego Województwa Lubelskiego; Urząd Marszałkowski Województwa Lubelskiego: Lublin, Poland, 2015; Available online: https://umwl.bip.lubelskie.pl/upload/pliki//2Zal.1_tekst_PZPWL.pdf (accessed on 2 September 2017).
- Wielkopolskie Biuro Planowania Przestrzennego. Studium Ochrony i Kształtowania Krajobrazu W Poznańskim Obszarze Metropolitalnym; Wielkopolskie Biuro Planowania Przestrzennego: Poznań, Poland, 2012; Available online: http://www.wbpp.poznan.pl/opracowania/krajobraz/krajobraz.html (accessed on 2 September 2017).
- Urząd Statystyczny w Krakowie. Krakowski Obszar Metropolitalny w Latach 2011–2015; Urząd Statystyczny w Krakowie: Kraków, Poland, 2016. Available online: http://krakow.stat.gov.pl/publikacje-i-foldery/inne-opracowania/krakowski-obszar-metropolitalny-w-latach-2011-2015,7,2.html (accessed on 2 September 2017).
- Pomorskie Biuro Planowania Regionalnego. Plan Zagospodarowania Przestrzennego Obszaru Metropolitalnego Gdańsk-Gdynia-Sopot 2030; Pomorskie Biuro Planowania Regionalnego: Gdańsk, Poland, 2016; Available online: http://www.metropoliagdansk.pl/upload/files/PZPOMG-G-S%202030(1).pdf (accessed on 2 September 2017).
- Mazowieckie Biuro Planowania Regionalnego w Warszawie. Studium Planu Zagospodarowania Przestrzennego Obszaru Metropolitalnego Warszawy; Mazowieckie Biuro Planowania Regionalnego w Warszawie: Warszawa, Poland, 2010; Available online: http://user.siskom.waw.pl/userftp/materialy/mat_dostepne/planistyka/studium_pzp_om_warszawy/studium_pzpomw_2010.pdf (accessed on 2 September 2017).
- Instytut Rozwoju Terytorialnego. Plan Zagospodarowania Przestrzennego Województwa Dolnośląskiego. Perspektywa 2020; Instytut Rozwoju Terytorialnego: Wrocław, Poland, 2014; Available online: http://www.pzpwd.pl/download/pzpwd.pdf (accessed on 2 September 2017).
- Central Statistical Office of Poland (GUS). Rolnictwo na Terenach Miejskich w Województwie Mazowieckim; Urząd Statystyczny w Warszawie: Warszawa, Poland, 2013; pp. 29–30. ISBN 978-83-63246-21-1. [Google Scholar]
- Witek, T. Waloryzacja Rolniczej Przestrzeni Produkcyjnej Polski Według Gmin; IUNG: Puławy, Poland, 1994; pp. 166–248. [Google Scholar]
- Wiland, M. Spekulacja gruntami—Budownictwo mieszkaniowe—Depopulacja. In Mieszkalnictwo w Roku Rodziny: Raport CBOS oraz Ekspertyzy i Opinie w Sprawie Sytuacji Mieszkaniowej Polaków; Habitat for Humanity; Fundacja Bezdomnych: Warszawa, Poland, 2013; pp. 58–60. [Google Scholar]
- Rouha-Mülleder, C.; Iben, C.; Wagner, E.; Laaha, G.; Troxler, J.; Waiblinger, S. Relative importance of factors influencing the prevalence of lameness in Austrian cubicle loose-housed dairy cows. Prev. Vet. Med. 2009, 92, 123–133. [Google Scholar] [CrossRef] [PubMed]
- Rokach, L.; Maimon, O. Data Mining with Decision Trees—Theory and Applications; World Scientific Publishing: Hackensack, NJ, USA, 2008; pp. 81–83. ISBN 978-9814590075. [Google Scholar]
- Kuhn, L.; Page, K.; Ward, J.; Worrall-Carter, L. The process and utility of classification and regression tree methodology in nursing research. J. Adv. Nurs. 2014, 70, 1276–1286. [Google Scholar] [CrossRef] [PubMed]
- Breiman, L.; Friedman, J.H.; Olshen, R.A.; Stone, C.J. Classification and Regression Trees; Wadsworth & Brooks: Monterey, CA, USA, 1984; ISBN 0412048418. [Google Scholar]
- Dacko, M.; Szajdecka, K. Multifaceted analysis of the process of price developments on the local real estate market by means of the regression trees method (CandRT). Acta Sci. Pol. Oecon. 2015, 14, 27–38. [Google Scholar]
- Topal, M.; Aksakal, V.; Bayram, B.; Yağanoğlu, A.M. An analysis of the factors affecting birth weight and actual milk yield in Swedish red cattle using regression tree analysis. J. Anim. Plant Sci. 2010, 20, 63–69. [Google Scholar]
- Loh, W.Y.; Zheng, W. Regression trees for longitudinal and multiresponse data. Ann. Appl. Stat. 2013, 7, 495–522. [Google Scholar] [CrossRef]
- Ronowicz, J.; Thommes, M.; Kleinebudde, P.; Krysiński, J. A data mining approach to optimize pellets manufacturing process based on a decision tree algorithm. Eur. J. Pharm. Sci. 2015, 73, 44–48. [Google Scholar] [CrossRef] [PubMed]
- Dacko, M.; Zając, T.; Synowiec, A.; Oleksy, A.; Klimek-Kopyra, A.; Kulig, B. New approach to determine biological and environmental factors influencing mass of a single pea (Pisum sativum L.) seed in Silesia region in Poland using a CART model. Eur. J. Agron. 2016, 74, 29–37. [Google Scholar] [CrossRef]
- Dębska, B.; Guzowska-Świder, B. Decision trees in selection of featured determined food quality. Anal. Chim. Acta 2011, 705, 261–271. [Google Scholar] [CrossRef] [PubMed]
- Ives, C.D.; Kendal, D. Values and attitudes of the urban public towards peri-urban agricultural land. Land Use Policy 2013, 34, 80–90. [Google Scholar] [CrossRef]
- Szymańska, D.; Grzelak-Kostulska, E.; Hołowiecka, B. Zmiany powierzchni i gęstości zaludnienia miast Polski w latach 1960–2003. In Kierunki Przekształceń Struktury Gospodarczej i Społeczno-Demograficznej Miast; Słodczyk, J., Szafranek, E., Eds.; Wydawnictwo Uniwersytetu Opolskiego: Opole, Poland, 2006; pp. 341–353. ISBN 83-7395-189-X. [Google Scholar]
- Pölling, B.; Sroka, W.; Mergenthaler, M. Success of urban farming’s city-adjustments and business models—Findings from a survey among farmers in Ruhr Metropolis, Germany. Land Use Policy 2017, 69, 372–385. [Google Scholar] [CrossRef]
- Wu, K.Y.; Zhang, H. Land use dynamics, built-up land expansion patterns, and driving forces analysis of the fast-growing Hangzhou metropolitan area, eastern China (1978–2008). Appl. Geogr. 2012, 34, 137–145. [Google Scholar] [CrossRef]
- Ewert, F.; Rounsevell, M.D.A.; Reginster, I.; Metzger, M.J.; Leemans, R. Future scenarios of European agricultural land use: I. Estimating changes in crop productivity. Agric. Ecosyst. Environ. 2005, 107, 101–116. [Google Scholar] [CrossRef]
- Müller, D.; Zeller, M. Land use dynamics in the central highlands of Vietnam: A spatial model combining village survey data with satellite imagery interpretation. Agric. Econ. 2002, 27, 333–354. [Google Scholar] [CrossRef]
- Sroka, W.; Pölling, B. The Potential and Significance of urban Agriculture on the basis of the Ruhr Metropolis and the Upper Silesian Metropolis. Probl. World Agric. 2015, 15, 180–193. [Google Scholar]
- Baumann, M.; Kuemmerle, T.; Elbakidze, M.; Ozdogan, M.; Radeloff, V.C.; Keuler, N.S.; Hostert, P. Patterns and drivers of post-socialist farmland abandonment in Western Ukraine. Land Use Policy 2011, 28, 552–562. [Google Scholar] [CrossRef]


| Category of Factors | Potential Variables | Effects on Share of Agricultural Land in Overall Surface Area |
|---|---|---|
| Socio-economic |
| Increase in population density, migrations, and an increased number of enterprises/decreasing rate of unemployment have an impact on growing demand for land for non-agricultural purposes, resulting in farmland being converted to non-agricultural uses [8,10,37,38]. |
| Fixed geographic features |
| The closer to the city centre, ports and roads, the bigger the competition for land and the stronger the pressure on its conversion to non-agricultural uses [10,36]. Higher productivity of agricultural land results in higher economic rent from every unit of surface area. Users give up agricultural production and convert land to non-agricultural uses less often [8,19,39]. |
| Features of agricultural systems |
| The higher the profitability of agriculture, the less often farmland is converted to non-agricultural uses. Advantageous structures (large farms, full time farmers, etc.) foster higher profits. [9,16,30,39,40,41]. |
| Institutional framework |
| Policy for the protection of prime farmland could be effective in saving agricultural land from development for non-agricultural uses [7,23,42]. |
| Metropolitan Areas | Number of Municipalities | Number of People (in Thousand) | Population Density (People/km2) | Share of Overall Surface Area in Relation to the Country’s Surface Area (%) | ||
|---|---|---|---|---|---|---|
| Core | Outer Zone | Core | Outer Zone | |||
| Warsaw MA | 81 | 1754.0 | 1451.3 | 3391 | 217 | 2.3 |
| Krakow MA | 51 | 765.3 | 752.7 | 2341 | 201 | 1.3 |
| Tricity MA | 55 | 747.6 | 816.2 | 1804 | 129 | 2.2 |
| Wroclaw MA | 27 | 637.7 | 403.4 | 2177 | 115 | 1.2 |
| Poznan MA | 45 | 540.4 | 880.3 | 2063 | 148 | 2.0 |
| Lublin MA | 21 | 340.5 | 268.3 | 2308 | 136 | 0.7 |
| Total | 280 | 4785.4 | 4572.1 | 2440.7 | 162 | 9.6 |
| In Details: | Percentage of the Agricultural Land of Farms in the Total Area in 2010 (%) | Standard Deviation (SD) | ||
|---|---|---|---|---|
| Mean | Min. | Max | ||
| Core | 27.8 | 20.0 | 48.6 | 0.11 |
| Outer zone | ||||
| 29.8 | 0.0 | 67.6 | 0.21 |
| 48.2 | 2.5 | 77.5 | 0.18 |
| 52.2 | 20.3 | 94.8 | 0.16 |
| Metropolitan areas in total | 49.9 | 0.0 | 94.8 | 0.22 |
| Factors | Variable Name | Definition of Variable and Unit | Range of Variation/Size |
|---|---|---|---|
| Endogenous variable | |||
| Agricultural area | Share of agricultural land held by farms in the overall surface area of a municipality—in 2010 (%) | AV = 49.9 Min = 0 Max = 94.8 | |
| Exogenous variables | |||
| Socio-economic | Type of municipality | Type of municipality—as of 2010 (dummy variable urban, urban-rural, rural) | Urban municipality—44 Urban-rural municipality—75 Rural municipality—161 |
| Population density | Population density of a municipality—average for the period 1995–2010; (people/km2) | AV = 367.8 Min = 12.3 Max = 4027.4 | |
| Net migration rate | Internal net migration per 1000 people—average for 2003–2010 (person) | AV = 5.3 Min = −8.8 Max = 37.3 | |
| Commuting to work | Number of people coming in to work per 1 person going out to work—2006 (person) | AV = 0.71 Min = 0.05 Max = 13.7 | |
| Unemployment rate | Share of registered unemployed people in the population of working age—average for 2003–2010 (%) | AV = 7.3 Min = 2.5 Max= 19.2 | |
| Entrepreneurship | Economic entities including natural persons- average for 2002–2010 (entities/10,000 population of working age) | AV = 1449.7 Min = 631.9 Max = 5475.4 | |
| Large enterprises | Economic entities employing over 50 people—average for 2002–2010 (entities/10,000 population of working age) | AV = 10.1 Min = 0 Max = 47.4 | |
| Environmental and fixed geographic features | Agricultural Production Space Valuation Ratio—APSVR | Agricultural Production Space Valuation Ratio (point) * | AV = 66.6 Min = 36.2 Max = 108.6 |
| Protected natural areas | Percentage of land under various forms of environmental protection in the overall surface area of municipality—average for 1996–2010 (%) | AV = 26.7 Min = 0.0 Max = 72.9 | |
| Public roads | Length of municipality hard surfaced roads per 100 km2 of surface area—average for the period 2003–2007 (km/100 km2) | AV = 66.7 Min = 8.2 Max = 662.5 | |
| Spatial planning | Share of surface area of municipalities covered by spatial development plans—average for 2009–2010 (%) | AV = 46.5 Min = 0.0 Max = 100.0 | |
| Distance to the core | Distance from the centre of the municipality to the centre of the MA core (km) ** | AV = 36.6 Min = 0 Max = 79.1 | |
| Travel time to the core | Travel time from the municipality’s centre to the centre of MA core (minutes) ** | AV = 43.8 Min = 0 Max = 85 | |
| Surface area of municipality | Surface area of a municipality—average for 1996–2010 (thou. ha) | AV = 10.7 Min = 0.5 Max = 51.7 | |
| Direct border with the cores | Including municipalities that share a border with the MA core (dummy variable: yes/no/core) | Yes—75 municipalities No—199 municipalities Core—6 municipalities (cities) | |
| Structure of agriculture | Share of small farms | Share of farms with an area less than 5 ha in the overall number of farms—average for 1996, 2002 and 2010 (%) | AV = 60.6 Min = 15.7 Max = 98.8 |
| Share of economically strong farms | Share of farms with an economic size above 15,000 Euro Standard Output—2010 (%) | AV = 16.9 Min = 0.0 Max = 59.5 | |
| Predictor | Predictor Category | Importance | Importance Category |
|---|---|---|---|
| Entrepreneurship | Socio-economic | 100 | Very important |
| Agricultural Production Space Valuation Ratio—APSVR | Environmental and fixed geographic feature | 99 | Very important |
| Large enterprises | Socio-economic | 76 | Important |
| Population density | 71 | Important | |
| Net migration rate | 67 | Important | |
| Type of municipality | 61 | Important | |
| Commuting to work | 50 | Moderately important | |
| Distance to the MA core | Environmental and fixed geographic feature | 49 | Moderately important |
| Protected natural areas | 48 | Moderately important | |
| Surface area of municipality | 45 | Moderately important | |
| Share of small farms | Structure of agriculture | 38 | Less important |
| Public roads | Environmental and fixed geographic feature | 31 | Less important |
| Unemployment rate | Socio-economic | 26 | Less important |
| Travel time to the MA core | Environmental and fixed geographic feature | 23 | Less important |
| Direct border with the MA core | 21 | Less important | |
| Spatial planning | 15 | Less important | |
| Share of economically strong farms | Structure of agriculture | 13 | Less important |
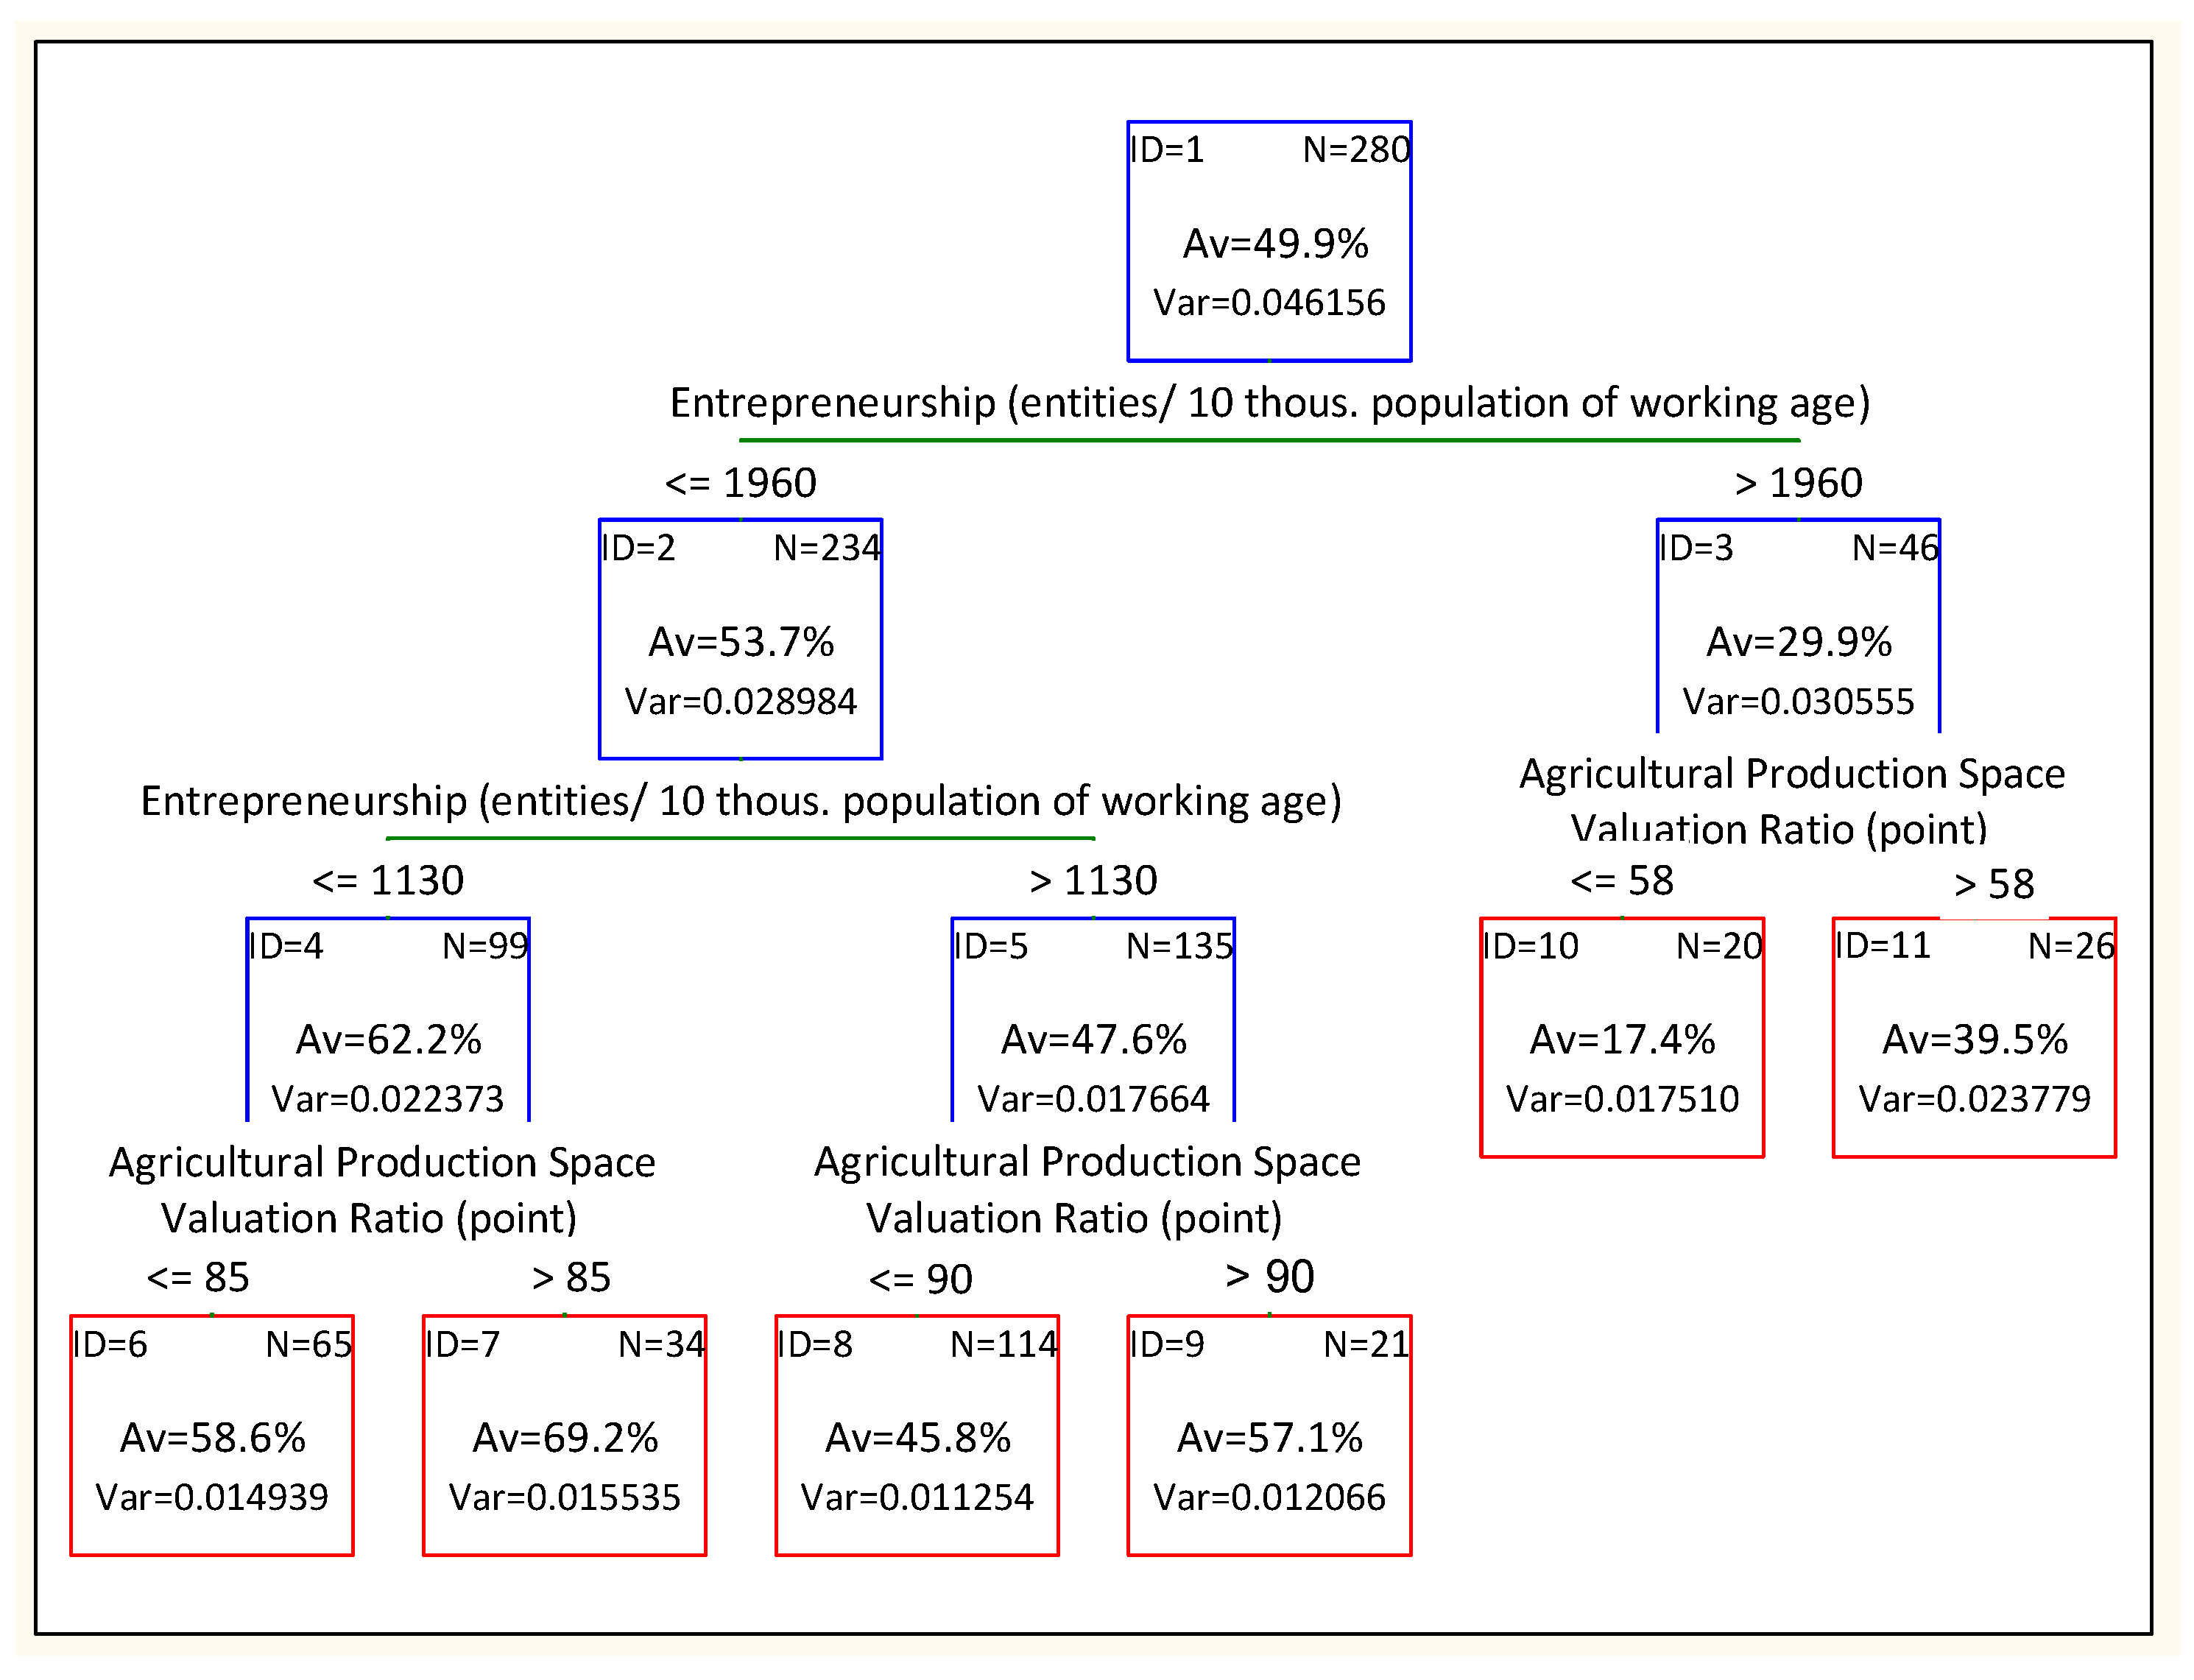
| Specification | >1960 Entities/10,000 Population of Working Age | <1130; 1960 => Entities/10,000 Population of Working Age | <=1130 Entities/10,000 Population of Working Age | |||
|---|---|---|---|---|---|---|
| APSVR <= 58 Points | APSVR > 58 Points | APSVR <= 90 Points | APSVR > 90 Points | APSVR <= 85 Points | APSVR > 85 Points | |
| Node ID = 10 | Node ID = 11 | Node ID = 8 | Node ID = 9 | Node ID = 6 | Node ID = 7 | |
| Number of municipalities | 20 | 26 | 114 | 21 | 65 | 34 |
| Share of agricultural area (%) | 17.4 | 39.5 | 45.8 | 57.1 | 58.6 | 69.2 |
| Entrepreneurship (entities/10,000 population at the working age) | 2631 | 2275 | 1484 | 1438 | 952 | 940 |
| APSVR (points) | 48 | 70 | 66 | 96 | 63 | 94 |
| Population density (people/km2) | 983 | 1126 | 300 | 475 | 78 | 90 |
| Net migration rate (person) | 10.2 | 12.2 | 6.3 | 5.8 | 1.6 | 2.5 |
| Commuting to work (person) | 0.82 | 1.95 | 0.68 | 0.75 | 0.32 | 0.29 |
| Type of municipality | ||||||
| Urban | 17 | 12 | 12 | 4 | 0 | 0 |
| Urban-rural | 0 | 7 | 47 | 7 | 6 | 4 |
| Rural | 3 | 7 | 55 | 10 | 59 | 30 |
| Distance to the MA core (km) | 29.2 | 19.2 | 39.9 | 27.4 | 44.4 | 30.5 |
| Direct border with the MA | ||||||
| Core | 0 | 5 | 0 | 1 | 0 | 0 |
| Yes | 12 | 15 | 29 | 11 | 2 | 7 |
| No | 8 | 6 | 85 | 9 | 63 | 27 |
| Overall average surface area of municipality (ha) | 4564 | 11,304 | 11,584 | 9769 | 12,110 | 9554 |
© 2018 by the authors. Licensee MDPI, Basel, Switzerland. This article is an open access article distributed under the terms and conditions of the Creative Commons Attribution (CC BY) license (http://creativecommons.org/licenses/by/4.0/).
Share and Cite
Sroka, W.; Mikolajczyk, J.; Wojewodzic, T.; Kwoczynska, B. Agricultural Land vs. Urbanisation in Chosen Polish Metropolitan Areas: A Spatial Analysis Based on Regression Trees. Sustainability 2018, 10, 837. https://doi.org/10.3390/su10030837
Sroka W, Mikolajczyk J, Wojewodzic T, Kwoczynska B. Agricultural Land vs. Urbanisation in Chosen Polish Metropolitan Areas: A Spatial Analysis Based on Regression Trees. Sustainability. 2018; 10(3):837. https://doi.org/10.3390/su10030837
Chicago/Turabian StyleSroka, Wojciech, Jaroslaw Mikolajczyk, Tomasz Wojewodzic, and Boguslawa Kwoczynska. 2018. "Agricultural Land vs. Urbanisation in Chosen Polish Metropolitan Areas: A Spatial Analysis Based on Regression Trees" Sustainability 10, no. 3: 837. https://doi.org/10.3390/su10030837