Energy Use and Perceived Indoor Environment in a Swedish Multifamily Building before and after Major Renovation


1
Division of Energy Systems, Department of Management and Engineering, Linköping University, SE-581 83 Linköping, Sweden
2
Division of Building, Energy and Environment Technology, Department of Technology and Environment, University of Gävle, SE-801 76 Gävle, Sweden
*
Author to whom correspondence should be addressed.
Sustainability 2018, 10(3), 766; https://doi.org/10.3390/su10030766
Submission received: 14 February 2018
/
Revised: 5 March 2018
/
Accepted: 7 March 2018
/
Published: 11 March 2018
(This article belongs to the Special Issue Sustainable Buildings and Indoor Air Quality)
Abstract
:Improved energy efficiency in the building sector is a central goal in the European Union and renovation of buildings can significantly improve both energy efficiency and indoor environment. This paper studies the perception of indoor environment, modelled indoor climate and heat demand in a building before and after major renovation. The building was constructed in 1961 and renovated in 2014. Insulation of the façade and attic and new windows reduced average U-value from 0.54 to 0.29 W/m2·K. A supply and exhaust ventilation system with heat recovery replaced the old exhaust ventilation. Heat demand was reduced by 44% and maximum supplied heating power was reduced by 38.5%. An on-site questionnaire indicates that perceived thermal comfort improved after the renovation, and the predicted percentage dissatisfied is reduced from 23% to 14% during the heating season. Overall experience with indoor environment is improved. A sensitivity analysis indicates that there is a compromise between thermal comfort and energy use in relation to window solar heat gain, internal heat generation and indoor temperature set point. Higher heat gains, although reducing energy use, can cause problems with high indoor temperatures, and higher indoor temperature might increase thermal comfort during heating season but significantly increases energy use.
1. Introduction
A substantial amount of our time is spent in buildings and a good indoor environment is essential. Low energy use and improved energy efficiency in the building sector is also a central goal in the European Union [1,2] and Agenda 2030 has a goal that the rate of improved energy efficiency should be doubled by 2030 [3]. Sweden has a national objective of contributing no net Greenhouse Gas (GHG) emissions by 2050, and a specified objective for improving energy performance by 20% by 2020 and 50% by 2050 in the Swedish building stock [4]. More than half of the buildings in the EU were built when requirements on energy performance were less strict, and renovation of these buildings is one important part of improving energy efficiency in the building stock [5]. Significant reduction in energy use as a result of renovation has been demonstrated in several previous studies [6,7,8,9,10,11]. Renovation also has the potential to improve indoor environment, especially thermal comfort, as demonstrated in [7,8,12,13].
The Swedish national strategy for energy efficient renovation of the building stock includes an overview of the need for renovation in Swedish building and urges the need for evidence-based approaches for estimation of energy saving potential in buildings as well as other additional benefits from renovation [14]. Several certification systems exist for sustainable and environmentally sound buildings, such as Leadership in Energy and Environmental Design (LEED) and BRE Environmental Assessment Method (BREEAM). In addition to low energy and resource use, low climate impact and economic sustainability, a good indoor environment is described as a central aspect of building sustainability [15,16]. Olsson et al. [17] investigated how sustainability aspects are handled in renovation processes. They found that although good indoor environmental quality is perceived important, none of the actors included in their study performed any sort of surveys of the indoor environment prior to renovation. Most interviewed companies perform some sort of building inspection before a renovation, but an in-depth analysis of energy use or prevailing indoor environmental problems is not performed. The Swedish environmental objectives include several aspects related to reducing energy use and resource intensity in the built environment and also has specified goal that all building should have a good indoor environment and not affect health negatively by 2020 [4]. Major renovations are building renovations where the cost for renovation of climate envelope or installations corresponds to more than 25% or the value of the building or when more than 25% of the building envelope is changed [1].
Zalejska-Jonsson and Wilhemssson [18] found a correlation between satisfaction with thermal comfort, sound and air quality and overall satisfaction with the home, and that residents in Swedish apartment buildings built between 1961–1975 experienced problems related to thermal comfort, such as draught, low indoor temperatures and undesirable indoor temperature variations. Ioannou and Itard [19] found that metabolic rate and clothing level of occupants has the strongest influence on thermal comfort. Thermostat setting, i.e., heating set point, also impacts thermal comfort but was shown to have a very small influence in buildings with low insulation level where surfaces are cold. Thomsen et al. [8] found that a majority of tenants perceived their indoor climate and indoor air quality as better after a major renovation of an apartment building outside Copenhagen, and that noise level in the apartment was not affected. Liu et al. [7] found that indoor environment was perceived as better in regards to thermal comfort, air quality and noise, and that symptoms of a poor indoor environment were fewer in a renovated building compared to a similar building that had not been retrofitted.
The aim of this study is to evaluate major building renovations regarding residents’ perceptions of indoor environments. Indoor climate and energy use is simulated in a building before and after renovation and residents’ perception of their indoor environment is studied via a standardized on-site questionnaire regarding the indoor environment. IDA Indoor Climate and Energy (IDA ICE) is used for building simulations. Comprehensive field measurements have been carried out in the building before and after the renovation and serve as input data and means of model validation. A sensitivity analysis was performed to see how the thermal environment is affected by different building operations and construction.
2. Materials and Methods
The studied building is a multifamily building with twelve apartments located in Linköping in southeast Sweden which underwent a major renovation in the middle of 2014. Domestic hot water and space heating is included in the rent, which is common in Swedish rental apartments. In addition to esthetic and other quality improvements to the building, thermal insulation was added to the building envelope, windows were replaced and a mechanical supply and exhaust ventilation system with a heat exchanger was installed. The energy performance of the building was significantly improved and space heating demand was reduced by 44% [13]. Heat is supplied to the building by district heating and distributed to rooms using radiators and a heating coil in the air handling unit (AHU) for the renovated case. The heating set point was regulated with old radiator thermostats before the renovation and electronic wall mounted thermostats was installed after the renovation. Building construction before and after the renovation is summarized in Table 1 and other information on building installations and conditions are found in Table 2.
The study is based on (1) field measurements; (2) simulation of indoor climate, thermal comfort, and energy use in IDA ICE version 4.7; and (3) a standardized indoor environment questionnaire.
Field measurements were performed in two similar occupied apartments before and after renovation. Air temperature was measured in the living room, kitchen, and bedrooms with a five-minute interval during one month in summer and one month during winter. Appliance use and carbon dioxide was also logged and used for validation of the building energy simulation model created in IDA ICE. The relative humidity was measured in the exhaust air from all apartment for one month during heating season after the renovation (December 2015). IDA ICE is a general purpose simulation environment that offers dynamic simulation of building energy use, heating and cooling power and thermal environment [23,24]. Empirical validation of IDA ICE has been performed using test cells [24] and measured data collected under realistic conditions [7,25,26].
The IDA ICE model of the studied building has previously been validated and shows good agreement with measurements [13]. Over- or underestimation of user behavior (i.e., internal heat gains) in buildings have been shown to have a significant impact on modelled energy use and thermal comfort [19]. As electric appliance use and residents’ presence in apartments varies greatly between different families, standardized values from a Swedish setting have been used for all simulations so that user patterns should not be a determinant for thermal comfort in the building [27]. These values are compiled in Table 3.
Four zones were chosen as reference zones, two on the second floor and two on the top floor of the building. The apartments represent the smallest (A and C) and the largest (B and D) for each floor. The ground floor is heated to room temperature. The building has no apartments on the ground floor. Zones A and C have one external wall with one window facing north, while three of the walls in zones B and D are external, see Table 4. Zones A and C have an air exchange rate almost three times higher than zones B and D. The apartments on the top floor are located under the attic, which is not heated. The reference zones were simulated as one single zone.
The model of the building created in IDA ICE and localization of the apartments and the building layout can be seen in Figure 1.
The whole-year simulations were performed with normal year corrected climatic data from Linköping [20]. Design conditions for summer and winter days in Linköping were used to study thermal comfort under extreme conditions. IDA ICE calculates Fanger comfort indices, predicted mean vote (PMV) and predicted percentage of dissatisfied (PPD), for occupants that are present in the building in accordance with international standard ISO 7730:2005 [28]. An occupant with normal activity (1.0 metabolic rate) that is always present has therefore been added to the studied zones. However, this occupant does not contribute any internal heat gains. The occupant has clothing with a thermal resistance of 0.13 m2·K/W (corresponding to clothing insulation of 0.85 clo) but can adjust clothing insulation by ±0.04 m2·K/W (0.25 clo). The recommendations from Sweden Green Building Council (SGBC) were used, where the occupant should be located one meter from the largest window and the worst occupied zones should be used for evaluation [29].
A standardized on-site questionnaire was used to study the perception of the indoor environment before and after the renovation. The questionnaire was developed by the Department of Occupational and Environmental Medicine at Örebro University Hospital in Sweden in 1988 [30] and has since been used in several studies of indoor environment in both new, old and renovated buildings [7,25,31,32,33]. The questionnaire is available for several types of buildings, both residential, public, and office buildings. In addition to questions regarding age, gender, health and overall satisfaction, the questionnaire contains several environmental factors and symptoms of poor indoor environment. The environmental factors have been categorized into aspects regarding the thermal environment, air quality and noise situation, see Table 5.
The first questionnaire was distributed to the residents in October 2013, a couple of months before renovation was started. The second set of questions was sent to the residents in February 2015, around five months after the renovation had been finalized and residents were allowed to move back into their apartments. All residents in the building before renovation had been living in the apartment for more than one year, but there were many new residents in the building after it had been renovated. Out of the twelve households living in the building, answers were received from seven of the households before the renovation and six households after the renovation.
A sensitivity analysis is performed to study how different parameters regarding conditions in and use of the building can affect both the thermal environment and energy use: indoor temperature set point, solar heat gain factor in windows and internal heat generation, see Table 6. European standard EN 15251-2007 [34] is used for comparing results, where four comfort categories are defined: best (PMV < ±0.2, PPD < 6%), good (PMV < ±0.5, PPD < 10%), acceptable (PMV < ±0.7, PPD < 15%), and unacceptable (PMV > ±0.7, PPD > 15%). Number of hours within each category and zone heating is noted for each parameter. Thermal power is adjusted so that indoor temperature set points can be achieved in all simulations. Only one parameter was changes in each simulation.
3. Results and Analysis
3.1. Thermal Environment
The two most prominent complaints about the thermal environment before the renovation are low room temperatures (around 70% of respondents experience problems) and draught (almost 60% experience problems), see Figure 2. Similar problems have been seen in other studies of Swedish buildings from the same era [7,18]. The use of an exhaust ventilation system also means that air enters the building unheated, which can be one reason for the draught problems, and can also cause problem with cold floors and contribute to the perception that indoor temperature varies with the outdoor temperature.
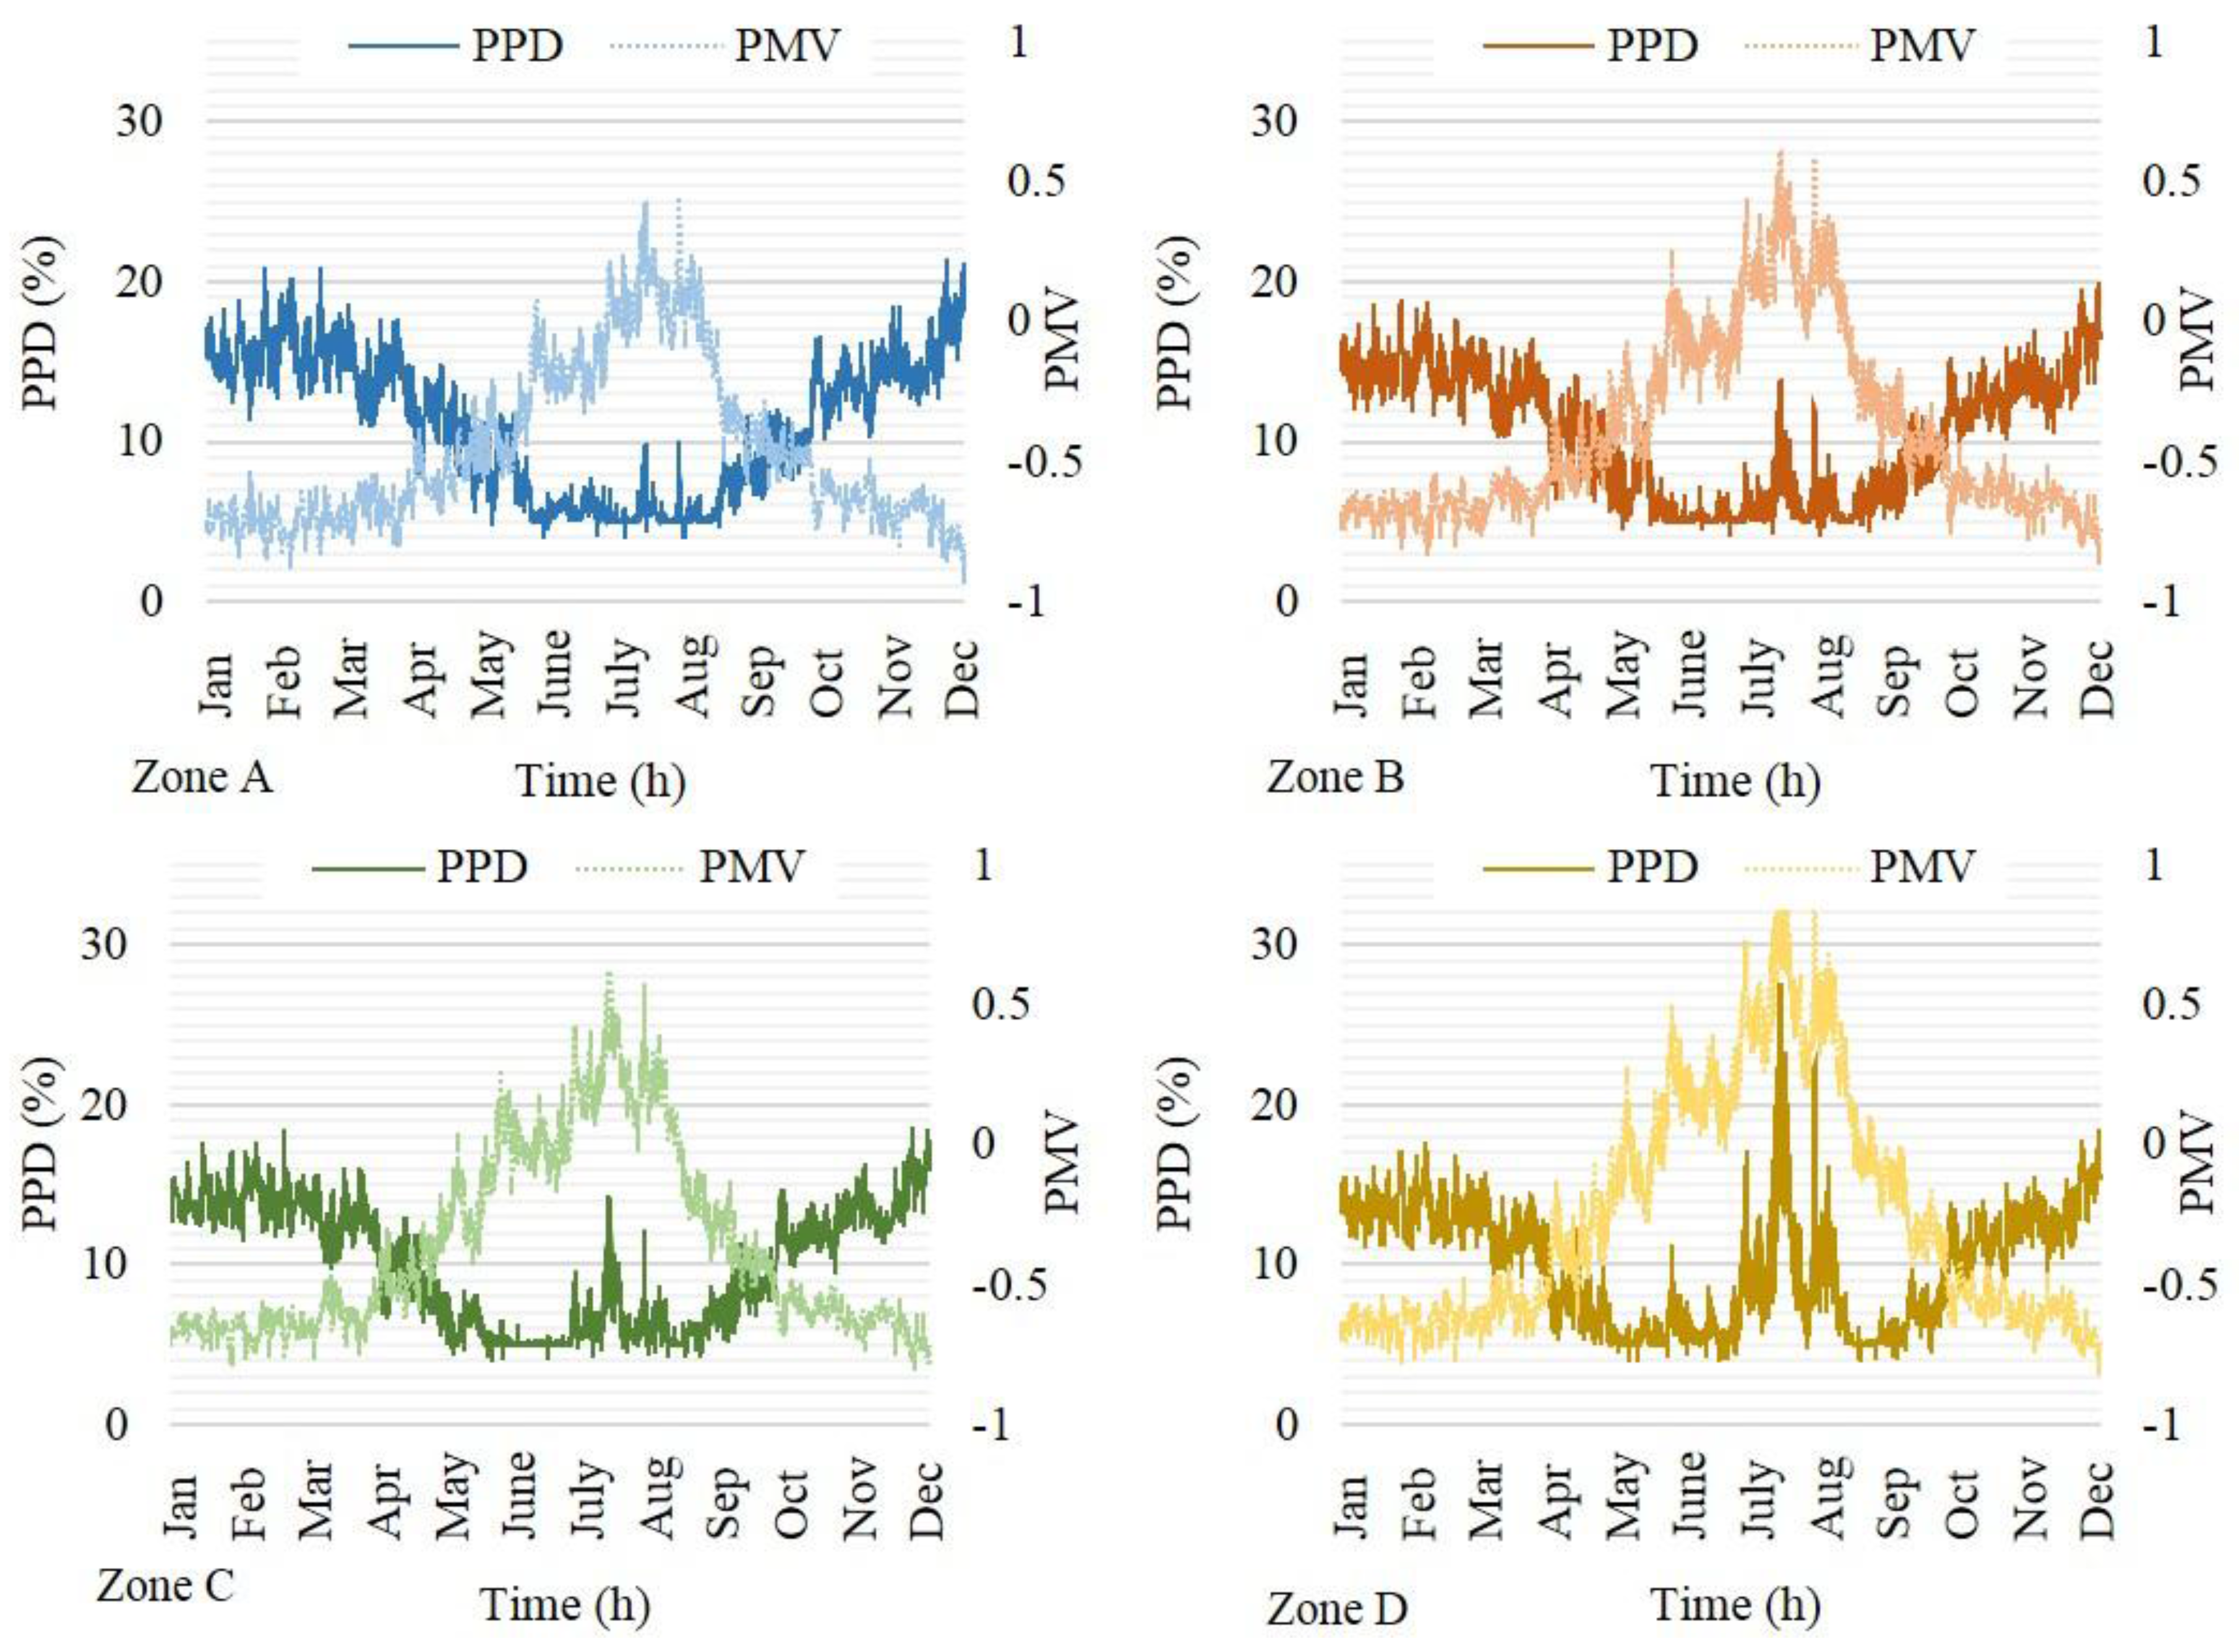
Measurements of the indoor temperature in the building [13] in the building show that indoor temperatures are lower than the recommendations from e.g., the Swedish National Board of Health and Welfare. Poor thermal comfort and low indoor temperatures are also indicated in the simulated PMV and PPD for the reference zones during a normal year can be seen in Figure 3. The average PPD in the reference zones during winter (January–March and November–December) is 22.8% and the average PMV is −0.92, meaning that the residents are slightly cold. The simulations indicate that there are no significant problems with too high indoor temperatures during summer but one respondent experience problems with high indoor temperatures during summer. The average simulated PMV in July and August is −0.15 giving a PPD of 6.5%.
Fewer complaints of low indoor temperatures and draught are seen in questionnaires handed out after the renovation, where around 30% experience problems (Figure 4). All problems are less prominent, except the possibility of controlling the indoor temperature. All respondents perceive indoor thermal environment as acceptable or better. None of the respondents perceived their indoor thermal environment as very poor neither before nor after the renovation. Simulations of PMV and PPD during a normal year give an average PMV of −0.65 and a PPD of 13.9% during winter. As seen in Figure 4, the PMV is higher during summer in the reference zone exposed to the highest amount of solar radiation (zone D) when the building has undergone renovation. Average PMV is 0.2 and PPD 6.8% during July and August.
For winter design conditions when no internal gains are included the PMV becomes low as the heating system is not able to keep temperature at acceptable levels in the unrenovated case, see Table 7. The lowest simulated operative temperature was 18.5 °C and indoor temperature within the same range was also measured in the building prior to renovation [13]. However, indoor temperatures range between 20.4–21.3 °C in the renovated case, and at the same time the supplied heating power has been reduced by 38.5%. Measurements in the building also indicate that the average indoor temperature is higher after the renovation [13] and that they are within the range recommended by the Swedish National Board of Health and Welfare. Simulations during summer design condition indicate that there are likely to be problems with high indoor temperatures during summer when the building has been renovated, see Table 7. Airing is modelled as constant infiltration, and no additional airing during summer is included in the model, which could reduce problems with high indoor temperatures in summer, especially in the small apartments (zones B and D). The occupants had not lived in the building during summer when the questionnaire was distributed after the renovation.
3.2. Indoor Air Quality and Noise
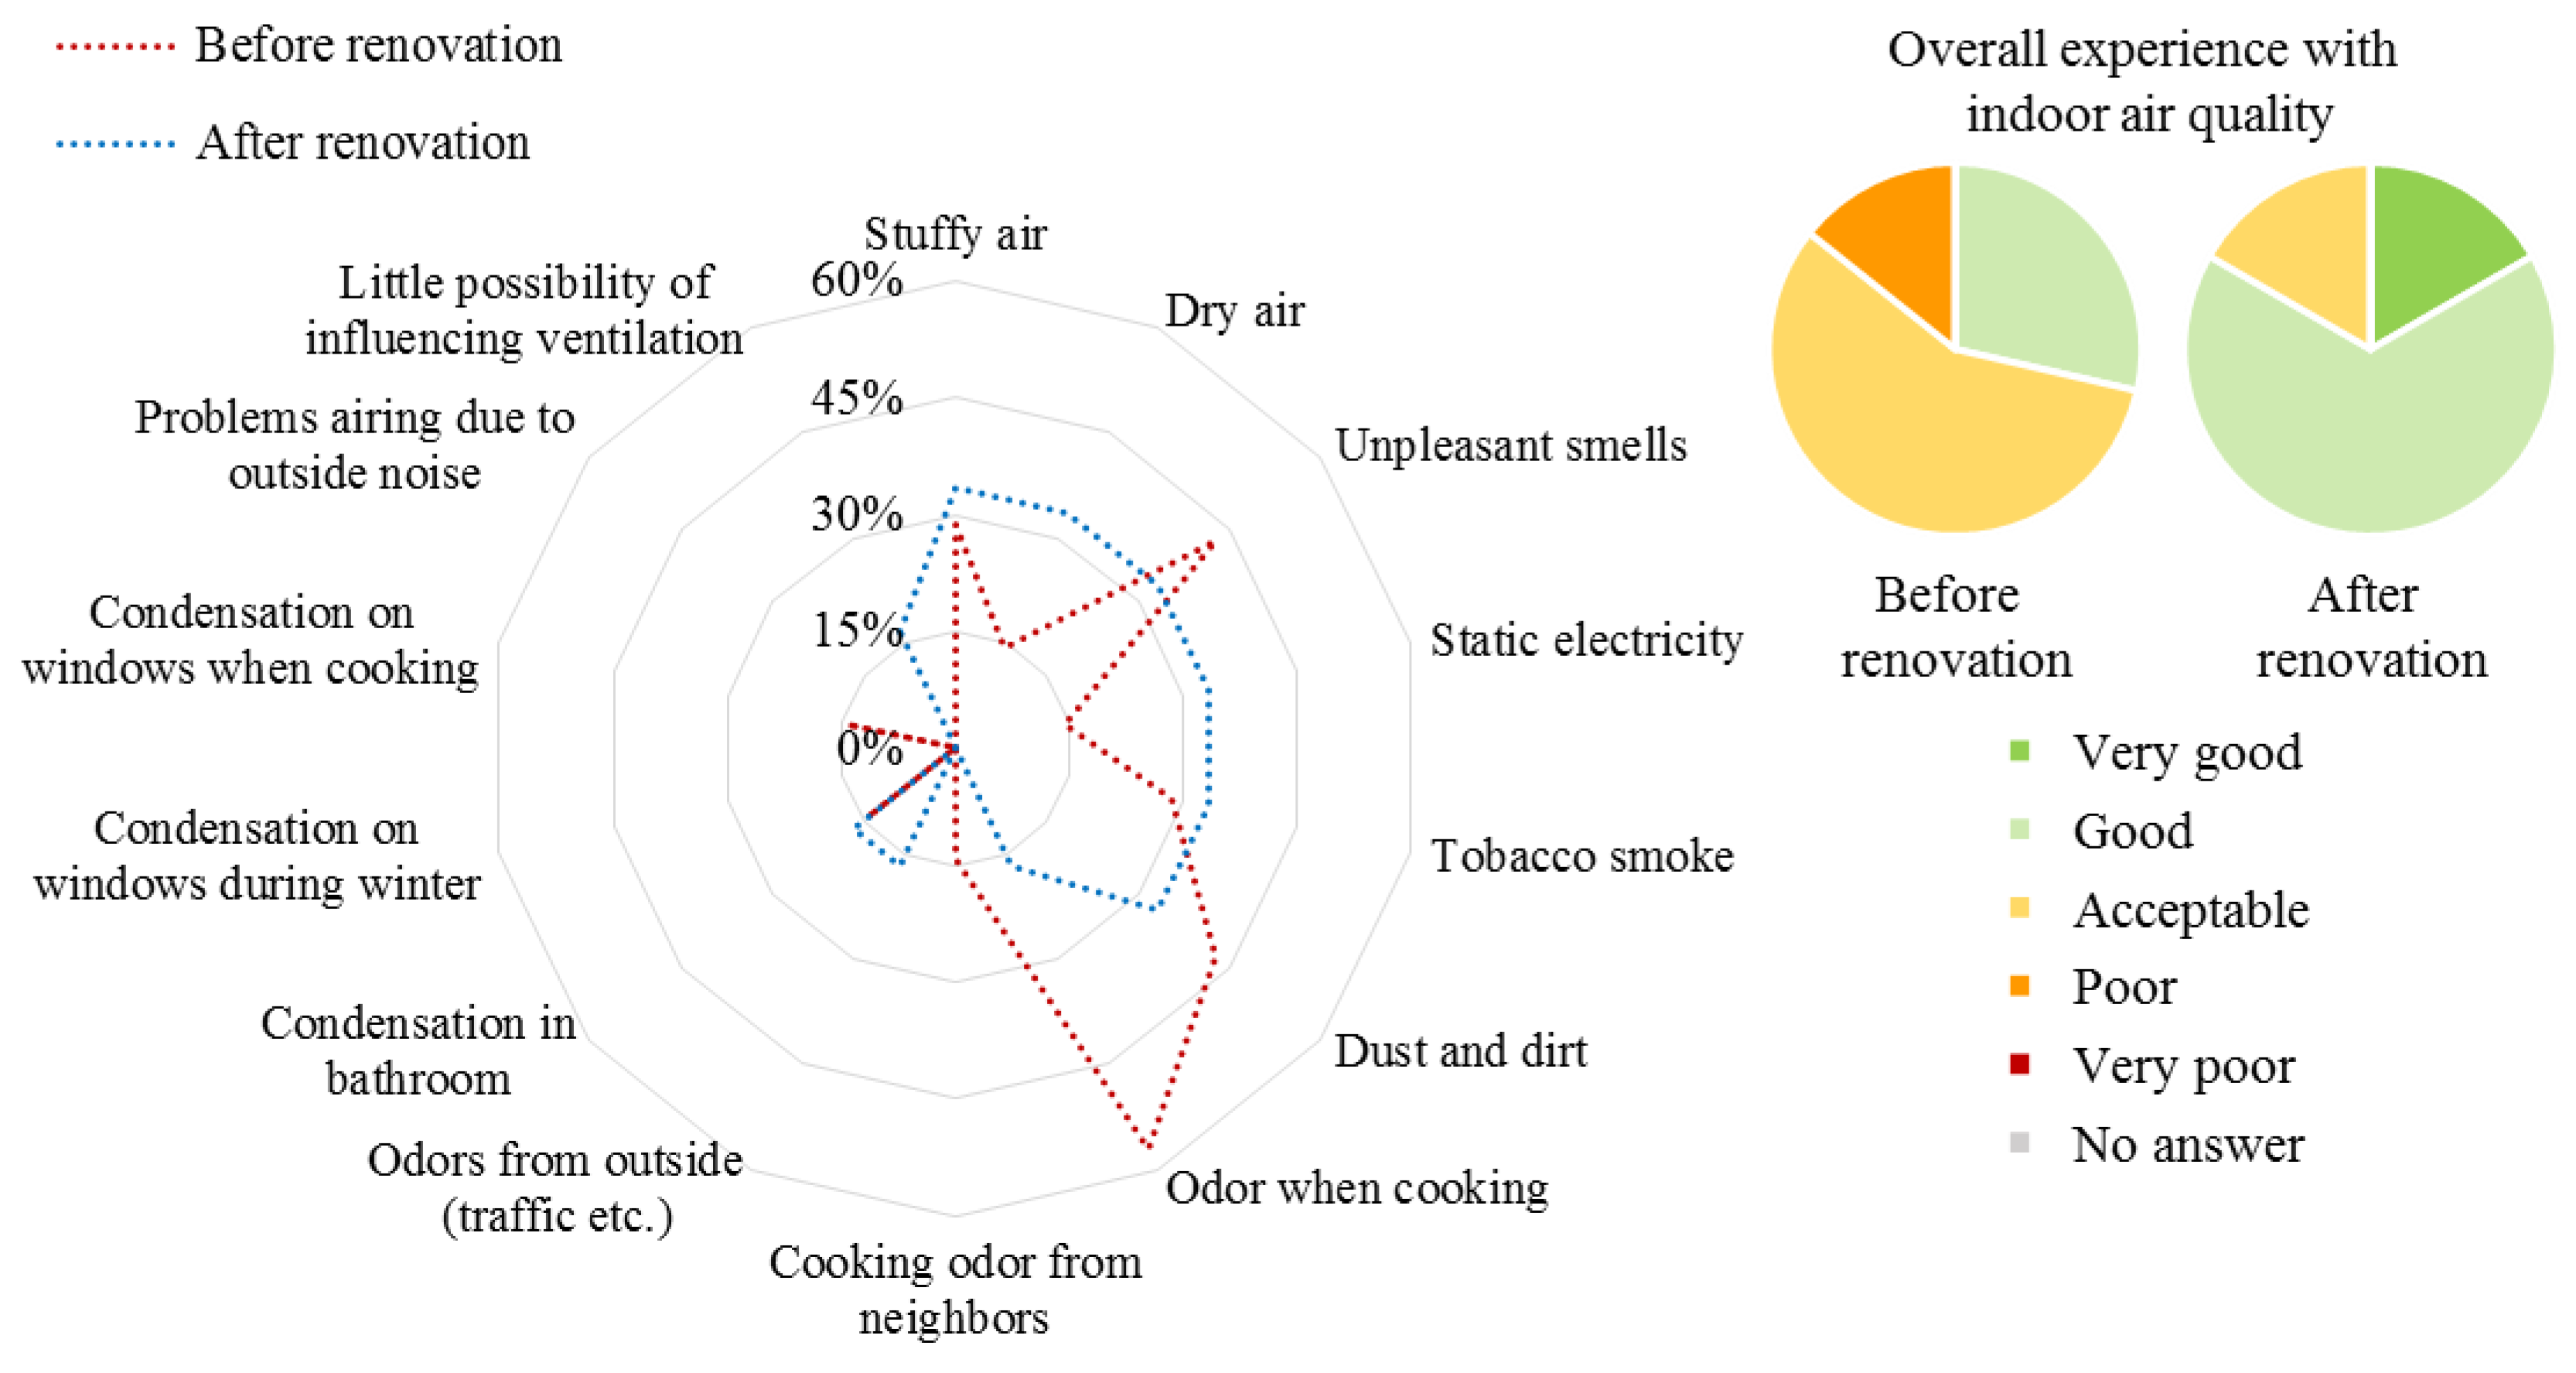
The most prominent problems regarding indoor air quality in the apartment before renovation are related to odors and smells, see Figure 5. Unsatisfactory ventilation efficiency in the kitchen could be one explanation for problems with cooking odors. The questionnaire does not indicate the origin of the unpleasant smells. Many of the air inlets face a relatively busy city center, which could contribute to smells, dust, and dirt. Problems with cooking odors seem to have been reduced after the building was renovated and the indoor air quality is perceived as better. Problems with dry air, stuffy air, static electricity, and tobacco smoke are slightly higher after the renovation. An increase in complaints about dry air could be because the second questionnaire was handed out during heating season, when the outdoor air has a significantly lower relative humidity. Low relative humidity also causes problems with static electricity. Dry air is also common in buildings with heat exchangers in ventilation. The average relative humidity in the exhaust air from all apartments was 31.5% during one month in the heating season.
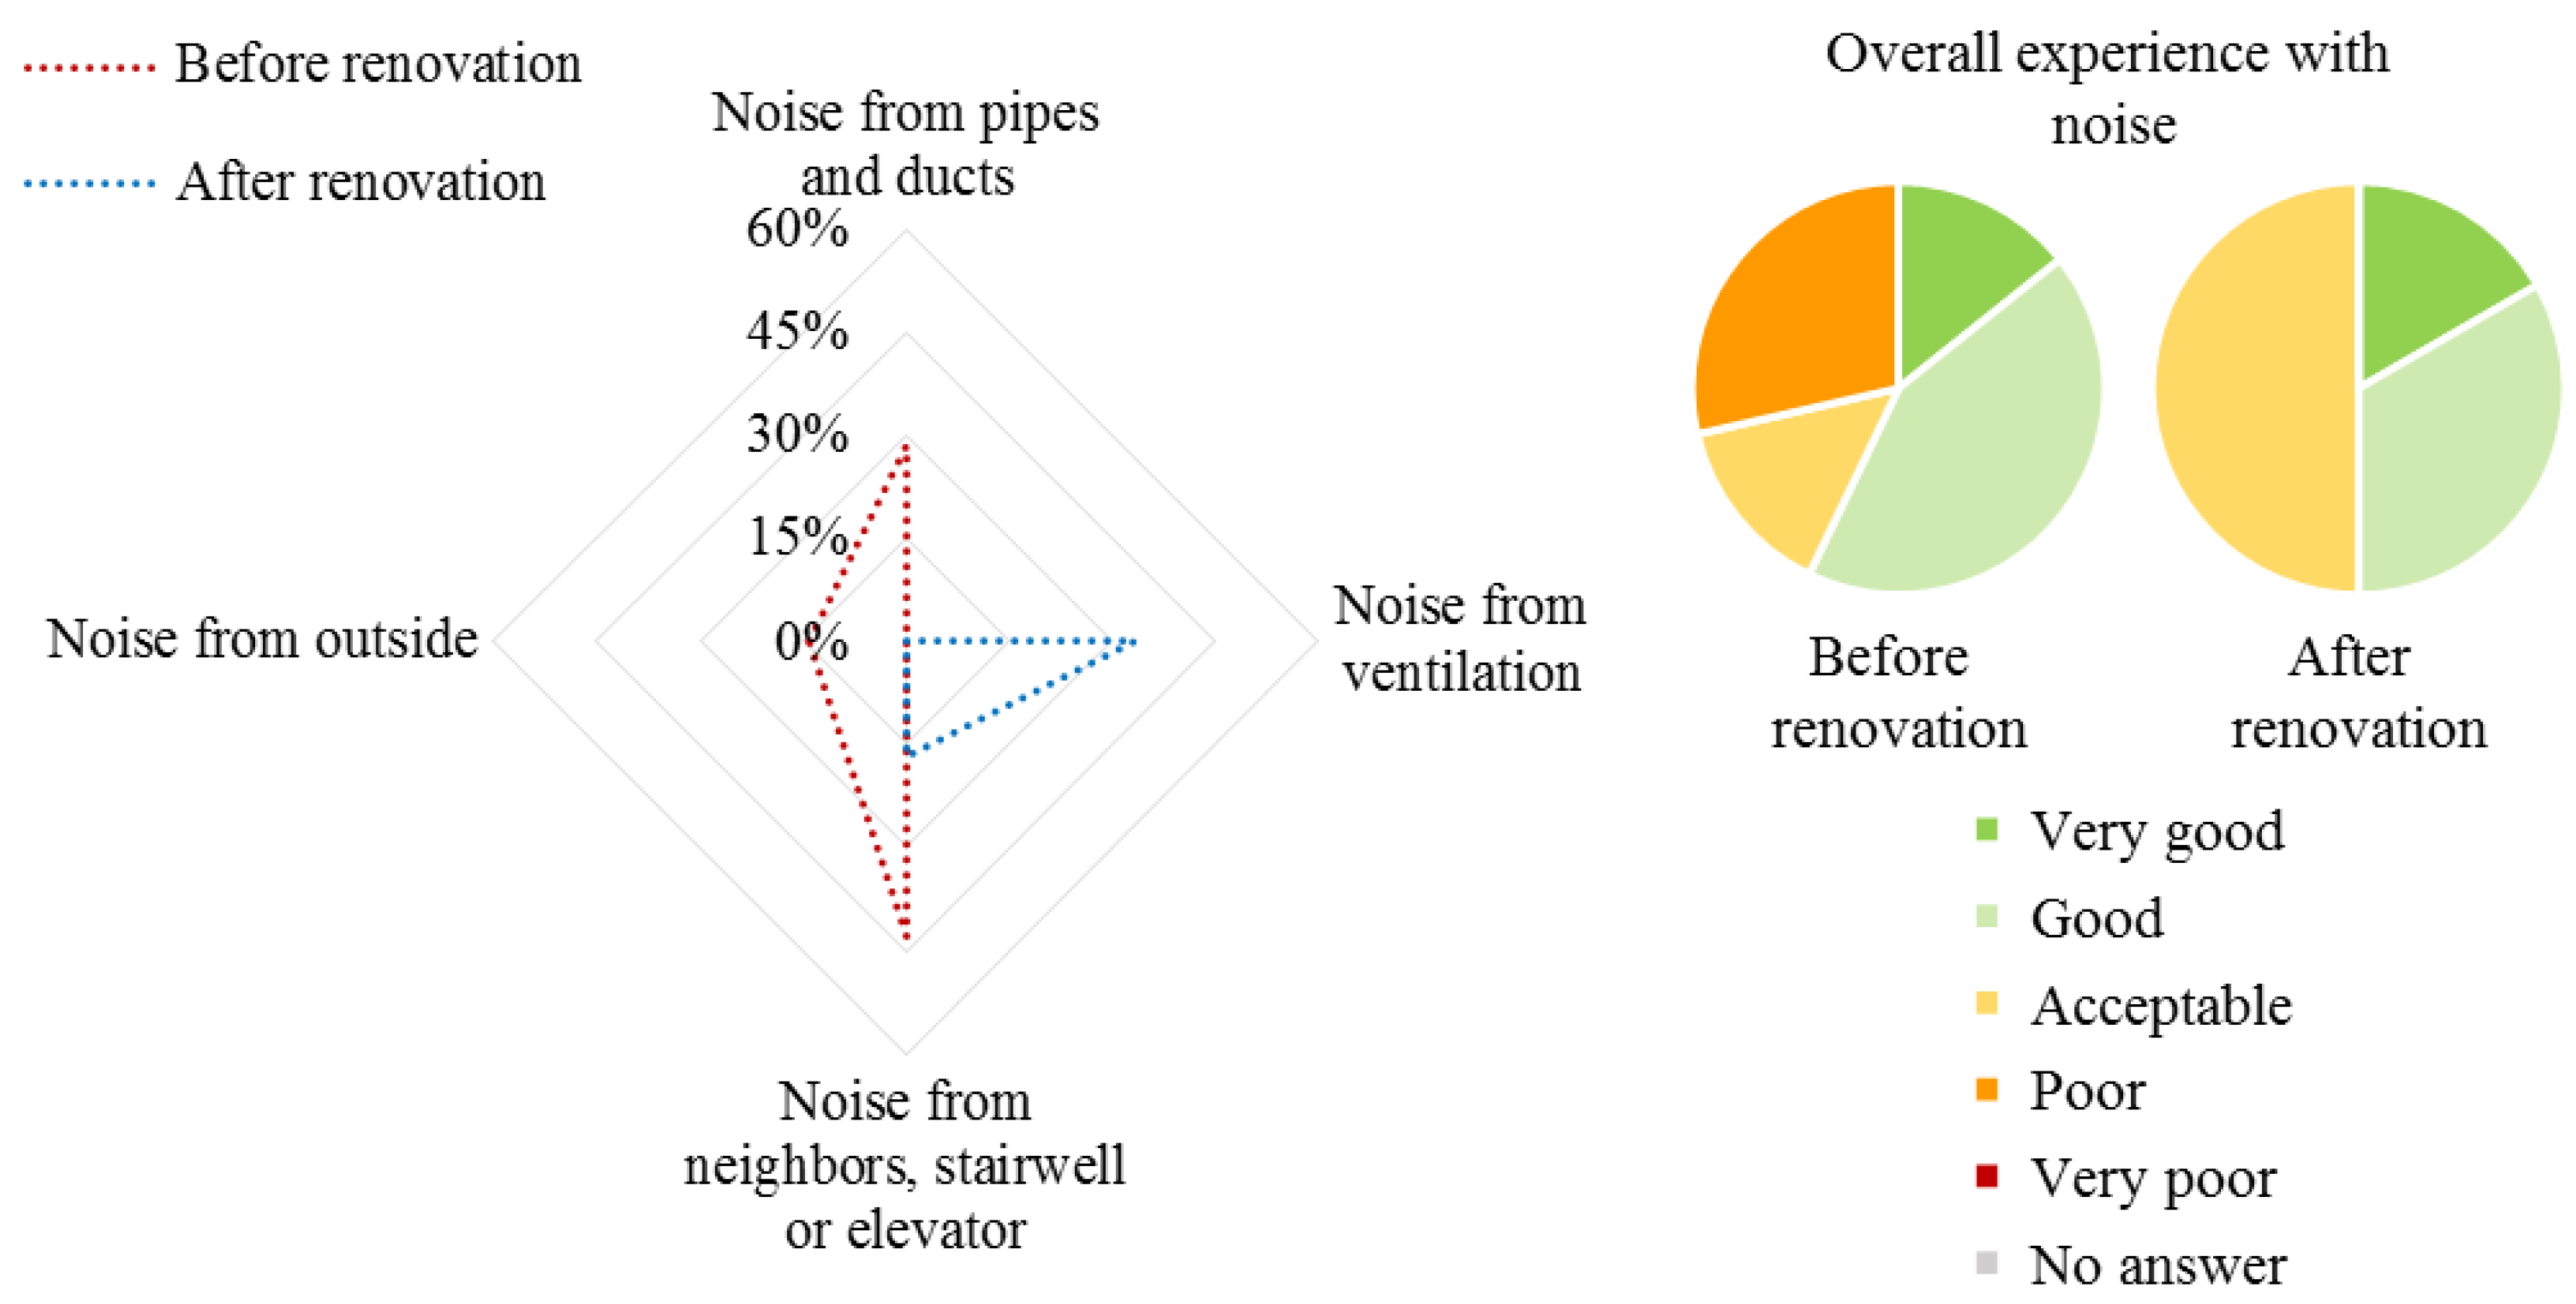
The overall perception of noise in the apartment also improved after the renovation, see Figure 6. Some of the residents experience problems with noise from ventilation, which is common for supply and exhaust ventilation systems, where inlets are placed in the bedrooms.
3.3. Symptoms of a Poor Indoor Environment
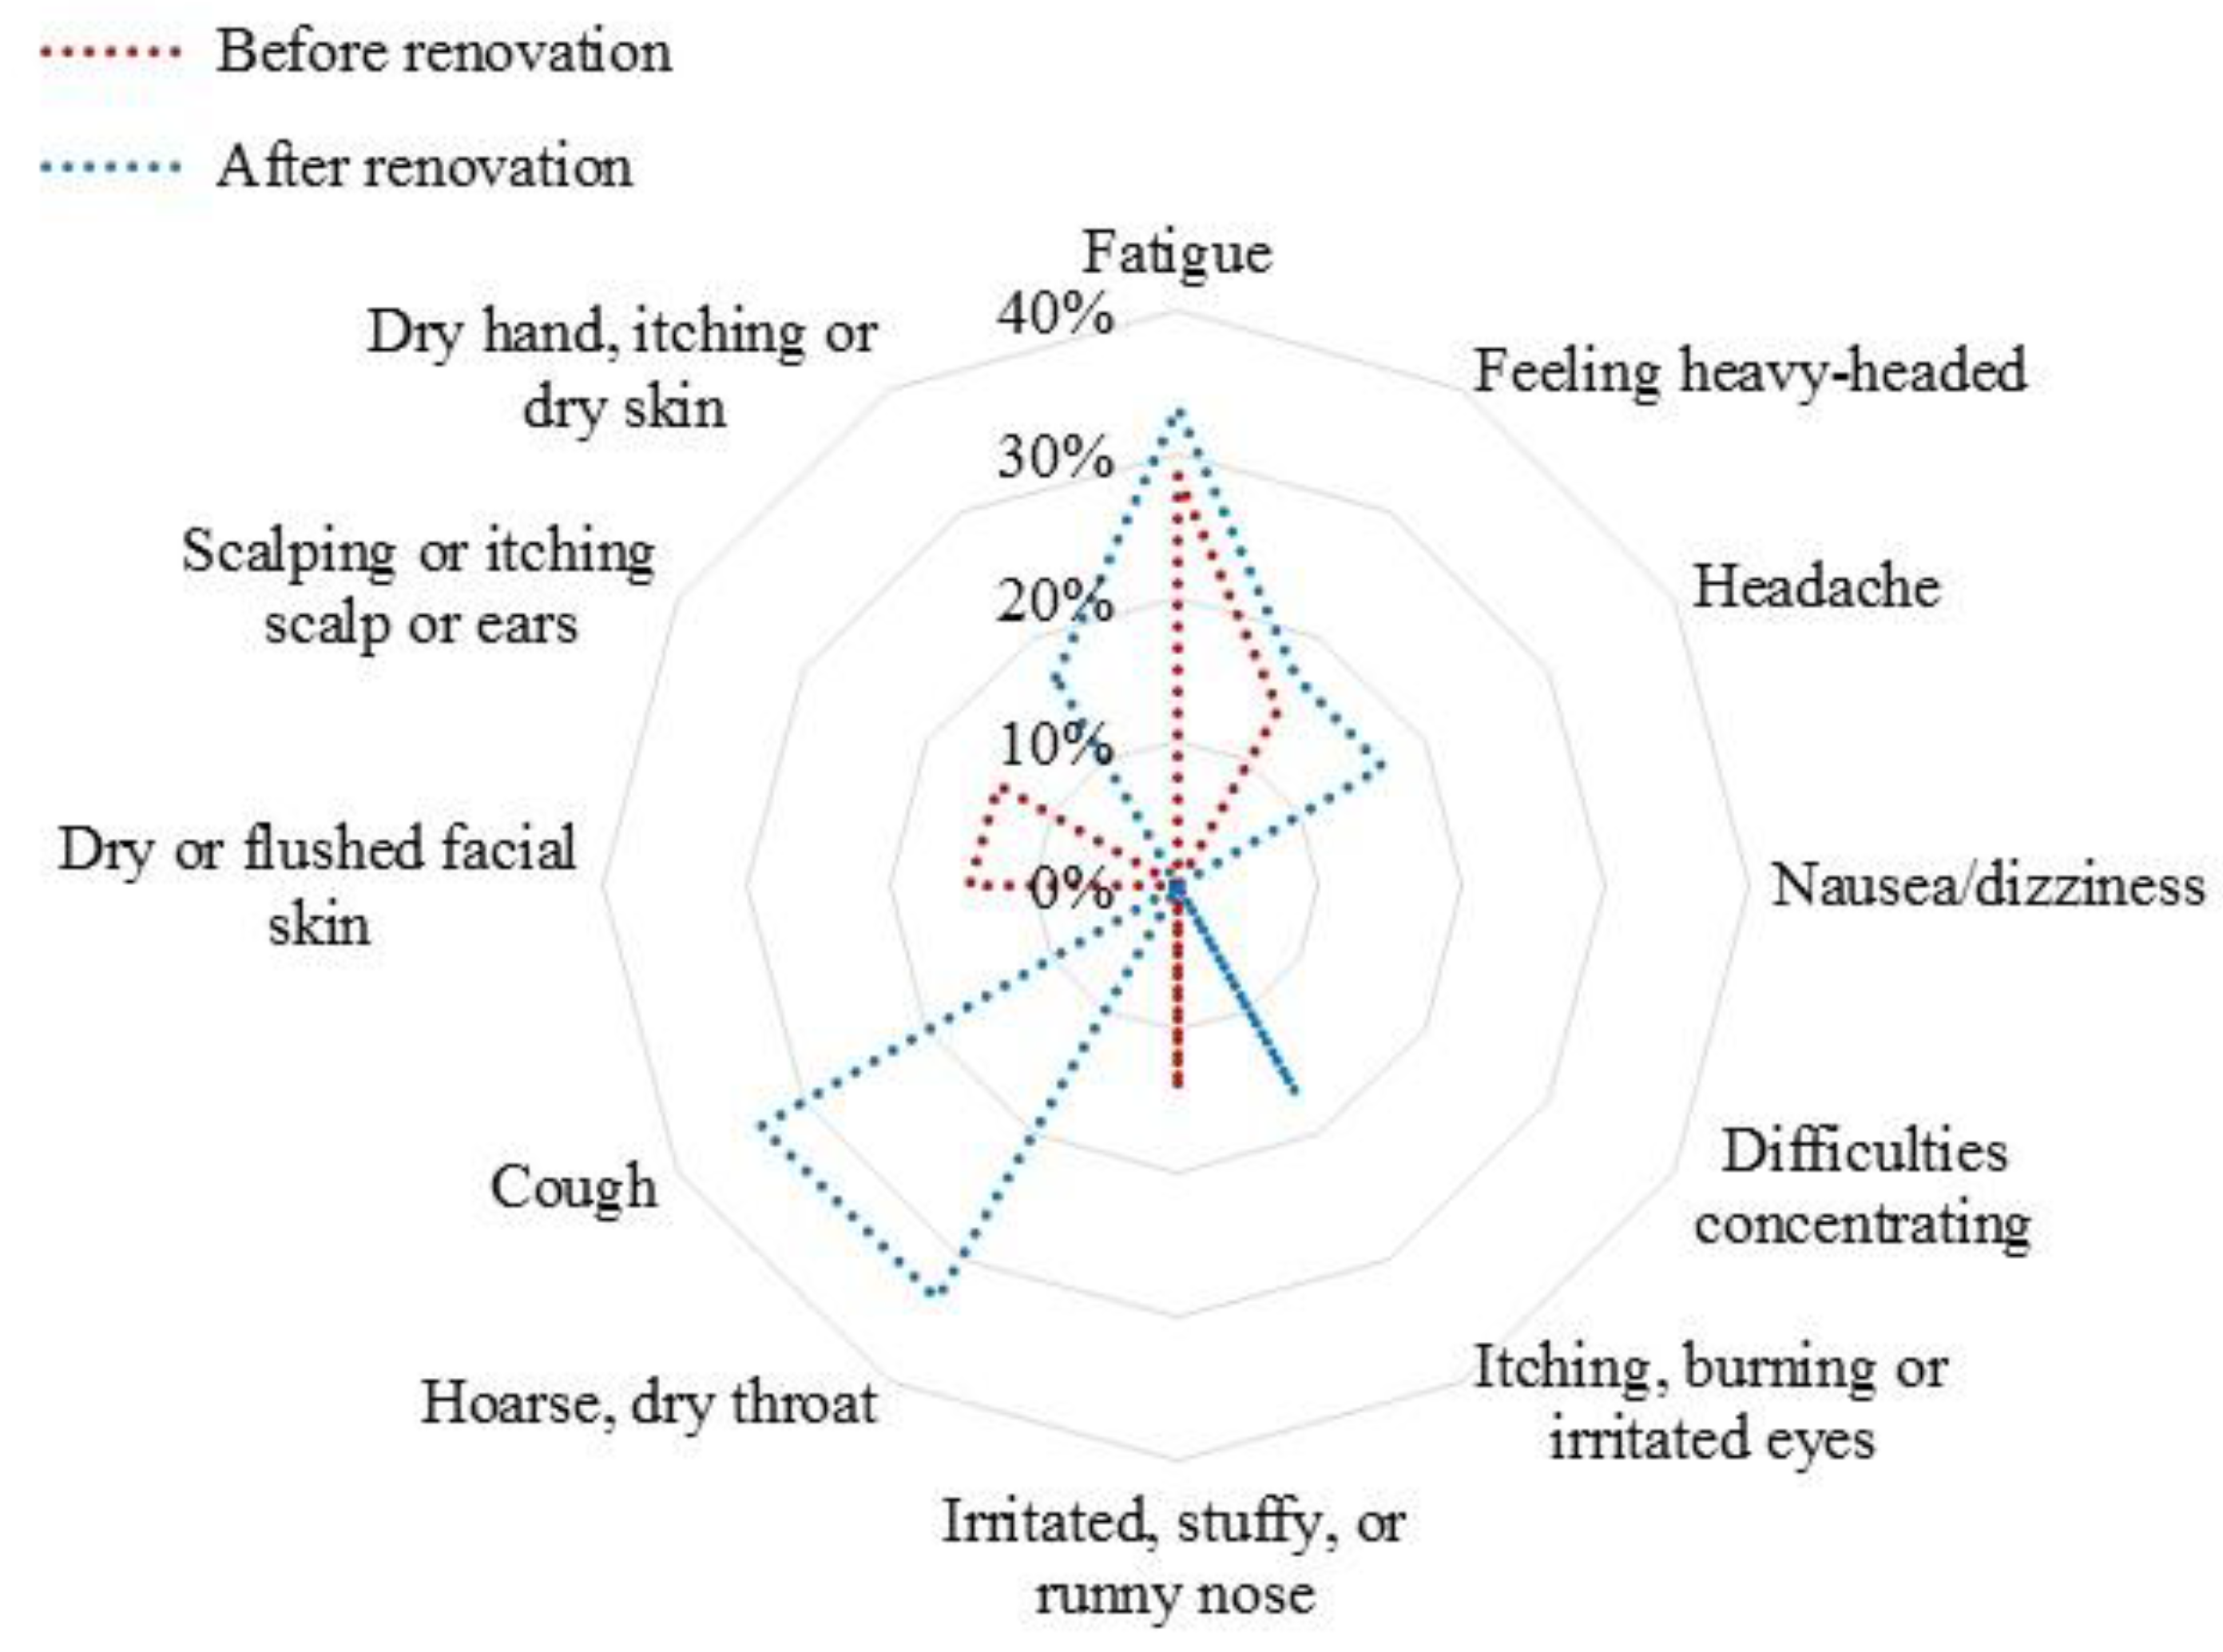
Symptoms of fatigue are noted by a couple of respondents in the building before the renovation, see Figure 7. Together with heavy-headedness and headaches, fatigue could be a symptom of poor ventilation [32]. Environmental factors such as dry air and stuffy air are often prevalent at the same time, which is not indicated by the respondents, see Figure 5. Bad odors can also be an indicator of problems with air pollutants or moisture, but is then most often combined with symptoms related to nose, throat and eyes [32]. Symptoms that occupants experienced before the renovation have been reduced, but one resident experienced problem related to dry skin, itching and irritated nose after the renovation, which was not indicated in the questionnaire handed out before the renovation.
3.4. Residents Returning to the Same Apartment
Most residents were new in the building after the renovation was completed, but two of the responding residents had moved back into the same apartment after the renovation. Gender and age of the respondents indicate the respondents are the same before and after the renovation. The overall experience and problems related to the indoor environment indicated by these two respondents are shown in Table 8. Both respondents seem content with their thermal environment after the renovation. The resident in the small apartment indicate that there are problems with high indoor temperature during summer both before and after the renovation, which has also been indicated in the indoor climate simulations, see Table 7, Figure 3 and Figure 4. The residents in the large apartment in the first floor (zone B) experiences many problems related to poor thermal comfort (low temperatures and draught) before the renovation, but none after. The residents in zone B also experiences more problems related to noise and has a lower overall experience with noise in his or her apartment.
3.5. Sensitivity Analysis
3.5.1. Indoor Temperature Set Point
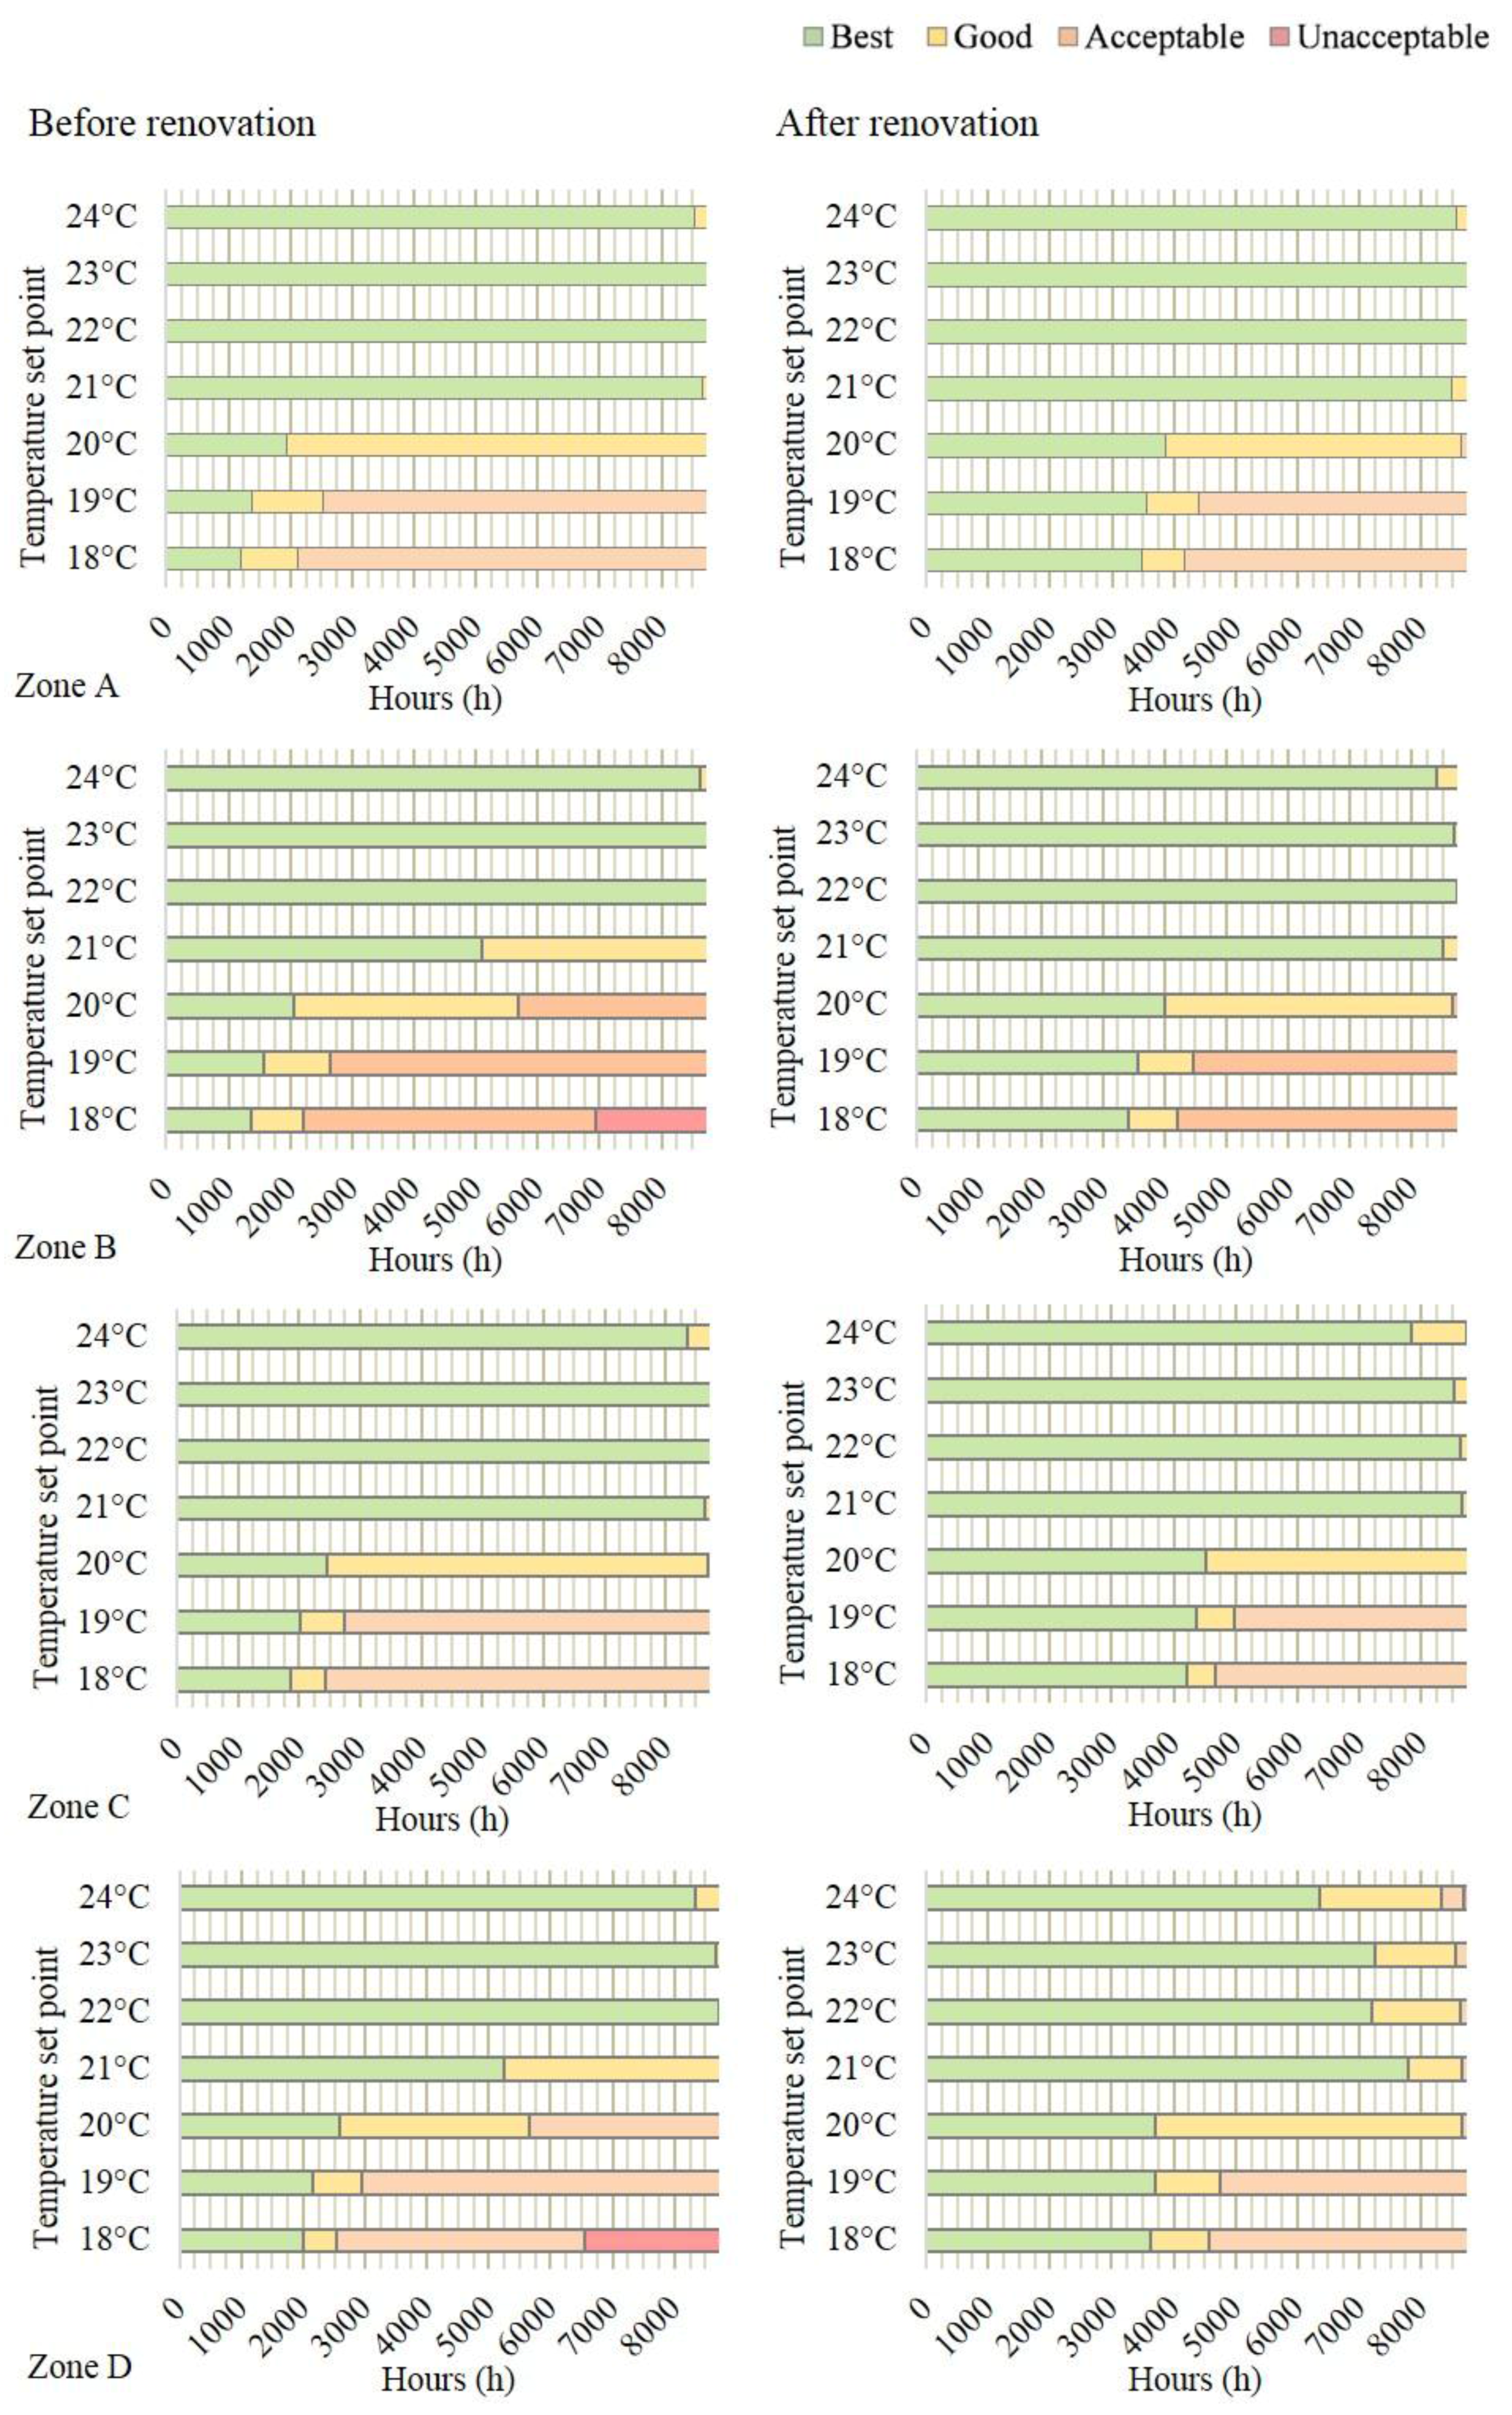
A low indoor temperature is desirable from an energy perspective but causes problems with poor thermal comfort. However, in buildings with a high degree of thermal insulation and heated supply air, the thermal comfort is perceived as better at lower set points for the indoor temperature. As seen in Figure 8, thermal comfort is “best” or “good” for nearly the whole year in the renovated building with a set point of 20 °C, whereas it falls into the “acceptable” category for large parts of the year in zones B and D in the pre-renovation case. The measured indoor temperature in the unrenovated building and the poor overall experience with the indoor thermal environment indicated in the questionnaire are consistent with these results.
Increasing the set point by 1 °C increases annual energy use for the whole building by on average of 8.9% for the building both before and after renovation. Simulated energy use per heated floor area for different zones is seen in Figure 9. The most significant difference between the cases before and after renovation is seen in zone D, the largest apartment on the top floor. In the large reference zones (zone B and D) and an indoor temperature set point of 22 °C would be needed to achieve similar thermal comfort in the unrenovated building as in the renovated building, which would require an additional 24.7 MWh per year and increase the total energy use by 24.9% compared to the actual heat demand before the renovation.
3.5.2. Window Solar Heat Gain
The choice of window solar heat gain factor, g-value, can have a significant impact on the building energy use. The old clear glass windows had a g-value of 0.68 and the new low emissivity windows that was installed during the renovation has g-value of 0.43. In the unrenovated building a low g-value means fewer hours within the “best” thermal comfort, but the same phenomenon is not seen in the renovated building, see Figure 10. On the other hand, a high g-value means that indoor temperatures in summer are so high that the thermal comfort is “unacceptable” in the top floor apartment in the renovated building. Too high indoor temperatures were not a problem with high g-values in the building before renovation.
Solar heat gains have a greater impact on heat demand in the renovated case. The difference between no solar heat gain (g-value = 0) and full solar heat gain (g-value = 1) is 21.7% for the renovated building and 15.9% in the pre-renovation case, see Figure 11.
3.5.3. Internal Heat Generation
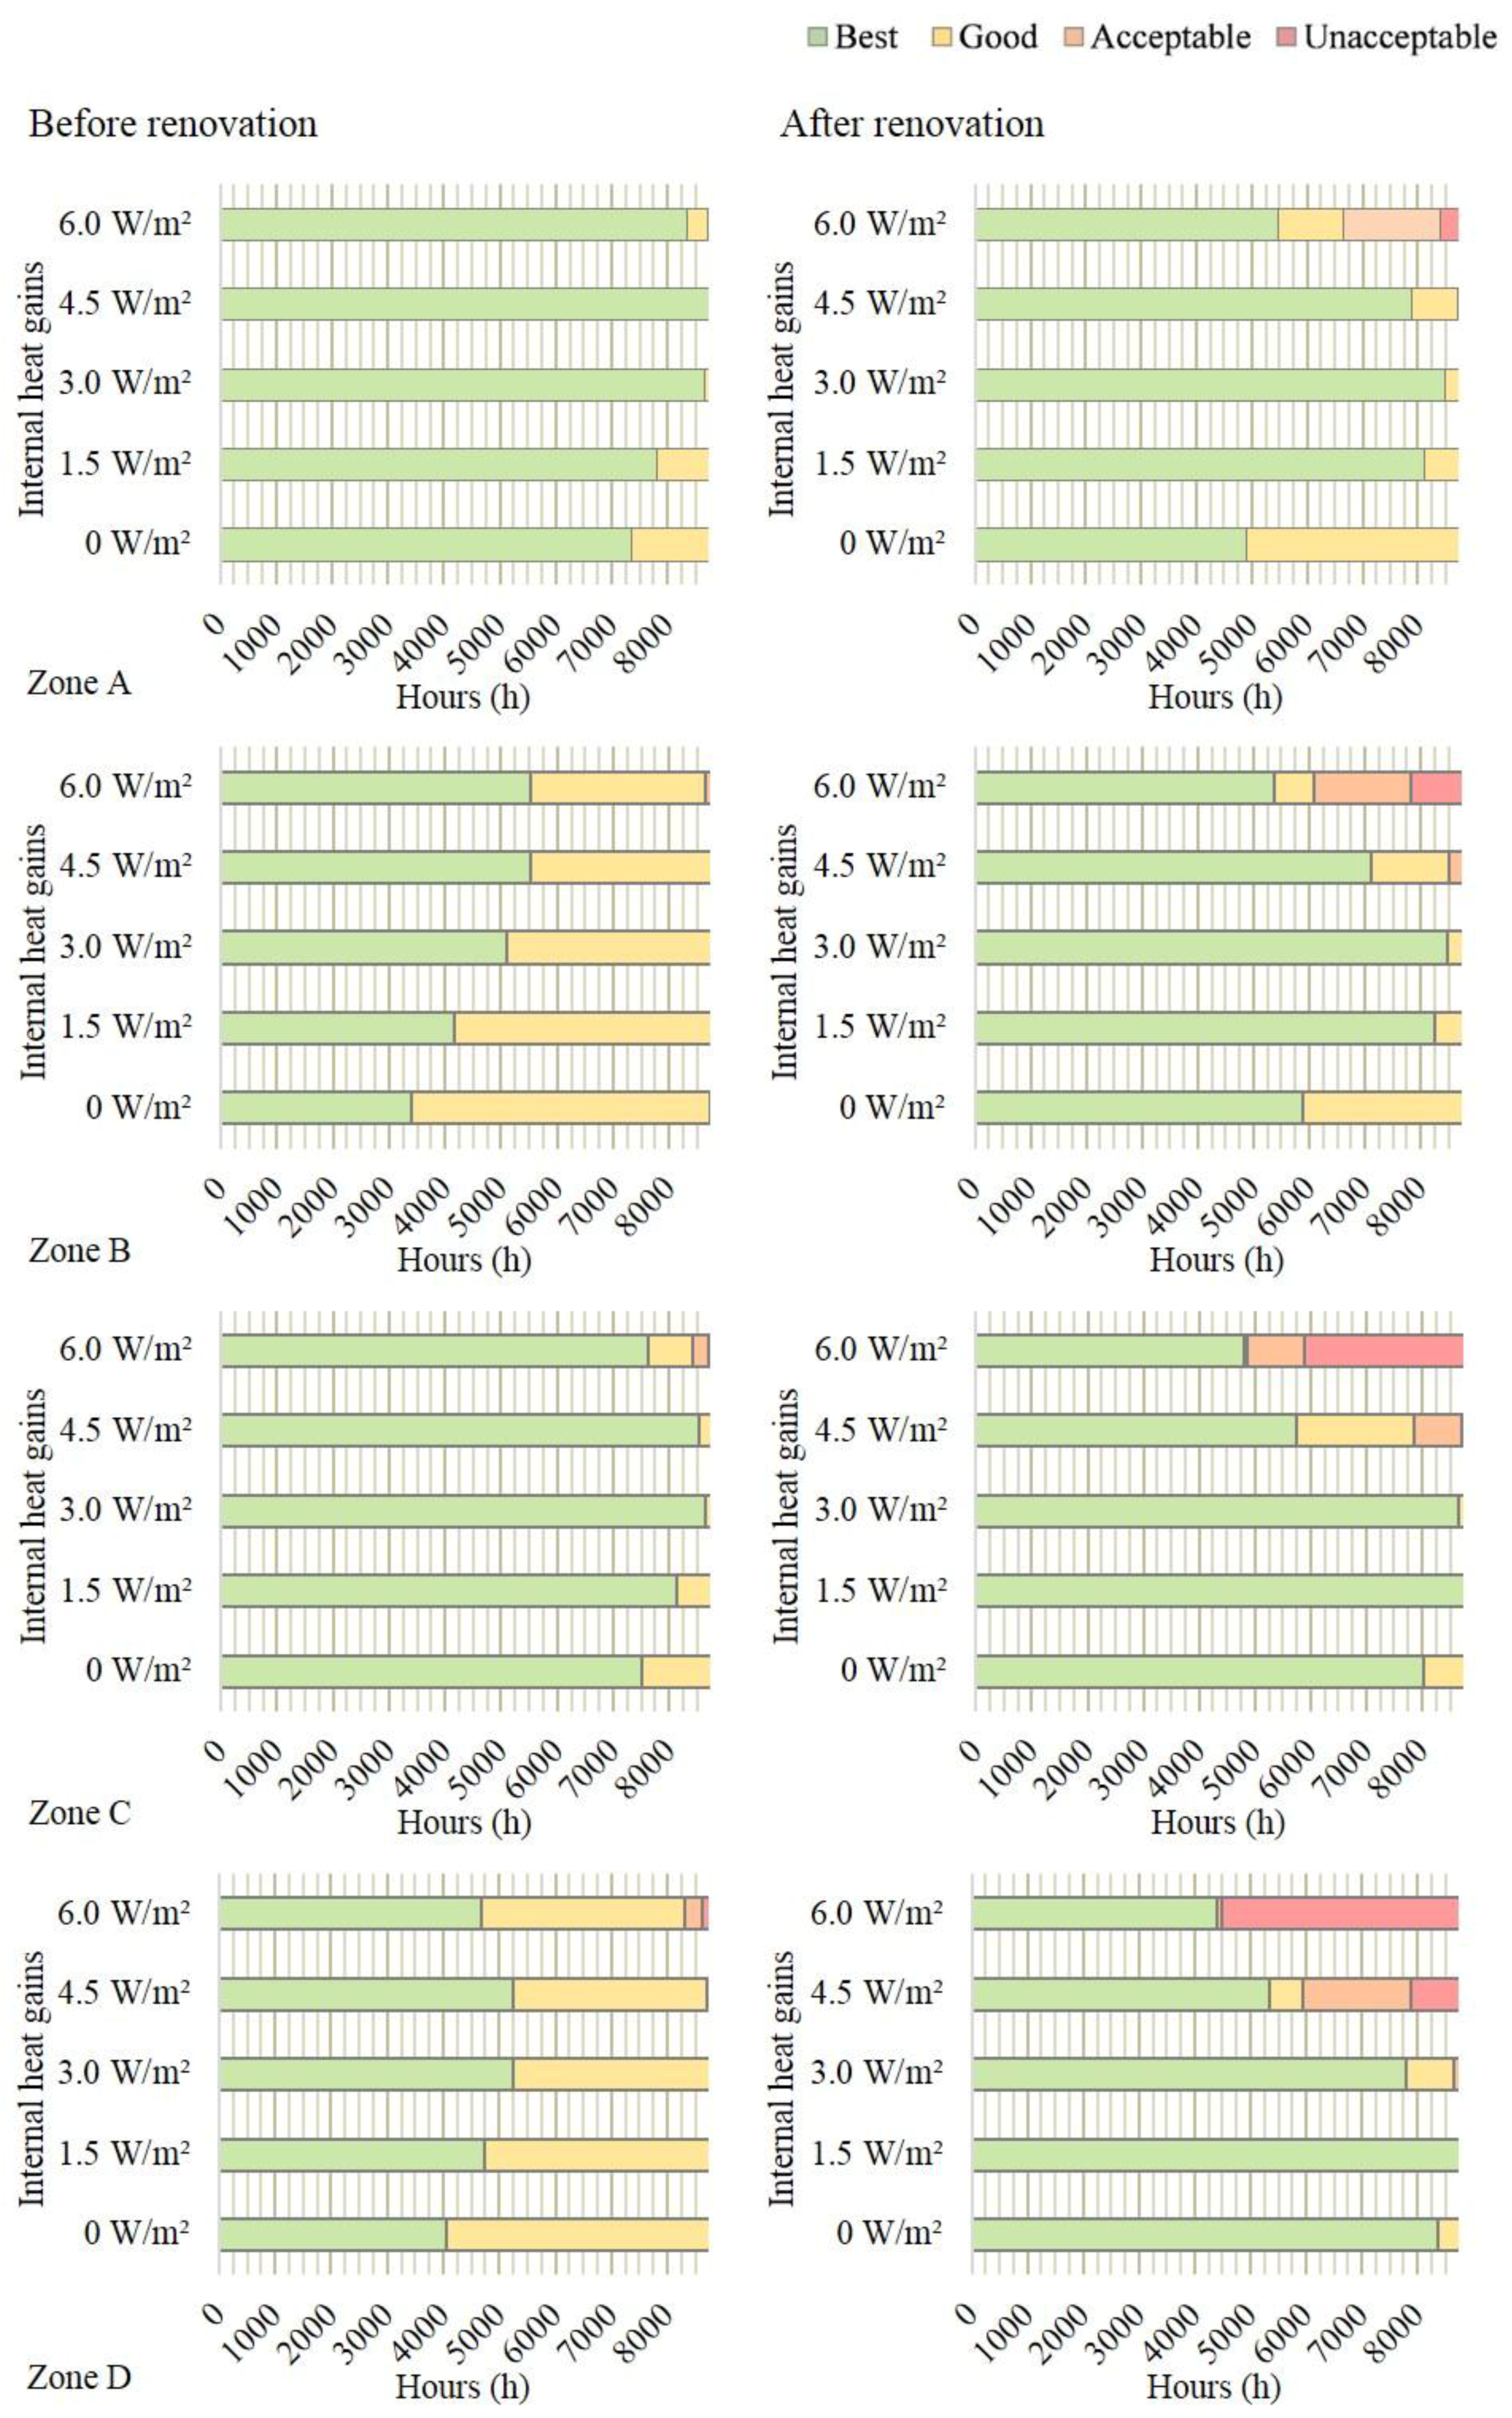
In addition to solar heat gains, appliance use and body heat from occupants contribute heat to a building. Although they have a significant impact and are highly diversified between different households, standardized heat generation is often used in energy calculations and simulations. High internal heat gains mean that problems with too high indoor temperature occur, especially during summer, see Figure 12. The problem is more prominent in the renovated building, compared to the building before renovation.
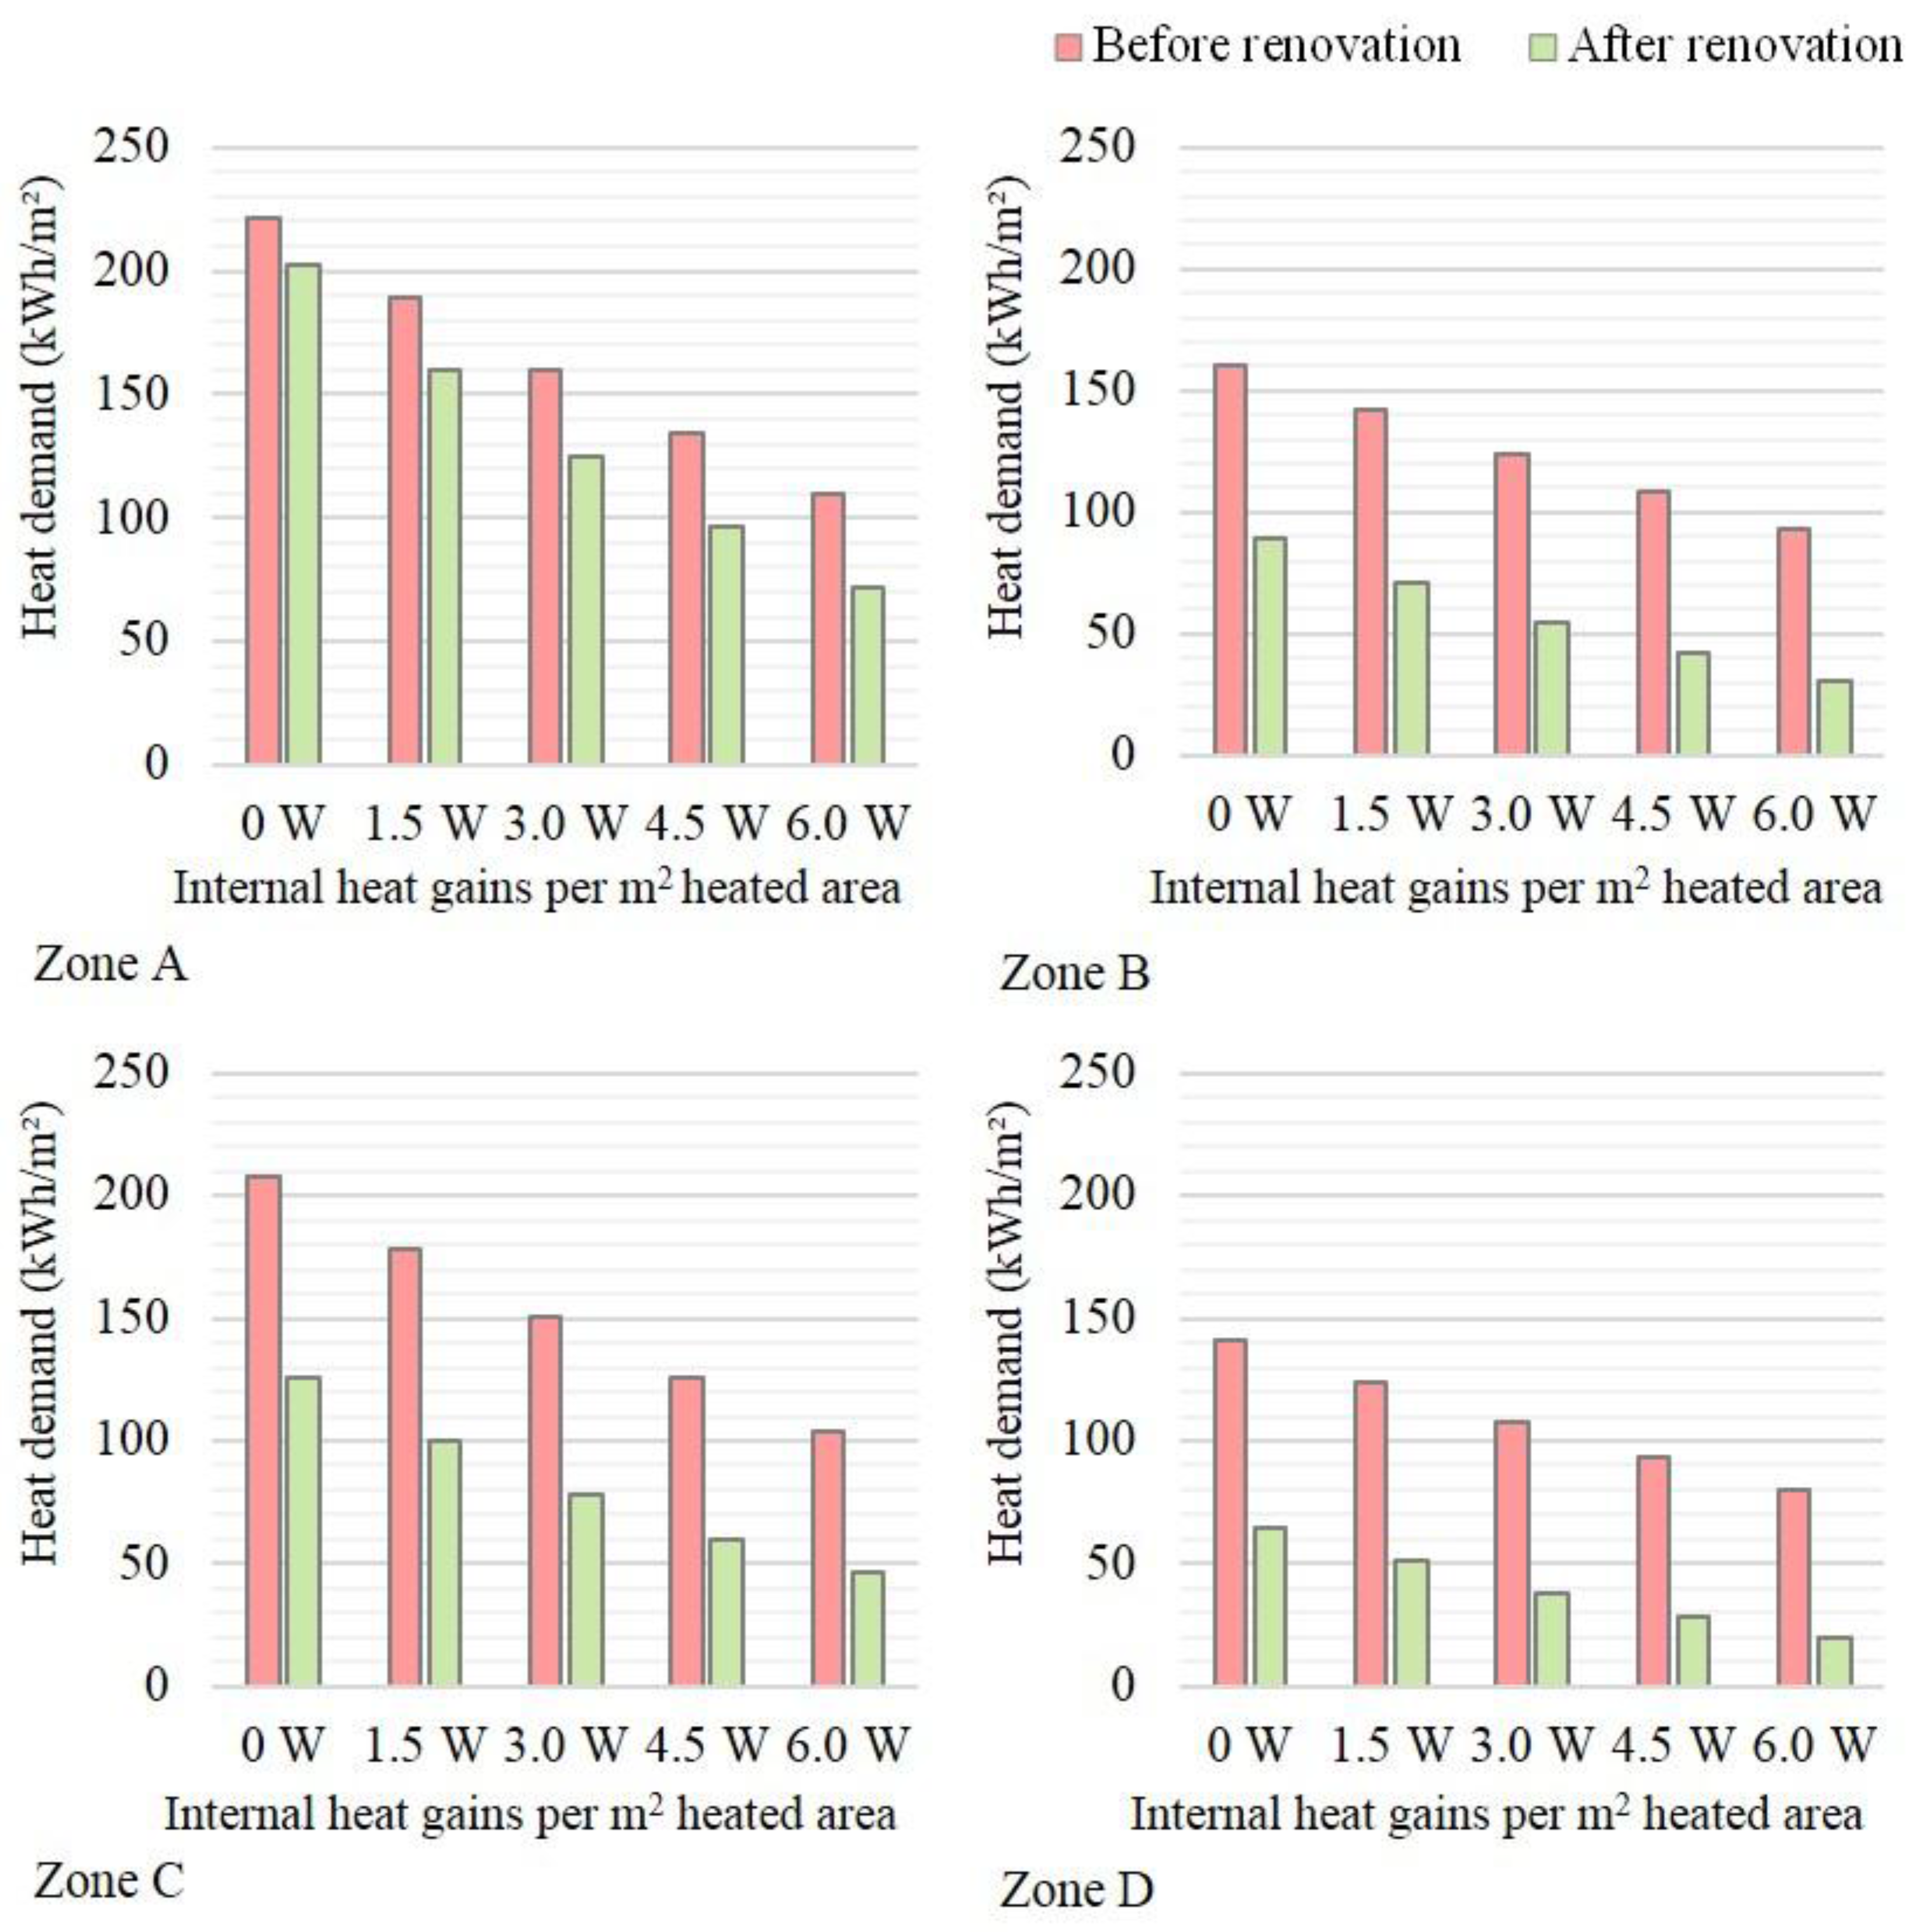
High internal heat gains have a significant impact on energy use, especially in the renovated building, see Figure 13. An increase in internal heat gains by 50% means a reduction in heat demand by 21% in the renovated building and 14% in the building before renovation. The amount of internal heat gains used for calculations or estimation of energy use because of a renovation is therefore central to consider avoiding over or underestimating of the energy saving potential (or the energy use).
4. Concluding Discussion
Respondents indicate that the indoor environment has improved after the renovation, regarding thermal comfort, air quality and noise, although a higher number of symptoms that could be related to problem with the indoor environment are noted. Buildings with a light weight concrete construction and exhaust ventilation are common in the Swedish building stock and the studied case shows a significant potential for improvements of both energy performance and indoor environment as a result of renovation.
Thermal comfort has been studied more extensively than other indoor environmental parameters in this study. Both questionnaire and simulations show that the thermal comfort during winter was poor before the renovation. Under winter design conditions minimum operative temperature was increased by nearly 2 °C after the renovation. The design power of the heating system was likely too small in the pre-renovation building to supply the desired indoor temperature. This means that simulations of PMV and PPD, although accurate in relation to reality, are not necessarily translatable to another context without knowing the existing conditions. Both simulations and results from the questionnaire indicate that thermal comfort has been improved as a result of the renovation and the sensitivity analysis shows that the thermal environment is more comfortable at lower indoor temperature set points. A higher degree of thermal insulation and heated supply air means that the thermal environment in winter is more stable. The operative temperature in the building is also higher since internal surface temperatures are higher with higher degree of thermal insulation and the room temperature is perceived as more comfortable. As indicated by the simulation in summer design conditions, the renovated building with more thermal insulation also risks high indoor temperatures and poorer thermal comfort during summer without user adaptation such as airing or solar shading such as awnings. A more complex ventilation system causes problems with noise, as indicated by the respondents, and also means more electricity use for fan operation.
Internal heat gains, from solar radiation, appliance use and occupant body heat, have a strong influence on heat demand. It seems reasonable to assume that this “free” heating should be as high as possible in cold climates, for example allowing most of the heat from solar radiation to reach the zone, but as shown in the sensitivity analysis, this means poor thermal comfort during summer, especially when the building has a high degree of thermal insulation. Adaptive responses such as airing or solar shading could be applied to reduce problems with high indoor temperatures. The choice of assumed appliance usage also has great influence on the possibility of correctly predicting potential for energy saving from efficiency measures, such as renovation.
Respondents perceive indoor air quality as better after the renovation, although problems with dry air and static electricity occur to a greater extent than before renovation. Dry air indoors is a common problem in cold climates, where the outdoor air has a low moisture content. Perceptions of stuffy air, unpleasant smells and tobacco smoke appear to be a problem before and after renovation, but problems with cooking odors have been significantly reduced. A third of the respondents experience problems related to noise. Still, overall experience with noise is lower than with thermal comfort and indoor air quality, where more problems are noted. This could indicate that factors included in the questionnaire do not capture the full picture of problems related to noise, or that problems with noise, even very small, have a great impact on overall experience.
Studies of perceived indoor environment are an important tool for better understanding additional values of renovation in addition to improvement of energy efficiency. Two respondents moved back into their renovated apartment and both perceive better thermal comfort. One of these two respondents experience problems with noise as well as dust and dirt, but both appear mostly content and experience few other problems related to their indoor environment.
Buildings need to fulfill many functions to satisfy the residents. Providing a good indoor environment, while using less energy, is only one of them. The renovation of the studied building reveals a significant reduction in annual energy use by 44%. At the same time, residents are more content with the indoor environment, and none of the respondents perceive overall experience with their indoor environment as poor or unacceptable after the renovation. PPD has been reduced from an average of 23% to 14% in the reference zones, meaning that indoor thermal comfort had been improved from unacceptable to acceptable in accordance with European standard EN 15251-2007 [34].
Sweden and the rest of the European Union faces a challenge of renovating an aging building stock. Improving understanding of the effect from major renovation on buildings is an important step towards more sustainable and efficient renovation of buildings. The studied renovation demonstrates that renovation not only has an important role to play in reducing energy use in the building sector overall, but also in providing a better indoor environment in the buildings where residents live and spend a significant amount of their time.
Acknowledgments
This study has been financed by the Swedish Research Council Formas. The authors gratefully acknowledge the housing company Stångåstaden in Linköping, Sweden, for information about and access to the studied building.
Author Contributions
Bahram Moshfegh was the project leader. All three authors contributed equally to the design of the study. Lina La Fleur performed and analyzed the questionnaires and simulations and wrote the paper. Patrik Rohdin contributed to the analysis of the questionnaires and simulations and the interpretation of the results. Patrik Rohdin and Bahram Moshfegh contributed with valuable advice and revision of the manuscript.
Conflicts of Interest
The authors declare no conflict of interest.
References
- European Parliament. Directive 2010/31/EU of the European Parliament and of the Council-on the Energy Performance of Buildings. Official Journal of the European Union. Available online: http://eur-lex.europa.eu/legal-content/EN/TXT/PDF/?uri=CELEX:32010L0031&from=EN (accessed on 5 March 2018).
- European Parliament. Directive 2012/27/EU of the European Parliament and of the Council-on Energy Efficiency. Official Journal of the European Union. Available online: http://eur-lex.europa.eu/LexUriServ/LexUriServ.do?uri=OJ:L:2012:315:0001:0056:en:PDF (accessed on 5 March 2018).
- United Nations. Transforming Our World: The 2030 Agenda for Sustainable Development. Resolution adopted by the General Assembly on 25 September 2015. Available online: http://www.un.org/ga/search/view_doc.asp?symbol=A/RES/70/1&Lang=E (accessed on 14 February 2018).
- The Swedish Government. The Swedish Environmental Objectives-Proposition 2009/10:155; The Swedish Government Office: Stockholm, Sweden, 2010.
- Allard, I.; Olofsson, T.; Hassan, O.A.B. Methods for energy analysis of residential buildings in Nordic countries. Renew. Sustain. Energy Rev. 2013, 22, 306–318. [Google Scholar] [CrossRef]
- Liu, L.; Moshfegh, B.; Akander, J.; Cehlin, M. Comprehensive investigation on energy retrofits in eleven multi-family buildings in Sweden. Energy Build. 2014, 84, 704–715. [Google Scholar] [CrossRef]
- Liu, L.; Rohdin, P.; Moshfegh, B. Evaluating indoor environment of a retrofitted multi-family building with improved energy performance in Sweden. Energy Build. 2015, 102, 32–44. [Google Scholar] [CrossRef]
- Thomsen, K.E.; Rose, J.; Mørck, O.; Jensen, S.Ø.; Østergaard, I.; Knudsen, H.N.; Bergsøe, N.C. Energy consumption and indoor climate in a residential building before and after comprehensive energy retrofitting. Energy Build. 2016, 123, 8–16. [Google Scholar] [CrossRef]
- IEA Annex 56. Cost-Effective Energy & CO2 Emissions Optimization in Building Renovation-Case Studies. Available online: http://www.iea-annex56.org/index.aspx?MenuID=4 (accessed on 14 February 2018).
- Andersson, A.; Larsson, D. Renovering av Flerfamiljsbostäder Inom Miljonprogrammet ur ett Energi- och Lönsamhetsperspektiv. Bachelor’s Thesis, Chalmers University of Technology, Gothenburg, Sweden, 2013. [Google Scholar]
- Mørck, O.; Almeida, M.; Ferreira, M.; Brito, N.; Thomsen, K.E.; Østergaard, I. Shining examples analysed within the EBC Annex 56 project. Energy Build. 2016, 127, 991–998. [Google Scholar] [CrossRef]
- Morelli, M.; Rønby, L.; Mikkelsen, S.E.; Minzari, M.G.; Kildemoes, T.; Tommerup, H.M. Energy retrofitting of a typical old Danish multi-family building to a “nearly-zero” energy building based on experiences from a test apartment. Energy Build. 2012, 54, 395–406. [Google Scholar] [CrossRef] [Green Version]
- La Fleur, L.; Moshfegh, B.; Rohdin, P. Measured and predicted energy use and indoor climate before and after a major renovation of an apartment building in Sweden. Energy Build. 2017, 146, 98–110. [Google Scholar] [CrossRef]
- Swedish National Board of Housing Building and Planning. Underlag till den Andra Nationella Strategin för Energieffektiviserande Renovering; Boverket: Karlskrona, Sweden, 2016; ISBN 978-91-7563-421-0. [Google Scholar]
- U.S. Green Building Council. LEED v4 for HOMES DESIGN AND CONSTRUCTION. Includes LEED BD+C: Homes and Multifamily Lowrise LEED BD+C: Multifamily Midrise; U.S. Green Building Council: Washington, DC, USA, 2013. [Google Scholar]
- BRE Global Ltd. BREEAM UK Refurbishment. Domestic Buildings Technical Manual SD5077-2014-2.2; BRE Global Ltd.: Watford, UK, 2016. [Google Scholar]
- Olsson, S.; Malmqvist, T.; Glaumann, M. Managing Sustainability Aspects in Renovation Processes: Interview Study and Outline of a Process Model. Sustainability 2015, 7, 6336–6352. [Google Scholar] [CrossRef]
- Zalejska-Jonsson, A.; Wilhelmsson, M. Impact of perceived indoor environment quality on overall satisfaction in Swedish dwellings. Build. Environ. 2013, 63, 134–144. [Google Scholar] [CrossRef]
- Ioannou, A.; Itard, L.C.M. Energy performance and comfort in residential buildings: Sensitivity for building parameters and occupancy. Energy Build. 2015, 92, 216–233. [Google Scholar] [CrossRef]
- International Organization for Standardization. ISO 6946:2007 Building Components and Building Elements-Thermal Resistance and Thermal Transmittance-Calculation Method; International Organization for Standardization: Geneva, Switzerland, 2007. [Google Scholar]
- International Organization for Standardization. ISO 13370:2007 Thermal Performance of Buildings-Heat Transfer Via the Ground-Calculation Methods; International Organization for Standardization: Geneva, Switzerland, 2007. [Google Scholar]
- American Society of Heating, Refrigerating and Air-Conditioning Engineers. IDA ICE Climate File-Linköping Malmslätt, Sweden; ASHRAE International Weather Files for Energy Calculations 2.0 (IWEC2); American Society of Heating, Refrigerating and Air-Conditioning Engineers: Chicago, IL, USA, 2016. [Google Scholar]
- Sahlin, P.; Eriksson, L.; Grozman, P.; Johnsson, H.; Shapovalov, A.; Vuolle, M. Whole-building simulation with symbolic DAE equations and general purpose solvers. Build. Environ. 2004, 39, 949–958. [Google Scholar] [CrossRef]
- Bring, A.; Sahlin, P.; Vuolle, M. Models for Building Indoor Climate and Energy Simulation; A Report of Task 22, Building Energy Analysis Tools; Department of Building Sciences, KTH Royal Institute of Technology: Stockholm, Sweden, 1999. [Google Scholar]
- Rohdin, P.; Molin, A.; Moshfegh, B. Experiences from nine passive houses in Sweden-Indoor thermal environment and energy use. Build. Environ. 2014, 71, 176–185. [Google Scholar] [CrossRef]
- Molin, A.; Rohdin, P.; Moshfegh, B. Investigation of energy performance of newly built low-energy buildings in Sweden. Energy Build. 2011, 43, 2822–2831. [Google Scholar] [CrossRef]
- Sveby. Brukarindata Bostäder. Available online: http://www.sveby.org/ (accessed on 14 February 2018).
- International Organization for Standardization. ISO 7730:2005. Ergonomics of the Thermal Environment—Analytical Determination and Interpretation of Thermal Comfort Using Calculation of the Pmv and Ppd Indices and Local Thermal Comfort Criteria; International Organization for Standardization: Geneva, Switzerland, 2005. [Google Scholar]
- Sweden Green Building Council. Bedömningskriterier för Befintliga Byggnader-Manual 2.2 141001; Sweden Green Building Council: Stockholm, Sweden, 2014. [Google Scholar]
- Andersson, K.; Stridh, G.; Fagerlund, I.; Larsson, B. The MM-Questionnaires—A Tool When Solving Indoor Climate Problems; Department of Occupational and Environmental Medicine, Örebro University Hospital: Örebro, Sweden, 1993. [Google Scholar]
- Liu, L.; Thoresson, J. Exploring indoor climate and comfort effects in refurbished multi-family dwellings with improved energy performance. In Smart Innovation, Systems and Technologies; Springer: Heidelberg/Berlin, Germany, 2013; Volume 22, pp. 463–478. [Google Scholar] [CrossRef]
- Andersson, K.; Fagerlund, I.; Bodin, L.; Ydreborg, B. Questionnaire as an instrument when evaluating indoor climate. Healthy Build. 1988, 1, 139–146. [Google Scholar]
- Rohdin, P.; Dalewski, M.; Moshfegh, B. Indoor environment and energy use in historic buildings-comparing survey results with measurements and simulations. Int. J. Vent. 2012, 10, 371–382. [Google Scholar] [CrossRef]
- European Standard. EN 15251-2007. Indoor Environmental Input Parameters for Design and Assessment of Energy Performance of Buildings Addressing Indoor Air Quality, Thermal Environment, Lighting and Acoustics; British Standards Institution: London, UK, 2008. [Google Scholar]
Figure 1.
3D view of IDA model (top) and floor plan with reference apartments (bottom). Location of occupant for simulated comfort indices marked with star.
Figure 1.
3D view of IDA model (top) and floor plan with reference apartments (bottom). Location of occupant for simulated comfort indices marked with star.
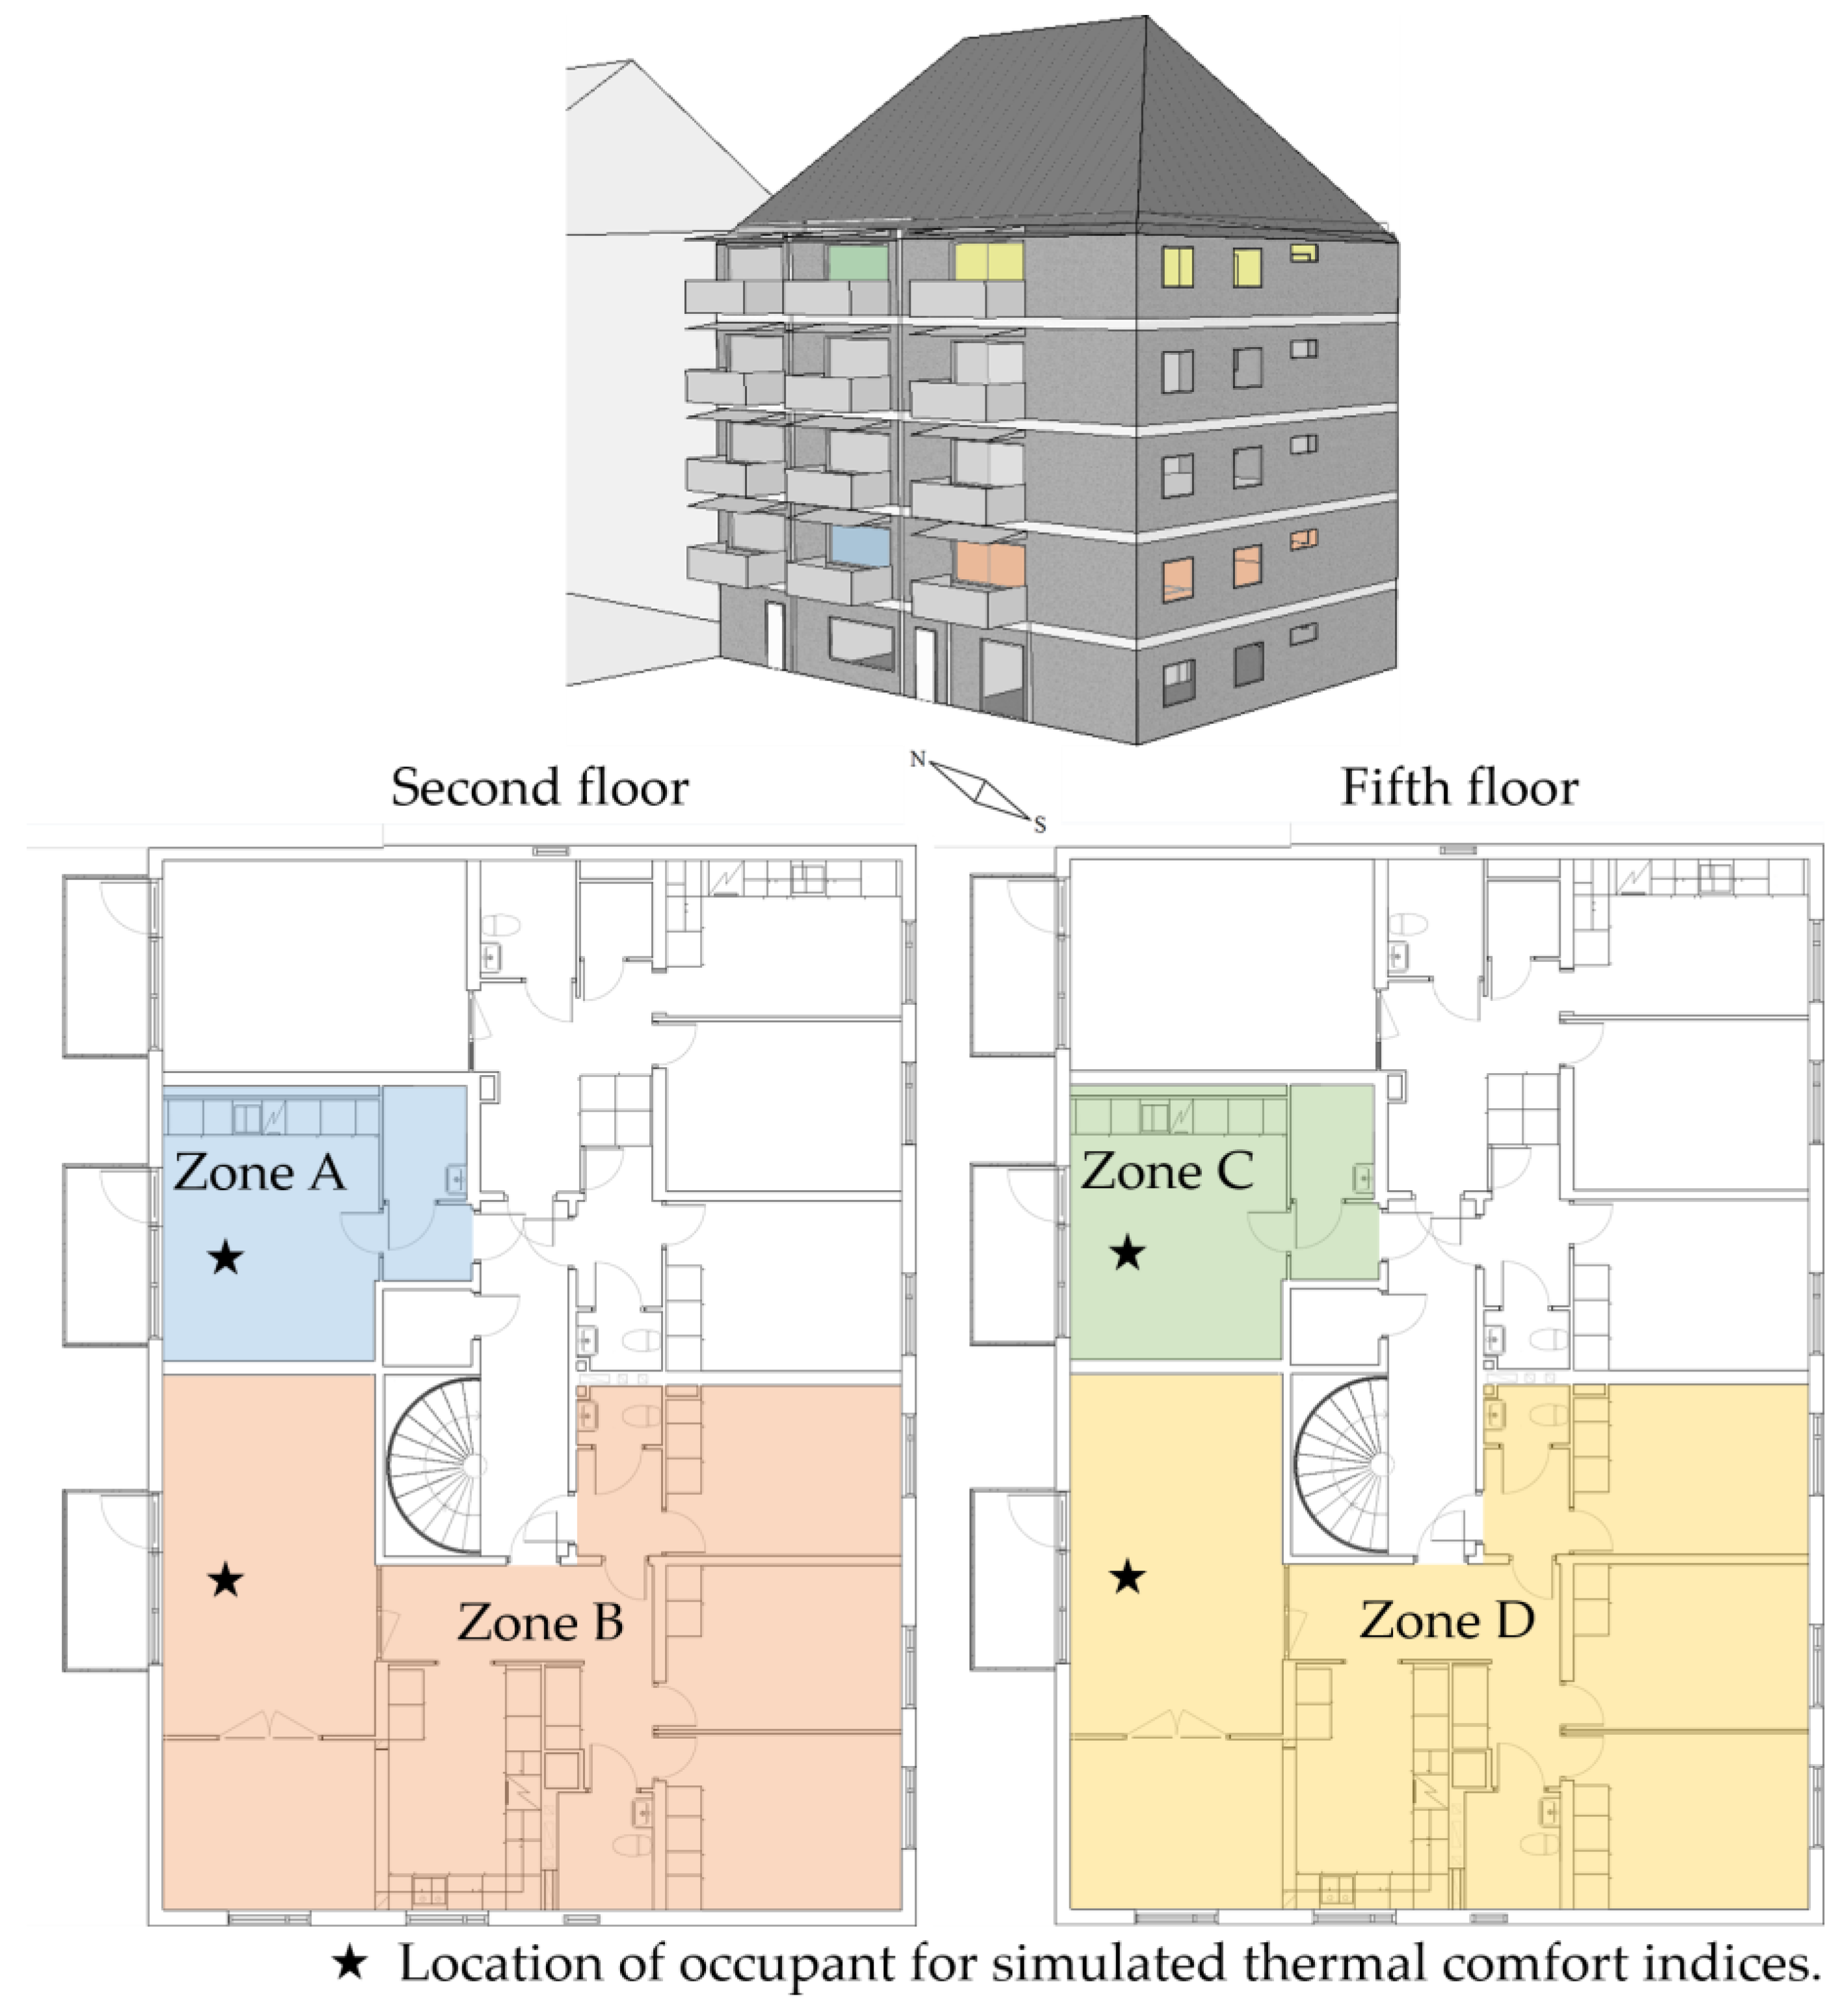
Figure 2.
Perceptions of thermal environmental factors and problems (left) and overall satisfaction with thermal environment (right).
Figure 2.
Perceptions of thermal environmental factors and problems (left) and overall satisfaction with thermal environment (right).
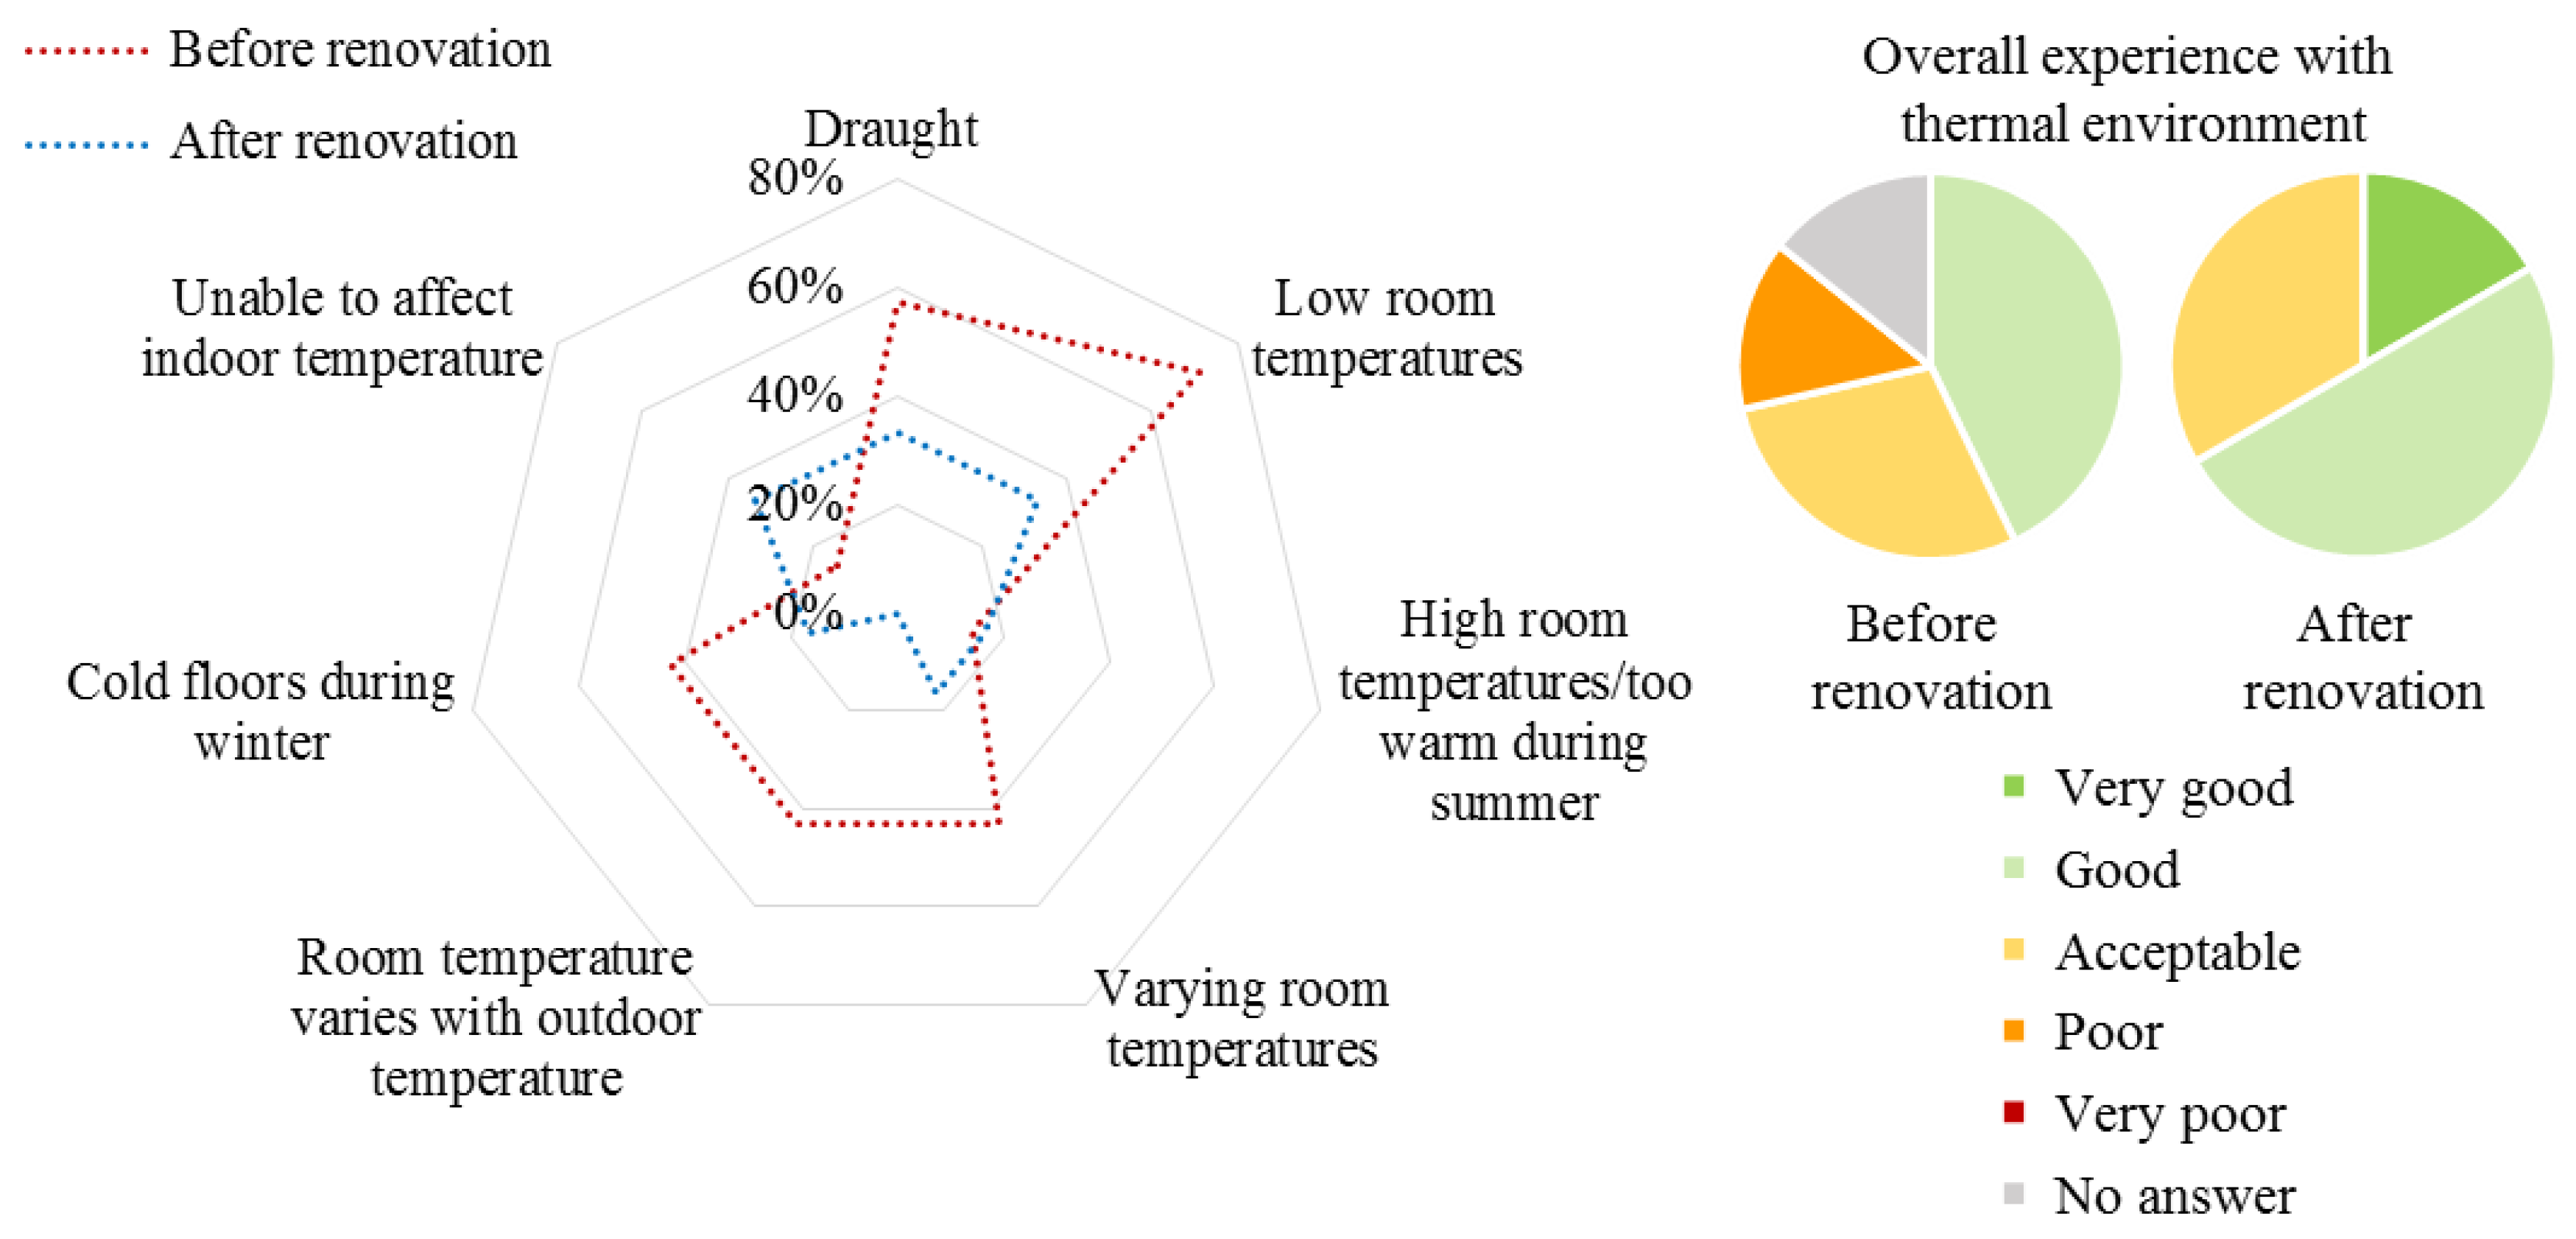
Figure 3.
Predicted percentage dissatisfied (PPD) and predicted mean vote (PMV) for zone A (blue), zone B (orange), zone C (green) and zone D (yellow) in the building before renovation.
Figure 3.
Predicted percentage dissatisfied (PPD) and predicted mean vote (PMV) for zone A (blue), zone B (orange), zone C (green) and zone D (yellow) in the building before renovation.

Figure 4.
Predicted percentage dissatisfied (PPD) and predicted mean vote (PMV) for zone A (blue), zone B (orange), zone C (green) and zone D (yellow) in the renovated building.
Figure 4.
Predicted percentage dissatisfied (PPD) and predicted mean vote (PMV) for zone A (blue), zone B (orange), zone C (green) and zone D (yellow) in the renovated building.

Figure 5.
Perceptions of indoor air quality factors and problems (left) and overall satisfaction with indoor air quality (right).
Figure 5.
Perceptions of indoor air quality factors and problems (left) and overall satisfaction with indoor air quality (right).

Figure 6.
Perceptions of noise factors and problems (left) and overall satisfaction with noise situation (right).
Figure 6.
Perceptions of noise factors and problems (left) and overall satisfaction with noise situation (right).

Figure 7.
Symptoms experienced that can be related to the indoor environment.

Figure 8.
Simulated thermal comfort in reference zones according to standard EN-15251 at different set points for indoor temperature.
Figure 8.
Simulated thermal comfort in reference zones according to standard EN-15251 at different set points for indoor temperature.

Figure 9.
Simulated energy use per heated floor area in the reference zone before renovation (red) and after renovation (green) with different set points for indoor temperature. Heating after renovations include zone heating and AHU heating.
Figure 9.
Simulated energy use per heated floor area in the reference zone before renovation (red) and after renovation (green) with different set points for indoor temperature. Heating after renovations include zone heating and AHU heating.
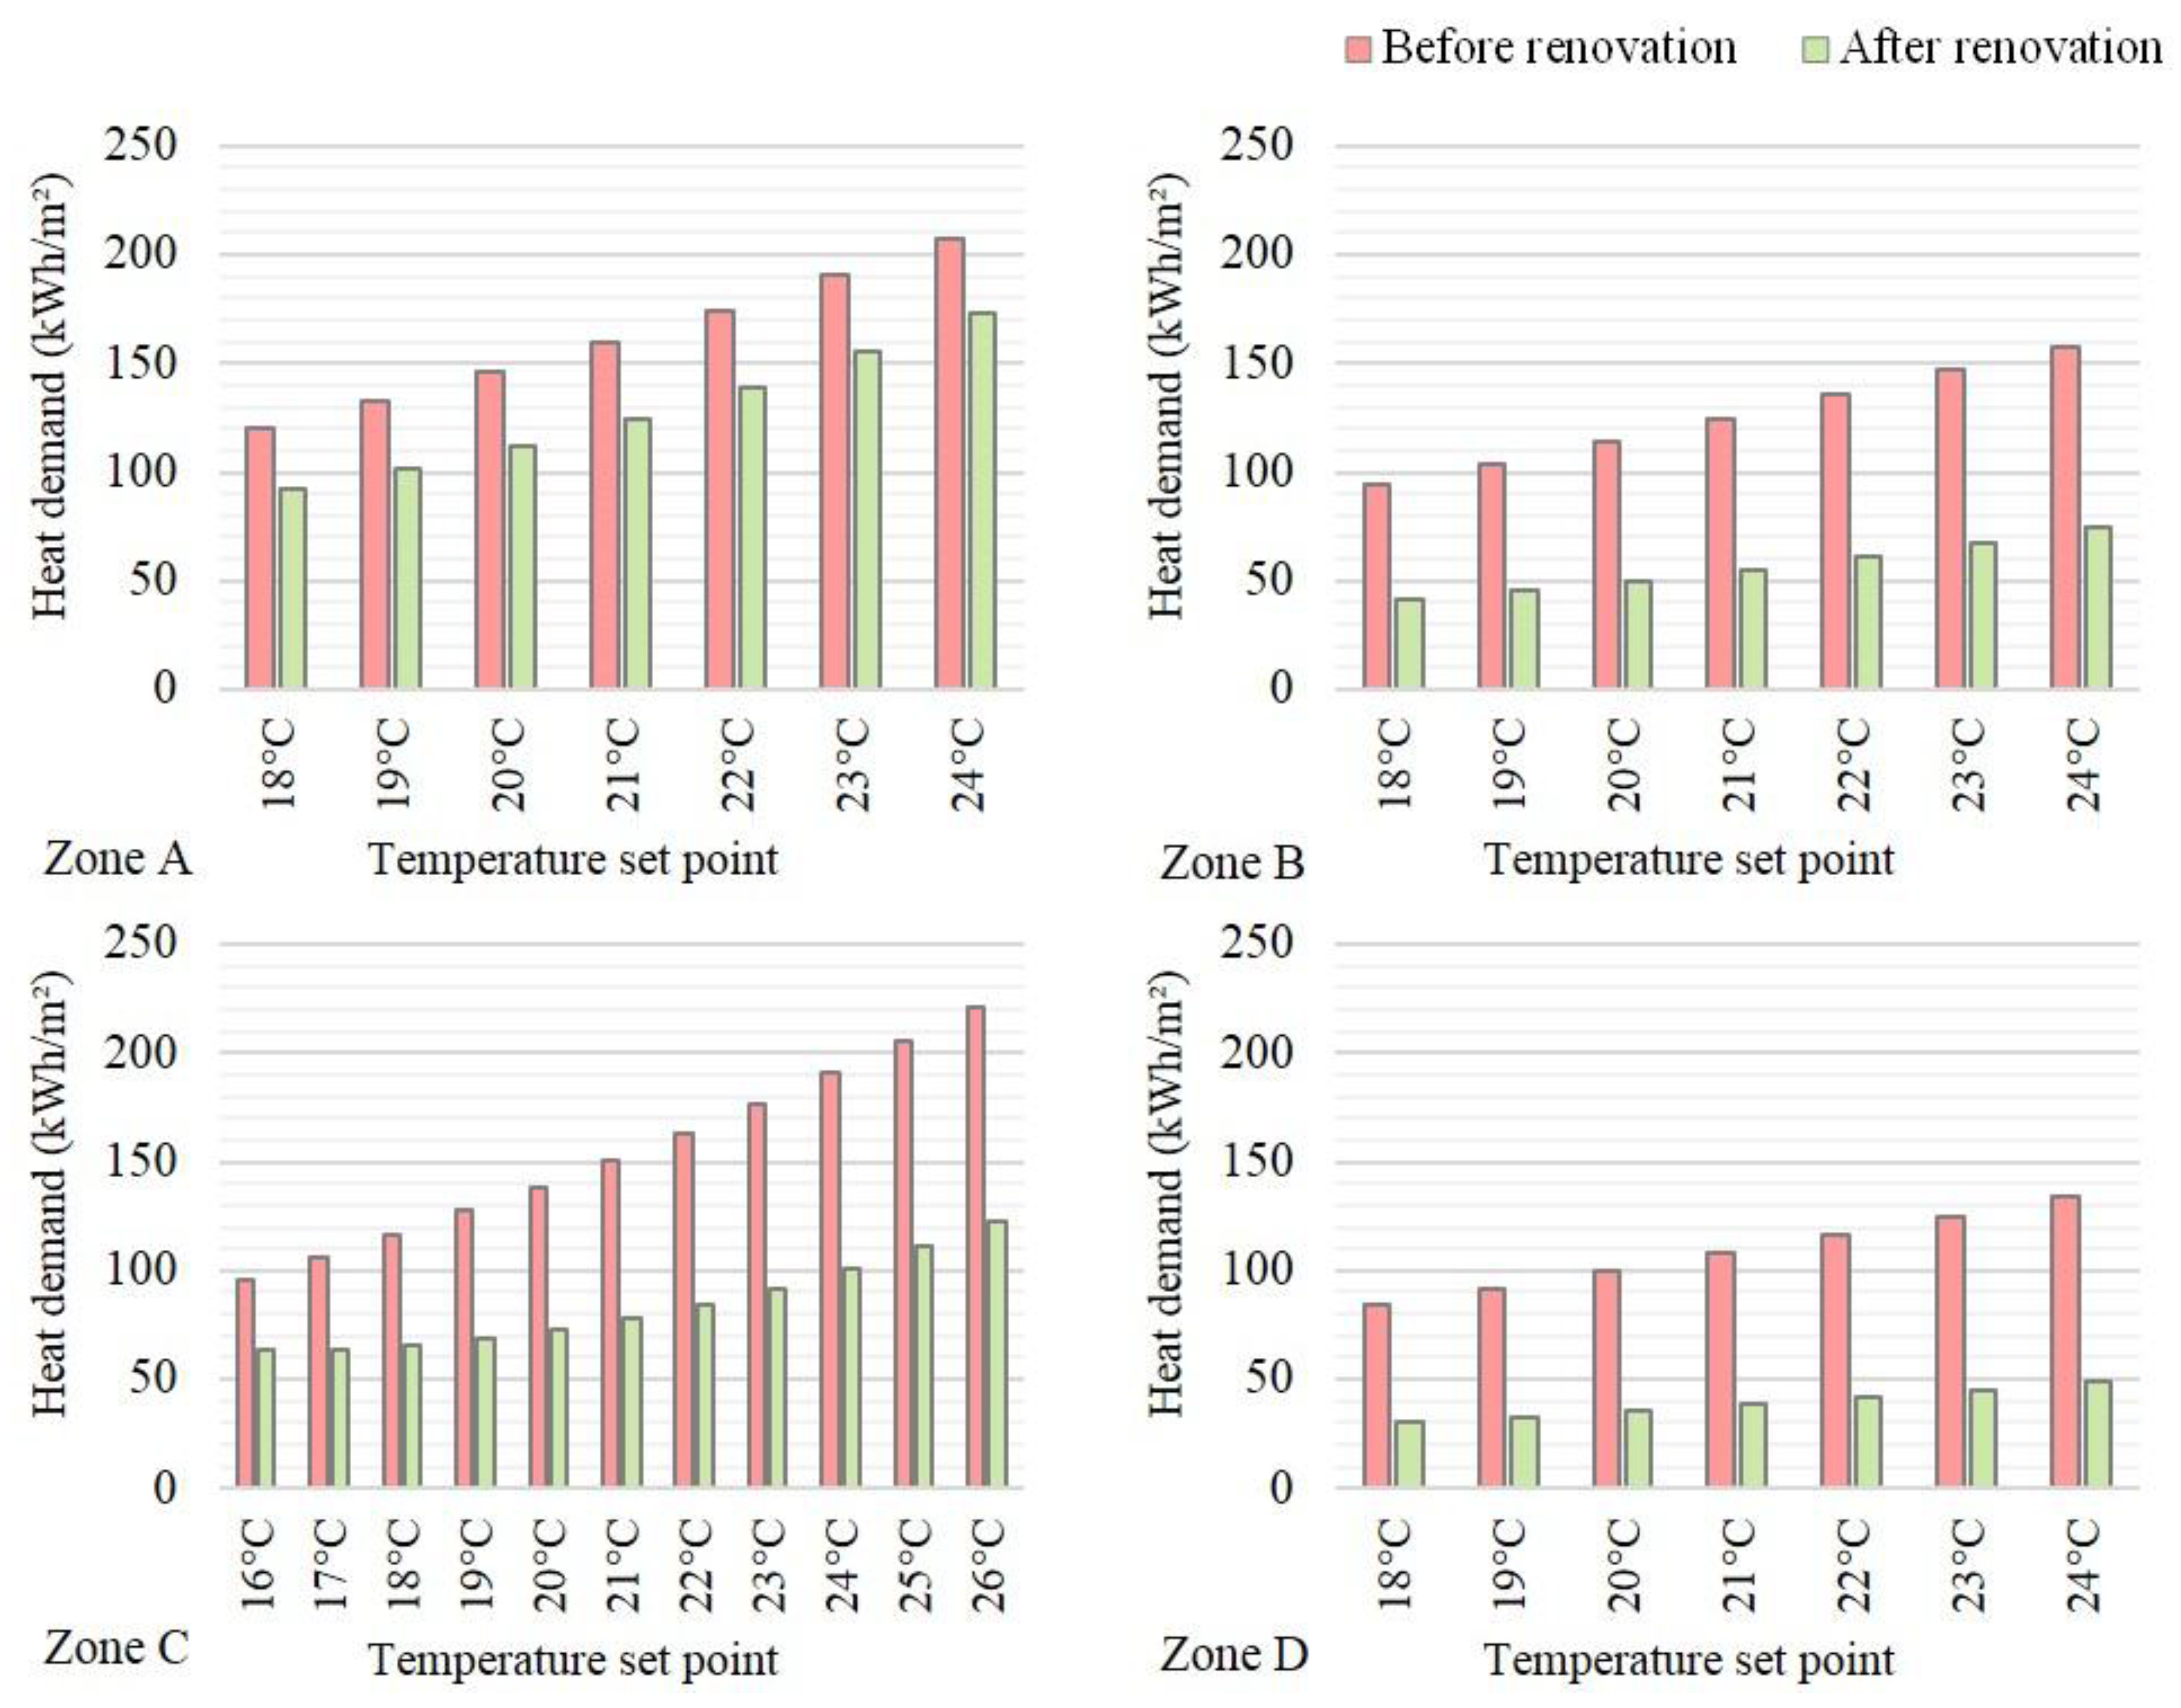
Figure 10.
Simulated thermal comfort according to standard EN-15251 with different window solar heat gain (g-value).
Figure 10.
Simulated thermal comfort according to standard EN-15251 with different window solar heat gain (g-value).
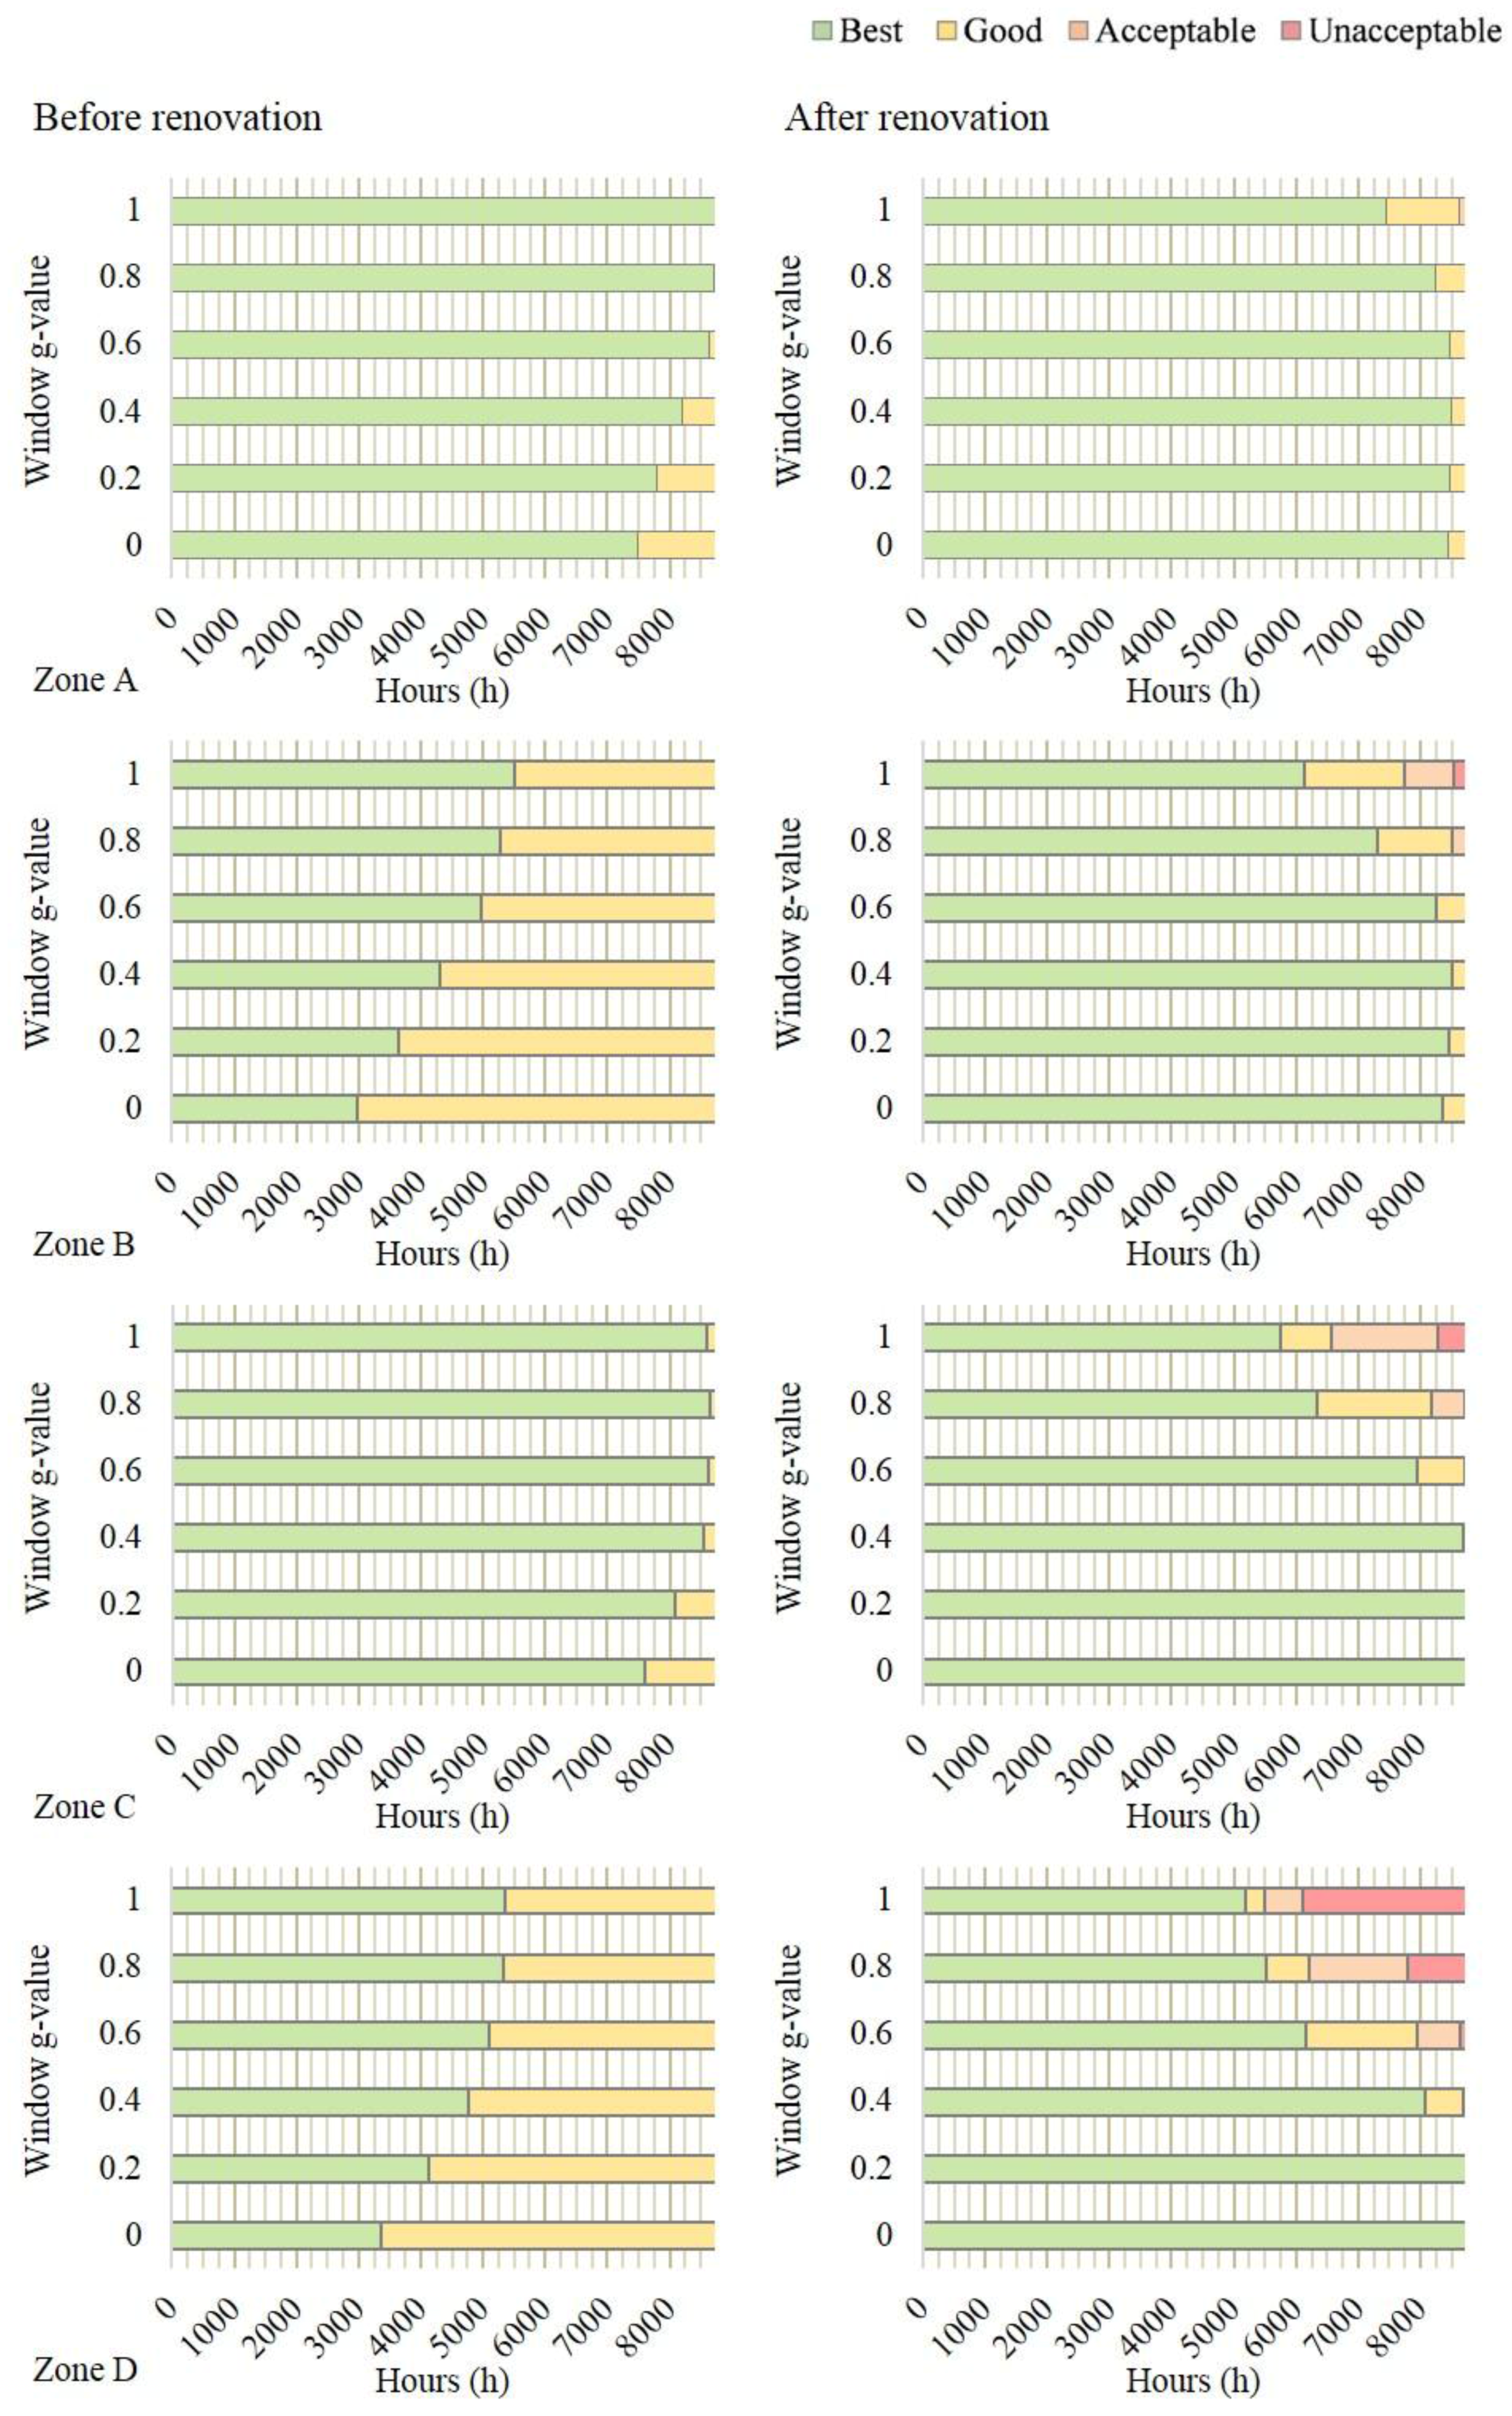
Figure 11.
Simulated energy use per heated floor area in the reference zone before renovation (red) and after renovation (green) with different window solar heat gain (g-value). Heating after renovation includes zone heating and AHU heating.
Figure 11.
Simulated energy use per heated floor area in the reference zone before renovation (red) and after renovation (green) with different window solar heat gain (g-value). Heating after renovation includes zone heating and AHU heating.
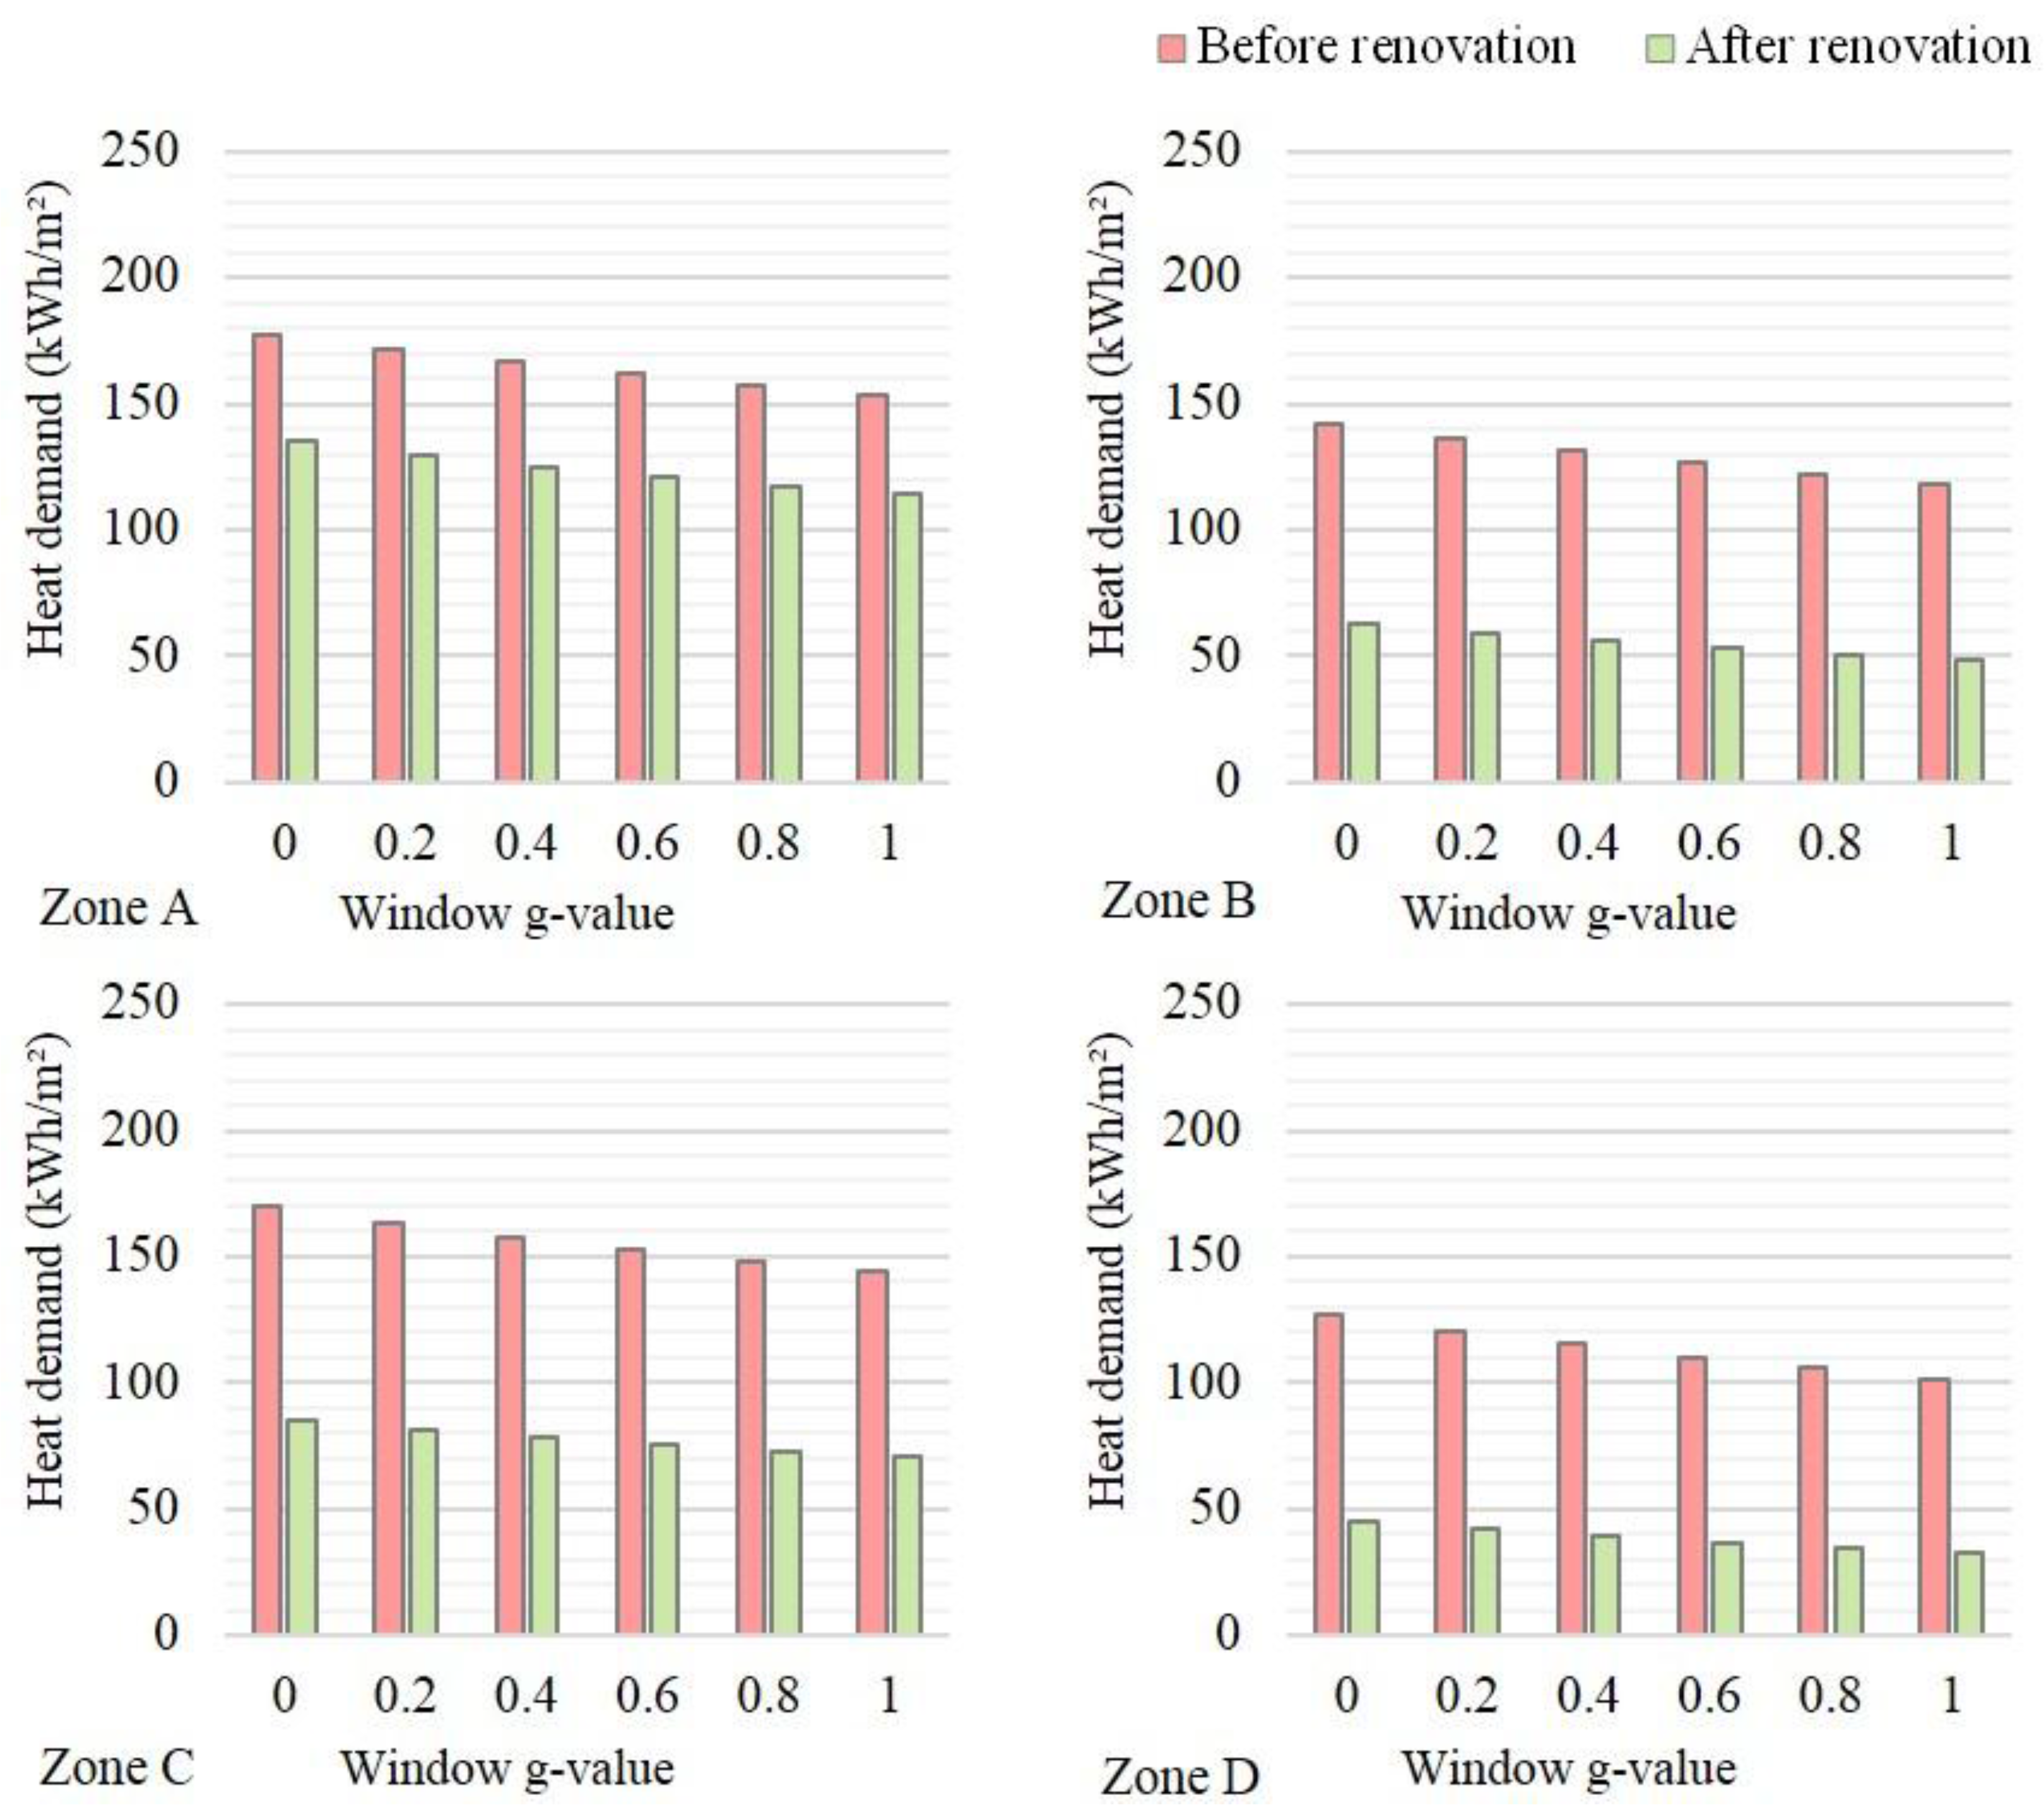
Figure 12.
Simulated thermal comfort according to standard EN-15251 with different levels of internal heat gains (appliances and occupancy).
Figure 12.
Simulated thermal comfort according to standard EN-15251 with different levels of internal heat gains (appliances and occupancy).

Figure 13.
Simulated energy use per heated floor area in the reference zone before renovation (red) and after renovation (green) with different internal heat generation. Heating after renovation includes zone heating and AHU heating.
Figure 13.
Simulated energy use per heated floor area in the reference zone before renovation (red) and after renovation (green) with different internal heat generation. Heating after renovation includes zone heating and AHU heating.


Table 1.
Thermal properties, air exchange rates and a short description of heating and ventilation systems before and after renovation. Modified from [13].
Table 1.
Thermal properties, air exchange rates and a short description of heating and ventilation systems before and after renovation. Modified from [13].
| Segment | Area | Original Construction | U-Value 1 (W/m²·K) | Renovated Construction | U-Value 1 (W/m²·K) |
|---|---|---|---|---|---|
| External walls | 569.9 m2 | 0.01 m plasterboard, 0.25 m lightweight concrete, Cladding | 0.43 | 0.01 m plasterboard 0.25 m lightweight concrete, 0.1 m mineral wool, Cladding | 0.2 |
| Windows and balcony doors | 112.1 m2 | 3-pane | 2.0 2 | 3-pane (low emissivity) | 1.1 3 |
| Bathroom windows | 5.9 m2 | 2-pane | 2.9 2 | 3-pane (low emissivity) | 1.1 3 |
| Doors 4 | 3.8 m2 | Metal with glazing | 2.5 | Oak door | 0.8 |
| Floor | 216.5 m2 | 0.2 m concrete, 0.1 m insulation Ground 5 | 0.2 | Unchanged | 0.2 |
| Ceiling towards roof | 23.1 m2 | 0.15 m concrete, 0.04 m cork Roofing tile | 0.91 | 0.15 m concrete, 0.04 m mineral wool Roofing tile | 0.71 |
| Ceiling towards attic | 194.5 m2 | 0.05 m concrete, 0.12 m mineral wool, 0.2 m concrete | 0.27 | 0.05 m concrete, 0.3 m mineral wool, 0.2 m concrete | 0.12 |
| Total | 1125.8 m2 | 0.54 | 0.29 |
1 U-values calculated in accordance with ISO 6946—Building components and building elements—Thermal resistance and thermal transmittance [20]. Values for thermal conductivity (W/mK)/density (kg/m3)/specific heat capacity (J/kg·K): lightweight concrete: 0.12/500/1050, mineral wool: 0.036/20/750, cladding: 0.8/1800/790, concrete: 1.7/2300/880, cork: 0.05/100/950. 2 2- and 3-pane clear glass (thickness 4 mm) with 50 mm air gap between panes, based on standard U-values for windows (IDA ICE version 4.6.2). 3 3-pane low emissivity glass (thickness 4 mm) with 50 mm argon filled gaps between panes. 4 Information from manufacturer. 5 Ground properties and floor U-value calculated in accordance with ISO 13370—Thermal performance of buildings—Heat transfer via the ground—Calculation methods [21].
Table 2.
Information on building location, installation, and other details before and after the renovation.
Table 2.
Information on building location, installation, and other details before and after the renovation.
| Building Information | ||
|---|---|---|
| Location (coordinates) | 58.41, 15.61 | |
| Winter design dry bulb temperature | −17.6 °C [22] | |
| Summer design dry bulb temperature | 27.3 °C [22] | |
| Building properties | Original building | Renovated building |
| Heated floor area | 1072.5 m2 | 1072.5 m2 |
| Window solar heat gain factor (g-value) | 0.68 | 0.43 |
| Space heating demand | 96.3 kWh/m2·year | 52.9 kWh/m2·year |
| Average indoor temperature during winter 1 | 19.5–19.8 °C | 21–21.2 °C |
| Central heating system | District heating | District heating |
| Room heating system (supply/return temperature) | Radiator (80/60 °C) | Radiator (60/40 °C) AHU heating coil |
| Ventilation system | Exhaust system | Supply and exhaust system |
| Ventilation air change rate | 0.82 h−1 | 0.79 h−1 |
| Heat recovery | - | 57.4% 2 |
| Building envelope permeability at −50 Pa (q50) | 0.35 L/s·m2 3 | 0.49 L/s·m2 3 |
| Windows solar gain factor (g-value) | 0.68 | 0.43 |
| Assumed losses from thermal bridges (based on “typical” loss factors in IDA ICE) | 43.2 W/K | 42.9 W/K |
1 Measured in occupied apartment during heating season before and after renovation, see [13]. 2 Measured during one month of building operation and calculated as , where Te is the exhaust air temperature (room temperature), Tce is the cooled exhaust air temperature (after the heat exchanger), To is the outside air temperature, qsupply is the supply airflow m3/s and qexhaust is the exhaust airflow m3/s, see [13]. 3 Measured with blower door method, see [13].
Table 3.
Internal heat gains, occupancy and airing used in the whole year energy simulation.
| Paremeter | Model Input Data |
|---|---|
| Electricity use | 30 kWh/m2·year, evenly distributed over the year 1 |
| Percentage of useful heat gains from electricity use | 70% 1 |
| Occupancy | 36 occupants 1 in total (activity 100 W/person), away weekdays between 8 a.m. to 17 p.m., otherwise home |
| Percentage of useful heat gains from occupants | 100% |
| Airing 2 | 2 L/s per apartment 1 |
1 Based on findings and standard values from the SVEBY program [27]. 2 Modelled as constant additional infiltration
Table 4.
Geometrical, directional and information of ACH for the studied zones.
| Zone | Floor | Floor Area | External Wall Area | Window Area | Window Directions | Mechanical Air Changes per Hour |
|---|---|---|---|---|---|---|
| A/C | 2nd/5th | 22.9 m2 | 8.4 m2 | 3.8 m2 | NNW (3.8 m2) | 1.96 1/1.62 h−1 2 |
| B/D | 2nd/5th | 101.4 m2 | 64.6 m2 | 11.6 m2 | SSE (4.3 m2) NNW (3.8 m2) WSW (3.5 m2) | 0.69 1/0.59 h−1 2 |
1 Before renovation. 2 After renovation.
Table 5.
Categorization of factors and symptoms of poor indoor environment in the questionnaire used.
Table 5.
Categorization of factors and symptoms of poor indoor environment in the questionnaire used.
| Category | Environmental Factors and Related Problems |
|---|---|
| Thermal environment | Draught 1; low room temperatures 1; high room temperatures 1/too warm during summer 2,3; varying room temperatures 1; temperature varies with outdoor temperature; cold floors during winter 2; unable to affect indoor temperature 2 |
| Indoor air quality | Stuffy air 1; dry air 1; unpleasant smells 1; static electricity 1; tobacco smoke 1; dust and dirt 1; odor when cooking 2; cooking odor from neighbors 2; odors from outside (traffic etc.) 2; condensation in bathroom 2; condensation on windows during winter 2; condensation on windows when cooking 2; problems airing due to outside noise 2; little possibility of influencing ventilation 2 |
| Noise situation | Noise from pipes and ducts 2; noise from ventilation 2; noise from neighbors 2; noise from stairwell or elevator 2; noise from outside 2 |
| Symptoms of Poor Indoor Environment | |
| Fatigue 1; feeling heavy-headed 1; headache 1; nausea/dizziness 1; difficulties concentrating 1; itching 1, burning or irritated eyes 1; irritated, stuffy, or runny nose 1; hoarse, dry throat 1; cough 1; dry or flushed facial skin 1; Itching scalp or ears 1; dry hand, itching or dry skin 1 | |
1 Possible answers: “No, never”, “Yes, sometimes”, “Yes, often”. 2 Possible answers: “No”, “Yes”. 3 Both checked in same questionnaire counted as one answer.
Table 6.
Parameters included in sensitivity analysis.
| Parameter | Variable | Range | Step |
|---|---|---|---|
| Air temperature | Temperature set point | 18–24 °C | 1 °C |
| Solar heat gains | Windows g-value | 0–1 | 0.2 |
| Internal heat gains | Appliance use and body heat 1 | 0–6 W/m2 | 1.5 W |
1 Yearly average from electricity use of 0–60 kWh/m2·year (70% assumed useful) and heat from occupancy of 0–200 W/person. See reference values in Table 3.
Table 7.
PMV, PPD, air temperatures and zone heating for winter and summer design conditions in the reference zones before and after renovation.
Table 7.
PMV, PPD, air temperatures and zone heating for winter and summer design conditions in the reference zones before and after renovation.
| Winter design day | Before Renovation | After Renovation | |||||||||
| Zone | Max PPD | Min PMV | Min Tair | Min Top | Zone Heating | Max PPD | Min PMV | Min Tair | Min Top | Zone + AHU Heating | |
| A | 35.9% | −1.2 | 19.6 °C | 19.0 °C | 38.6 kWh | 25.2% | −1.0 | 20.4 °C | 20.0 °C | 30.9 kWh | |
| B | 42.3% | −1.3 | 18.6 °C | 18.5 °C | 137.3 kWh | 21.6% | −0.9 | 20.9 °C | 20.5 °C | 86.2 kWh | |
| C | 32.1% | −1.1 | 19.9 °C | 19.4 °C | 33.8 kWh | 19.4% | −0.8 | 21.2 °C | 20.7 °C | 22.9 kWh | |
| D | 34.7% | −1.2 | 19.8 °C | 19.1 °C | 121.3 kWh | 19.8% | −0.8 | 21.3 °C | 20.7 °C | 63.6 kWh | |
| Summer design day | Before Renovation | After Renovation | |||||||||
| Zone | Max PPD | Max PMV | Max Tair | Max Top | Zone Heating | Max PPD | Max PMV | Max Tair | Max Top | Zone + AHU Heating | |
| A | 13.3% | 0.6 | 27.4 °C | 27.3 °C | 0 kWh | 14.2% | 0.7 | 27.5 °C | 24.4 °C | 0 kWh | |
| B | 26.1% | 1.0 | 28.8 °C | 28.6 °C | 0 kWh | 26.7% | 1.0 | 30.0 °C | 28.6 °C | 0 kWh | |
| C | 22.8% | 0.9 | 28.3 °C | 28.3 °C | 0 kWh | 22.3% | 0.9 | 27.3 °C | 28.3 °C | 0 kWh | |
| D | 39.9% | 1.3 | 29.6 °C | 29.4 °C | 0 kWh | 48.3% | 1.5 | 30.2 °C | 29.9 °C | 0 kWh | |
Table 8.
Overall experience with indoor environment and problems related to the indoor environment from respondents living in the building before and after the renovation.
Table 8.
Overall experience with indoor environment and problems related to the indoor environment from respondents living in the building before and after the renovation.
| Environmental factor | 22 m², Third Floor | 101 m², First Floor | ||
|---|---|---|---|---|
| Overall Experience with | Before | After | Before | After |
| Thermal environment | Good 1 | Good 1 | - 2 | Good |
| Noise | Very good | Good | Good | Acceptable |
| Air quality | Good | Very Good | Acceptable | Good |
| Experiences Problems with | Before | After | Before | After |
| Draught | Never | Never | Sometimes | Never |
| High room temperatures | Sometimes | Never | Never | Never |
| Varying room temperatures | Never | Never | Sometimes | Never |
| Low indoor temperatures | Never | Never | Sometimes | Never |
| Stuffy air | Never | Never | Never | Sometimes |
| Dry air | Never | Never | Never | Never |
| Unpleasant smells | Sometimes | Never | Sometimes | Sometimes |
| Static electricity | Never | Never | Never | Never |
| Noise | Sometimes | Never | Sometimes | Often |
| Dust and dirt | Never | Never | Sometimes | Often |
1 Experiences problem with “too warm during summer”. 2 Experiences problem with “draught; low room temperatures; temperature varies with outdoor temperature; cold floors during winter; unable to affect indoor temperature”.
© 2018 by the authors. Licensee MDPI, Basel, Switzerland. This article is an open access article distributed under the terms and conditions of the Creative Commons Attribution (CC BY) license (http://creativecommons.org/licenses/by/4.0/).
Share and Cite
MDPI and ACS Style
La Fleur, L.; Rohdin, P.; Moshfegh, B. Energy Use and Perceived Indoor Environment in a Swedish Multifamily Building before and after Major Renovation. Sustainability 2018, 10, 766. https://doi.org/10.3390/su10030766
AMA Style
La Fleur L, Rohdin P, Moshfegh B. Energy Use and Perceived Indoor Environment in a Swedish Multifamily Building before and after Major Renovation. Sustainability. 2018; 10(3):766. https://doi.org/10.3390/su10030766
Chicago/Turabian StyleLa Fleur, Lina, Patrik Rohdin, and Bahram Moshfegh. 2018. "Energy Use and Perceived Indoor Environment in a Swedish Multifamily Building before and after Major Renovation" Sustainability 10, no. 3: 766. https://doi.org/10.3390/su10030766
Note that from the first issue of 2016, this journal uses article numbers instead of page numbers. See further details here.