1. Introduction
Climate change is leading to an increase in extreme weather conditions around the world. One example is patterns of extreme rainfall. This challenges the current sewer system, not least because an increase in rain intensity of 40% to 60% will decrease the return period of flooding events [
1].
A growth in urbanization has led to an increase in the use of storage tanks, both to mitigate flooding problems and to reduce discharge to receiving media (known as CSOs, or Combined Sewer Overflows, in the case of combined sewers) [
2,
3,
4].
If detained water is carried directly back into the sewerage system, most of the settled material will remain and build up in the tank. Once established, tank sediment deposits are difficult to eliminate, even with pressure cleaning equipment. Such deposits will then take up storage capacity [
1].
By keeping the heavily polluted water retained in the tanks, receiving bodies such as rivers and beaches are protected from overflowing sediment fractions and the pollutant loads.
It is thus imperative to take care of the cleaning procedure inside the tank where the retained polluted material will be stored until comprehensive cleaning [
5,
6,
7,
8].
Washing efficiency is dependent on storm water tank design. Storm water tanks are often built out of concrete, a flexible material which may assume many forms to fit the spaces available [
1].
The goal of this study is twofold: to focus on improving the geometry on the begging of the lane and to analyze whether a self-cleaning system can work better at the starting point.
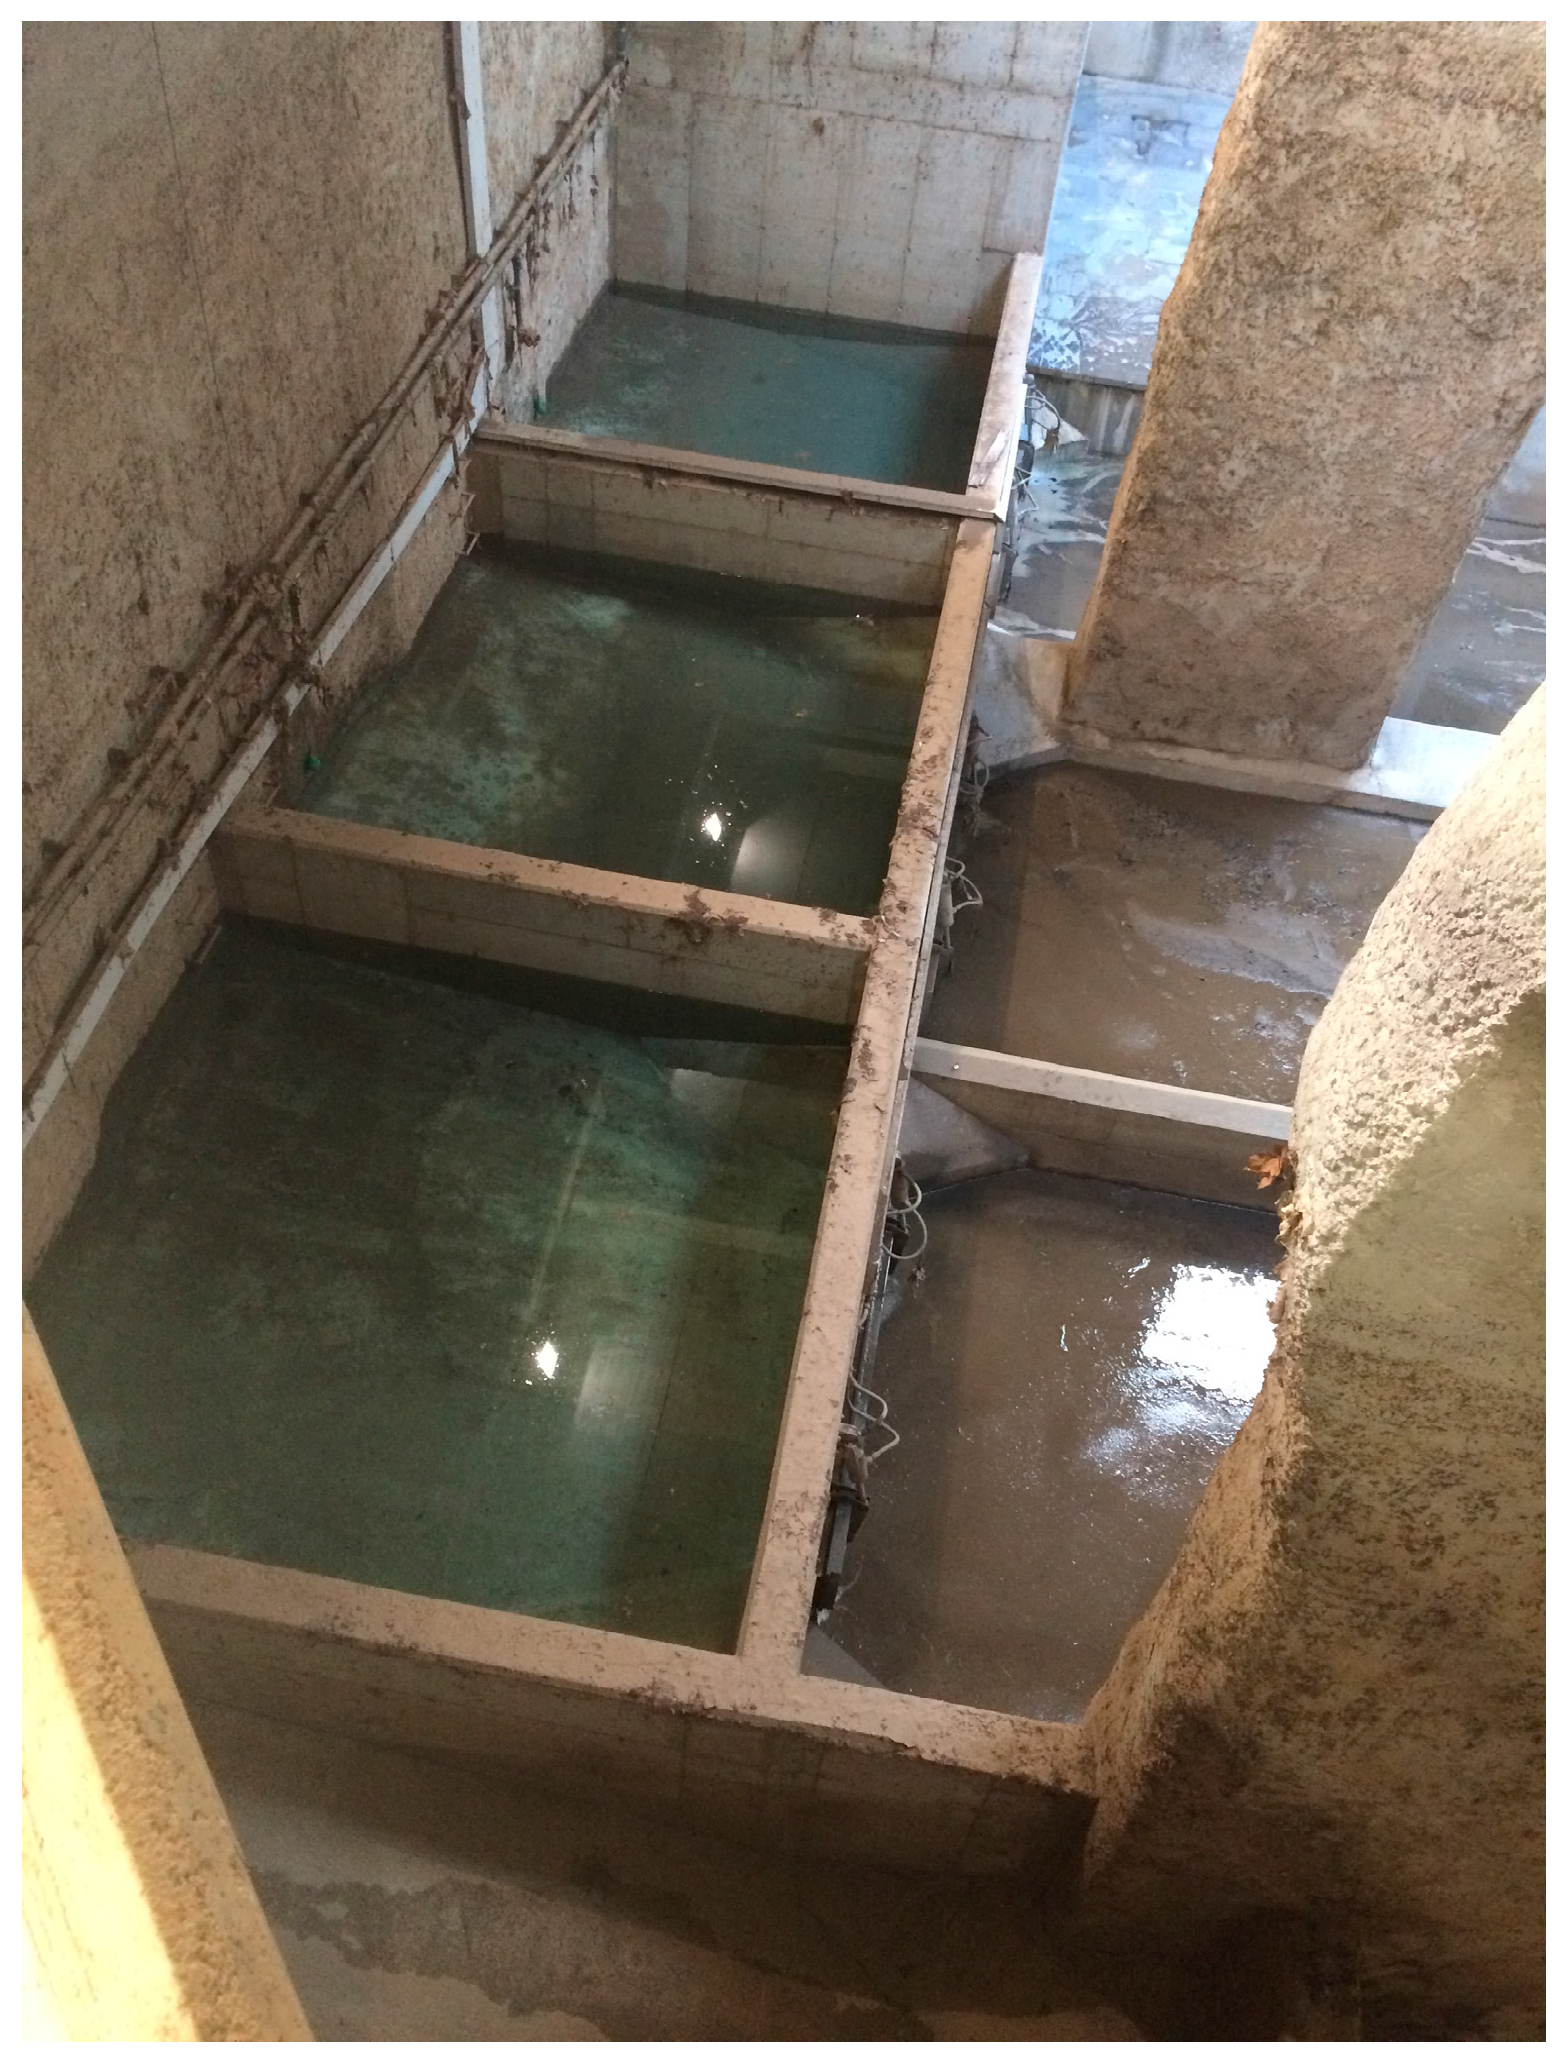
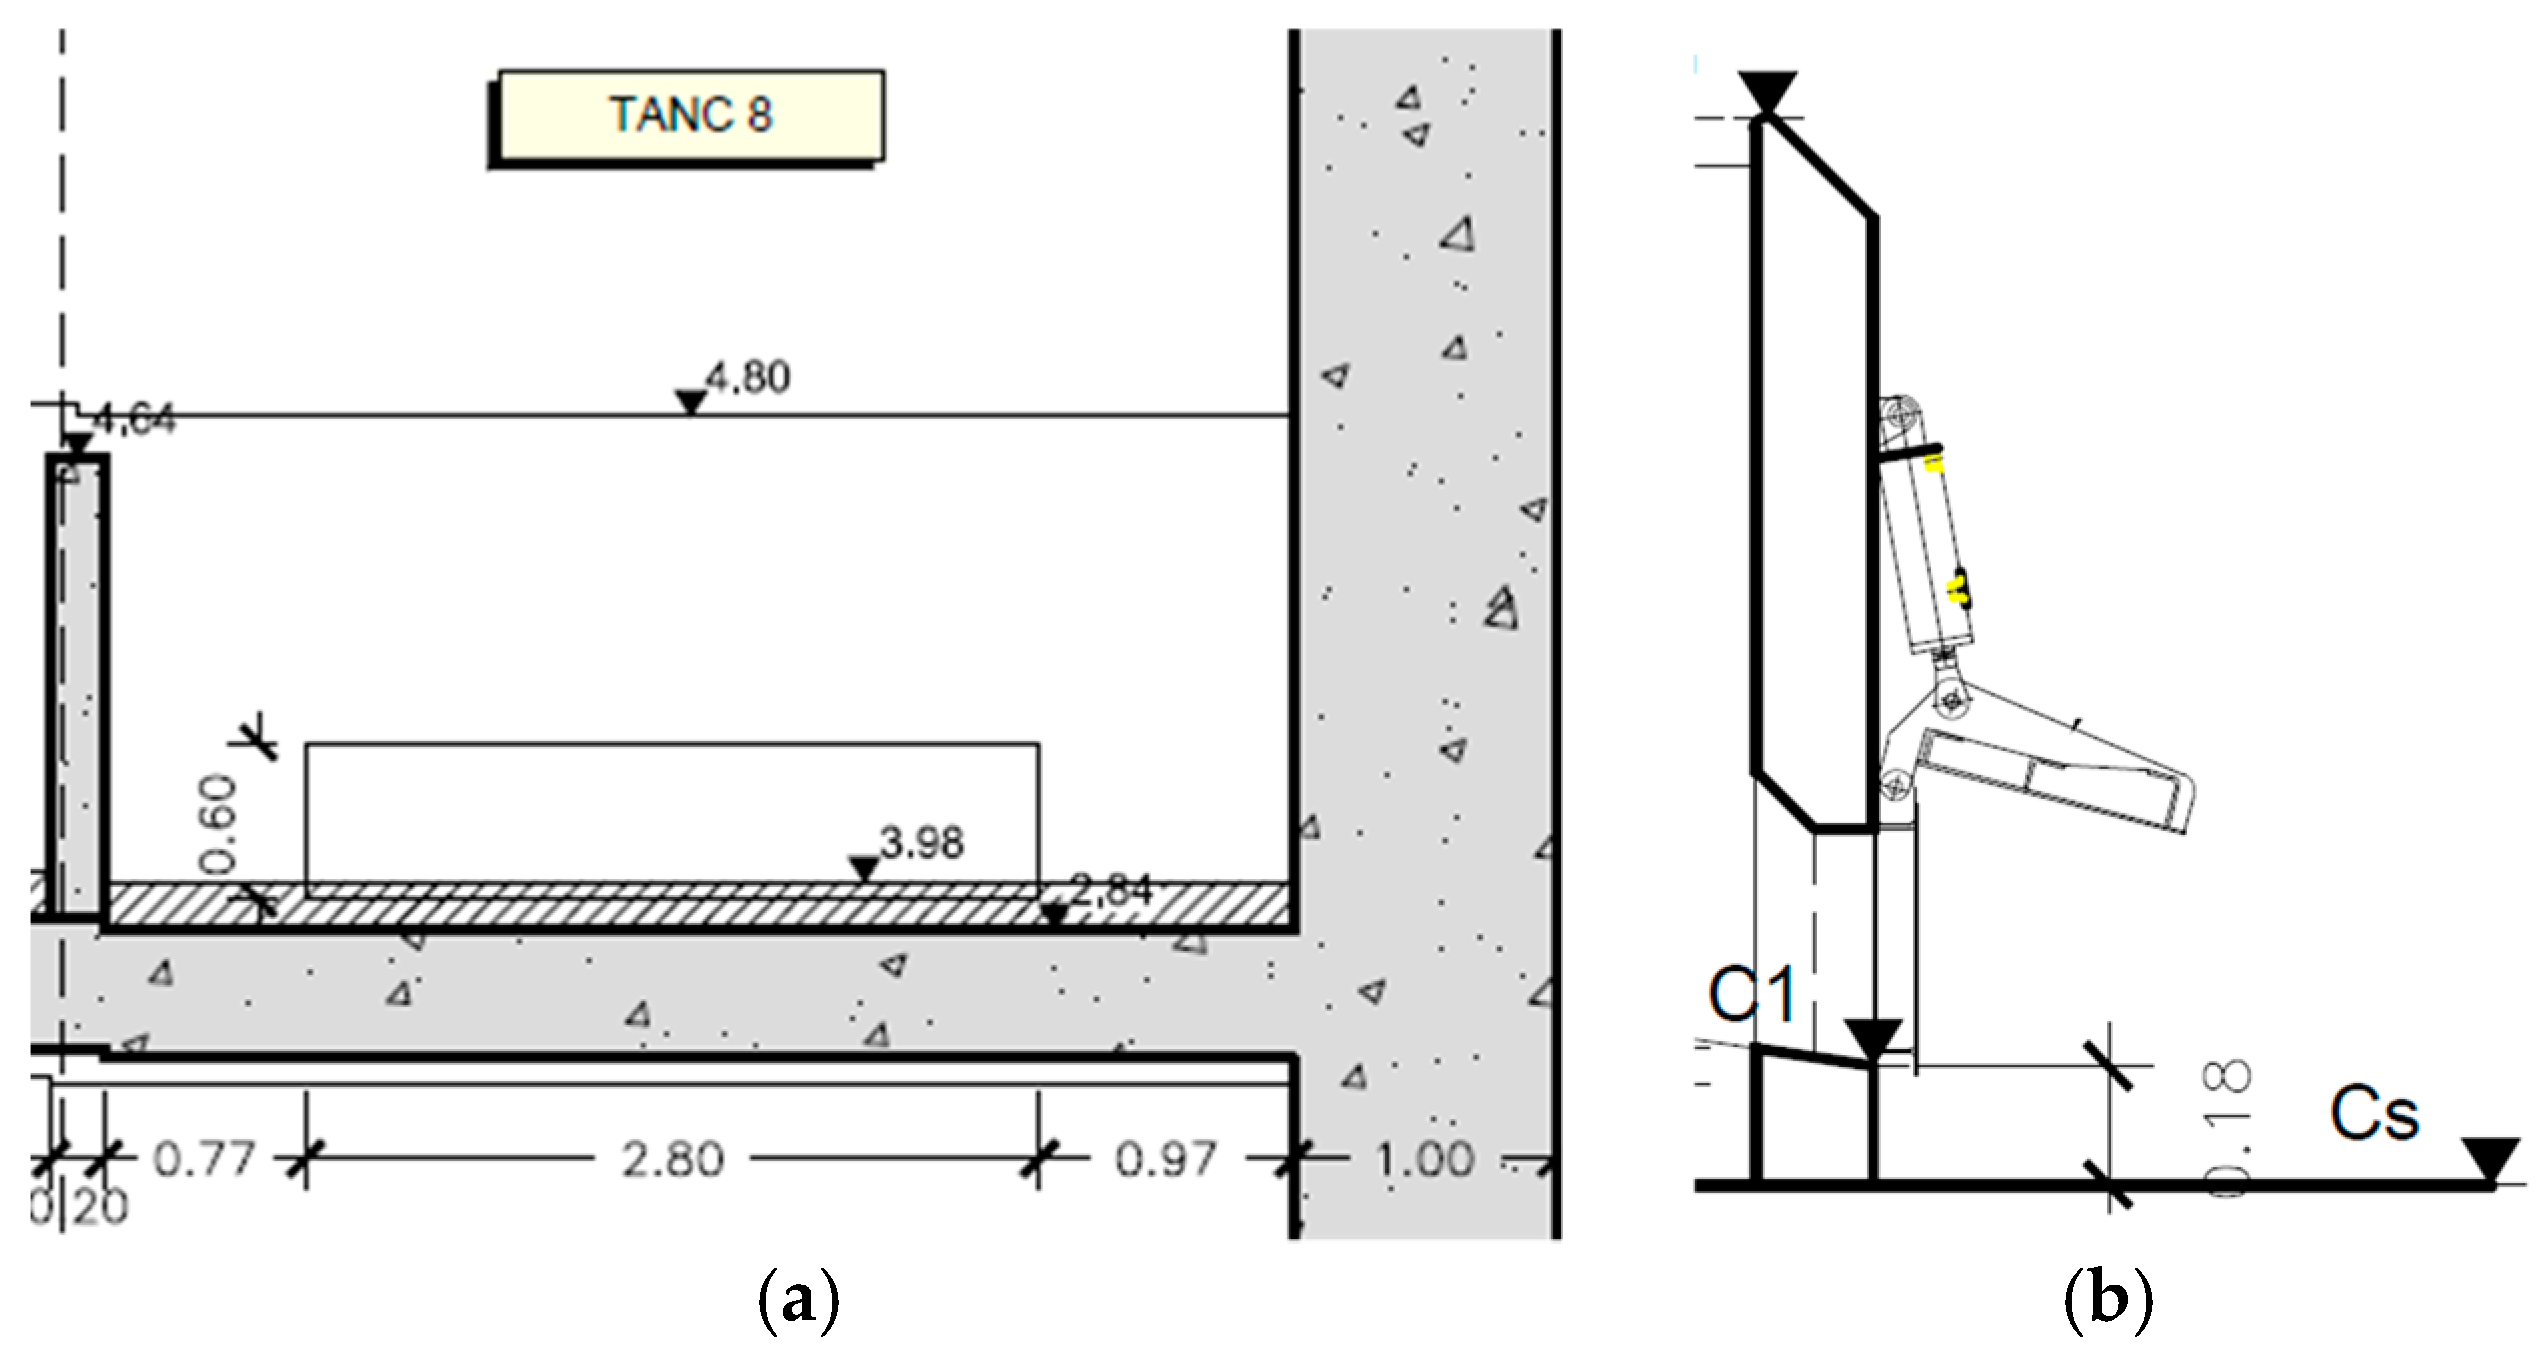
The current pilot case system consists of a flushing gate system. This mechanism tries to reproduce a dam break, in which a storage chamber is filled by clean water (
Figure 1) and a powerful flushing wave is produced to remove the sediments over the lane following a sudden opening of the flushing gate.
Some references have been found regarding the effects of flushing waves produced by flushing gates in sewer pipes on the sediment bed [
9,
10,
11,
12,
13]. This research proposed designs for passive automatic flushing systems installed in each test bed and that sewer cleaning can be carried out by flushing devices able to discharge a great volume of water during a short period of time. The results of numerical modeling for sediment flushing in a combined sewer reach are herein presented.
Some of these studies produced research results that could be used to better understand and design storm tanks cleaning systems based on flashing waves in flushing lanes. Other studies were concerned with the characterization of self-cleaning conditions in sewers and aimed to develop sewer design guidelines. Pisano et al. (1998) and Campisano et al. (2008) emphasize how theoretical studies generally fail to consider particle cohesion, a factor which can significantly impact the energy required for sediment mobilization [
14,
15]. They also underline the need to calculate minimum flow velocity or bed shear stress for each pipe to assess the sewer’s self-cleaning.
2D modelling has thus been undertaken to study the influence of lane width where the storage chamber and flushing gate have fixed conditions or dimensions. Testing was done using multiple simulations to avoid sediment problems that could not be cleaned by the automatic system of the flushing gate system. It was undertaken in the “La Estrella” detention tank in Badalona, a metropolitan area of Barcelona. After analyzing the hydrodynamics behavior of the flushing wave, a new geometrical improvement of the current scenario has been proposed to achieve better cleaning results and to minimize maintenance costs when manual cleaning is required. That also implies a human risk because these infrastructures are confined spaces.
2. Theoretical Background
2.1. Mathematical Equations
To describe the behavior of the fluid over the lane in the pilot retention tank, 2D Shallow Water Equations (2D-SWE) have been used. Based on conservation of mass and momentum laws, 2D Saint-Venant equations have been derived. Particularizing to a Newtonian and isotropic fluid and describing the average variables in short-time increments while considering turbulent fluctuation, Navier-Stokes equations are specified in the Reynolds equations.
The Reynolds Averaged Navier-Stokes (RANS) equations are deducted by applying mass and momentum conservation. A two-dimensional expression could be reached integrating the vertical dimension. The most predominant directions are shown in the following equations:
where
u1 and
u2 are velocity components integrated with depth;
x1 and
x2 are studied plain directions;
h is water depth; and
S0,
Sf are the bed slopes in the studied directions.
Local acceleration of Saint-Venant is shown in Equation (4).
These factors describe in a fixed point the variation in time. Convective acceleration is shown in Equation (5).
Transport with the flux as a velocity gradient is represented in the last terms. The higher the Reynolds number, the more significant these factors become due to inertial and viscosity forces.
2.2. Numerical Software for the Analysis
IBER, developed by the Water and Environmental Engineering Group, GEAMA (University of A Coruña), the Flumen research Institute (Technical University of Catalonia, UPC, and International Centre for Numerical Methods in Engineering, CIMNE), was selected as the numerical software to test simulations in the retention tank. IBER’s ranges of application cover river hydrodynamics, dam-break simulation, flood zones evaluation, sediment transport calculation, and wave flow in estuaries [
16].
IBER contains 3 different computational modules, including hydrodynamic, turbulence, and a sediment transport module (the two last modules were not used in the present essay). Saint-Venant equations will be solved in a finite volume of structured or non-structured mesh (according to the user’s choice) formed by triangular or quadrilateral elements.
3. Materials and Methods
3.1. Description of the Case Study
The La Estrella storm tank is in Badalona, a municipality to the immediate north east of Barcelona in Catalonia, Spain. Its total storage volume is 30.000 m
3 and the main purpose of the tank is to avoid flooding and reduce CSO problems surrounding Badalona beach. It has 12 lanes all of different lengths due to its irregular layout shape (
Figure 2). The average width of each lane is 5 m, while the longitudinal slope is 1%.
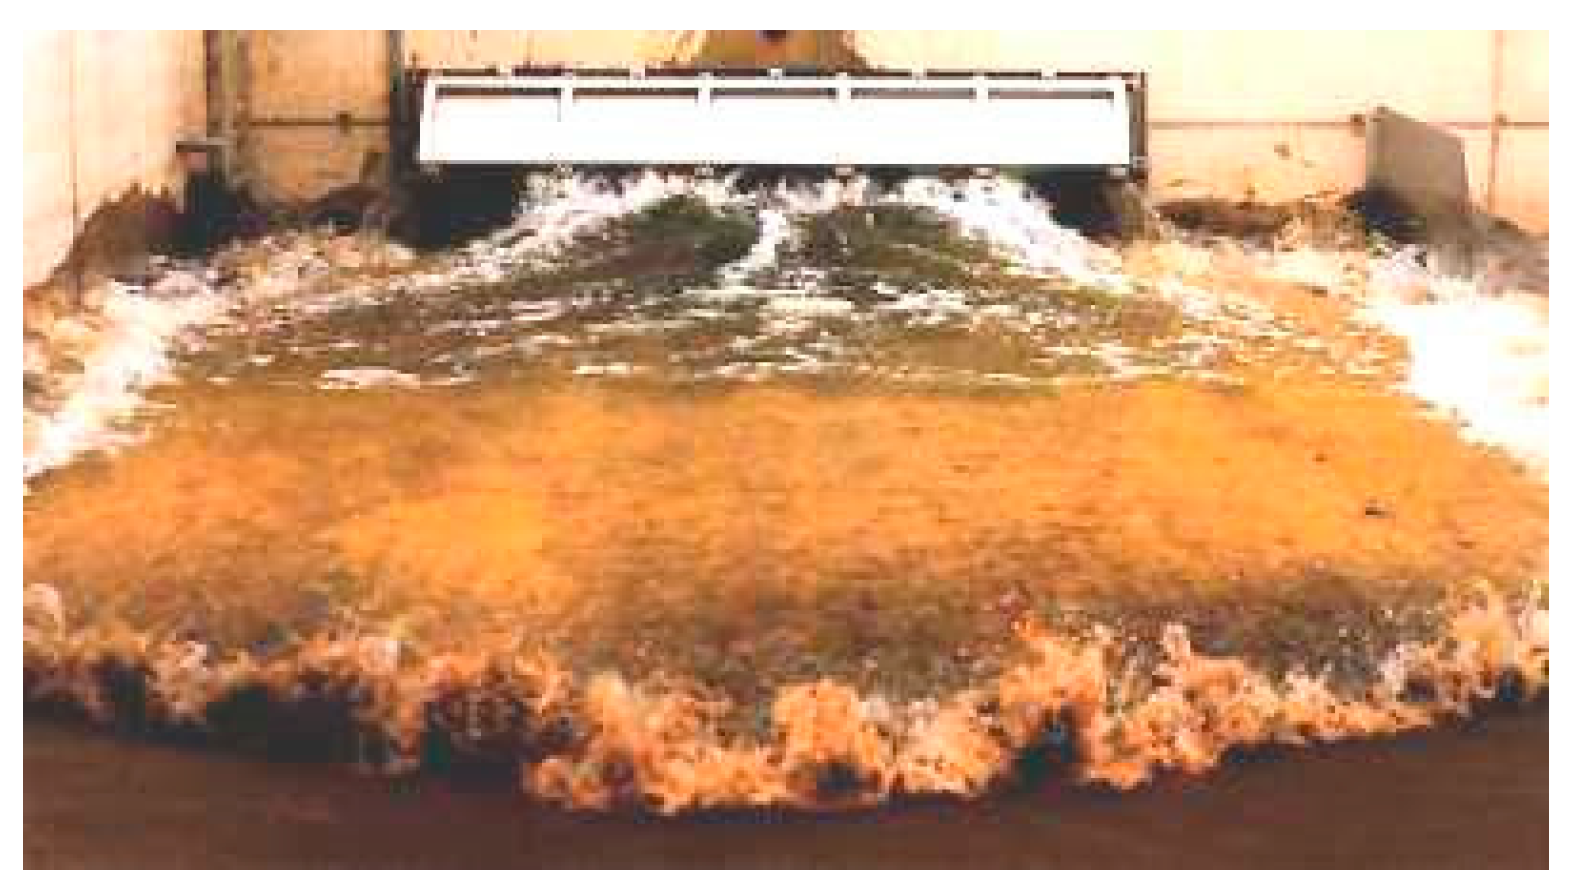
The pilot tank’s self-cleaning system consists of a flushing gate system in which a first storage chamber is filled with clean water. A powerful flushing wave produced by the opening of the flushing gate then starts to clean the lane. In
Figure 3, a flushing gate is shown at the beginning of the cleaning process.
3.2. Hydraulic and Sediment Modelling
3.2.1. IBER General Description
IBER is a public domain software developed at the Technical University of Catalonia (UPC), in Barcelona, by the Flumen Research Institute and it was used to make a 2D hydraulic analysis. IBER’s code is a full 2D hydrodynamic code including sediment transport capabilities (bed load and suspended load) [
17].
The Hydrodynamic module is based on the 2D full Saint Venant equations, incorporating an explicit finite volume scheme on structured or unstructured meshes (triangular or quadrilateral). It thus solves all types of flows, including turbulent effects and bed evolution caused by sediment transport. IBER has a user-friendly interface for pre-and post-processing, and it has been verified and validated via analytical solutions, other models, laboratory testing, and field measurements. It is the model used by the Spanish water administration for flood risk analysis.
3.2.2. Model Setup and Hydraulic Modelling
The most important geometrical elements to study recirculation in the first meters of the lane are the storage chamber upstream of the gate, the location and dimensions of the gate, and the first meters of the lane itself. It is important to highlight, as shown in
Figure 4, that the flushing gate is not fully symmetrical in the La Estrella retention tank, and this aspect was taken into consideration during the simulation process.
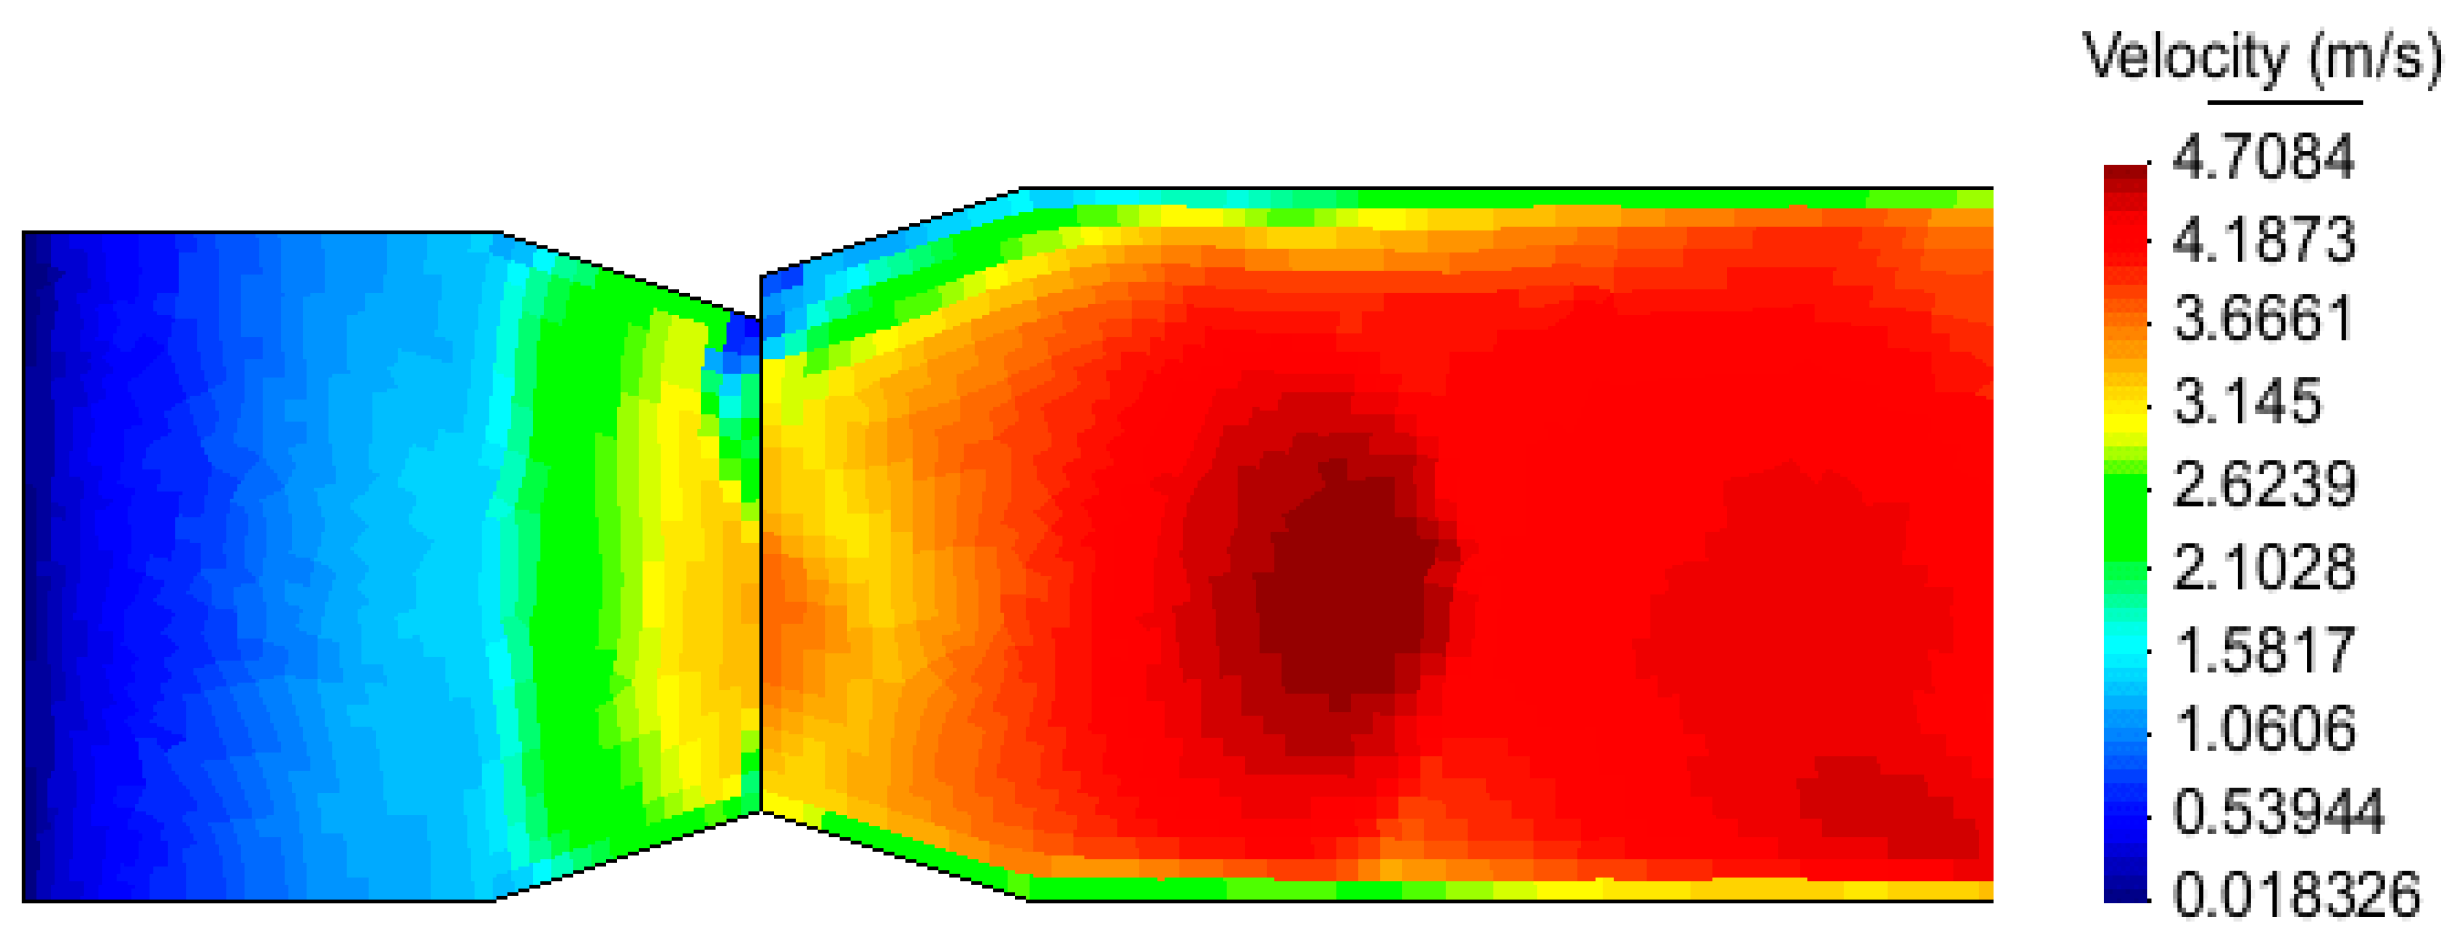
Hydrodynamics simulations were carried out with the current geometry [
18]. Analyzing the maximum velocities after a flushing event, it was clear that the highest velocities occur in the middle of the lane. Lower velocities occur regarding the side walls. Values reach their lowest results (below 1 m/s) in the left corner of the lane. This was anticipated, due to the non-symmetric location of the flushing gate (
Figure 5).
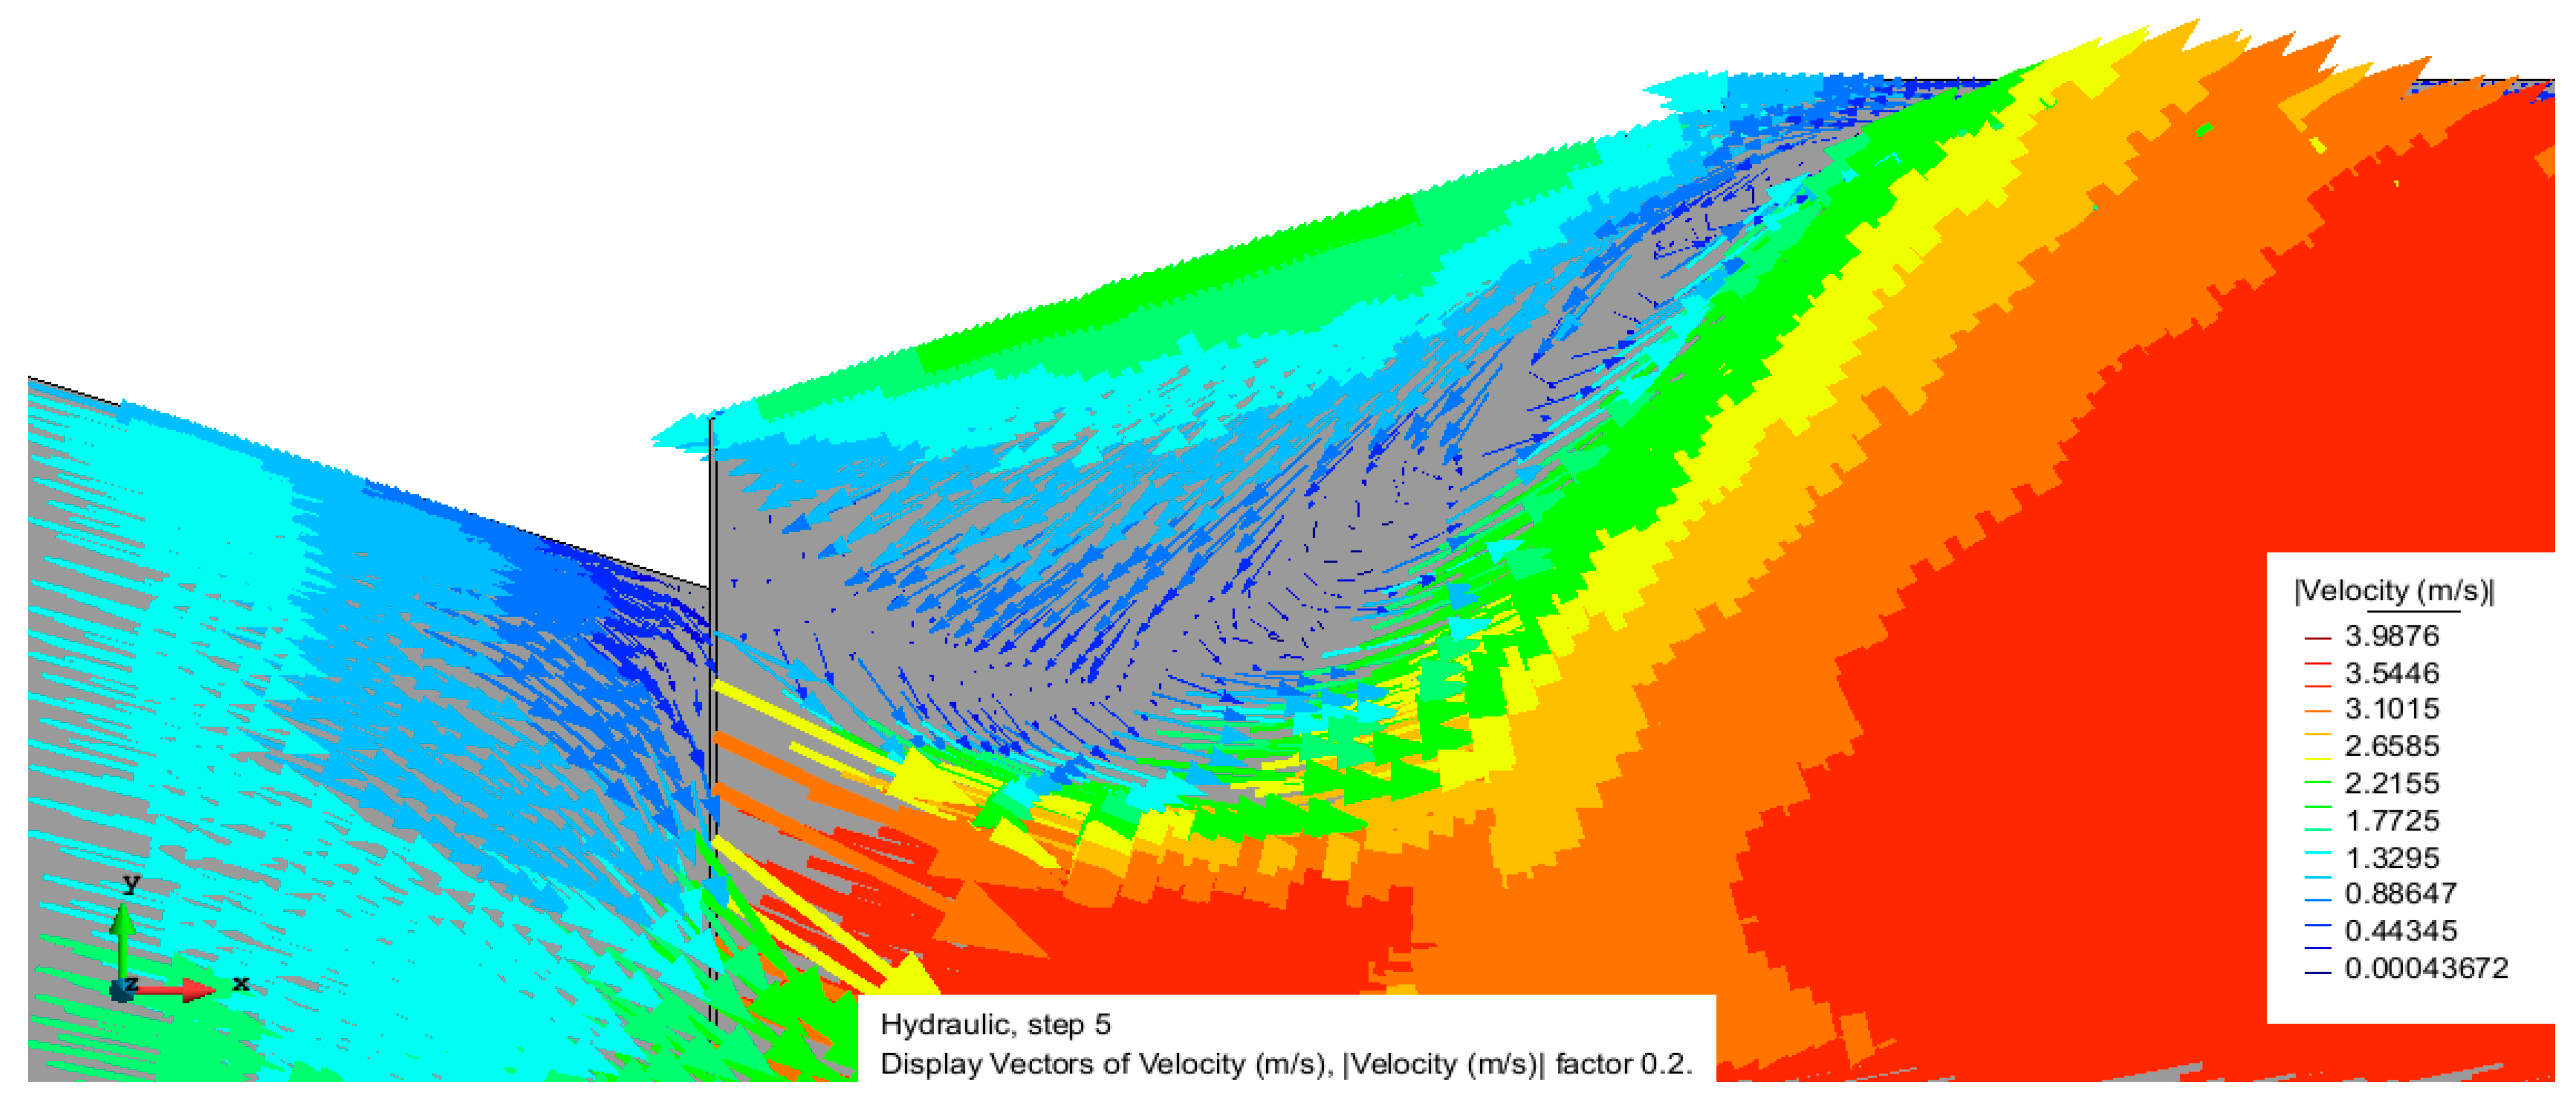
As a result, a more detailed study of the corners was undertaken, and the recirculation areas have been detected analyzing the vector directions of the velocity (
Figure 6). These vectors clearly show how, in these recirculation areas, velocity has opposite direction from the flow direction. These changes in water direction cause swirls in the recirculation areas that imply energy dissipation and problems in terms of the cleaning process.
Using the software, critical bed shear stresses are also calculated to analyze which areas could be critical in terms of sediment transport.
In
Figure 7, areas with shear stresses below the critical value of 2 N/m
2 (suggested by Ashley and Cabtree, 1992 [
19]) are shown. This area corresponds with the sides of the lane, where the recirculation phenomenon has been detected. These bed shear stress values indicate erosion difficulties.
4. Suggestion of New Geometries
4.1. Testing Different Geometries
To study how the width of the lane affects this recirculation phenomenon, the current geometry (scenario 1) of the lane has been compared with two different scenarios. On the one hand, a larger section in width has been tested (scenario 2), and on the other hand, a thinner lane, configured to have the same width as the flushing gate (scenario 3) has been tested to study two opposite scenarios.
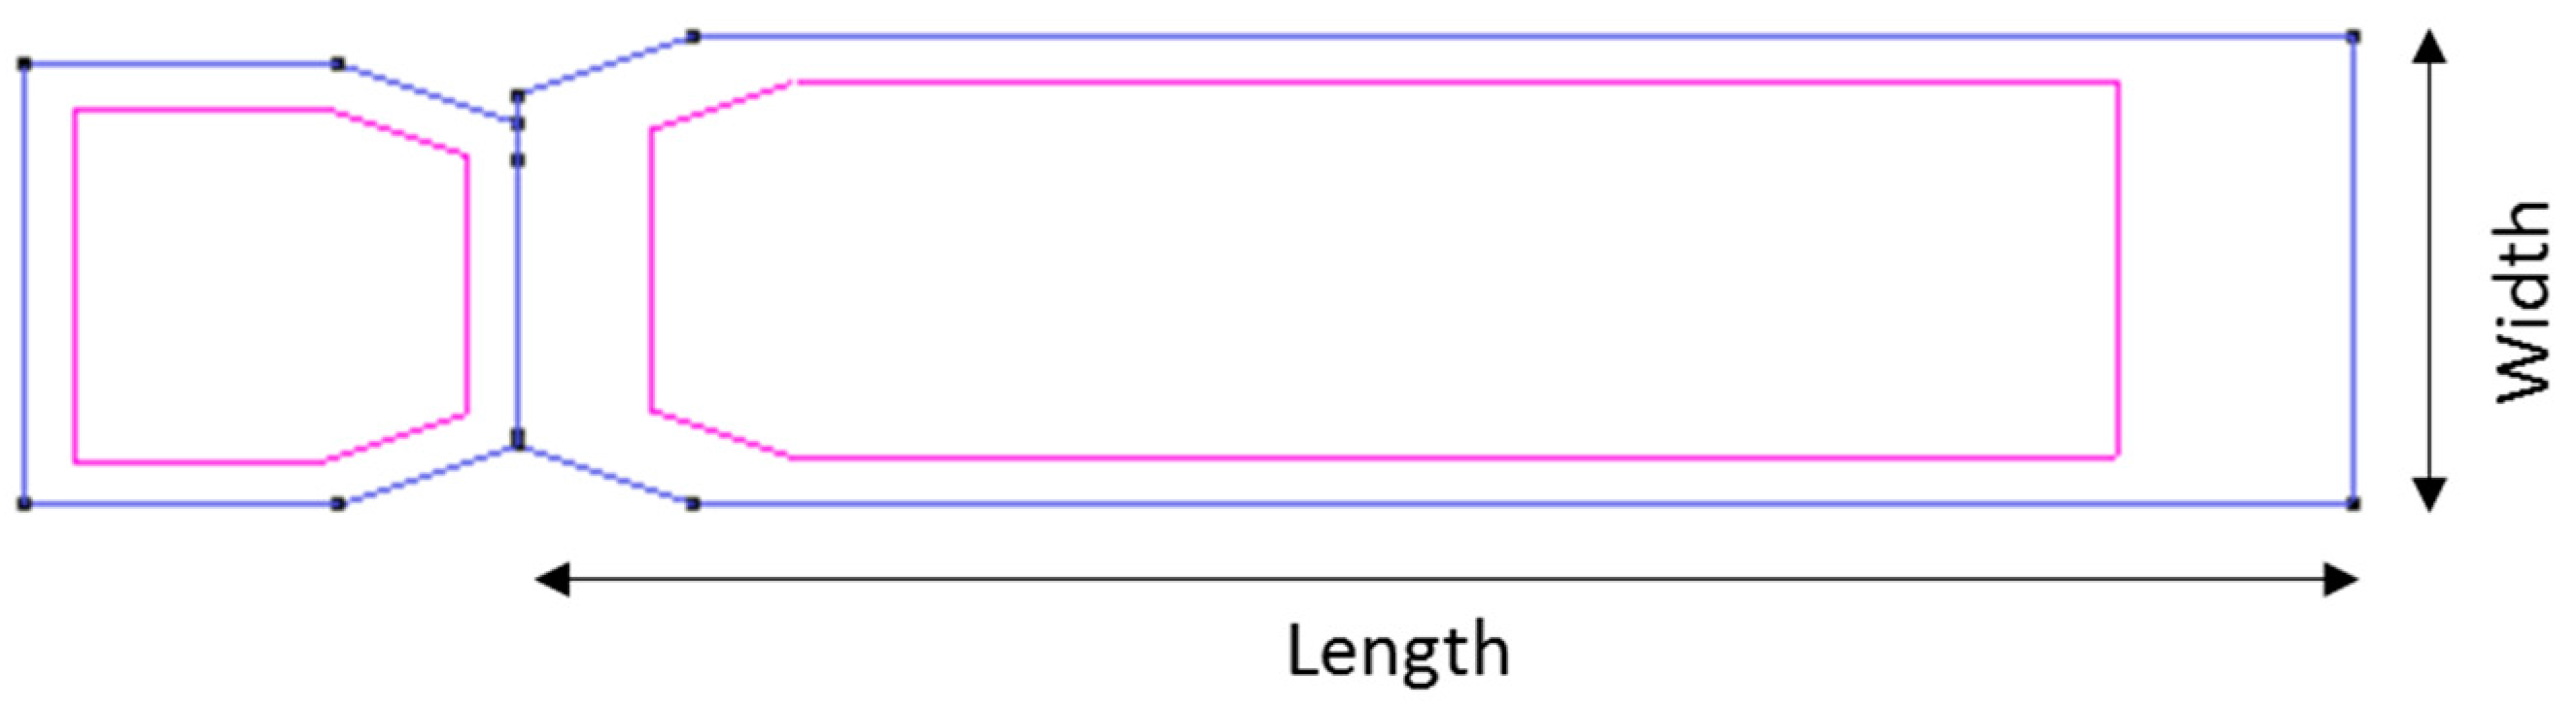
Lane length has been reduced from 55 m to 19 m to decrease the computational numerical cost, to define a more detailed mesh over the lane, and to obtain the more defined results necessary for a proper study of the recirculation phenomenon. The current geometry of the lane is about 4.8 m in width. The gate is not located in a symmetric position and has a width of 2.8 m.
The Manning coefficient used on all surfaces is 0.015 since lanes and walls are concrete. A plane view of the pilot retention tank lane is shown in
Figure 8. Where the blue color represents the defined lines in the model to create the different surfaces (purple line) where the mesh is defined.
Table 1 shows the characteristics of the selected scenarios:
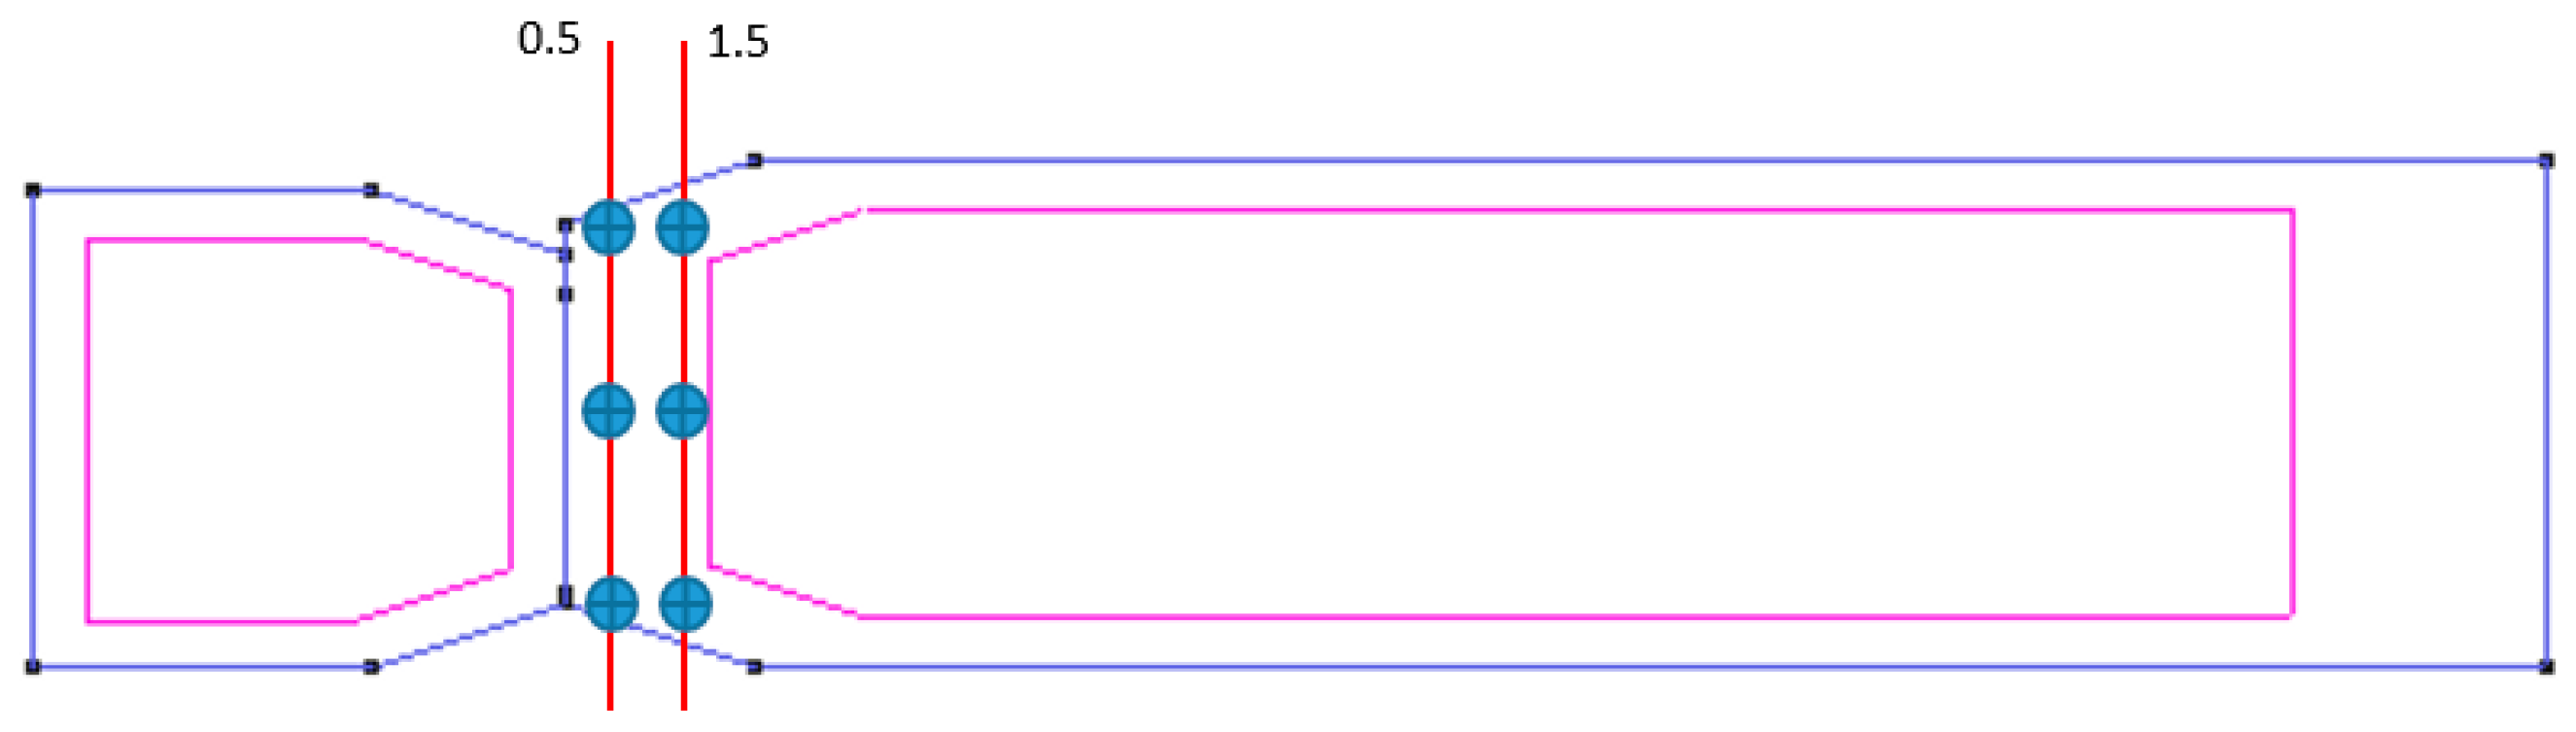
A simulation with the same initial conditions was undertaken to compare the scenarios, and velocity evolution in 6 lane points of each structure was studied. The selected points were 0.5 and 1.5 m in front of the flushing gate, in the middle of the lane, and touching the left and right side walls. The selected measuring points are shown in
Figure 9 (blue dots).
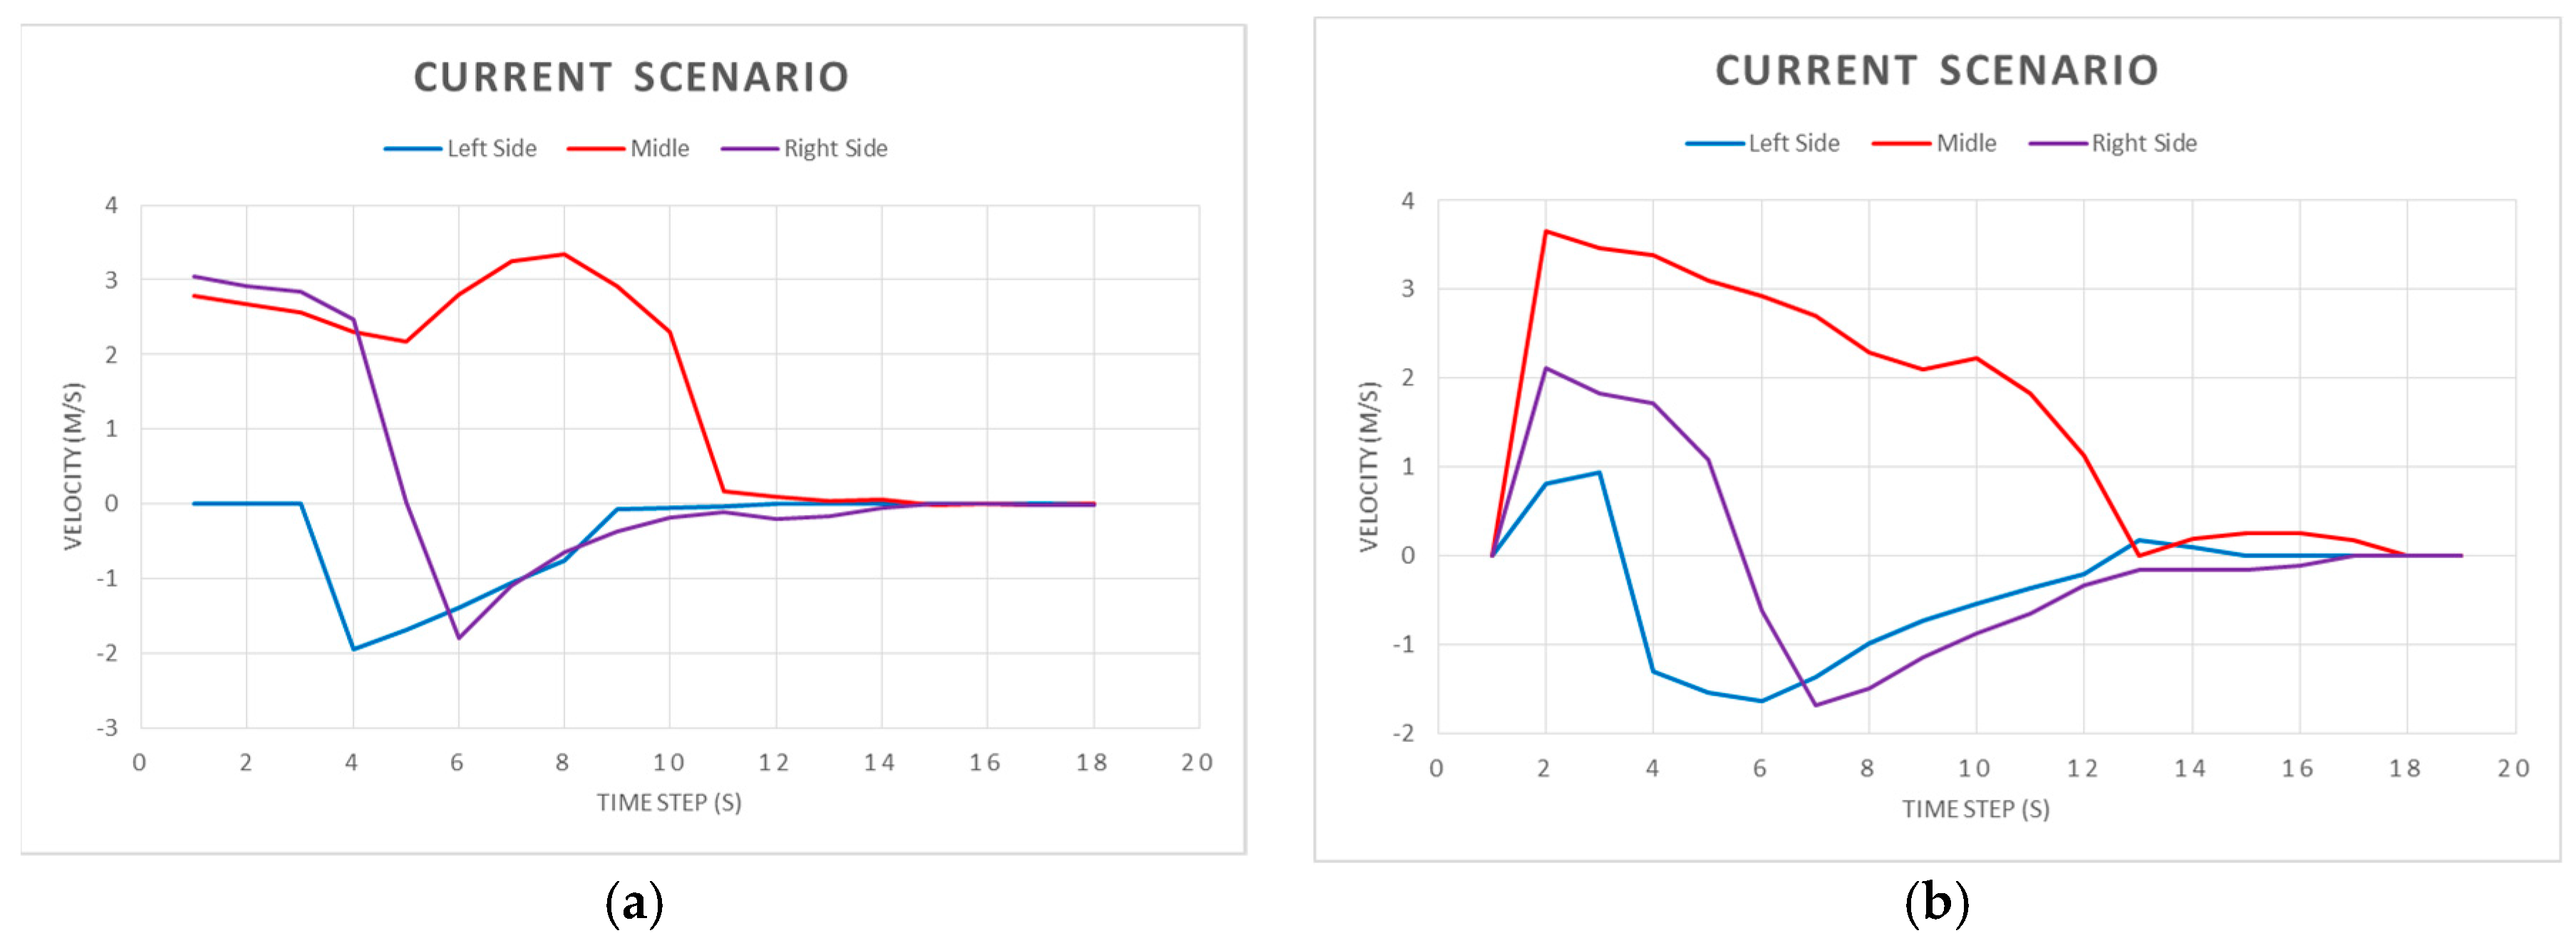
In the current scenario, the highest velocities reached were in the middle of the lane. At the sides it was clear that velocities are lower, even taking on negatives values (due to the recirculation phenomenon). The most problematic side proved to be on the left and this was due to the non-symmetry of the flushing gate location.
Evaluation of velocity in the
x direction of selected scenarios is presented below.
Figure 10 demonstrates that sedimentation occurs in recirculation areas where velocity is in the opposite direction to flow.
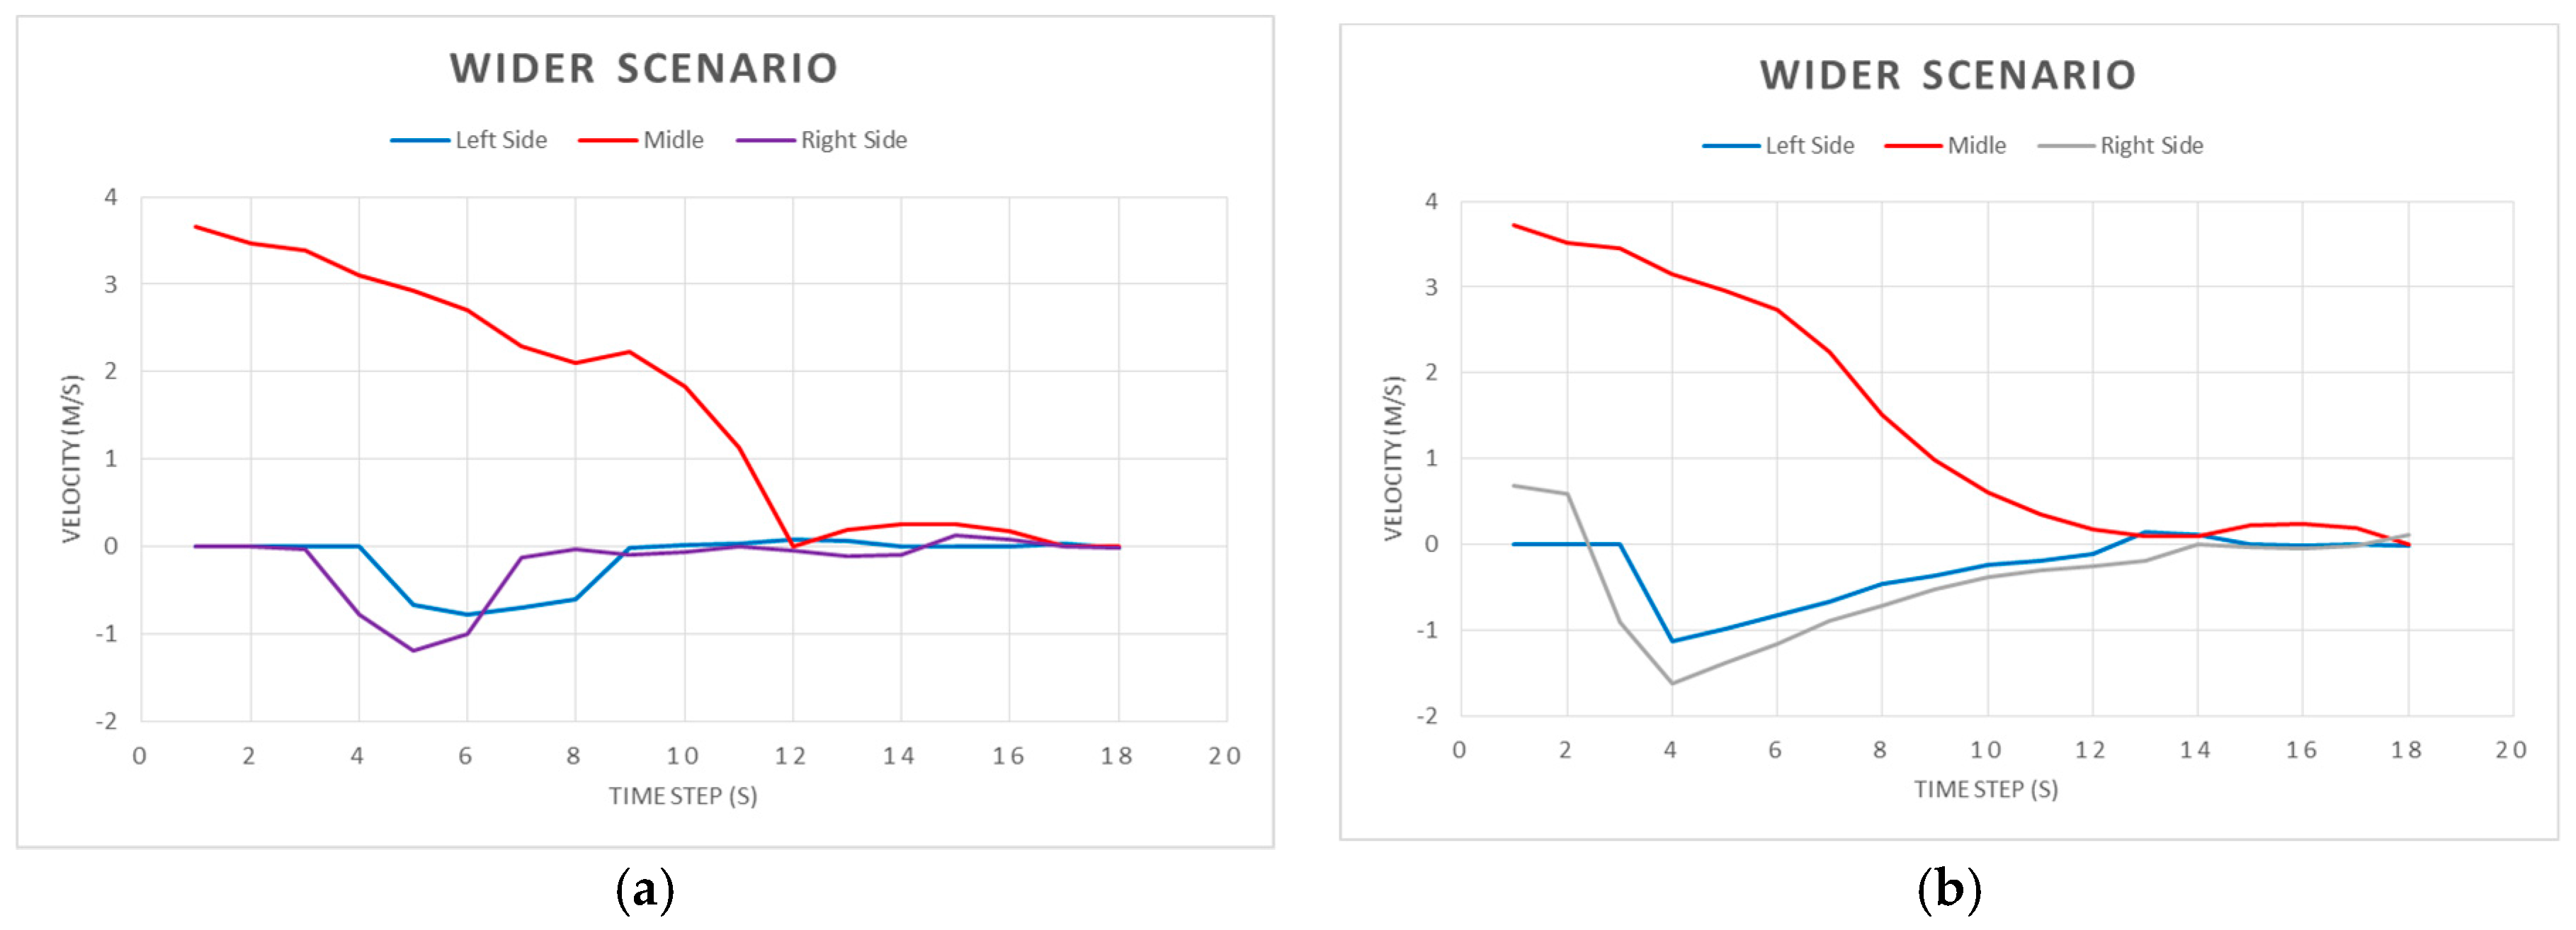
Evaluation of velocity in the
x direction of a wider scenario is shown in
Figure 11. Where lane width is increased, velocity vector is always opposite to flow direction when water reaches the wall sides. As was expected, using this kind of geometry increases the recirculation areas. Moreover, material will be accumulated in front of the flushing gate due to constant negative velocities.
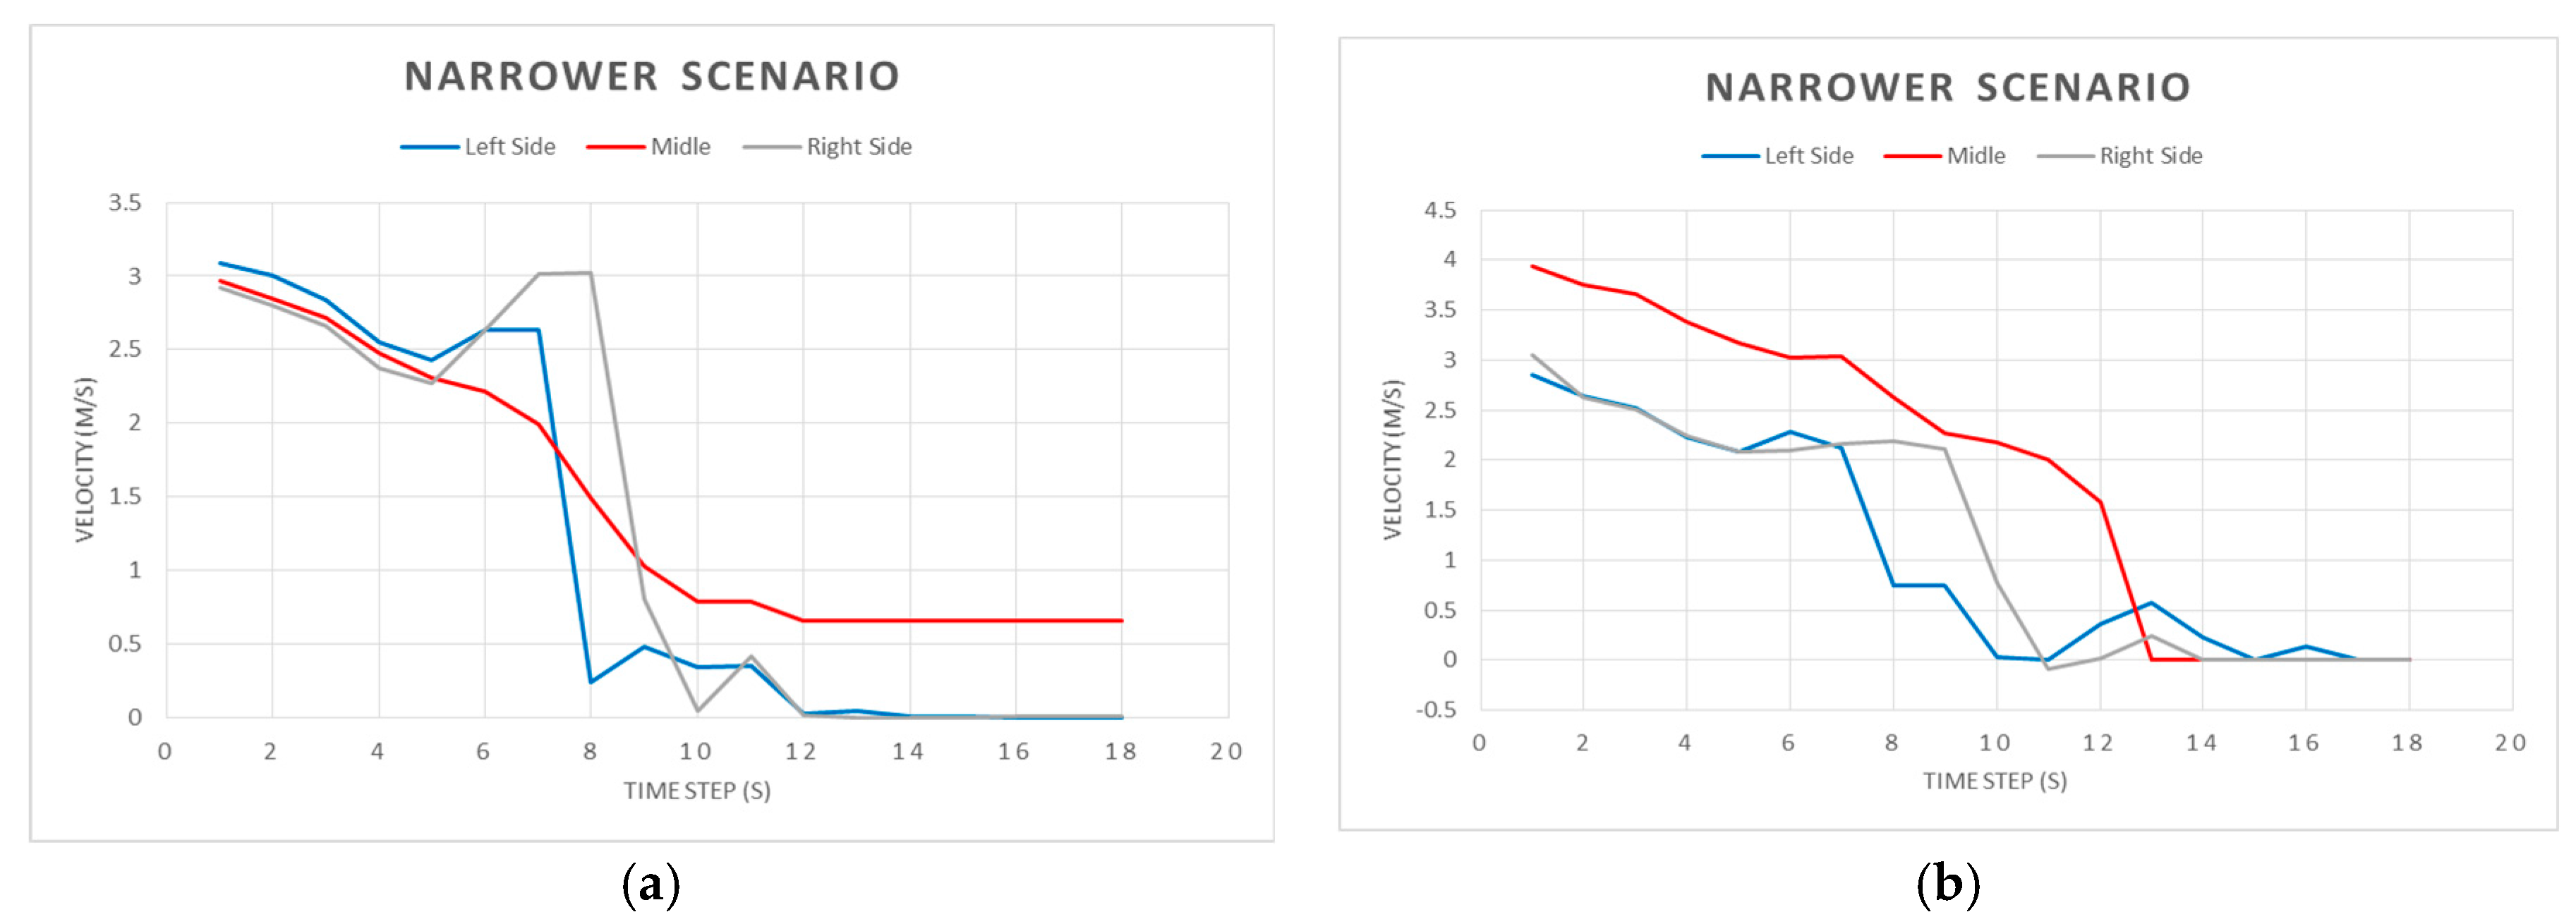
Finally, results obtained in the narrower scenario (
Figure 12) demonstrate higher sides velocities than in the other scenarios. Furthermore, behavior is more homogenous in the width of the lane, which implies it is the most efficient flushing wave for the cleaning system. Velocities were higher than 2 m/s for more than 8 s in all lanes. This is higher that the velocity recommended to ensure self-cleaning in sewers. Furthermore, no negative velocities appear in the
x direction, which means no recirculation phenomena occurs using this geometry.
4.2. Modelling of the Proposed Geometry
Recirculation phenomenon basically occurs on the wall sides. It is important to focus on the lost energy caused by recirculation to prevent deposition of material in these areas. Testing various geometries reveals that a lane of the same width as the flushing gate works better in producing a homogenous flushing wave than lanes with no recirculation areas.
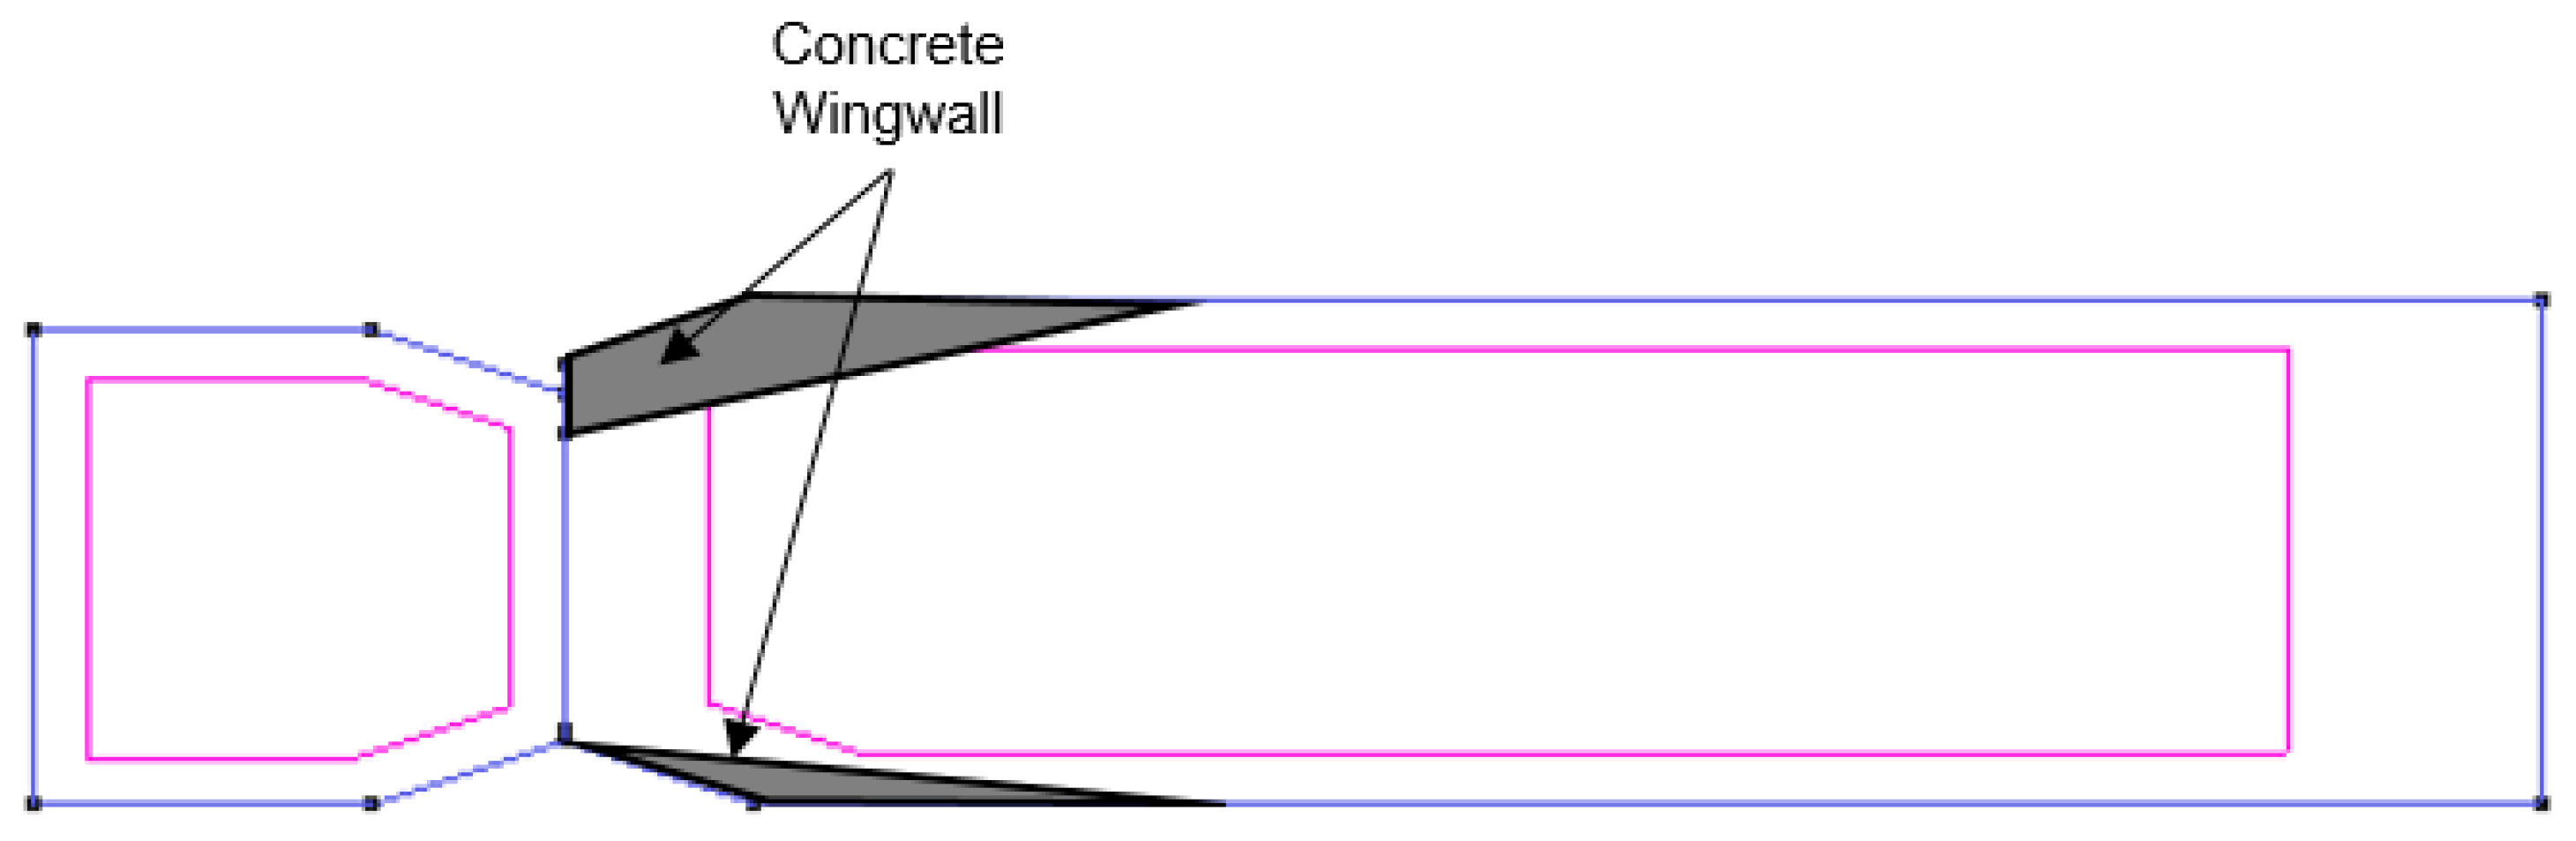
For this reason, the proposed geometry for the Badalona storm tank fills the recirculation areas with a concrete slope or wingwall to progressively drive the energy wave from the gate width toward the lane width. In view of the tested geometries’ obtained results, a narrow width at the beginning of the lane which progressively drives the flow to the end of the recirculation zone is the proposed geometry (
Figure 13).
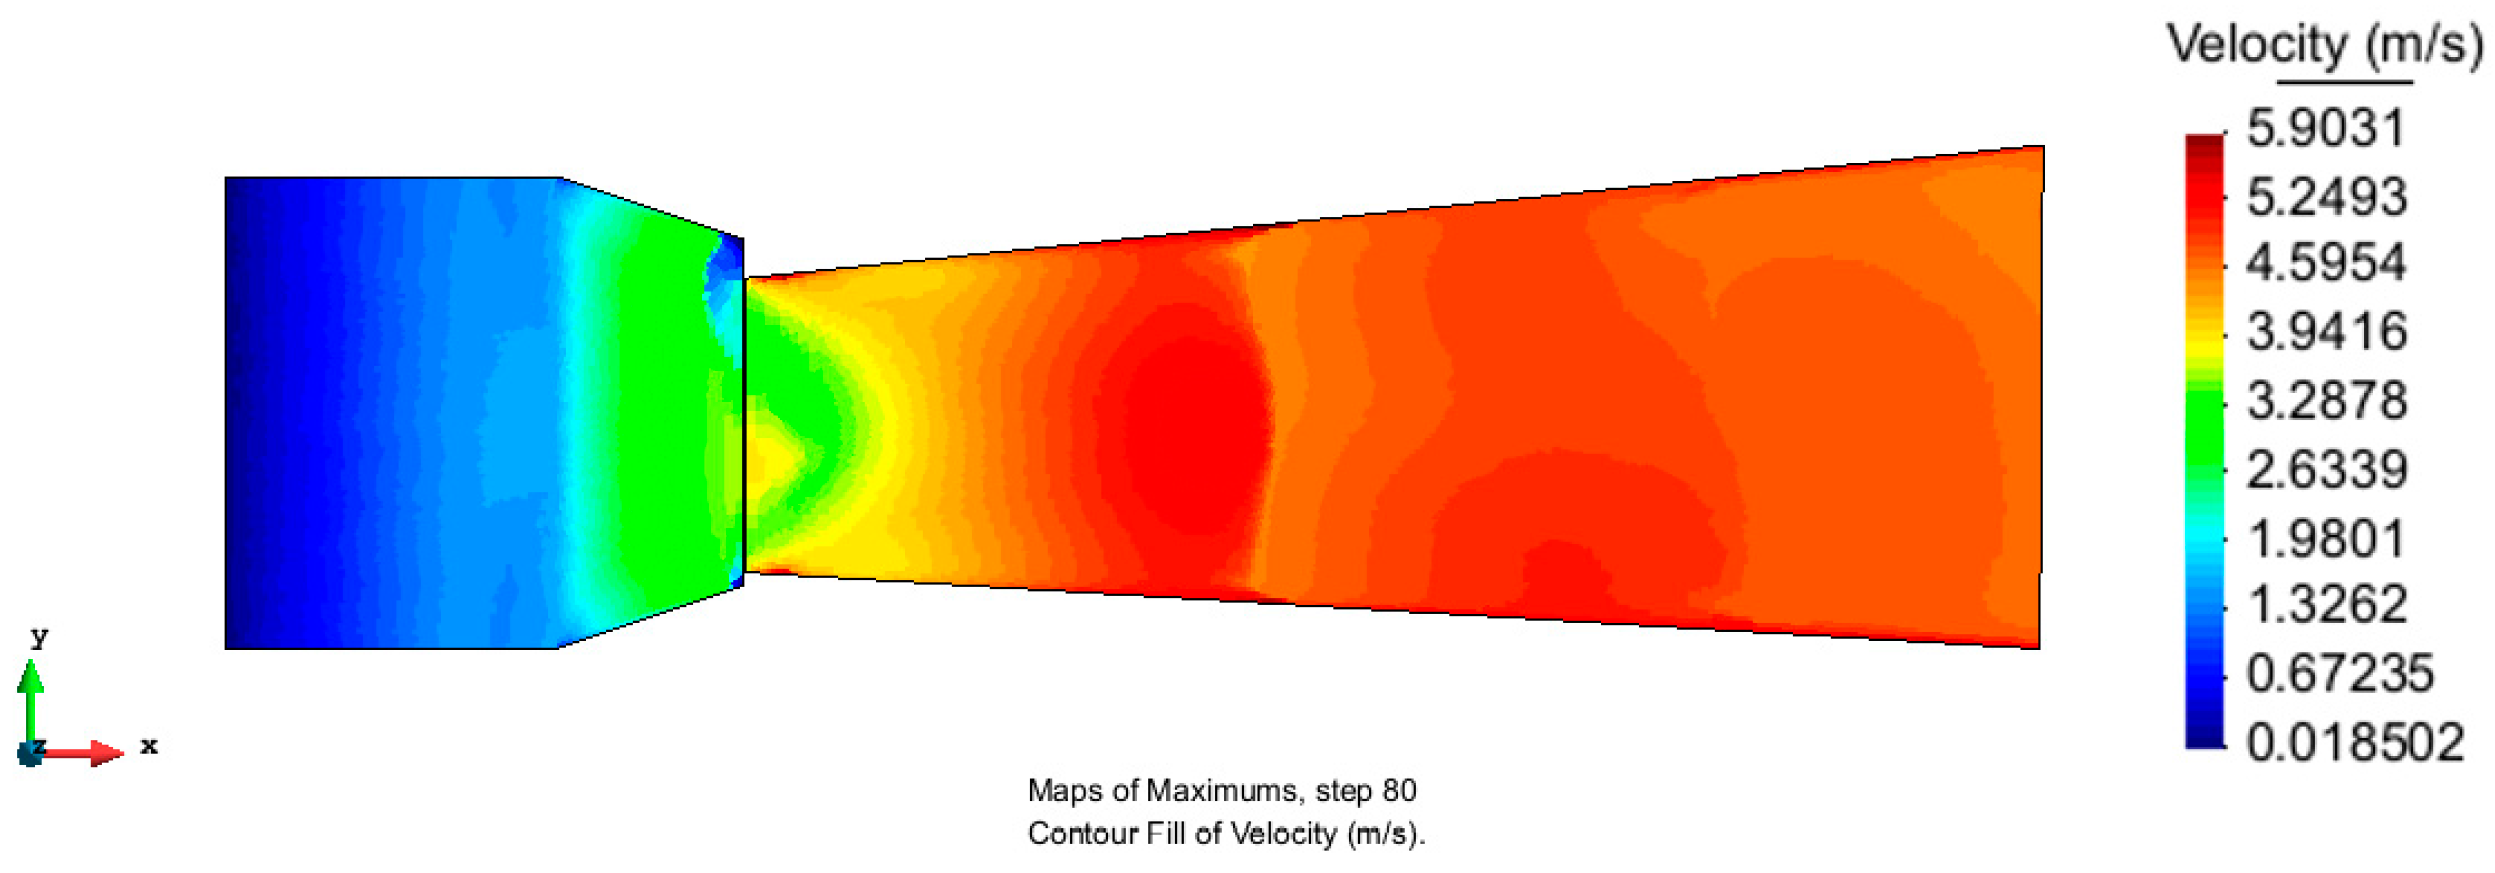
In
Figure 14, lane maximum velocities are represented with the proposed velocity. The maximum velocity is 1.25 times higher than the scenario tested using the current geometry.
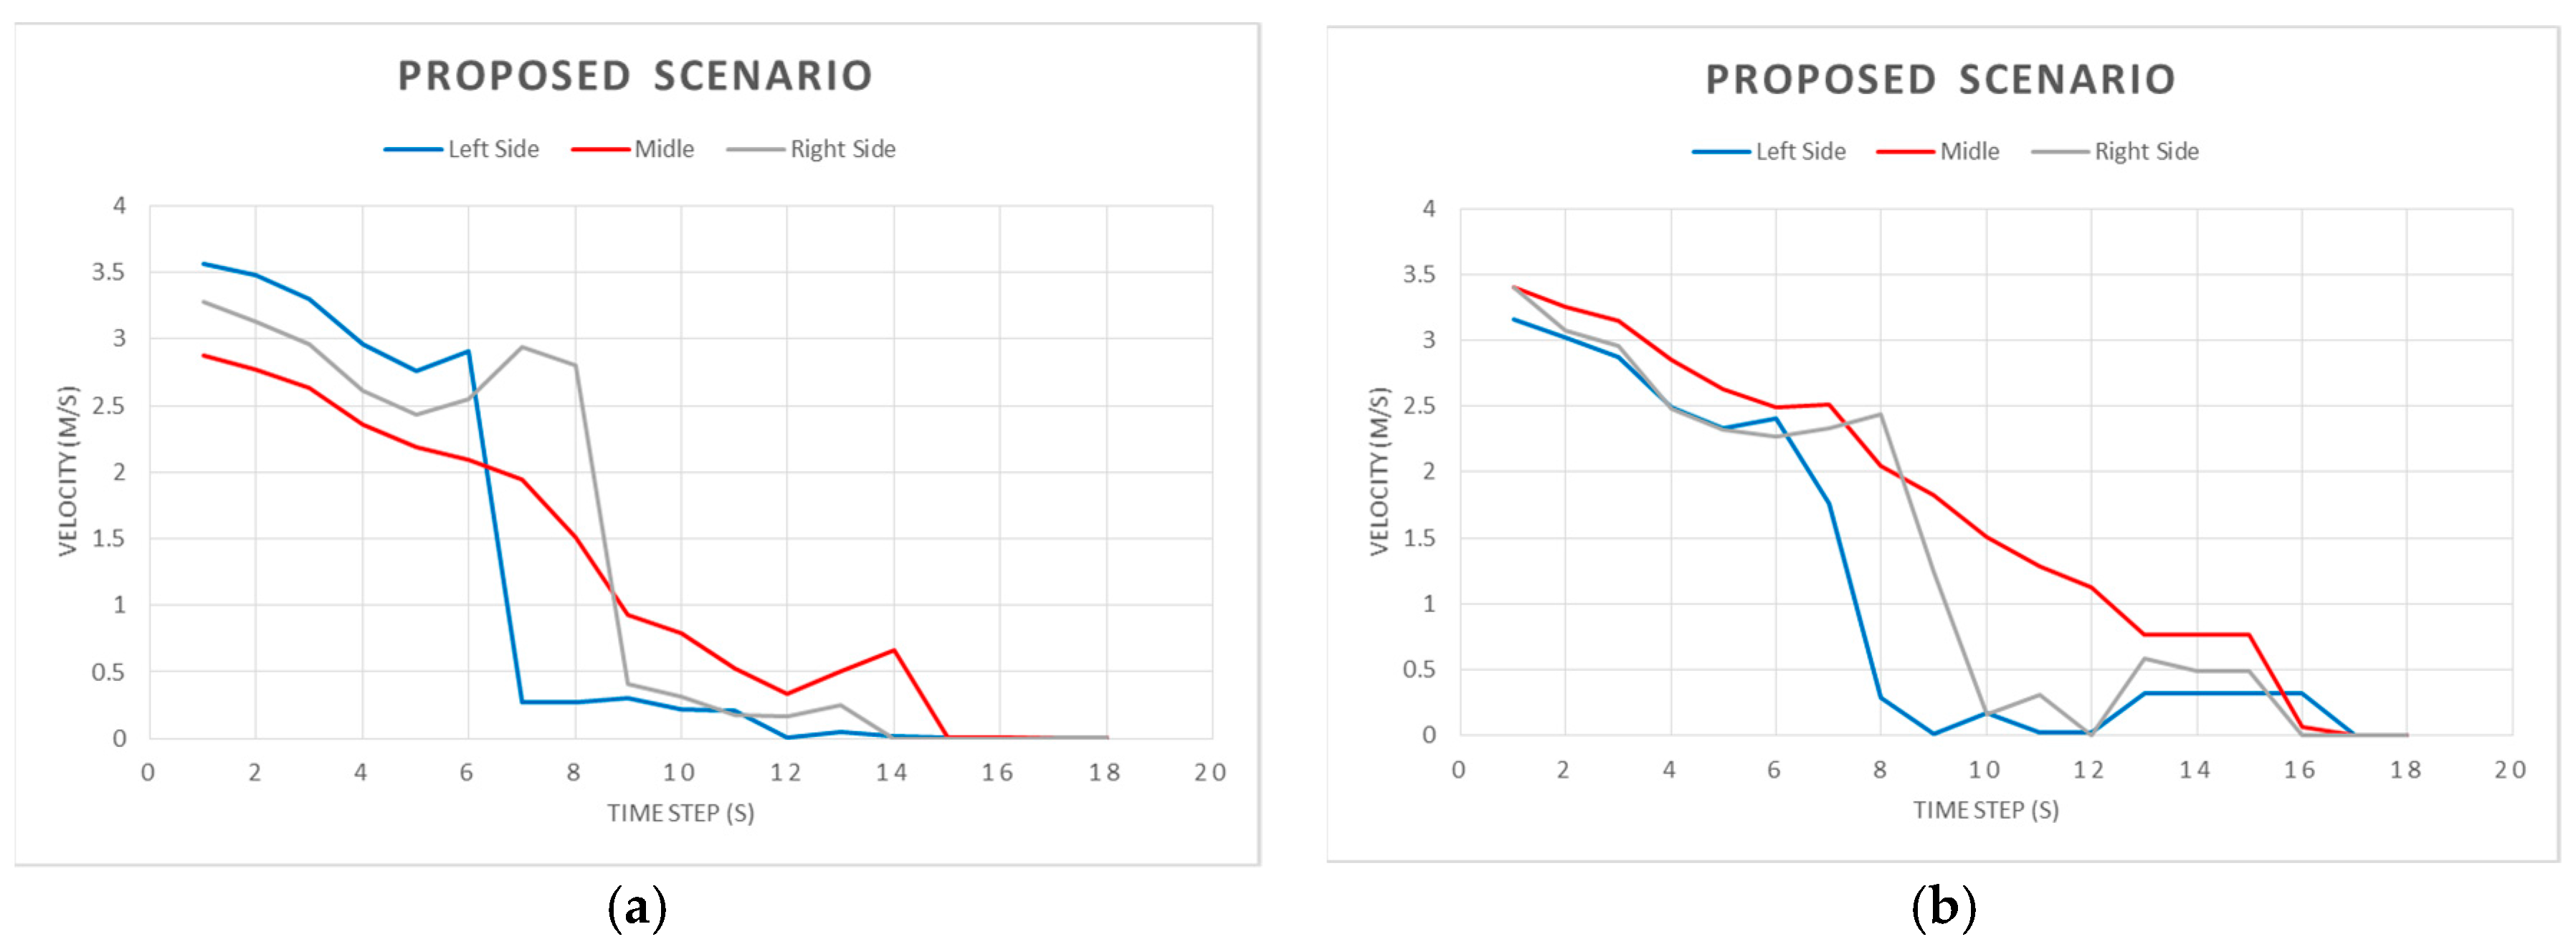
The evaluation of velocity in the x direction is shown in
Figure 15 to compare the proposed geometry with the current scenario (scenario 1 represented in
Figure 10):
Velocity in the x direction is always positive in this scenario, which means that the recirculation phenomenon is not acting as in the current scenario (scenario 1). Moreover, velocity values exceed those recommended to guarantee self-cleaning in the sewer systems.
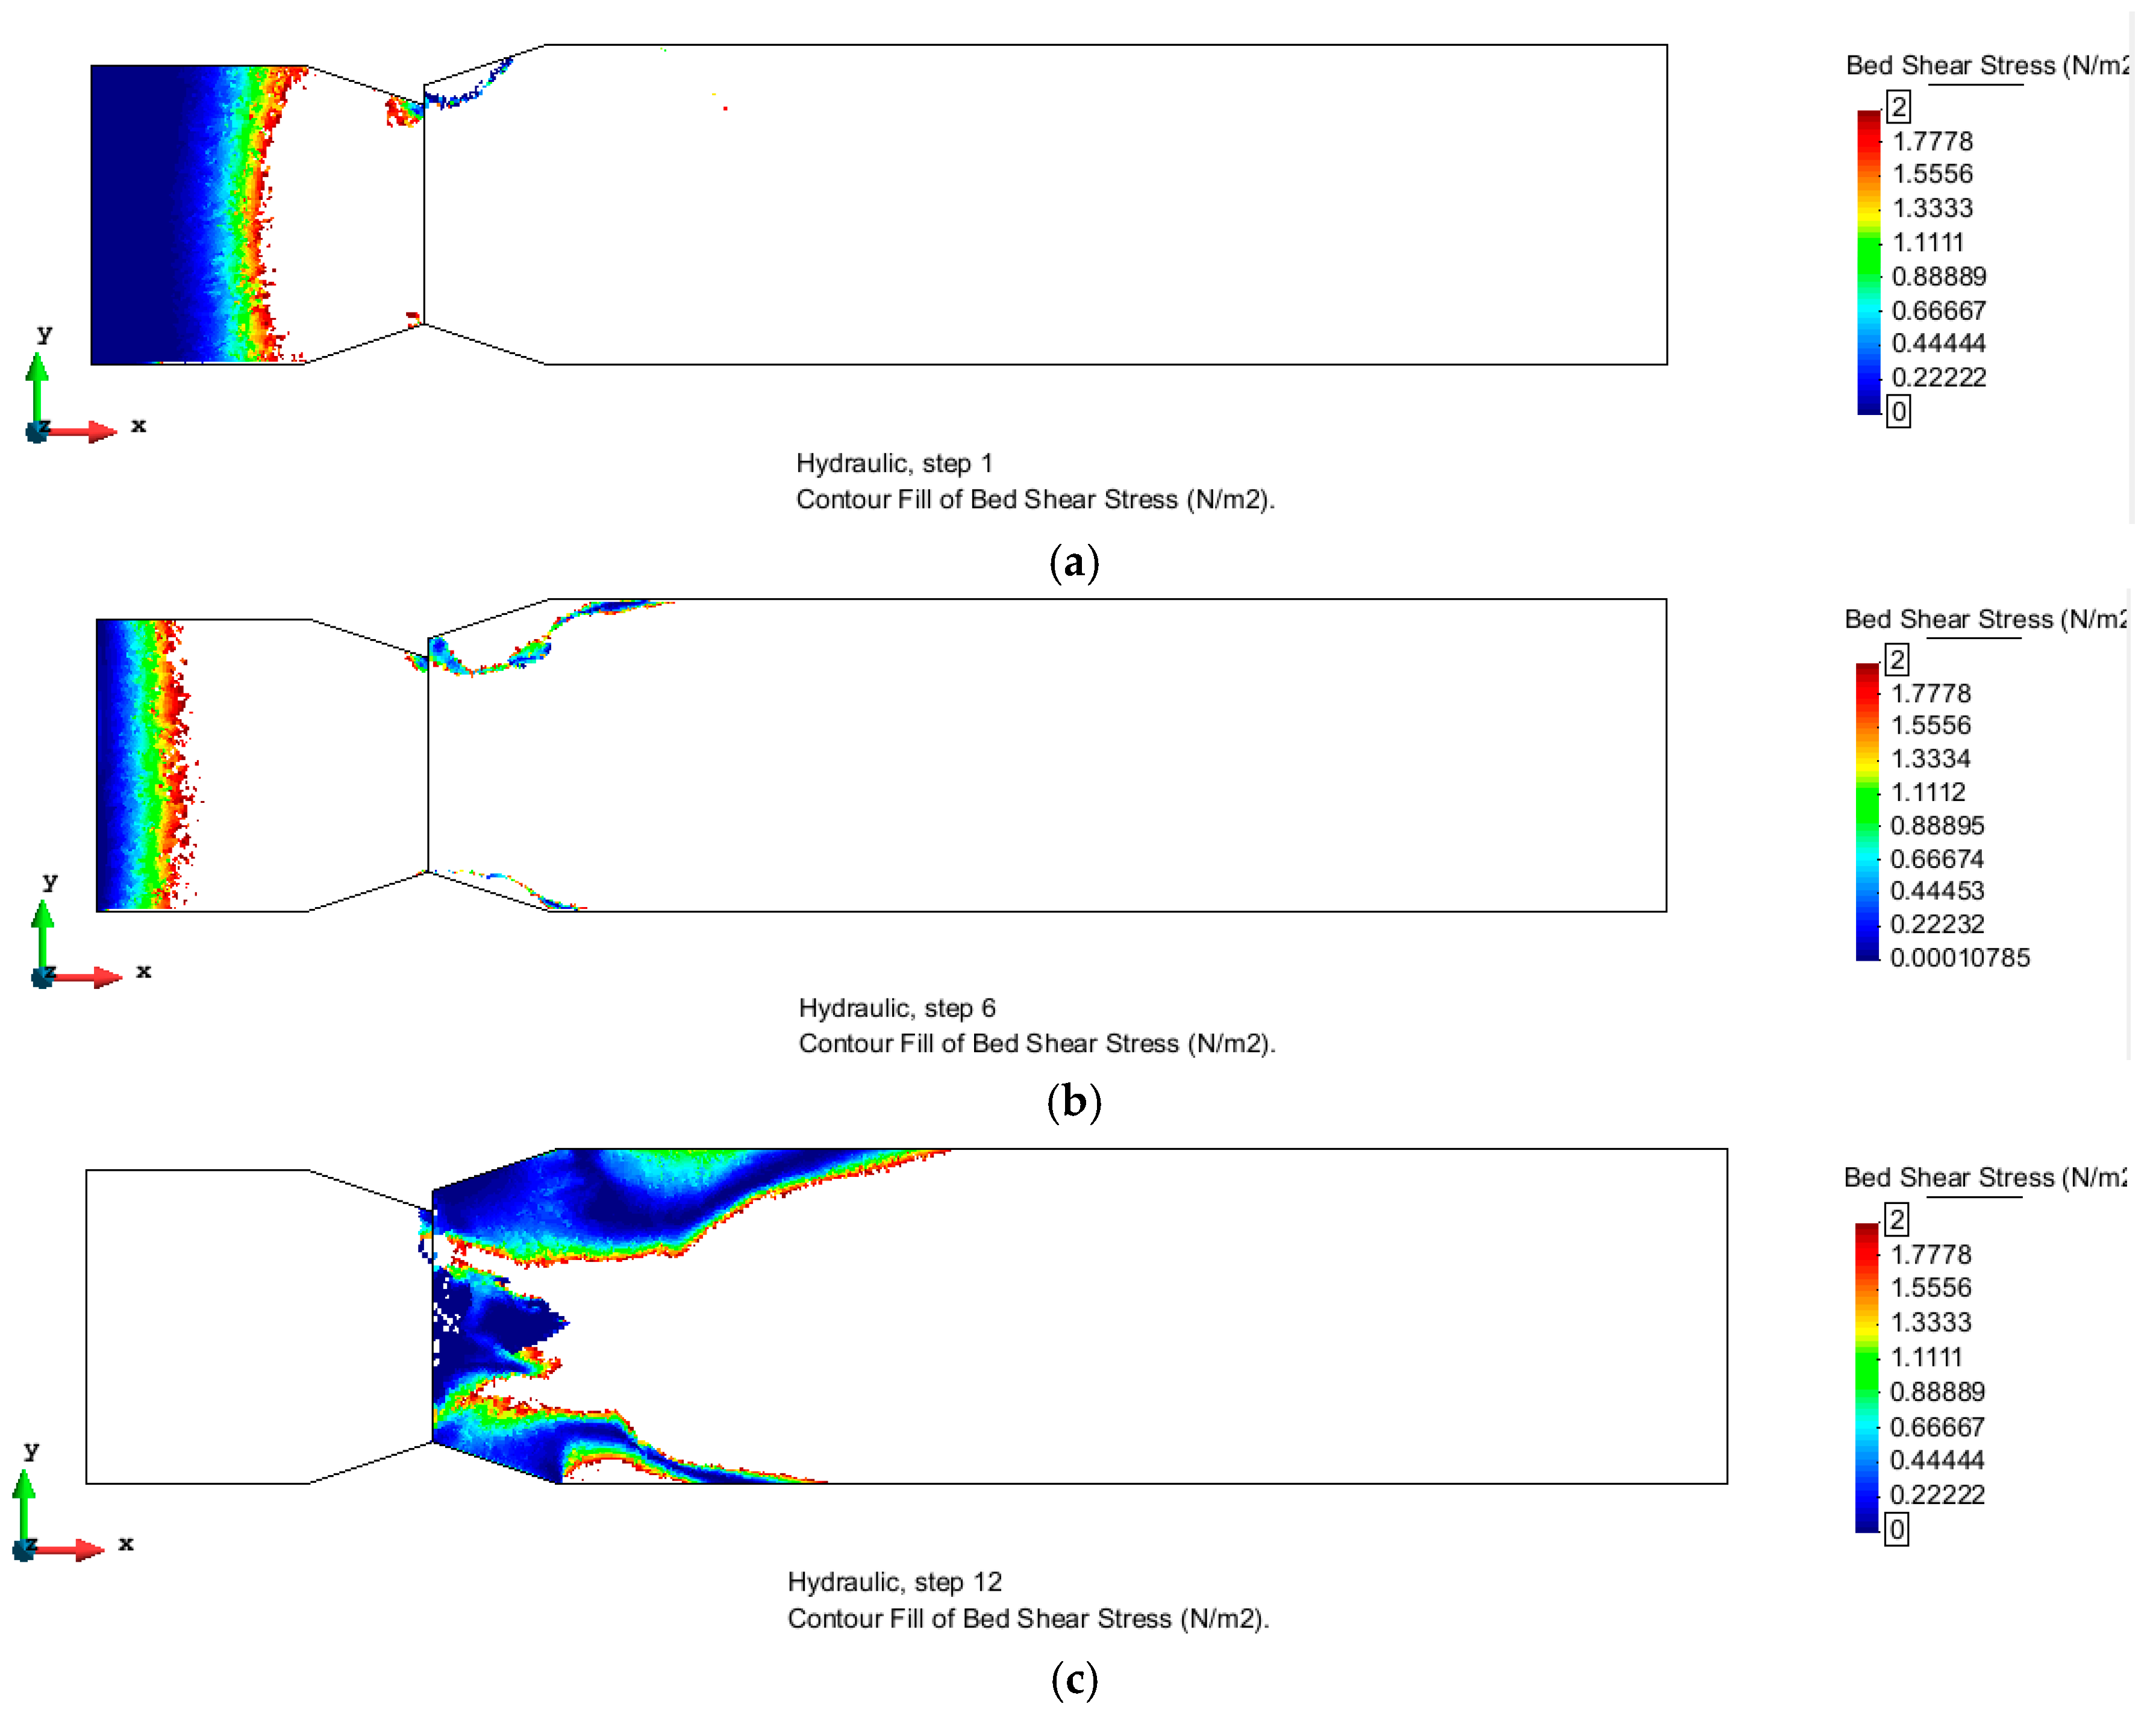
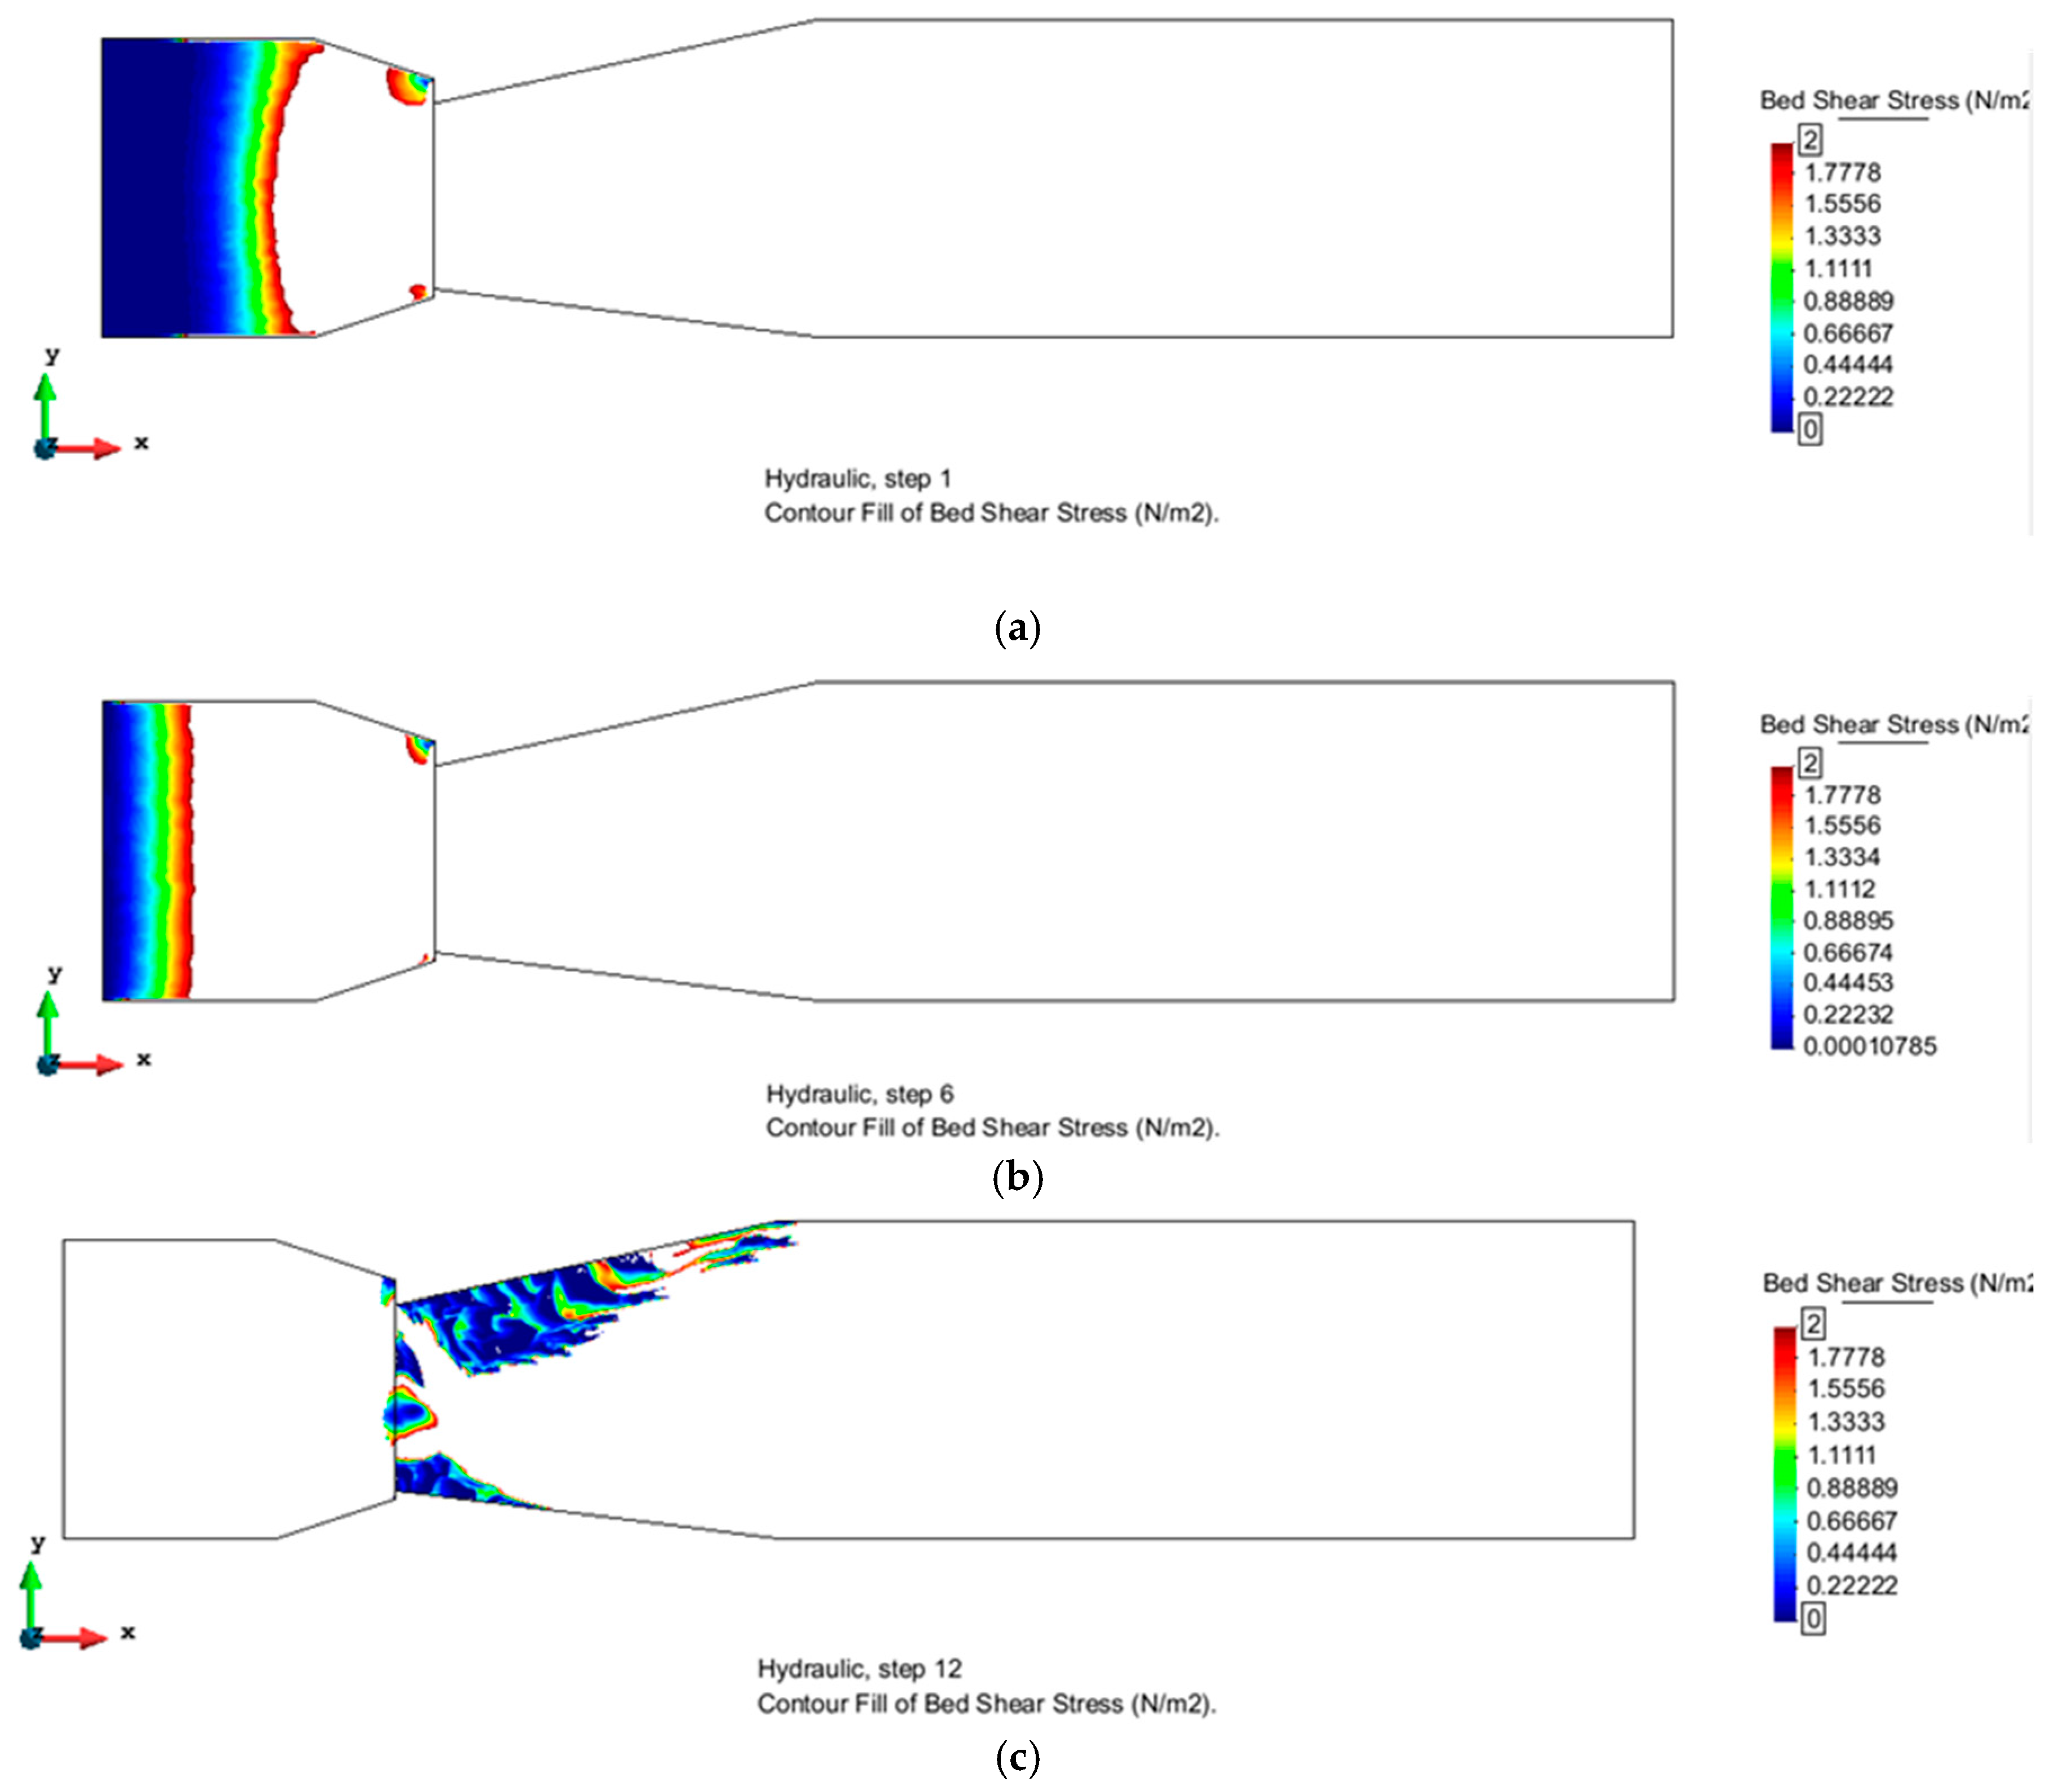
To compare bed shear stresses in the proposed geometry with the current geometry,
Figure 16 shows those areas where bed shear stresses are below 2 N/m
2:
In these figures, simulation time steps 1, 6 and 12 are represent values between 0 and 2 N/m2. Testing done with the current geometry also showed these figures. In step number 1, some areas near the sides had bed shear stresses between these values.
In steps numbers 1 and 6, bed shear stresses are higher than 2 N/m2. This indicates that flow velocity is enough to achieve sufficient cleaning of the lane. Areas with shear stresses below the critical value of 2 N/m2 correspond with areas where sediment removal is difficult.
The last time step shows values between the critical values of bed shear stresses. This was because water flow was not acting over these sections and the flushing wave had already passed over this zone. The flow in this time step over these sections corresponds to the end of the flushing, implying lower velocities and less energy to erode sediments.
The results demonstrate that the proposed geometry provides velocities 1.25 times higher in the middle of the lane; cancels the phenomenon of recirculation; and gives higher bed shear stresses. By modifying the current geometry as proposed, better cleaning conditions in front of the flushing gate can be expected.
5. Conclusions
The current geometry of the La Estrella retention tank contains recirculation areas within the first few meters of the lane, as shown in the results of scenario 1 (current pilot tank lane). These areas are zones where the cleaning system has greater difficulty in removing accumulated sediment. The recirculation areas are produced due to a dissipation of energy when flow water occupies the sides of the lane.
Various tested geometries demonstrate that recirculation areas can be avoided when adapting the width of the lane and considering the width of the flushing gate. The best results were obtained when the width of the flushing gate and the lane were of the same dimensions.
The proposed and tested geometry for the Badalona storm tank fills the recirculation areas with a concrete slope or wingwall to progressively drive the energy wave from the gate width toward the lane width. Using this new geometry, higher velocities are reached, recirculation is avoided, and bed shear stresses are higher than 2 N/m2. Thus, better results are expected in terms of sediment cleaning.
The results demonstrate that numerical modelling of these types of processes is possible with the computer models available (commercial codes) and can be used to optimize the design of cleaning systems.
The procedure and the methodology herein used can be developed before the construction of a storm tank, making sensitive analysis of such different parameters as lane length, upstream gate dimensions, longitudinal slope, etc. and adapting them to the best cleaning performance.
To avoid a drastic increase in operations and maintenance work, the cleaning systems of storm tanks are critical features that need to be carefully addressed.


