Intercropping Halophytes to Mitigate Salinity Stress in Watermelon


1
Texas A&M University-Kingsville, Citrus Center, 312 N International Blvd, Weslaco, TX 78596, USA
2
Northern Great Plains Research Laboratory, United States Department of Agriculture (USDA)-Agricultural Research Service, Mandan, ND 58554, USA
3
Millican Farms LLC, 22168 FM 159, Millican, TX 77866, USA
4
Department of Plant Sciences, University of California-Davis, Davis, CA 95616, USA
*
Author to whom correspondence should be addressed.
Sustainability 2018, 10(3), 681; https://doi.org/10.3390/su10030681
Submission received: 2 February 2018
/
Revised: 26 February 2018
/
Accepted: 28 February 2018
/
Published: 2 March 2018
(This article belongs to the Special Issue Agroecology: Principles and Application for Efficient and Sustainable Agricultural Production)
Abstract
:Saline irrigation water can lead to salt buildup and reduced crop yields. Halophytic plants are known to accumulate excess salts in tissues, removing them from the immediate environment. This two-phase experiment explored the feasibility of intercropping watermelon (Citrullus lanatus (Thunb.) Matsum. and Nakai var. lanatus) with halophytic species to mitigate the negative effects of saline irrigation water while providing a value-added crop. In the first experiment, six greenhouse-grown species were irrigated with water that was either deionized (0 dS m−1) or contained 3 or 6 dS m−1 of salts for 41 days and screened for growth and salt removal. Two halophytes were selected to be additively intercropped with watermelon under field conditions and irrigated with the same saline irrigation levels as the first experiment. Results indicated that garden orache (Atriplex hortensis L.) exhibited the highest growth rates and purslane (Portulaca oleracea L.) accumulated high amounts of sodium in plant tissues under saline irrigation. The field experiment showed that watermelon yields, stem water potential, and fruit quality were not affected by saline irrigation; however, the watermelon/orache intercropping treatment had significantly higher yields. These results suggest intercropping with halophytes has the potential to contribute a value-added crop without reducing watermelon yields.
1. Introduction
1.1. Salinization
Salinization concerns are escalating as water resources and arable land are decreasing. Globally, it is estimated that 80 million ha of land are salt affected, with much of this attributed to agricultural inputs [1]. As of 2004, salinity in the Upper Colorado River Basin caused damages in excess of $306 million, and is projected to exceed $471 million per year in salt related damages by 2025 [2]. Climate change has resulted in more severe and longer lasting drought in semi-arid and arid climates worldwide, which has resulted in an increase in irrigation use to supplement crop water requirements [3]. In the U.S. alone, approximately 55 million acres of land were irrigated in 2012 [4]. It is estimated that between 20% and 50% of irrigated land is salt affected, many of these lands in arid and semi-arid regions that are considered to be more vulnerable [5,6,7]. Regional sources of water available to farmers vary in quality throughout the U.S., usually depending on underlying geography and parent materials in which groundwater is located [8,9]. Relying on low quality water to irrigate crops can cause soil salinization and result in future reduced plant growth and yield. Soil structure, infiltration, available soil water, and nutritional status are affected by salinity. The primary elements associated with toxicity are sodium (Na) and chloride (Cl), which affect plant tissues, osmotic potential, and cell membranes as well as soil properties [10,11,12].
1.2. Intercropping
Utilized primarily in developing countries, intercropping is the practice of growing two or more crops simultaneously or in relay [13]. Traditionally, small farmers around the world have used this strategy to satisfy dietary needs, spread labor over the growing season, and reduce single crop failure risks [14]. Intercropping was practiced in the United States and Europe prior to the 1940s when a pronounced shift to monoculture agriculture occurred due to the introduction of mechanization, improvements in plant breeding, and availability of low cost fertilizers and pesticides [15]. Intercropping can potentially create a more balanced, complex system where multiple crops can be produced in one season on one tract of land due to more efficient utilization of resources by the crops [16]. Crops that complement each other in both growth form and resource utilization are intercropped as a way of reducing interspecies competition for the same limiting growth factors, potentially resulting in overyielding, or increased production per unit of land [17,18].
In any intercropping system, however, one species ultimately grows faster than the other(s), leading to dominant–subordinate competitive dynamics that result in more favorable conditions for the dominant fast-growing species [17,19]. This may lead to a yield reduction in one or more component crops. This holds true particularly in additive intercropping systems, whereby the planting density of the primary crop remains consistent with standard monocrop planting density but a subsequent crop(s) is added to form the intercrop, resulting in higher overall plant densities and increased competition [19]. In an additive intercropping system of wheat (Triticum aestivum L.) and chickpea (Cicer arietinum L.) in India, the relative competitive advantage gained by wheat resulted in a significant chickpea yield reduction as compared to monocropped chickpea [20]. In Europe, triticale (Triticosecale Witt.) was a superior competitor to field beans (Vicia faba var. minor L.), which resulted in decreased biomass production and yields in field beans [21]. In California, Brennan [22] found that lettuce (Lactuca sativa L.), the primary crop, was a superior competitor, leading to a reduction in alyssum (Lobularia maritima (L.) Desv.) biomass production. A reduction in lettuce head size as compared to lettuce monocultures was observed, however. Despite this, additive intercropping was found to be more efficient with regards to overall production per unit land area than replacement intercropping. When leeks (Allium porrum L.) and celery (Apium graveolens L. var. dulce (Mill.) Pers.) were intercropped, celery gained a competitive advantage over leek resulting in an overall yield advantage but with a reduction in quality in both crops [23]. In contrast, one study on strawberry (Fragaria x ananassa (L.) Duch.) intercropped with lettuce, onion (Allium cepa L.), and radish (Raphanus sativus L.), found that an additive intercropping approach did not result in reduced yields to the main crop, strawberry, nor did it result in changes to strawberry fruit chemical characteristics [24]. They also observed a significant increase in overall yield per unit land area.
1.3. Intercropping with Halophytes
In recent years, more research has been conducted on using plants to remediate contaminated environments. However, there have been very few studies that have evaluated the use of salt-tolerant, halophytic plants to remove salts in an intercropping system. This system has potential in the mitigation of stress in areas where salt is of particular concern and limits crop production. Halophytes can benefit these systems greatly due to their ability to accumulate Na and Cl, effectively removing salts from the environment and the potential osmotic stress imposed on the cash crop. Research conducted by Albaho and Green [25] showed that saltwort (Suaeda salsa (L.) Pall.) intercropped with tomato (Lycopersicon esculentum Mill.) was able to reduce Na concentrations in both the foliage and growing medium. Zuccarini [26] also found that intercropping tomatoes with halophytes, purslane and garden orache, reduced Na and Cl concentrations in tomato tissues and led to increased fruit yields. Yield increased approximately 44% in tomatoes intercropped with purslane and achieved comparable yields to those grown without saline conditions. These yield increases were primarily from increased fruit size and mass, and only found in the halophyte intercropped treatment. In addition to the benefits in yield, nutritional status of tomatoes was enhanced by intercropping with the halophytes, potassium (K) and nitrogen (N) were found at higher levels in the purslane and orache treatments, respectively. Purslane was found to be a better overall companion plant, capable of removing more salts and increasing overall yields. Additional research conducted by Graifenberg et al. [27] also found similar results when tomatoes were intercropped with purslane and saltwort. In that study, halophytes reduced the amount of Na taken up by intercropped tomatoes, and increased the uptake of phosphorus (P) and calcium (Ca). Intercropping has also been attributed to not only yield increases, but dry biomass increases in fodder shrubs saltbush (Atriplex halimus L.) and shrub medick (Medicago arborea L.), a nitrogen-fixing fodder shrub, when compared to the monocropped shrubs [28]. While the results discussed here are significant, these results were found in greenhouse studies which are not always replicable in field conditions. Few field studies on intercropping have been conducted, however, Kurdali et al. [29] found that in an intercropping system with sorghum (Sorghum bicolor L.) and dhaincha (Sesbania aculeate (Wild.) Pers.), a 12% increase in total combined yield could be possible. This is most likely due to the added benefits of intercropping with a N2 fixing crop compared to the monocropped sorghum. Overall, greenhouse studies have shown great promise in increasing yields and production in several intercropped halophytic species. However, there is a need to confirm these findings under field conditions and determine which cropping systems benefit producers and increase yields while mitigating salt stress in sensitive crops.
Soil salinity is becoming an increasing problem in Texas agricultural soils due to higher water demands and decreasing quality and quantity of irrigation water. In areas with unreliable water supply and low quality irrigation sources mixed cropping systems with value added halophytic plants show potential for mitigation of salinity while improving yields. The uptake and sequestration of salts in saline soils could also allow for affected areas to maintain or increase production. The objectives of our study were: (1) to compare several salt-accumulating or salt tolerant and potentially marketable halophytic and semi-halophytic species for their ability to take up and accumulate salts to potentially improve soil conditions; and (2) to evaluate two selected halophytes for their ability to reduce salt stress in watermelon and increase production in an additive intercropping system in salt affected soils. To address our two objectives, a two-phase study consisting of a controlled greenhouse experiment (Phase I) and a field trial (Phase II) was conducted.
2. Materials and Methods
2.1. Phase I: Greenhouse Evaluation
Although many species of halophytes can potentially be used to accumulate salts within a cropping system, only a few met our needs. The characteristics desired for this study were marketability (as food or forage), availability within the U.S., and seasonal compatibility with watermelon. The following six species, also listed in Table 1 with a description of their growth form and potential added value, were chosen for screening: barley (Hordeum vulgare L.), wheat, purslane, saltwort (Salsola komarovii Iljin), garden orache, and four-wing saltbush (Atriplex canescens (Pursh) Nutt.). Barley and wheat were selected for their ability to tolerate saline conditions, potentially having semi-halophytic properties [30]. In addition, these crops are often used as wind breaks early in the growing season to protect watermelon seedling transplants (Stephen King, personal communication). Purslane, saltwort, garden orache, and four-wing saltbush were chosen for their ability to accumulate and remove salts from the soil [26,27,31]. Seeds of four-wing saltbush were sown in September 2012 because of their slow growth habit. Remaining species were seeded directly in 11.36 L (3 gal) pots filled with potting soil on 7 January 2013 and four-wing saltbush (saltbush) was transplanted into pots at this time. Each pot held one plant to ensure that planting density did not affect results and to further determine the capacity of individual plants to remove salts. All plants were grown in a greenhouse at Texas A&M University (College Station, TX, USA). Plant species were replicated five times per treatment in a randomized complete block design.
To simulate brackish water, Instant Ocean© sea salts (Instant Ocean United Pet Group, Blacksburg, VA, USA) was added to irrigation water to increase salinity to the experimental levels of 3 and 6 dS m−1. Ocean salt solution components were designed to closely resemble the proportions of each ion contained in ocean water, but scaled to less saline concentrations for these experiments. Irrigation water was obtained from a reverse osmosis system supplied to the greenhouse and also used as the 0 dS m−1 treatment with 0 dS m−1 referring to no added salts or control treatment. Treatments of 0, 3 and 6 dS m−1 irrigation water were applied to plants over the course of the experiment. These levels were chosen based on moderate salinity levels in groundwater in southern Texas, as well as previous salinity experiments using watermelons [32,33]. Salt treatments began on 1 February 2013 and were harvested and processed on 14 March 2013. Salts were mixed in a holding tank containing the concentrated salt solution, and injected via Gator-XL water powered chemical pump injectors (Gator-XL™, Fort Myers, FL, USA) at a 1% injection ratio. Salt concentrations were monitored throughout the experiment to ensure consistent salt delivery. Plants were irrigated two times per day for two minutes at a rate of 6.7 cm3 s−1 (approximately 0.8 L per day), irrigation times were adjusted as needed if plants looked stressed or excessive moisture occurred.
Height measurements collected weekly for the duration of the experiment due to the impact of salinity and stress on plant height. Height relative growth rate (RGR) was calculated for each plant as (ln Htt2 − ln Htt1)/t2 − t1, where t refers to the initial measurement date (t1 = 1 February 2013) prior to salt treatment and the final date of measurement (t2 = 13 March 2013). To standardize species salinity response as these unrelated species may differ in growth rates, relative growth rate response ratio was calculated as (RGR RR; RGR RR = RGR (salinity)/RGR (no salinity)), whereby a value of greater than 1 indicates a higher growth rate when irrigated with saline water as compared to non-saline water. Above-ground height was measured from the soil line to the apical meristem of the plant. If multiple branches were present, the longest one was marked and measured for the duration of the experiment.
Soil electrical conductivity (EC) and moisture (VWC) was monitored with GS3 soil moisture, temperature and EC probes (Decagon Devices Inc., Pullman, WA, USA). Data was downloaded periodically throughout the experiment to ensure consistent moisture and salt delivery.
At the culmination of the study, plants were harvested and separated into leaves, stems, and roots then oven-dried to a constant mass and weighed. Plant tissue samples were analyzed for Cl and Na at Texas A&M University’s Soil, Water, and Forage Testing Laboratory (College Station, TX, USA). Na and Cl concentrations are presented in mg g−1, plant dry biomass in g, and total Na and Cl uptake by leaves, stems, and roots was calculated by multiplying tissue concentration by tissue dry biomass. Total uptake shows the potential total salt that was taken up and removed from soil by each species over the course of the greenhouse experiment. Halophytes were then evaluated according to specified parameters and two were selected for subsequent field trial.
2.2. Phase II: Field Trial
Field trial plots were established in 2013 at Texas A&M University’s Horticulture Farm (30°37′ N, −96°22′ W) located in Bryan, TX. Soil for this site is classified as a Robco loamy fine sand with 0–3% slope. Ninety centimeter-wide raised beds with 3 m row spacing were prepared with subsurface drip irrigation and plastic mulch. Plant materials were seeded out in the greenhouse in trays filled with potting soil 3 weeks prior to field planting. Treatments consisted of three salinity levels (0, 3, and 6 dS), four crop combinations which included a watermelon monoculture control, and six replications. The crop combinations consisted of watermelon (var. “Ole”) planted alone (W) and intercrops of either garden orache (var. “Triple Purple”) with watermelon (W/O), purslane (var. “Tall Green”) with watermelon (W/P), or both species intercropped with watermelon (W/O/P). Plant materials were transplanted to the field site between 20 and 23 May 2013. The field plot design consisted of an additive intercropping system whereby 5 watermelon plants were planted following recommended spacing at 1 m apart, and separated by the selected halophyte or combination of halophytes. Total plot size was 3 m × 5 m. Halophytes were spaced 0.3 m such that there were always two halophyte plants equally spaced between watermelon plants. In the W/O/P treatment, there was one of each halophyte, orache and purslane, planted between watermelon plants. In the case of the watermelon monoculture control, there were no halophytes planted. Each row had two buffer watermelon plants between the ends and each replication.
Irrigation treatments of 0, 3, and 6 dS m−1 were applied to rows according to random selection via a random number generator. A concentrated simulated ocean salt solution (same as previous greenhouse evaluation) was mixed in a 189 L (50 gal) drum then mixed with irrigation water and injected using venturi injectors (Mazzei Injector Corp., Bakersfield, CA, USA) at each treatment rate. Irrigation water was obtained from the Bryan, TX domestic water supply systems and was typically 0.3 ± 0.5 dS m−1. A fertilizer solution of NPK (20-20-20) and ammonium sulfate was also injected with water at a rate of 90 g L−1. Solution was prepared each week or when salt solution was depleted. Solution injection rates were adjusted to meet the target treatment rates of 3 and 6 dS m−1. Drip irrigation delivery of 56 mL m−1 min−1 occurred once daily in the morning and timing was adjusted to meet watermelon water requirements based on rainfall and temperature.
To analyze fluctuations in soil electrical conductivity (EC), one soil sensor was installed in each of three replicates of each crop combination and salt level prior to the start of salt application, which monitored soil volumetric water content, temperature, and EC on an hourly basis (Decagon Devices Inc., Pullman, WA, USA). Additionally, a composite of five soil cores measuring 1.7 cm in diameter were taken from the top 15 cm of each plot before salt application began and after the culmination of the study to quantify changes in sodium (Na) and chloride (Cl) content.
Evaluating plant osmotic stress is related to the water stress or tension within the plant. To determine water status within the plant and subsequently if osmotic stress due to elevated salt levels was apparent, mid-day stem and pre-dawn stem water potentials were measured on three watermelon plants per treatment using a Scholander pressure chamber. To assess the effect of salt buildup on watermelon over the growing season, measurements were taken in mid-June, mid-July, and mid-August. Due to labor and resource limitations, pre-dawn water potentials were not taken in mid-July. Measurements were taken from the most recently matured and fully expanded leaf mid-way up the stem on the same vine each measurement date. In the case of mid-day stem water potential measurements, leaves were encased in opaque, reflective bags for 30 min prior to placement in the pressure chamber to ensure stomata were closed and water tension in the leaf and stem were at equilibrium. Pre-dawn measurements were taken between 04:00 and 06:00 and mid-day measurements were taken between 11:30 and 13:30.
Fruit yield and quality data were collected to evaluate the effects of intercropping and salinity treatments. Fruit was harvested three times throughout the growing season and fruit mass was recorded at each harvest. Estimated fruit yield was taken by harvesting from a 3.5 m2 area in the center of each plot to reduce miscalculations due to potential overlap of vines. Fruit quality measurements were taken within two days of harvest. Fruit mass (kg), soluble solid content (°Brix), firmness (N), and rind thickness (mm) measurements were taken from ten fruits collected within each plot subsample. Any fruit not in the designated plot sample area was harvested and counted but quality measurements were not taken. Average soluble solid content per fruit was determined from the juice of two fruit flesh samples collected from the heart of the watermelon fruit and analyzed by a Pocket Refractometer PAL-1 (Spectrum Technologies, Inc., Aurora, IL, USA). Fruit firmness was determined by taking the average of three peak compression measurements approximately 50 mm from the bud end of the rind using a digital force gauge (Chatillon DFM 50, Ametek Test and Calibration Instruments, Largo, FL, USA).
2.3. Statistical Analysis
Statistical analysis was performed using JMP® Pro 10.0.0 software (SAS Institute, Cary, NC, USA). Treatment effects and interactions were determined using full factorial fit models and bivariate fit models when appropriate. Relative growth rates from Phase I of the study were analyzed with Response Ratios (RRs) as a continuous variable and species, salt treatments, and species nested within salt treatments as fixed effects. Significance is shown at p ≤ 0.05 for greenhouse experiment parameters and at p ≤ 0.10 for field experiment parameters due to high field variability. Differences between means were determined using a Student’s t test.
3. Results
3.1. Phase I: Greenhouse Halophyte Evaluation
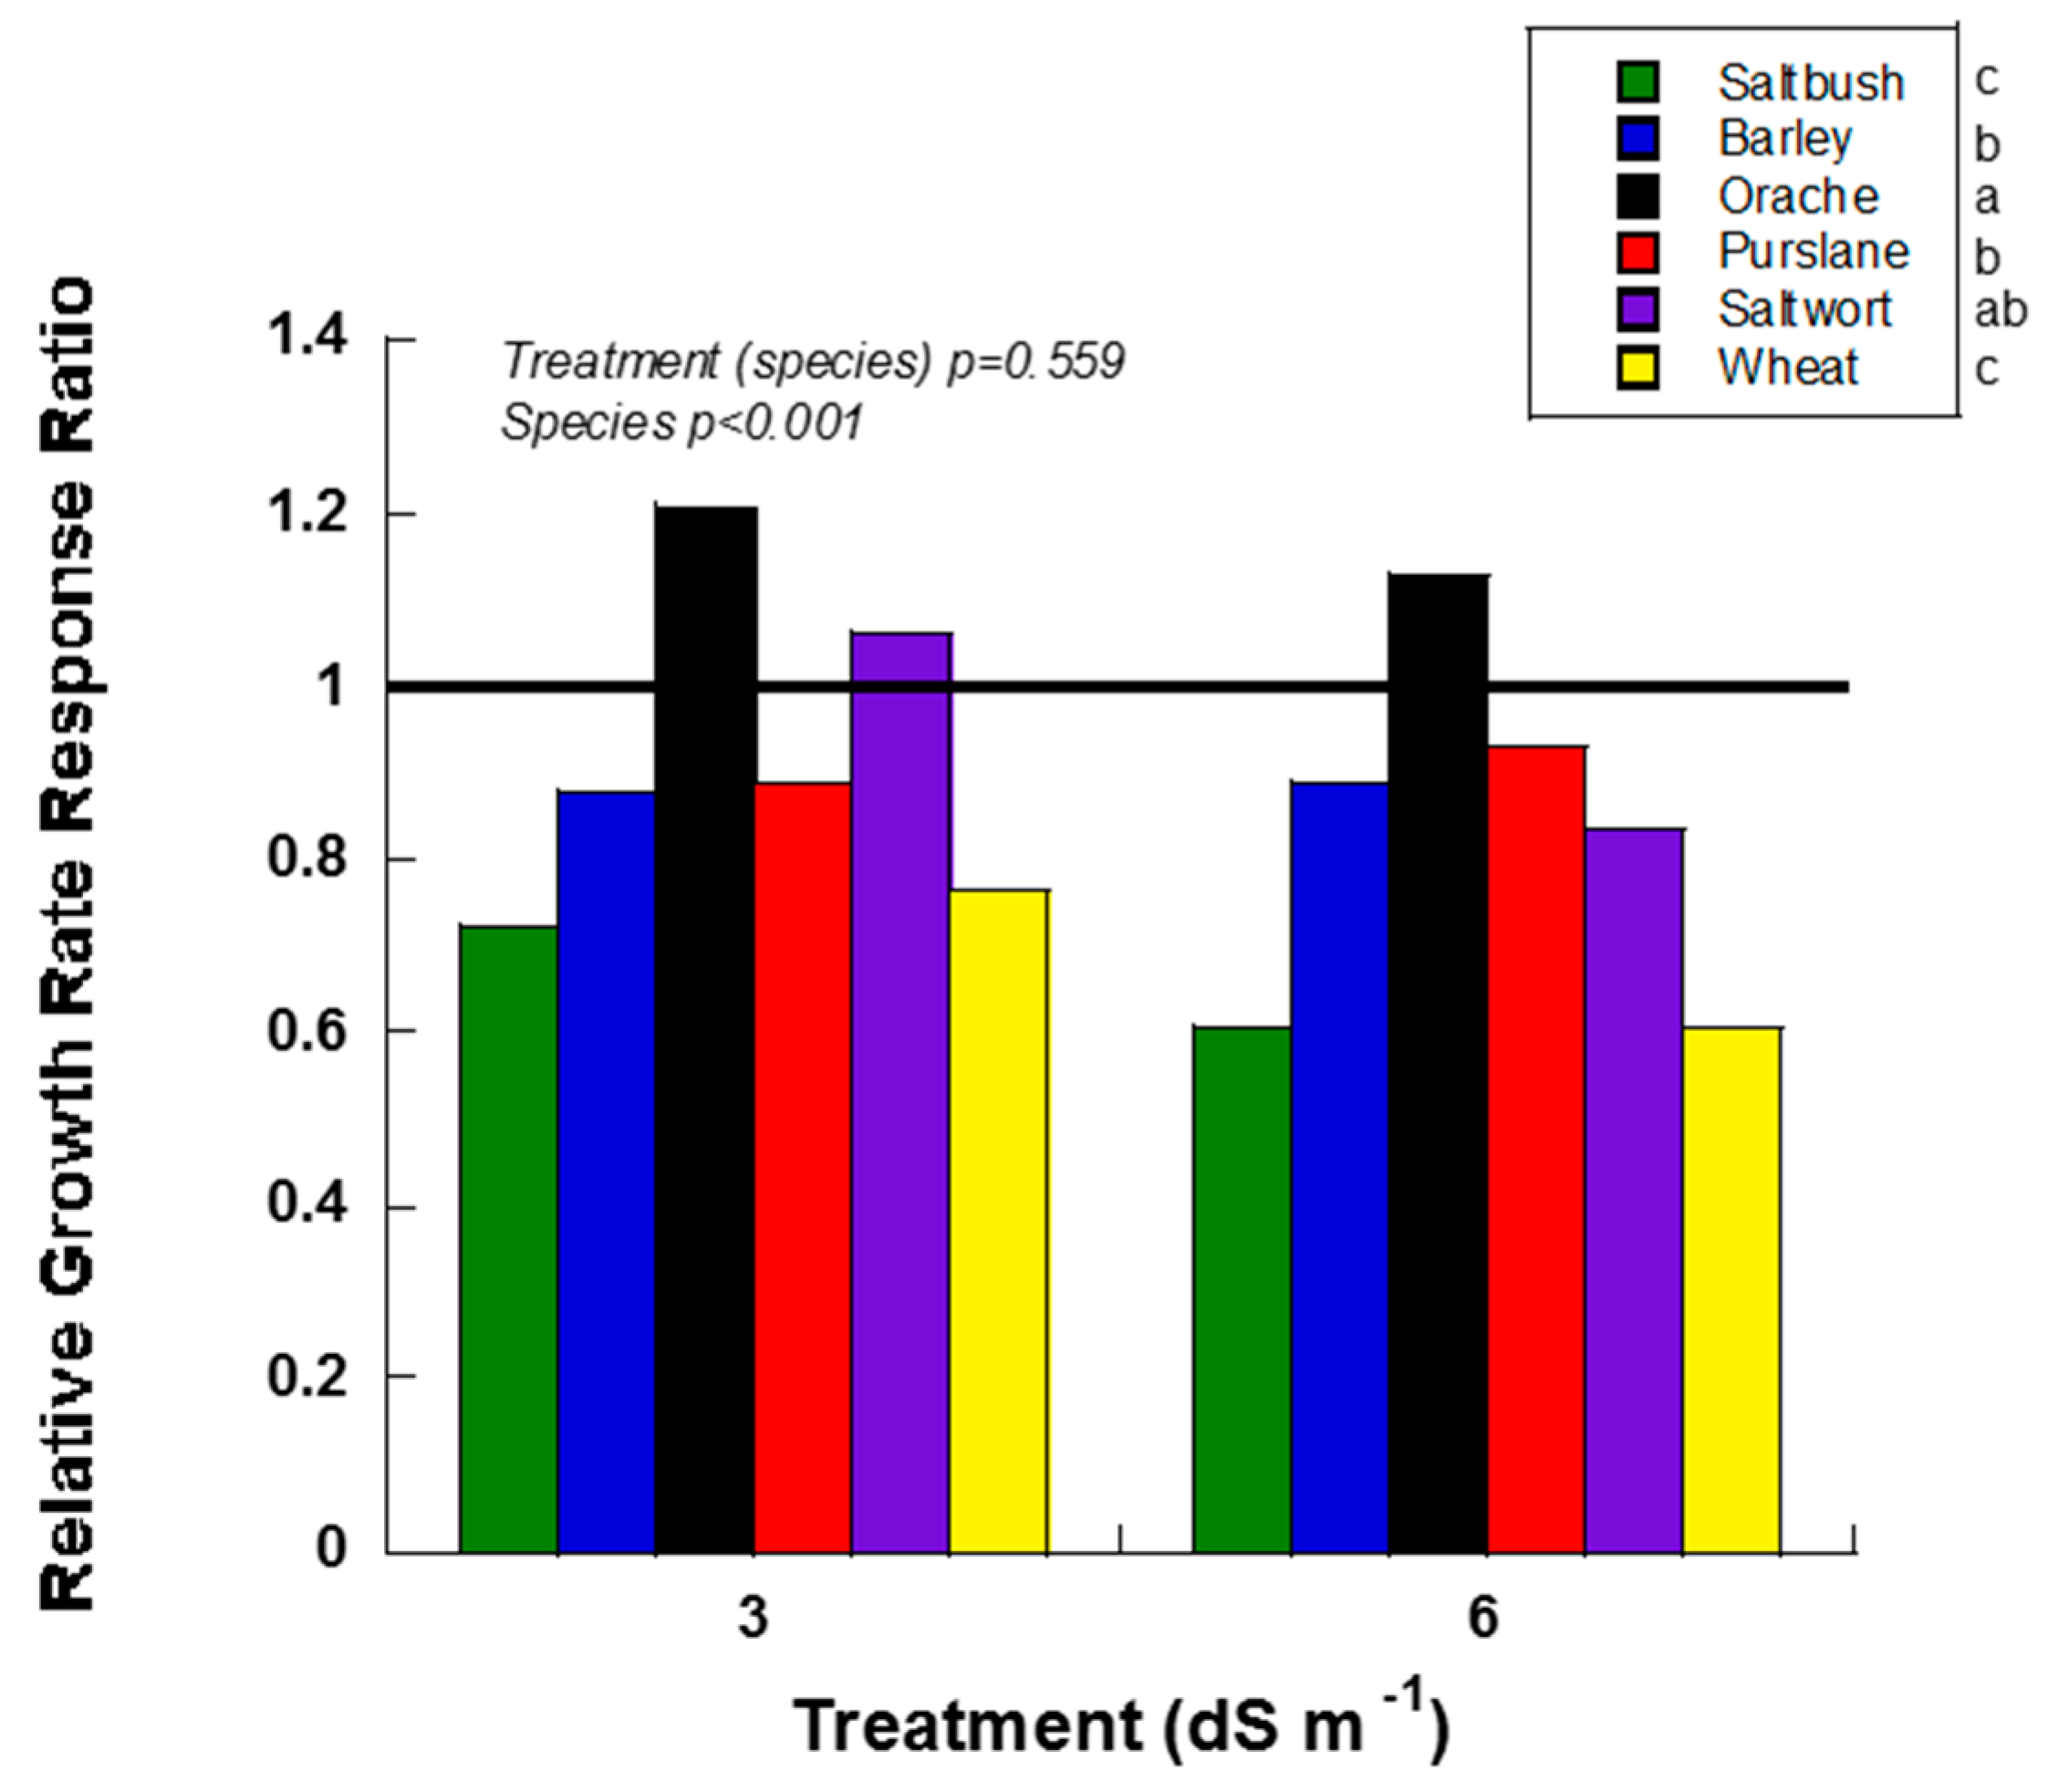
Halophyte evaluation criteria included height relative growth rate, concentration of Na and Cl in leaves, stems and roots, and change in soil EC for each halophyte and salinity treatment. Overall, orache and purslane responded to salt treatments more positively than other species as shown by higher relative growth rate response ratio (RGR RR) (Figure 1). Of the six halophytes studied, orache had the highest RGR and RGR RR under elevated saline conditions (Figure 1). Although purslane had a fast growth rate, the RGR RR was similar to saltwort and barley at 6 dS m−1 and barley at 3 dS m−1 (Figure 1). Saltwort had high RGR RR at 3 dS m−1 (> 1), which implies that it is more tolerant to salinity; however, its overall size and growth habit made it an unlikely candidate for intercropping in a field setting with watermelons.
Results from halophyte tissue analysis indicated that concentrations varied by species, salinity treatment, and tissue type (i.e., leaves, stems, and roots; Table 2). While Cl accumulation by species was not significant, Na varied by species (p < 0.001). Sodium and chloride concentrations in plant tissues varied by species, salinity treatment and tissue (pNa species × salinity treatment × tissue < 0.0001; pCl species × salinity treatment × tissue = 0.0004). Tissue analysis further revealed that the major ion accumulating in plant tissue was Na, with up to 64.88 mg g−1 stored in orache leaf tissues compared to the highest concentrations of Cl being 0.006 mg g−1 stored in purslane leaf tissues (Table 3). Leaf tissues accumulated the most Na and varied by species (p ≤ 0.0001). Furthermore, interactions between species and salinity treatment varied by tissue type (Table 3). Due to monocot morphology, all aboveground tissue was combined for barley and for wheat and presented as leaf tissue concentrations. All saltwort tissues, including roots, were combined to have enough sample for analysis and are presented here as leaf tissues. Across all tissues, the highest Na accumulators were orache and purslane. Barley showed significantly more accumulation in roots but not in the leaf tissues. The largest accumulator of Na and Cl in stem tissues was purslane.
Due to low Cl concentrations in all plant tissue compared to Na, total uptake was calculated for Na only. No differences in root total Na uptake were detected between species or salinity treatment (pNa species × salinity treatment = 0.240; Table 3). Total Na uptake was highest in purslane and orache stems at 3 and 6 dS m−1. Orache leaves took up the most Na followed by barley and purslane. Saltbush, saltwort, and wheat took up the least amount of Na (Table 3). Saltbush and saltwort also accumulated the least biomass over the course of the study (Appendix Table A1).
With regards to soil EC during the greenhouse evaluation (Phase I) of the study, our data indicate that (prior to saline irrigation), soil EC for soils subjected to the 3 dS m−1 salt treatment was lower when barley and orache were planted compared to the day of initial irrigation (Figure 2). The soil EC was least impacted at the 6 dS m−1 treatment level in purslane, followed by wheat, saltwort, barley, orache and saltbush plantings.
Overall, garden orache and purslane performed the best in the greenhouse evaluation of halophytes and were selected as the most likely to do well when intercropped with watermelon in the field trial. Furthermore, the growth habits, poor vigor, and slow growth rate of saltwort and saltbush led to the decision that they would not be ideal in a field trial with watermelon. Therefore, the field trial was conducted with watermelon, purslane and orache.
3.2. Phase II: Field Intercropping Trial
Total monthly precipitation and monthly mean temperatures for the field portion of the evaluation are presented in Table 4. Salinity and intercropping treatment had no impact on plant water status within each measurement date (Table 5); however, by the mid-August measurement, plants were significantly more stressed than they were in June or July (Table 6). It is not known if this stress was a result of salinity, temperatures, a combination of these factors, or other unknowns.
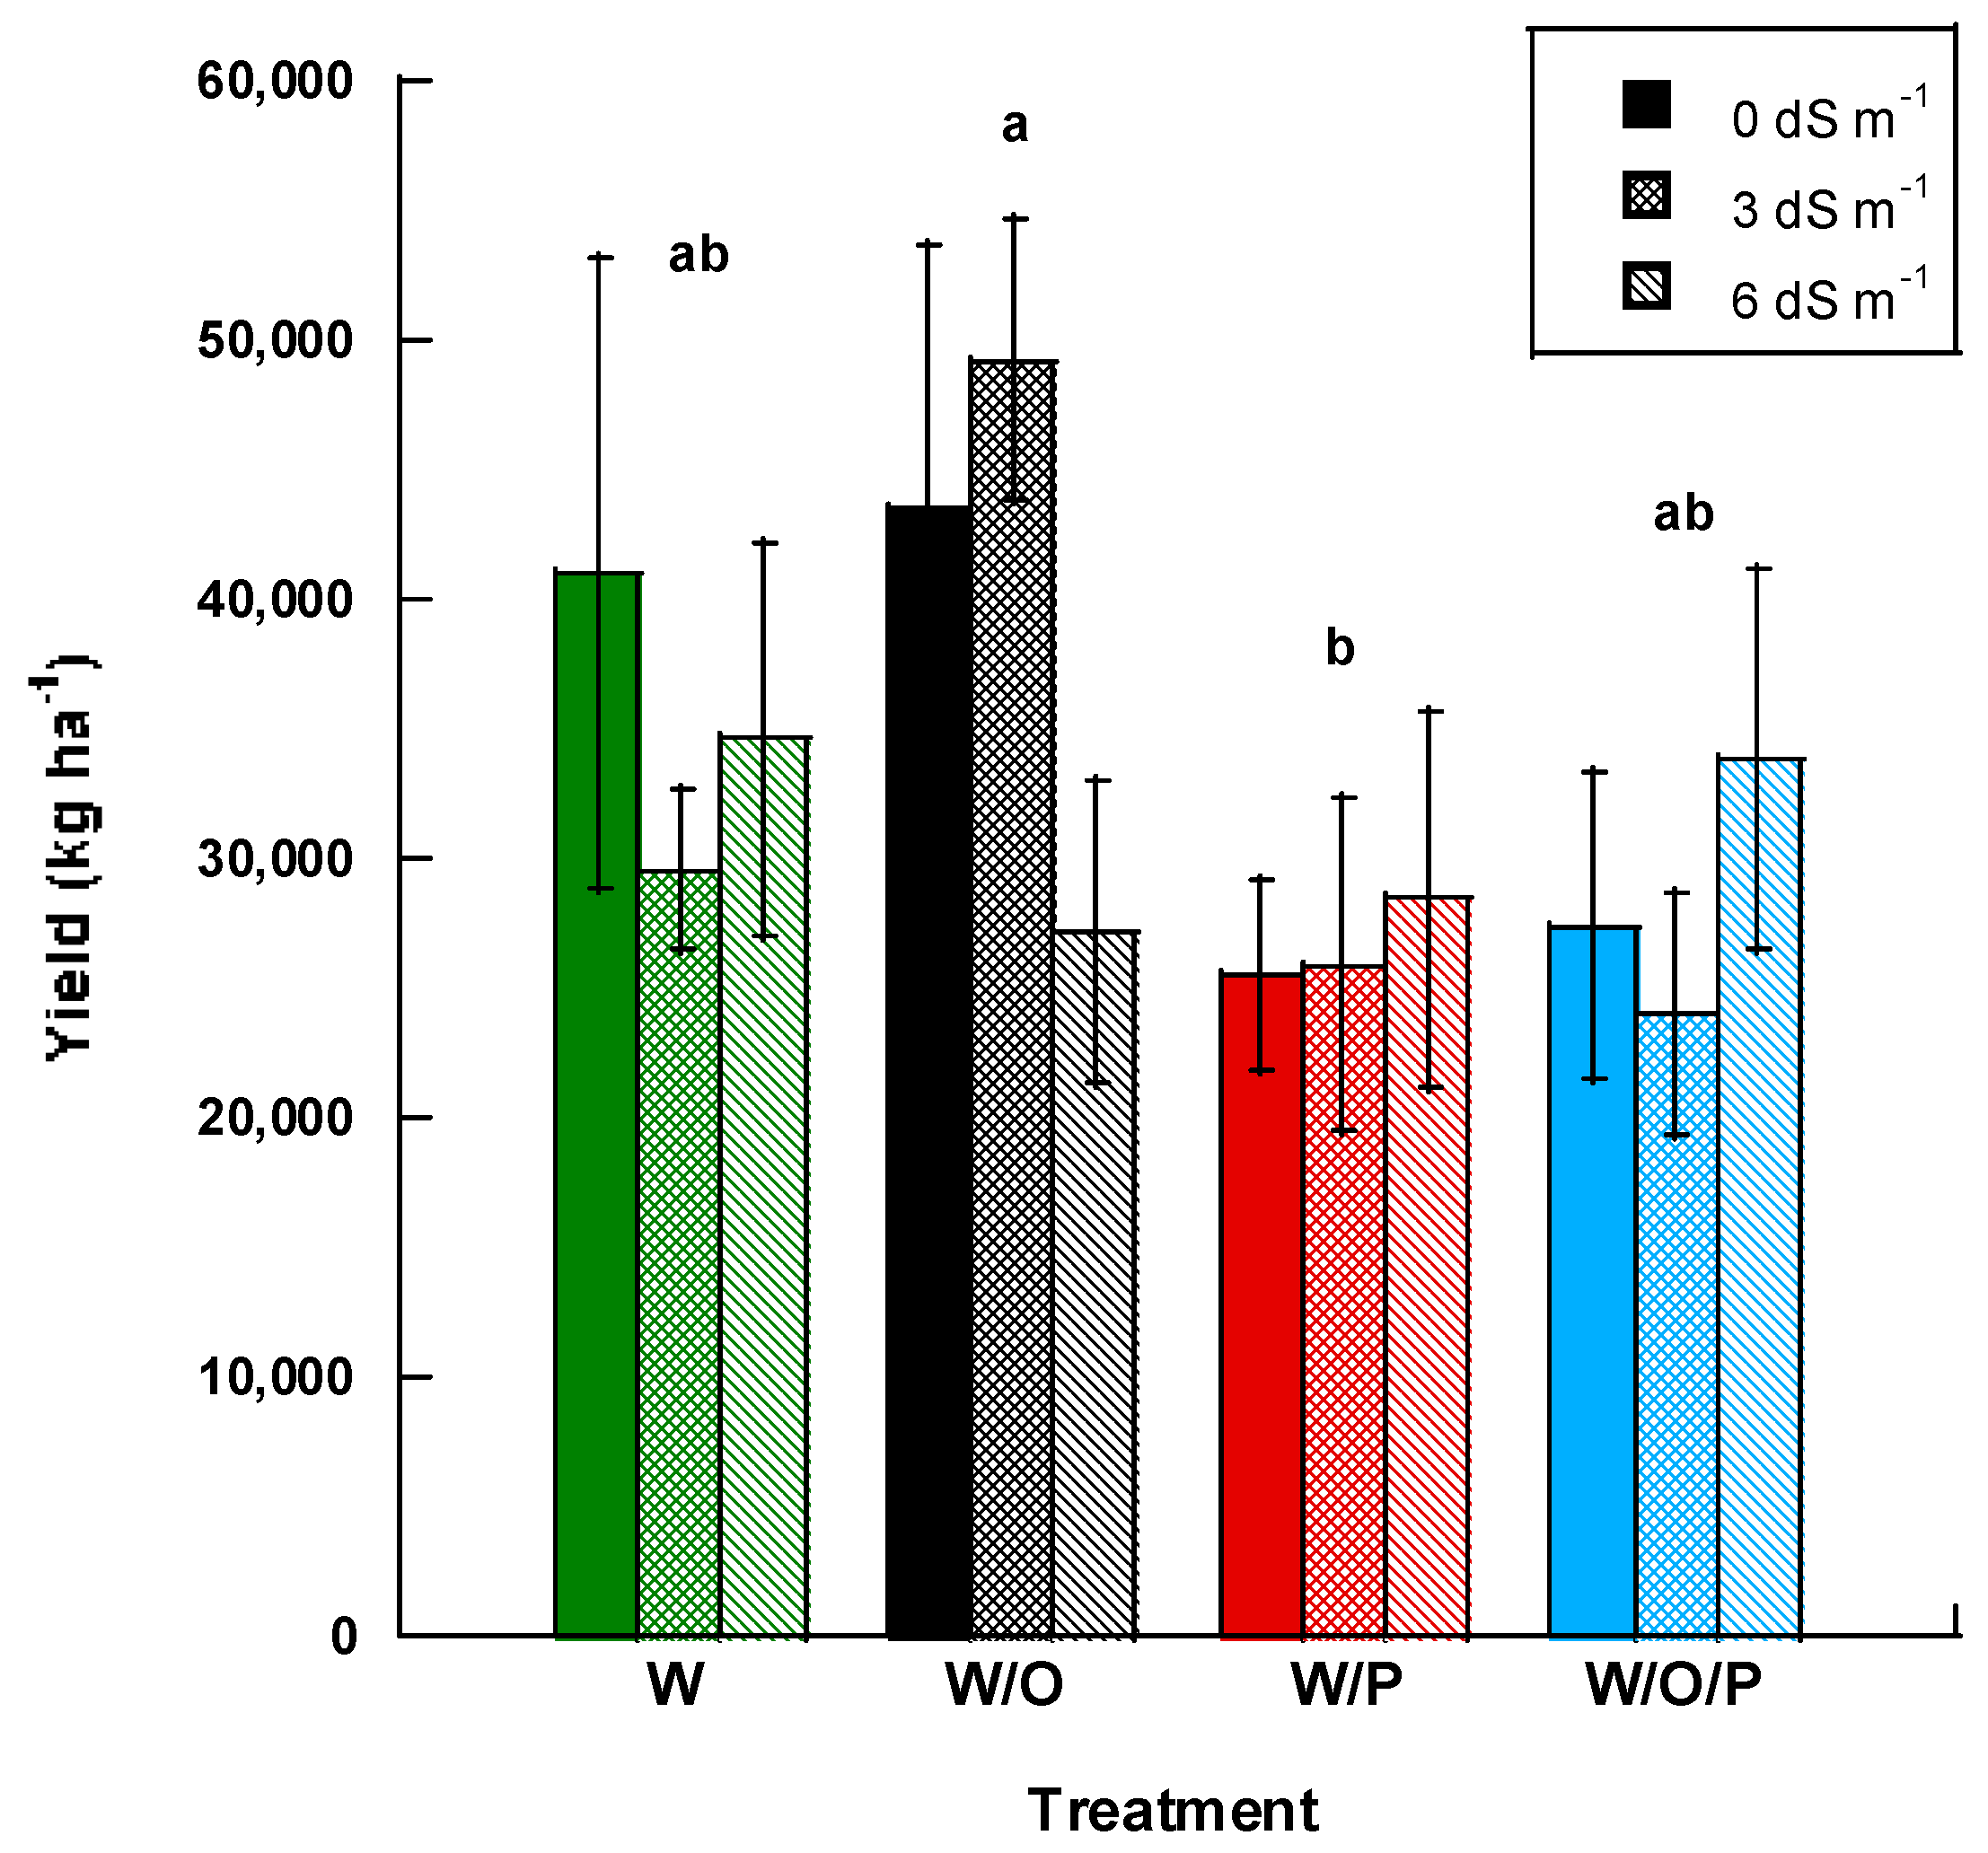
Yield was combined for all three harvest dates and data were evaluated according to salinity and intercropping treatments. Intercropping treatments showed significant differences (p ≤ 0.10) with watermelon/orache (W/O) having greater yields at 40,000 kg ha−1. This was followed by watermelon in monocrop (W) which had the next highest yields at 35,000 kg ha−1, then the watermelon/orache/purslane (W/O/P) at 28,000 kg ha−1, and watermelon/purslane (W/P) at 26,000 kg ha−1 (Figure 3). Salinity treatment alone had no significant effect on fruit yield (p = 0.797) and there was no interaction effect of salinity and treatment (p = 0.483).
All watermelon brix values were between 10 and 12, which are within the standard range of values for marketable watermelons (Table 7). Salinity and intercropping treatment did not have a significant effect on brix or any other watermelon quality parameters measured, however.
Soil nutrient concentrations EC, Na and Cl were analyzed prior to planting and after harvest; soil to evaluate potential salinization and determine if halophytes were effective in salt removal. Soil EC, Na, and Cl content of soils increased after irrigation with saline water (p < 0.0001). Salinity treatments had a significant effect on soil EC, but halophytes did not have a significant impact on soil EC (phalophyte = 0.245, psalinity = 0.001; Table 8). As expected, the 3 and 6 dS m−1 treatments had higher EC than the 0 dS m−1 treatment.
4. Discussion
The greenhouse evaluation of halophytes showed marked differences depending upon the criteria between each of the six species. While little research has been conducted on intercropping with halophytes to remove salts, we found that these six species (Table 1) had varying degrees of salt removing capacity as well as having other potentially marketable qualities by which they were selected. The greenhouse evaluation showed that garden orache and purslane had the highest growth rates when compared to the other species, with orache having the highest growth rate at the 6 dS m−1 treatment level followed closely by purslane (Figure 1). These results are similar to those found by Kiliç et al. [34] who discovered that purslane could remove significant amounts of Na at irrigation salinities of up to 6.5 dS m−1 with minimal growth or biomass reduction. Similarly, Rozema et al. [35] found that a related orache species (Atriplex prostrata Boucher ex DC.) was an extremely efficient Na accumulator. Furthermore, several other Atriplex species have been shown to accumulate significant amounts of Na and Cl in saline conditions, increasing the likelihood of success of intercropping with garden orache to remove salts in the rootzone [31,36,37]. Results from RGR RR showed that, when compared to the 0 dS m−1 control, orache and saltwort showed the only positive growth at 3 dS m−1 and at 6 dS m−1 orache was the only species that showed a RGR RR above 1 (Figure 1). Tissue analysis revealed the partitioning of Na and Cl ions was variable amongst the evaluated species and differed by salinity treatments (Table 3). Overall, Na was accumulated at much higher rates than Cl in any of the plant tissues, indicating that Na was most likely the element which impacted plant growth in this experiment. The majority of Na and Cl ions were accumulated in leaves followed by stems then roots, suggesting ions may be removed from salt-affected sites by harvesting leaf tissue. While tissue accumulation varied by tissue, species, and salinity treatment; orache and purslane were able to accumulate more ions in these tissues than the other species evaluated. Contrary to what was observed by Zuccarini [26], who found that purslane performed better than orache, we found that orache was a more effective accumulator of Na. Of the species tested, purslane and garden orache showed the most promise in salt uptake and efficiency potential in a greenhouse setting. The remaining four species (barley, four-wing saltbush, sorghum, and saltwort) showed lower salt accumulation in tissues, incompatible growth habit, or overall slow growth when compared to purslane and orache.
The potential benefits of selected halophytes and the practicality of their implementation were taken into consideration when choosing which halophytes were to be used in the field trial. We found that saltwort was not acceptable in an intercropping system due to its low growth habit and vigor. Other species of saltwort such as Salsola soda have provided mixed results in intercropping studies, sometimes out-competing the main crop for nutritional resources, but often leading to increased growth of the companion plant due to Na absorption [26,27,38,39]. Four-wing saltbush had a slow growth rate and would not be practical in an annual cropping system. However, other species of Atriplex (A. hortensis, A. halimus, etc.), may be viable options for future intercropping studies [26,28]. Barley has been found to be moderately halophytic with some variation amongst cultivars [30,40]. While barley performed well in the greenhouse evaluation, it was not as effective at accumulating salts as orache and there were concerns that its seasonal growth requirements, i.e., it would reach maturity and be cultivated by late spring or early summer, would not be suitable for intercropping with watermelon. Despite this, future research should consider using barley in field trials as many watermelon producers utilize small grain crops as windbreaks to prevent damage to recently transplanted watermelon seedlings (Stephen King, personal communication) and barley accumulated Na at levels comparable to purslane in the greenhouse experiment.
The results from the field study suggest purslane and orache had little effect on salt removal from soils under the conditions experienced in this preliminary study. While orache and purslane performed well in greenhouse trials, results from the field experiment were inconclusive. Halophyte intercropping treatments had no significant effects on plant water status, fruit quality, or soil EC. Salinity had no effect on watermelon plant water status, yield, or fruit quality. Despite watermelon plant water status not indicating significant stress between treatments or salinity applications, there was an increase in plant stress status from June to August. These findings are fairly typical due to plant age and increased temperatures over the growing season. The lack of impact of salinity or intercropping treatment on plant water status indicates that there was little to no osmotic stress during the time of production which is reflected in the soil EC data (Table 8). This could imply that the supplemental irrigation was in excess of plant requirements, above average rainfall leached excess salts from the rootzone, accumulated salinity did not reach levels which would induce watermelon stress, or a combination of these factors. Halophyte intercropping treatments did, however, have a significant effect on yield with the greatest yields harvested from the watermelon–orache treatment and the lowest yields harvested from the watermelon–purslane treatment. There is conflicting information on purslane’s effectiveness in intercropping systems; Qasem [41] found that purslane is an effective nutrient competitor and therefore decreased tomato crop yields while Zuccarini [26] found that purslane increased tomato yield compared to Salsola soda. Our findings suggest that purslane could have outcompeted watermelon for nutrients which resulted in the yield reduction seen in Figure 3. In addition, intercropping systems that include crops of different growth forms often result in a dense canopy that can lead to competition for light [42]. It is also possible that increased competition for light with purslane resulted in reduced watermelon yields. Visual observations of the site would support that theory, as purslane exhibited vigorous growth and self-seeded during the season (data not shown). Although self-seeded purslane volunteers were removed periodically, the original plants maintained more vigorous growth throughout the experiment compared to orache and even watermelon plants. Fruit quality was not affected by yield or salinity which shows promise for utilizing halophytes in future intercropping systems. We also found that soil Na concentrations increased proportionally to irrigation water salinity, but were not affected by halophyte treatment. Furthermore, the increase in soil EC was significant but did not increase to the levels at which they were applied or considered detrimental to plant growth. This could be attributed to sandy soils and leaching from above average rainfall experienced during the field trial.
5. Conclusions
Overall, these experiments have shown that selected halophytes have the potential to be successfully used in a watermelon intercropping system. We have also shown that halophytes have potential to take up and sequester salts from soils and their immediate environment and that an intercropping system may not affect yields but could, in fact, increase watermelon yields in certain cases. While we did not harvest halophytes for their marketable tissues (i.e., leaves in the case of garden orache and leaves and stems in purslane), these halophytes also have the potential to introduce a value-added product as well as introduce diversity into an annual watermelon crop rotation. Although these results are promising, a shortcoming of this experiment is that it was conducted over only one growing season. Due to funding limitations and the one-year cycle of the supporting grant, only one year of research could be conducted. Additional long-term studies should be conducted to evaluate which halophytes are best suited to environmental conditions in various regions over a longer period.
Acknowledgments
The authors would like to thank Gregory Scott Kunkle and Ryan Manthei for their assistance in data collection and field work. This work was supported by the Texas Department of Agriculture Specialty Crop Block Grant Program (grant number SCFB-1213-019).
Author Contributions
Catherine R. Simpson conceived the experiment. Catherine R. Simpson and Jose G. Franco designed and performed the experiments, analyzed the data, and wrote the paper. Stephen R. King contributed to the design and field plot establishment. Astrid Volder contributed to the design, analysis, and editing of the paper.
Conflicts of Interest
The authors declare no conflict of interest.
Appendix A

Table A1.
Plant biomass (dry; g) for each species as affected by salinity treatment.
| Tissue * | Species | 0 dS m−1 | 3 dS m−1 | 6 dS m−1 |
|---|---|---|---|---|
| Leaves | Saltbush | 0.87 fgh | 1.87 defg | 1.43 efgh |
| Barley | 5.61 bc | 6.81 ab | 7.33 a | |
| Wheat | 5.24 c | 2.96 d | 5.67 bc | |
| Orache | 2.06 def | 2.40 de | 2.51 de | |
| Purslane | 2.06 def | 2.17 def | 1.63 defgh | |
| Saltwort * | 0.33 h | 0.60 gh | 0.32 h | |
| pSpecies×salinity = 0.014 | ||||
| Stems | Saltbush | 0.24 c | 0.67 c | 0.36 c |
| Orache | 1.84 b | 2.51 b | 2.42 b | |
| Purslane | 2.70 b | 4.48 a | 2.16 b | |
| pSpecies×salinity = 0.041 | ||||
| Roots | Saltbush | 0.22 | 0.39 | 0.37 |
| Barley | 3.75 | 3.09 | 3.35 | |
| Wheat | 3.44 | 4.26 | 3.82 | |
| Orache | 1.20 | 1.67 | 1.78 | |
| Purslane | 0.99 | 1.02 | 0.85 | |
| pSpecies×salinity = 0.865 | ||||
| Total plant | Saltbush | 1.32 | 2.94 | 2.16 |
| Barley | 9.36 | 9.90 | 10.68 | |
| Wheat | 8.68 | 7.22 | 9.49 | |
| Orache | 5.10 | 6.57 | 6.71 | |
| Purslane | 5.75 | 7.67 | 4.63 | |
| Saltwort * | 0.33 | 0.60 | 0.32 | |
| pSpecies×salinity = 0.353 | ||||
* All saltwort tissues were combined for analyses due to low overall biomass. Aboveground. Tissues made up a large proportion of biomass; therefore, data are presented as leaf tissue. All aboveground biomass (leaves and stems) were combined for barley and wheat, and displayed as leaf tissue.
References
- Wedekind, L. Saline soils: Salt of the Earth. Available online: http://www.iaea.org/newscenter/features/salinesoil/saline_part05.shtml (accessed on 10 October 2014).
- United States Department of the Interior. Quality of Water Colorado River Basin; United States Department of the Interior: Washington, DC, USA, 2005. [Google Scholar]
- Scanlon, B.R.; Jolly, I.; Sophocleous, M.; Zhang, L. Global impacts of conversions from natural to agricultural ecosystems on water resources: Quantity versus quality. Water Resour. Res. 2007, 43. [Google Scholar] [CrossRef]
- NASS. Land in Farms, Harvested Cropland, and Irrigated Land, by Size of Farm: 2012 and 2007; NASS: Burr Ridge, IL, USA, 2012. [Google Scholar]
- Pitman, M.; Läuchli, A. Global impact of salinity and agricultural ecosystems. In Salinity: Environment–Plants–Molecules; Lauchli, A., Luttge, U., Eds.; Kluwer Academic Publisher: Norwell, MA, USA, 2002; pp. 1–51. [Google Scholar]
- Flowers, T.J. Improving crop salt tolerance. J. Exp. Bot. 2004, 55, 307–319. [Google Scholar] [CrossRef] [PubMed]
- Ghassemi, F.; Jakeman, A.J.; Nix, H.A. Salinisation of Land and Water Resources : Human Causes, Extent, Management and Case Studies; Ghassemi, F., Jakeman, A.J., Nix, H.A., Eds.; University of New South Wales Press: Sydney, Australia, 1995; ISBN 0868401986. [Google Scholar]
- McCoy, T. Evaluation of Ground-Water Resources in the Lower Rio Grande Valley, Texas; Texas Water Development Board: Austin, TX, USA, 1990. [Google Scholar]
- Michelsen, A.; McGuckin, T.; Sheng, Z. Rio Grande Salinity Management Program: Preliminary Economic Impact Assessment; Texas A&M System: El Paso, TX, USA, 2009. [Google Scholar]
- Storey, R. Salt Tolerance, Ion Relations and the Effect of Root Medium on the Response of Citrus to Salinity. Aust. J. Plant Physiol. 1995, 22, 101–114. [Google Scholar] [CrossRef]
- Storey, R.; Walker, R. Citrus and salinity. Sci. Hortic. 1998, 78, 39–81. [Google Scholar] [CrossRef]
- Tozlu, I.; Guy, C.; Moore, G. Tolerance mechanisms to salinity stress in Citrus and Poncirus. In Proceedings IS on Salination for Horticultural Production; International Society for Horticultural Sciences: Leuven, Belgium, 2002; pp. 271–282. [Google Scholar]
- De La Fuente, E.B.; Suárez, S.A.; Lenardis, A.E.; Poggio, S.L. Intercropping sunflower and soybean in intensive farming systems: Evaluating yield advantage and effect on weed and insect assemblages. NJAS Wageningen J. Life Sci. 2014, 70, 47–52. [Google Scholar] [CrossRef]
- Bantie, Y.B.; Abera, F.A.; Woldegiorgis, T.D. Competition Indices of Intercropped Lupine (Local) and Small Cereals in Additive Series in West Gojam, North Western Ethiopia. AJPS 2014, 5, 1296–1305. [Google Scholar] [CrossRef]
- Machado, S. Does intercropping have a role in modern agriculture? J. Soil Water Conserv. 2009, 64, 55A–57A. [Google Scholar] [CrossRef]
- Hauggaard-Nielsen, H.; Ambus, P.; Jensen, E.S. Interspecific competition, N use and interference with weeds in pea-barley intercropping. Field Crop. Res. 2001, 70, 101–109. [Google Scholar] [CrossRef]
- Franco, J.G.; King, S.R.; Masabni, J.G.; Volder, A. Plant functional diversity improves short-term yields in a low-input intercropping system. Agric. Ecosyst. Environ. 2015, 203, 1–10. [Google Scholar] [CrossRef]
- Vandermeer, J.H. The Ecology of Intercropping. John Vandermeer; Cambridge University Press: Cambridge, UK; New York, NY, USA, 1989; ISBN 0521345928. [Google Scholar]
- Fukai, S.; Trenbath, B.R. Processes determining intercrop productivity and yields of component crops. Field Crop. Res. 1993, 34, 247–271. [Google Scholar] [CrossRef]
- Banik, P.; Midya, A.; Sarkar, B.K.; Ghose, S.S. Wheat and chickpea intercropping systems in an additive series experiment: Advantages and weed smothering. Eur. J. Agron. 2006, 24, 325–332. [Google Scholar] [CrossRef]
- Sobkowicz, P. Competition between triticale (Triticosecale Witt.) and field beans (Vicia faba var minor L.) in additive intercrops. Plant Soil Environ. 2006, 52, 47–54. [Google Scholar] [CrossRef]
- Brennan, E.B. Agronomic aspects of strip intercropping lettuce with alyssum for biological control of aphids. Biol. Control 2013, 65, 302–311. [Google Scholar] [CrossRef]
- Baumann, D.T.; Bastiaans, L.; Kropff, M.J. Competition and crop performance in a leek-celery intercropping system. Crop Sci. 2001, 41, 764–774. [Google Scholar] [CrossRef]
- Karlidag, H.; Yildirim, E. Strawberry Intercropping with Vegetables for Proper Utilization of Space and Resources. J. Sustain. Agric. 2009, 33, 107–116. [Google Scholar] [CrossRef]
- Albaho, M.S.; Green, J.L. Suaeda salsa, A Desalinating Companion Plant for Greenhouse Tomato. HortScience 2000, 35, 620–623. [Google Scholar]
- Zuccarini, P. Ion uptake by halophytic plants to mitigate saline stress in Solarium lycopersicon L., and different effect of soil and water salinity. Soil Water Res. 2008, 3, 62–73. [Google Scholar] [CrossRef]
- Graifenberg, A.; Botrini, L.; Giustiniani, L.; Filippi, F.; Curadi, M. Tomato growing in saline conditions with biodesalinating plants: Salsola soda L., and Portulaca oleracea L. Acta Hortic. 2003, 609, 301–305. [Google Scholar] [CrossRef]
- Kurdali, F. Growth and N 2 fixation in mixed cropping of Medicago arborea and Atriplex halimus grown on a salt-affected soil using a 15 N tracer technique. J. Plant Interact. 2010, 5, 37–44. [Google Scholar] [CrossRef]
- Kurdali, F.; Janat, M.; Khalifa, K. Growth and nitrogen fixation and uptake in Dhaincha/Sorghum intercropping system under saline and non-saline conditions. Commun. Soil Sci. Plant Anal. 2003, 34, 17–18. [Google Scholar] [CrossRef]
- Rawson, H.M.; Richards, R.A.; Munns, R. An examination of selection criteria for salt-tolerance in wheat, barley, and triticale genotypes. Aust. J. Agric. Res. 1988, 759–772. [Google Scholar] [CrossRef]
- Suaire, R.; Durickovic, I.; Framont-Terrasse, L.; Leblain, J.Y.; De Rouck, A.C.; Simonnot, M.O. Phytoextraction of Na+ and Cl− by Atriplex halimus L. and Atriplex hortensis L.: A promising solution for remediation of road runoff contaminated with deicing salts. Ecol. Eng. 2016, 94, 182–189. [Google Scholar] [CrossRef]
- Uygur, V.; Yetisir, H. Effects of Rootstocks on Some Growth Parameters, Phosphorous and Nitrogen Uptake Watermelon under Salt Stress. J. Plant Nutr. 2009, 32, 629–643. [Google Scholar] [CrossRef]
- Colla, G.; Roupahel, Y. Effect of salinity on yield, fruit quality, leaf gas exchange, and mineral composition of grafted watermelon plants. HortScience 2006, 41, 622–627. [Google Scholar]
- Kiliç, C.C.; Kukul, Y.S.; Anaç, D. Performance of purslane (Portulaca oleracea L.) as a salt-removing crop. Agric. Water Manag. 2008, 95, 854–858. [Google Scholar] [CrossRef]
- Rozema, E.R.; Gordon, R.J.; Zheng, Y. Plant Species for the Removal of Na+ and Cl− from Greenhouse Nutrient Solution. Hortscience 2014, 49, 1071–1075. [Google Scholar]
- Alharby, H.F.; Colmer, T.D.; Barrett-Lennard, E.G. Salt accumulation and depletion in the root-zone of the halophyte Atriplex nummularia Lindl.: Influence of salinity, leaf area and plant water use. Plant Soil 2014, 382, 31–41. [Google Scholar] [CrossRef]
- Mata-González, R.; Abdallah, M.A.B.; Trejo-Calzada, R.; Wan, C. Growth and leaf chemistry of Atriplex species from Northern Mexico as affected by salt stress. Arid Land Res. Manag. 2017, 31, 57–70. [Google Scholar] [CrossRef]
- Plaut, Z.; Edelstein, M.; Ben-Hur, M. Overcoming Salinity Barriers to Crop Production Using Traditional Methods. Crit. Rev. Plant Sci. 2013, 32, 250–291. [Google Scholar] [CrossRef]
- Colla, G.; Rouphael, Y.; Fallovo, C.; Caradrelli, M.; Graifenberg, A. Use of Salsola soda as a companion plant to improve greenhouse pepper (Capsicum annuum) performance under saline conditions. N. Z. J. Crop Hortic. Sci. 2006, 34, 283–290. [Google Scholar] [CrossRef]
- Wang, C.M.; Xia, Z.R.; Wu, G.Q.; Yuan, H.J.; Wang, X.R.; Li, J.H.; Tian, F.P.; Zhang, Q.; Zhu, X.Q.; He, J.J.; et al. The coordinated regulation of Na+ and K+ in Hordeum brevisubulatum responding to time of salt stress. Plant Sci. 2016, 252, 358–366. [Google Scholar] [CrossRef] [PubMed]
- Qasem, J.R. Nutrient accumulation by weeds and their associated vegetable crops. J. Hortic. Sci. 1992, 67, 189–195. [Google Scholar] [CrossRef]
- Franco, J.G.; King, S.R.; Volder, A. Component crop physiology and water use efficiency in response to intercropping. Eur. J. Agron. 2018, 93, 27–39. [Google Scholar] [CrossRef]
Figure 1.
Relative growth rate response ratio (RGR RR; height) of greenhouse-grown halophytes irrigated with 3 and 6 dS m−1 salt treatments. Species with RRs above 1 indicate positive growth when compared to their respective 0 dS m−1 control. Species with RRs ratios below 1 had lower growth rates than their respective 0 dS m−1 control. Different letters indicate statistically significant differences (p ≤ 0.05) in RGR RR between species as shown beside the legend.

Figure 2.
Percent change in soil electrical conductivity from the initial irrigation to the conclusion of the experiment (40 days) for each halophyte in the greenhouse experiment.
Figure 2.
Percent change in soil electrical conductivity from the initial irrigation to the conclusion of the experiment (40 days) for each halophyte in the greenhouse experiment.
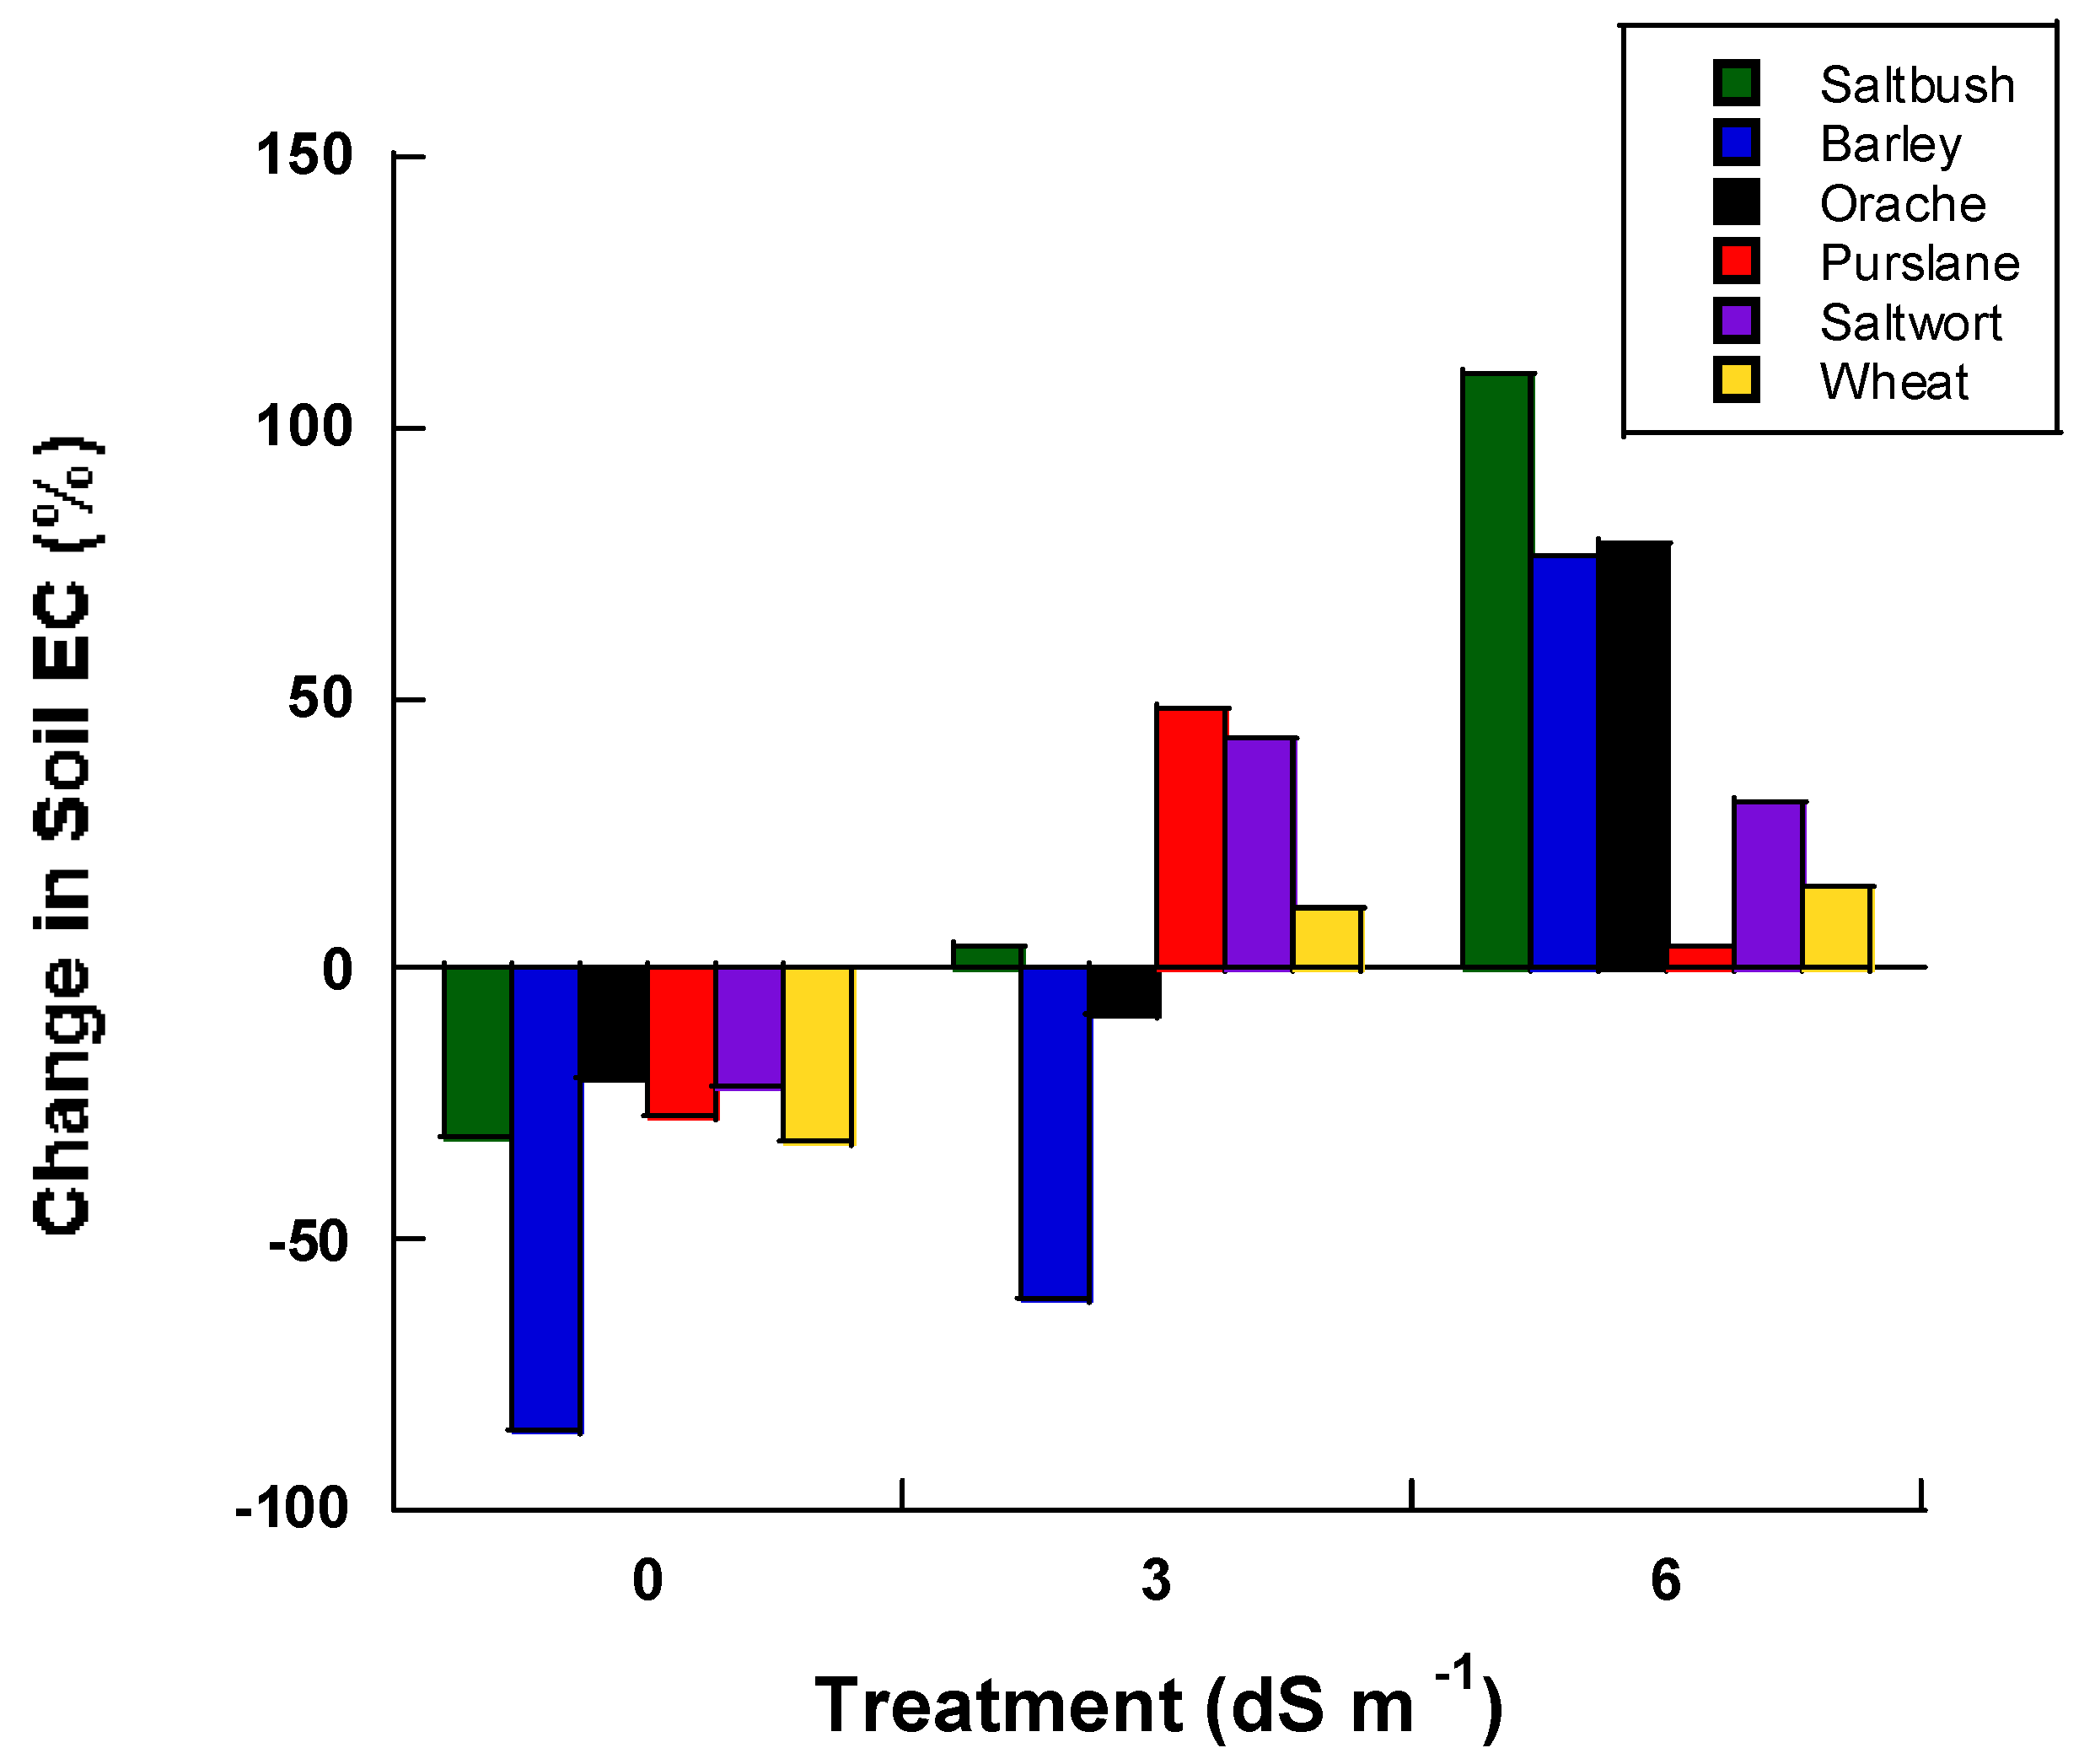
Figure 3.
Impact of intercropping and salinity treatments on field-grown watermelon yields. Watermelon intercropped with orache had the highest yields, while there was no effect of salinity. (ptreatment = 0.092). W, watermelon monoculture; W/O, watermelon intercropped with orache; W/P, watermelon intercropped with purslane; W/O/P, watermelon intercropped with orache and purslane. Different letters indicate statistical (p ≤ 0.10) between cropping combinations averaged across salinity treatments. Solid bars represent 0 dS m−1 treatments, crosshatched bars represent 3 dS m−1 treatments, and striped bars represent 6 dS m−1 treatments.

Table 1.
Halophyte crops selected for greenhouse evaluation and their potential benefits.
| Crop | Common Name | Growth form and Potential Added Value |
|---|---|---|
| Atriplex canescens | four-wing saltbush | Upright growth, windbreak, forage |
| Atriplex hortensis | garden orache | Low growing, human consumption, forage |
| Hordeum vulgare | barley | Upright growth, windbreak, human consumption, forage |
| Portulaca oleracea | purslane | Low prostrate, smother crop (weed suppression), forage |
| Salsola komarovii | saltwort | Low prostrate, smother crop (weed suppression), forage, biofuel |
| Triticum aestivum | wheat | Upright growth, windbreak, forage/feed crop |
Table 2.
Factors affecting Na and Cl concentrations in tissues of halophytes irrigated with saline water. Significance was tested at p = 0.05.
Table 2.
Factors affecting Na and Cl concentrations in tissues of halophytes irrigated with saline water. Significance was tested at p = 0.05.
| Test | Na | Cl |
|---|---|---|
| Prob > F | Prob > F | |
| Species | <0.001 | 0.071 |
| Salinity treatment | <0.001 | 0.016 |
| Species × salinity treatment | 0.014 | 0.903 |
| Tissue | 0.009 | <0.001 |
| Species × tissue | 0.001 | <0.001 |
| Salinity treatment × tissue | 0.297 | 0.014 |
| Species × salinity treatment × tissue | <0.001 | <0.001 |
Table 3.
Sodium and chloride concentrations of plant tissues for each species and in each treatment.
Table 3.
Sodium and chloride concentrations of plant tissues for each species and in each treatment.
| Tissue * | Species | Na (mg g−1) | Cl (mg g−1) | Total Na Uptake (mg) | ||||||
|---|---|---|---|---|---|---|---|---|---|---|
| 0 dS m−1 | 3 dS m−1 | 6 dS m−1 | 0 dS m−1 | 3 dS m−1 | 6 dS m−1 | 0 dS m−1 | 3 dS m−1 | 6 dS m−1 | ||
| Leaves | Saltbush | 0.90 j | 4.79 hi | 7.17 h | 0.0010 g | 0.0008 g | 0.0011 fg | 0.86 e | 10.19 e | 10.82 e |
| Barley | 4.43 hi | 10.54 g | 10.56 g | 0.0022 ef | 0.0029 de | 0.0033 cd | 25.26 cde | 76.93 b | 78.71 b | |
| Wheat | 0.44 j | 2.22 ij | 3.04 ij | 0.0013 fg | 0.0040 bc | 0.0052 a | 2.31 e | 6.32 e | 16.98 de | |
| Orache | 26.71 d | 61.40 b | 64.88 a | 0.0018 fg | 0.0036 bcd | 0.0039 bcd | 53.75 bc | 146.76 a | 163.69 a | |
| Purslane | 3.63 ij | 21.38 e | 34.69 c | 0.0045 ab | 0.0045 ab | 0.0056 a | 7.39 e | 46.40 bcd | 56.07 bc | |
| Saltwort | 3.49 ij | 15.30 f | 17.74 f | 0.0005 fg | 0.0008 fg | - | 1.17 e | 9.70 e | 5.53 e | |
| pspecies×salinity < 0.001 | pspecies×salinity < 0.001 | pspecies×salinity < 0.003 | ||||||||
| Stems | Saltbush | 0.34 f | 0.81 f | 0.43 f | 0.0006 ab | 0.0004 b | - | 0.07 c | 0.69 c | 0.15 c |
| Orache | 11.85 d | 24.03 c | 30.63 ab | 0.0002 c | 0.0004 b | 0.0004 b | 21.18 c | 60.99 b | 70.52 b | |
| Purslane | 5.83 e | 27.94 bc | 34.09 a | 0.0008 a | 0.0006 a | 0.0007 a | 16.19 c | 126.90 a | 73.17 b | |
| pspecies×salinity < 0.001 | pspecies×salinity < 0.001 | pspecies×salinity < 0.001 | ||||||||
| Roots | Saltbush | 4.18 c | 9.17 b | 13.72 ^ | - | 0.0003 | - | 0.80 | 3.06 | 5.02 |
| Barley | 6.31 bc | 13.27 a | 15.76 a | 0.0002 | 0.0002 | 0.0003 | 23.69 | 46.41 | 53.00 | |
| Wheat | 5.93 bc | 5.95 bc | 8.55 b | 0.0002 | 0.0003 | 0.0004 | 21.31 | 27.30 | 33.13 | |
| Orache | 7.79 b | 8.17 b | 8.57 b | 0.0004 | 0.0006 | 0.0008 | 10.04 | 13.45 | 14.42 | |
| Purslane | 5.86 bc | 14.68 a | 15.61 a | 0.0003 | 0.0005 | 0.0008 | 5.71 | 15.23 | 13.41 | |
| pspecies×salinity < 0.001 | pspecies×salinity = 0.054 | pspecies×salinity < 0.24 | ||||||||
* All saltwort tissues were combined for analyses due to low overall biomass. Aboveground tissues made up a large proportion of biomass; therefore, data are presented as leaf tissue. All aboveground biomass, leaves and stems, were combined for barley and wheat, and displayed as leaf tissue. ^ Only enough tissue was collected for one replication. Different letters represent differences between means within each plant tissue for Na or Cl (p ≤ 0.05).
Table 4.
Monthly and total growing season (May–September) precipitation and mean air temperatures for College Station, TX in 2013.
Table 4.
Monthly and total growing season (May–September) precipitation and mean air temperatures for College Station, TX in 2013.
| May | June | July | August | September | Total/Mean |
|---|---|---|---|---|---|
| Precipitation (mm) | |||||
| 100 | 29 | 21 | 15 | 148 | 313 |
| Mean air temperature (°C) | |||||
| 23 | 29 | 29 | 30 | 28 | 28 |
Weather data obtained from National Oceanic and Atmospheric Administration (https://www.ncdc.noaa.gov/cdo-web/; accessed 16 October 2017).
Table 5.
Watermelon pre-dawn and mid-day stem water potential (Ψ) conducted in mid-June, mid-July, and mid-August. Treatments, salinity levels, or treatments nested within salinity level within each measurement date were not significantly different (p ≤ 0.10). W, watermelon monoculture; W/O, watermelon–orache; W/P, watermelon–purslane; W/O/P, watermelon–orache–purslane.
| Month | Intercrop | Pre-Dawn Stem Ψ (Mpa) | Mid-Day Stem Ψ (Mpa) | ||||
|---|---|---|---|---|---|---|---|
| 0 dS m−1 | 3 dS m−1 | 6 dS m−1 | 0 dS m−1 | 3 dS m−1 | 6 dS m−1 | ||
| June | W | −0.79 | −0.75 | −1.13 | −1.00 | −1.42 | −1.25 |
| W/O | −0.71 | −1.30 | −0.88 | −1.33 | −1.04 | −1.17 | |
| W/P | −0.92 | −1.04 | −0.92 | −1.21 | −1.25 | −1.04 | |
| W/O/P | −0.67 | −1.04 | −0.96 | −1.00 | −1.04 | −1.08 | |
| psalinity(treatment) = 0.174 | psalinity(treatment) = 0.966 | ||||||
| July * | W | −1.96 | −1.46 | −1.58 | |||
| W/O | −1.38 | −1.54 | −2.29 | ||||
| W/P | −1.29 | −1.13 | −1.79 | ||||
| W/O/P | −1.42 | −1.75 | −2.17 | ||||
| psalinity(treatment) = 0.966 | |||||||
| August | W | −1.75 | −1.79 | −2.30 | −1.79 | −2.71 | −2.50 |
| W/O | −3.17 | −1.79 | −2.17 | −3.17 | −2.75 | −2.33 | |
| W/P | −2.33 | −2.42 | −1.83 | −2.42 | −2.92 | −2.38 | |
| W/O/P | −2.83 | −1.46 | −1.21 | −2.83 | −3.08 | −1.67 | |
| psalinity(treatment) = 0.499 | psalinity(treatment) = 0.101 | ||||||
* Pre-dawn stem water potential data not collected.
Table 6.
Watermelon pre-dawn and mid-day stem water potential (Ψ) averaged across treatments for each measurement date. Watermelon plants were more water stressed by mid-August as compared to June and July.
Table 6.
Watermelon pre-dawn and mid-day stem water potential (Ψ) averaged across treatments for each measurement date. Watermelon plants were more water stressed by mid-August as compared to June and July.
| Month | Pre-Dawn Stem Ψ (Mpa) | Mid-Day Stem Ψ (Mpa) |
|---|---|---|
| June | −0.92 b | −1.15 c |
| July * | −1.62 b | |
| August | −2.17 a | −2.54 a |
| pmonth < 0.001 | pmonth < 0.001 |
* Pre-dawn stem water potential not collected.
Table 7.
Fruit quality parameters as affected by cropping and salinity treatments. No statistically significant differences were detected between treatments, salinity levels, or treatments nested within salinity level (p ≤ 0.10). W, watermelon monoculture; W/O, watermelon–orache; W/P, watermelon–purslane; W/O/P, watermelon–orache–purslane.
| Measurement | Salinity | W | W/O | W/P | W/O/P |
|---|---|---|---|---|---|
| Fruit mass (kg) | 0 dS m−1 | 8.68 | 9.27 | 8.42 | 8.79 |
| 3 dS m−1 | 8.09 | 9.71 | 9.26 | 8.65 | |
| 6 dS m−1 | 9.19 | 8.46 | 9.41 | 10.52 | |
| psalinity(treatment) = 0.512 | |||||
| Brix (°) | 0 dS m−1 | 10.31 | 10.63 | 10.98 | 10.28 |
| 3 dS m−1 | 11.06 | 11.00 | 10.81 | 10.80 | |
| 6 dS m−1 | 10.64 | 10.75 | 11.02 | 11.10 | |
| psalinity(treatment) = 0.424 | |||||
| Firmness (N) | 0 dS m−1 | 1.89 | 1.90 | 0.99 | 1.21 |
| 3 dS m−1 | 1.28 | 1.28 | 0.98 | 1.28 | |
| 6 dS m−1 | 1.43 | 0.99 | 1.13 | 1.11 | |
| psalinity(treatment) = 0.355 | |||||
| Rind thickness (mm) | 0 dS m−1 | 13.37 | 14.25 | 13.09 | 11.97 |
| 3 dS m−1 | 12.41 | 14.31 | 15.46 | 13.25 | |
| 6 dS m−1 | 12.15 | 15.28 | 10.92 | 13.29 | |
| psalinity(treatment) = 0.667 | |||||
Table 8.
Prior to planting (pre-plant), post-harvest, and % change of soil conductivity, Na and Cl concentrations in watermelons and watermelons intercropped with halophytes. W, watermelon monoculture; W/O watermelon–orache, W/P; watermelon–purslane; W/O/P; watermelon–orache–purslane.
Table 8.
Prior to planting (pre-plant), post-harvest, and % change of soil conductivity, Na and Cl concentrations in watermelons and watermelons intercropped with halophytes. W, watermelon monoculture; W/O watermelon–orache, W/P; watermelon–purslane; W/O/P; watermelon–orache–purslane.
| Intercrop | Salinity | Pre-Plant | Post-Harvest | % Change | ||||||
|---|---|---|---|---|---|---|---|---|---|---|
| Conductivity | Na | Cl | Conductivity | Na | Cl | Conductivity | Na | Cl | ||
| (dS m−1) | (mg g−1) | (mg g−1) | (dS m−1) | (mg g−1) | (mg g−1) | (dS m−1) | (mg g−1) | (mg g−1) | ||
| W | 0 dS m−1 | 0.074 | 0.016 | 0.031 | 0.115 | 0.246 | 0.092 | 35.8 | 93.6 | 66.8 |
| 3 dS m−1 | 0.175 | 0.014 | 0.048 | 0.149 | 0.276 | 0.168 | 50.1 | 95.1 | 71.3 | |
| 6 dS m−1 | 0.079 | 0.009 | 0.047 | 0.160 | 0.270 | 0.081 | 50.5 | 96.6 | 41.8 | |
| W/O | 0 dS m−1 | 0.054 | 0.012 | 0.032 | 0.111 | 0.240 | 0.078 | 51.4 | 95.1 | 59.4 |
| 3 dS m−1 | 0.090 | 0.011 | 0.048 | 0.133 | 0.256 | 0.115 | 32.5 | 95.6 | 58.5 | |
| 6 dS m−1 | 0.084 | 0.009 | 0.062 | 0.162 | 0.283 | 0.074 | 48.3 | 96.8 | 15.5 | |
| W/P | 0 dS m−1 | 0.053 | 0.013 | 0.057 | 0.095 | 0.227 | 0.069 | 44.1 | 94.3 | 17.7 |
| 3 dS m−1 | 0.077 | 0.015 | 0.062 | 0.163 | 0.282 | 0.126 | 53.0 | 94.6 | 51.3 | |
| 6 dS m−1 | 0.087 | 0.011 | 0.045 | 0.153 | 0.277 | 0.074 | 43.5 | 96.2 | 39.6 | |
| W/O/P | 0 dS m−1 | 0.064 | 0.011 | 0.035 | 0.095 | 0.216 | 0.083 | 32.7 | 94.9 | 57.4 |
| 3 dS m−1 | 0.065 | 0.011 | 0.075 | 0.161 | 0.276 | 0.097 | 59.8 | 96.1 | 23.4 | |
| 6 dS m−1 | 0.081 | 0.011 | 0.053 | 0.157 | 0.272 | 0.082 | 48.4 | 96.1 | 35.8 | |
Conductivity, Na and Cl (psampling time < 0.001); Conductivity, Na and Cl (psalinity treatment < 0.001); Na (psampling time×salinity treatment < 0.001).
© 2018 by the authors. Licensee MDPI, Basel, Switzerland. This article is an open access article distributed under the terms and conditions of the Creative Commons Attribution (CC BY) license (http://creativecommons.org/licenses/by/4.0/).
Share and Cite
MDPI and ACS Style
Simpson, C.R.; Franco, J.G.; King, S.R.; Volder, A. Intercropping Halophytes to Mitigate Salinity Stress in Watermelon. Sustainability 2018, 10, 681. https://doi.org/10.3390/su10030681
AMA Style
Simpson CR, Franco JG, King SR, Volder A. Intercropping Halophytes to Mitigate Salinity Stress in Watermelon. Sustainability. 2018; 10(3):681. https://doi.org/10.3390/su10030681
Chicago/Turabian StyleSimpson, Catherine R., Jose G. Franco, Stephen R. King, and Astrid Volder. 2018. "Intercropping Halophytes to Mitigate Salinity Stress in Watermelon" Sustainability 10, no. 3: 681. https://doi.org/10.3390/su10030681
Note that from the first issue of 2016, this journal uses article numbers instead of page numbers. See further details here.