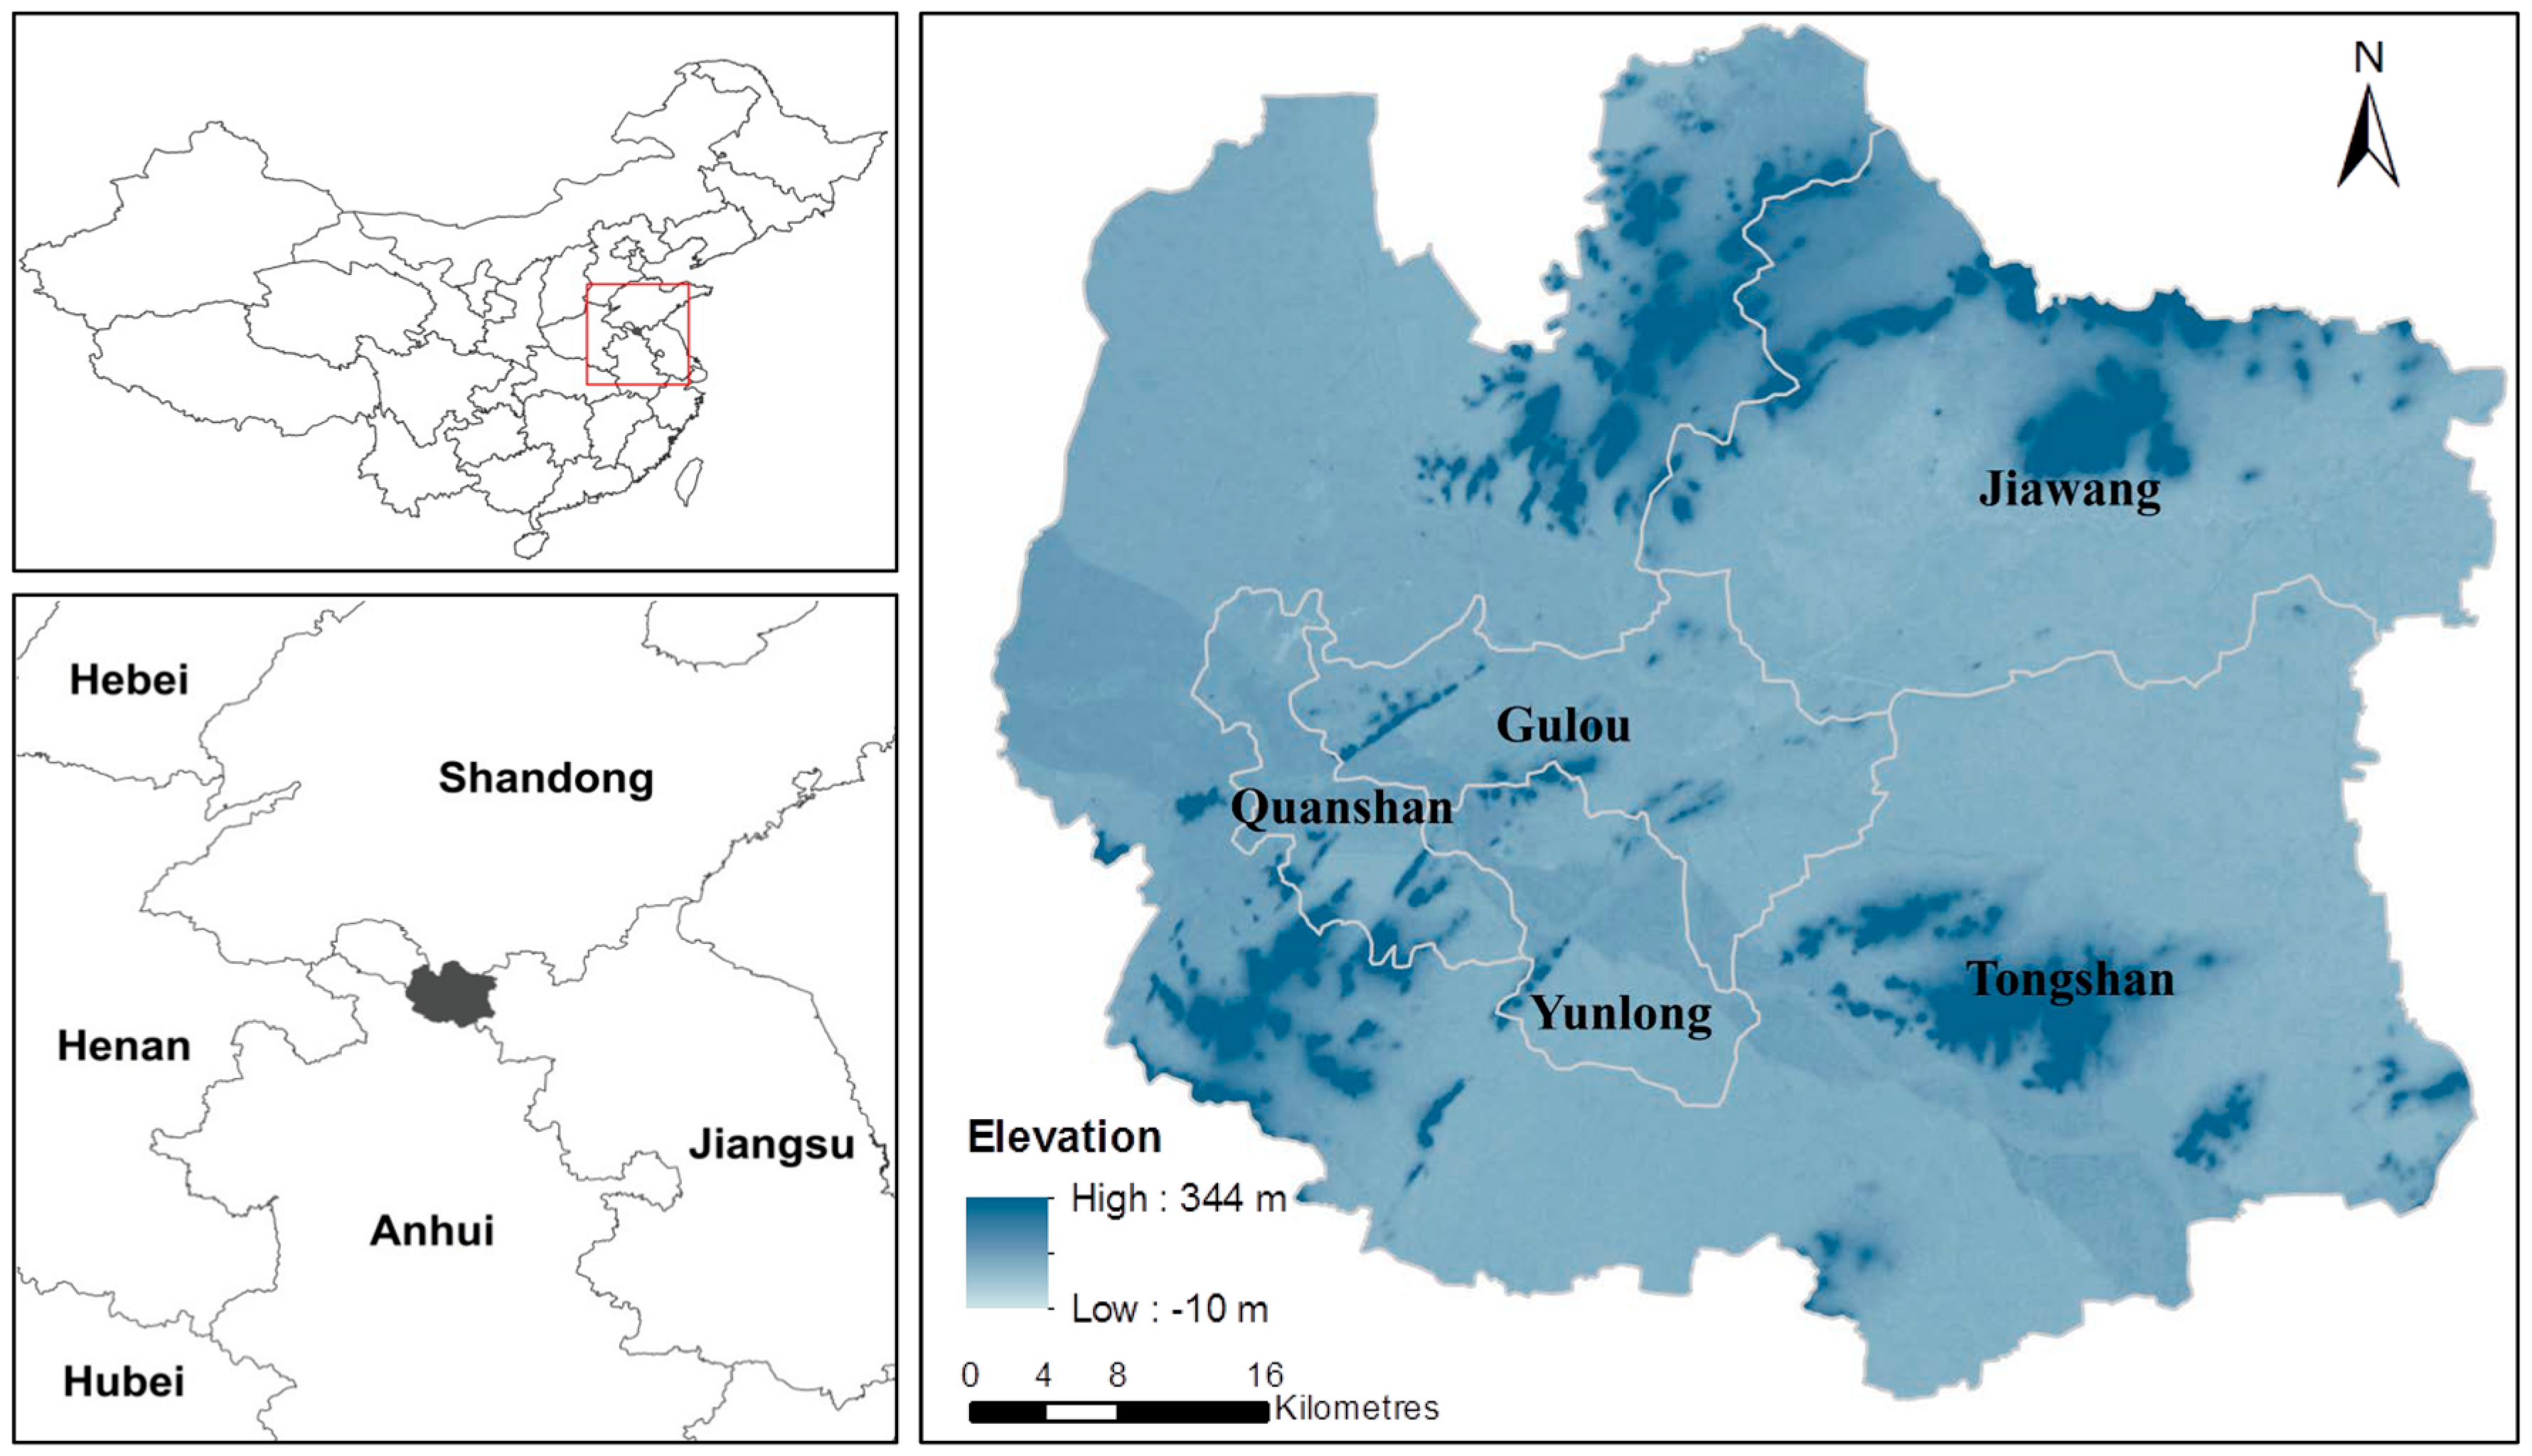
3.1. Urban Expansion in Xuzhou City from 2000 to 2025
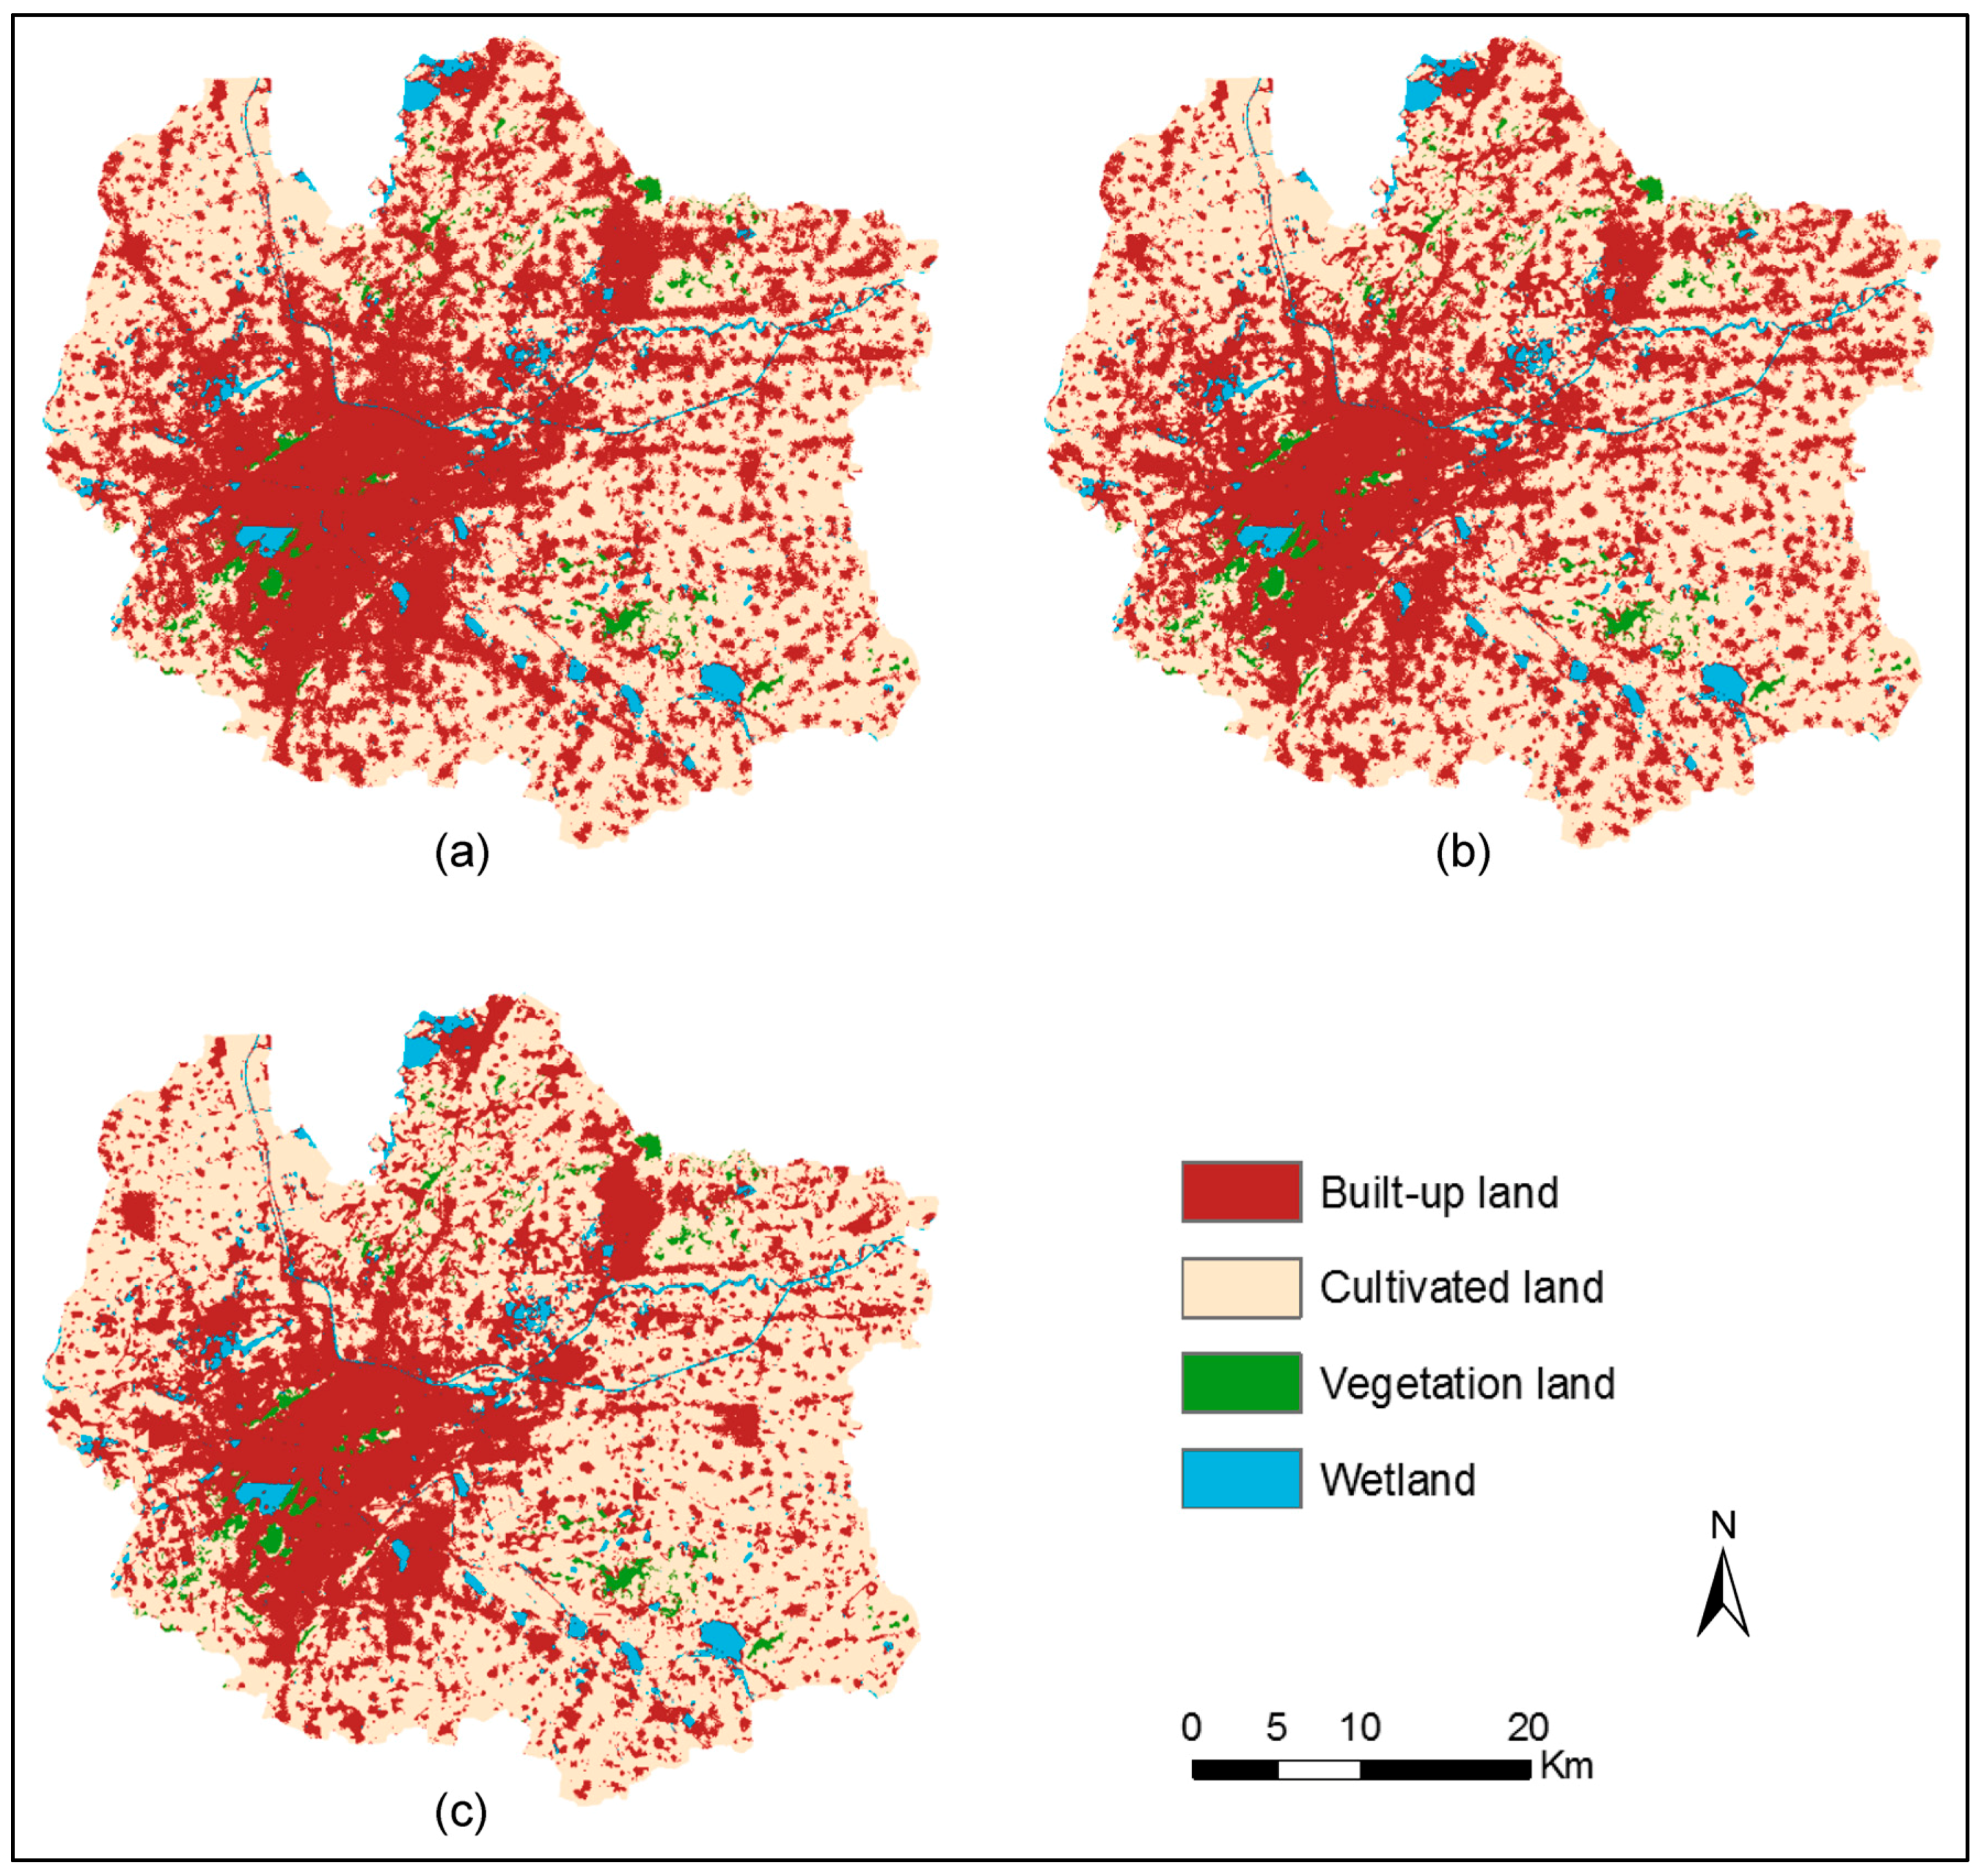
The multitemporal classified land cover maps for Xuzhou City are shown in
Figure 2. The areas of the land cover classes for the study period are presented in
Table 2. Xuzhou City experienced significant urban expansion, which led to the rapid growth of built-up land. The area of built-up land increased from 354 km
2 in 2000 to 916 km
2 in 2015. The annual growth area of built-up land increased from 15 km
2yr
−1 during 2000–2005 to 61 km
2yr
−1 during 2010–2015, which implies that the expansion rate grew over the study period in Xuzhou City. The pressure of rapid urban expansion was indicated by the reductions in cultivated and vegetation lands. Due to the conversion into built-up land, cultivated and vegetation lands correspondingly declined by 592.5 km
2 and 12.8 km
2, respectively. The majority of the new built-up land came from the conversion of cultivated land. In particular, 94.9%, 96.0%, and 99.9% of the growth of built-up land were from cultivated land during the periods of 2000–2005, 2005–2010, and 2010–2015, respectively. The wetland area increased from 51.12 km
2 to 94.72 km
2, which could be explained by the formation of waterlogged subsidence within the coal mining areas during 2000–2015.
In order to ensure the accuracy of the simulation of CA model, the calibration need to be conducted. In this study, trial and error, as well as logistic regression methods were applied to identify the optimal parameter values of CA model. Firstly, the spatial variable involved in Equation (5) was identified using the logistic regression method according to the historical land cover data. In addition, the neighborhood configuration the adjustment parameter was calibrated through the trial and error method, which can be conducted by running the CA model multiple times with different combinations of parameter values. The CA model was applied to reproduce the urban expansion process during the periods of 2000–2005, 2005–2010, and 2010–2015. The simulated land cover maps of 2005, 2010, and 2015 were compared with the observed land cover data. Kappa indexes are calculated based on a cell-by-cell comparison to quantify the accuracy of the simulation of the historical process. The combination of parameter values with highest Kappa index was identified for the period of 2000–2005, 2005–2010, 2010–2015, respectively. The estimated parameters for the study periods are listed in
Table 3. The kappa indexes of 2005, 2010, and 2015 were 0.865, 0.817, and 0.836, respectively, implying the reliability of the simulation results as well as the calibrated CA model.
The calibrated parameter configurations were adopted in the CA model, and the observed land cover map of 2015 was used as initial data. We simulated future urban expansion under the three scenarios (BAU, ECO, and PLS) aiming to predict alternative urban expansion patterns in 2025. According to the annual growth area of built-up land during 2000–2015, the future demand for built-up land under the BAU scenario by 2025 was projected. Under the ECO scenario, it was assumed that built-up land would reach 1160 km2 by 2025. Moreover, the demands for built-up land under the PLS scenario were estimated according to the master plan 2025 of Xuzhou City.
Figure 3 shows the simulated spatial patterns of land cover under the three urban expansion scenarios. The differences in the land cover spatial patterns due to the implementation of different development strategies can be visualized.
Under the BAU scenario, urban expansion is continuously concentrated around the core of Xuzhou City by 2025 because the future expansion process strictly follows the historical trend without any adjustments. At the same time, a large amount of built-up land continues to sprawl dramatically in the fringe and rural areas. Because of the increase in built-up land, the simulation result shows dramatic reductions in the vegetation and cultivated land areas. Under the ECO scenario, because the environmental and ecological constraints were included in the CA model, the simulation result indicates conversions into built-up land within the core of Xuzhou City. Moreover, the urban expansion in ecologically sensitive areas is restricted. The urban master plan of 2015–2025 aims to solve environmental problems, achieve coordinative development of urban-rural areas. As planned, new development hotspots are observed in the fringe and rural areas under the PLS scenario. By 2025, a large portion of the new built-up land is concentrated around the development hotspots that are established according to the master plan of Xuzhou City.
As indicated in
Table 4, the statistical data show that the built-up land area will increase from 915.74 km
2 in 2015 to 1289.97 km
2, 1160.84 km
2, and 1050.74 km
2 in 2025, with average annual growth areas of 37.4 km
2 yr
−1, 24.5 km
2 yr
−1, and 13.5 km
2 yr
−1 in the BAU, ECO, and PLS scenarios, respectively. The three scenarios show trends of continuous urban expansion; however, the rates of built-up land increases are different. Although most of the new built-up land comes from cultivated and vegetation lands, different contributions of cultivated and vegetation lands to the conversions to built-up land were observed under these scenarios. The area of cultivated land that was converted to built-up land accounts for 95.2%, 96.4%, and 97.0% of the new developed built-up land under the BAU, ECO, and PLS scenarios, respectively. The area of cultivated land in the PLS scenario is 1694.31 km
2, which is greater than the areas of cultivated land in the BAU and ECO scenarios. Moreover, the area of vegetation land under the ECO scenario is 6.51 km
2 larger than that in the BAU scenario and 0.02 km
2 larger than that in the PLS scenario.
3.3. Impacts of Future Urban Expansion on Carbon Storage from 2015 to 2025
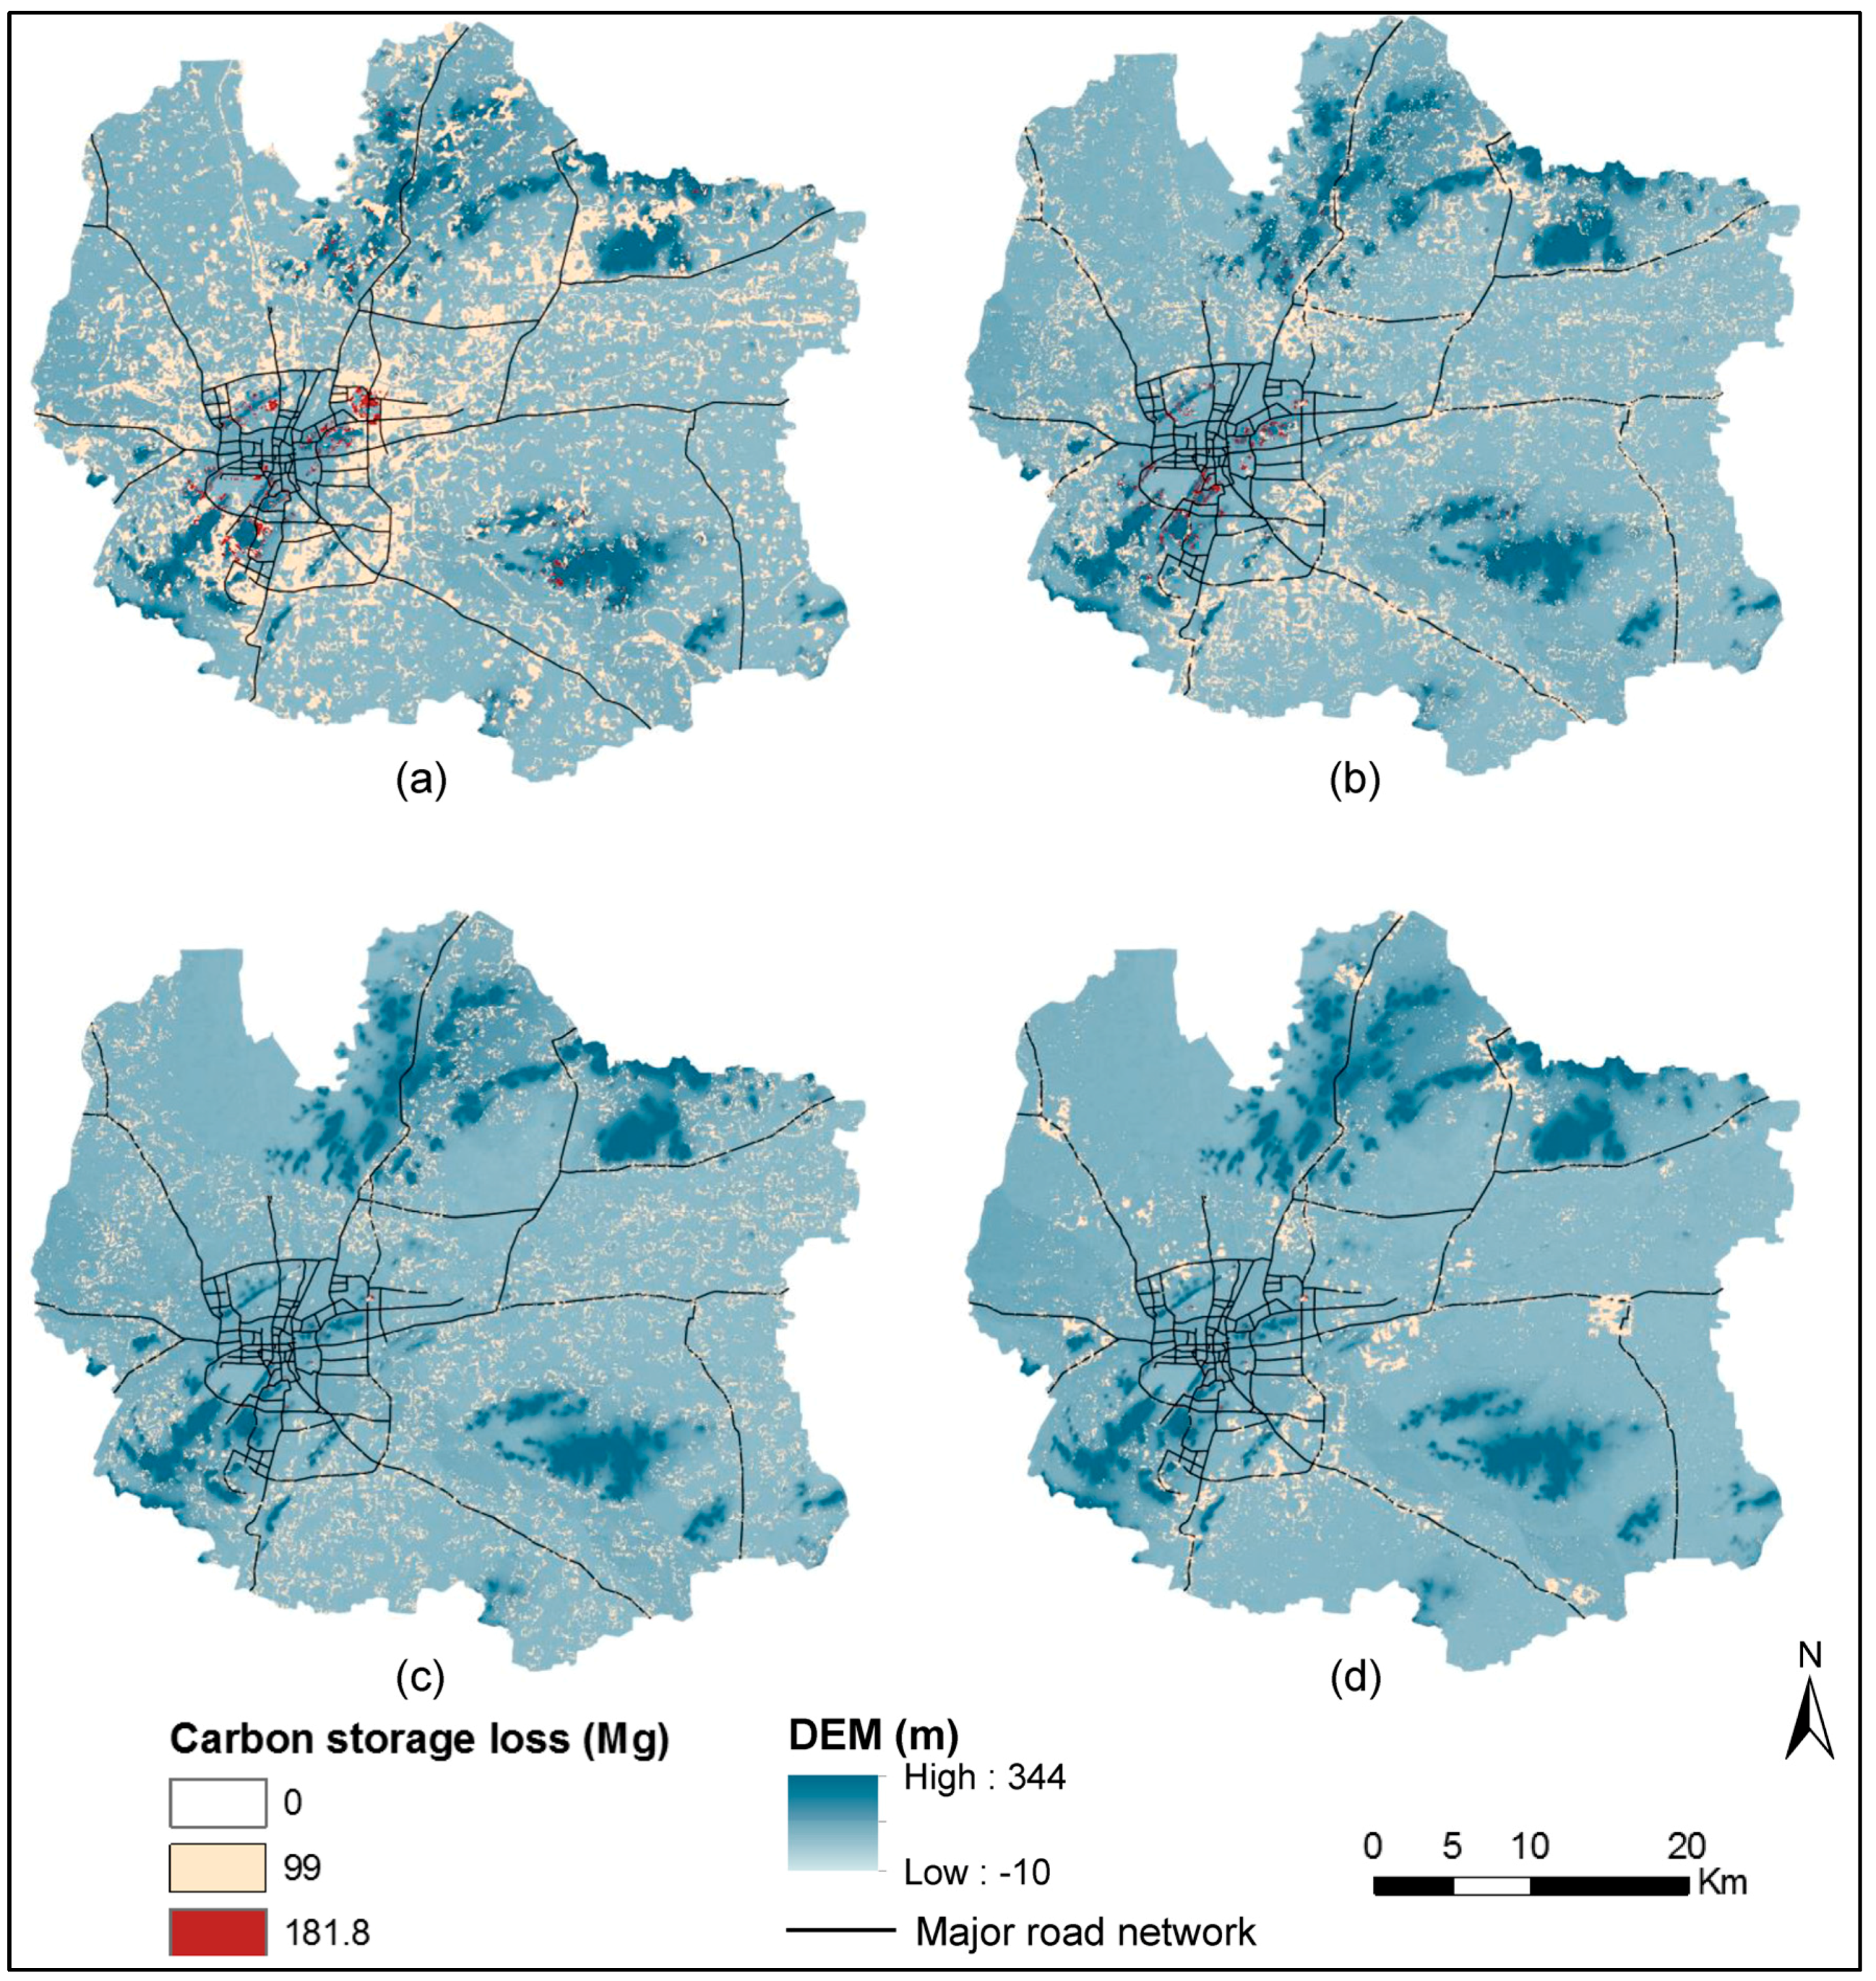
The carbon storage losses in Xuzhou City under the different scenarios were further compared and analyzed to explore the impacts of future urban expansion on carbon storage during 2015–2025 under three scenarios. The CA model was applied to simulate the three urban expansion scenarios by adopting various development policies. As shown in
Figure 4, these comparison results reveal that there are variations in the spatial patterns of carbon storage losses. Under the BAU scenario, significant losses in carbon storage were observed around the city core, which is consistent with the spatial distribution of historical carbon storage losses. Moreover, the area that experienced carbon storage loss moved towards the east, which is defined as the new district in Xuzhou City. Carbon storage losses can also be found along the major roads in scattered and irregular patches. In addition, new developments of built-up land lead to the creation of several small and fragmented patches of carbon storage loss in rural areas. Compared with the BAU scenario, urban expansion under the ECO scenario leads to a varied spatial distribution of carbon storage losses. Because of ecological constraints, carbon storage losses are prohibited within the environmentally and ecologically sensitive areas. Most of the carbon storage losses are concentrated within the fringe area where increase of built-up land decreases the carbon storage under the ECO scenario. There are also several isolated pixels and patches in rural areas. The carbon storage under the PLS scenario exhibited a greater increase than the other two scenarios. There are certain degrees of carbon storage loss around the new development hotspots as well as the city center because the other land cover types are forced to convert to built-up land in some of the areas.
As indicated in
Table 6, although continuous urban expansion could result in carbon storage loss from 2015–2025, the results imply that the amount of carbon storage loss varies under the different urban expansion scenarios. Under the BAU scenario, the decrease in carbon storage was greater than that in the other two scenarios. The changes from cultivated and vegetation lands to built-up land leads to carbon storage losses of 3.527 Tg and 0.126 Tg, accounting for 96.55% and 3.45% of the total storage loss in Xuzhou City, respectively. Under the ECO scenario, 236.19 km
2 of cultivated land was converted to built-up land, which resulted in a carbon storage loss of 2.338 Tg, representing 99.70% of the total carbon storage loss. Although the carbon storage in the PLS scenario is greater than that in the other two scenarios, the shrinkage of cultivated land leads to a carbon storage loss of 1.297 Tg, accounting for 99.39% of the total loss. The decreases in SOC lead to carbon storages of 3.383 Tg, 2.192 Tg, and 1.218 Tg under the BAU, ECO, and PLS scenarios, respectively.
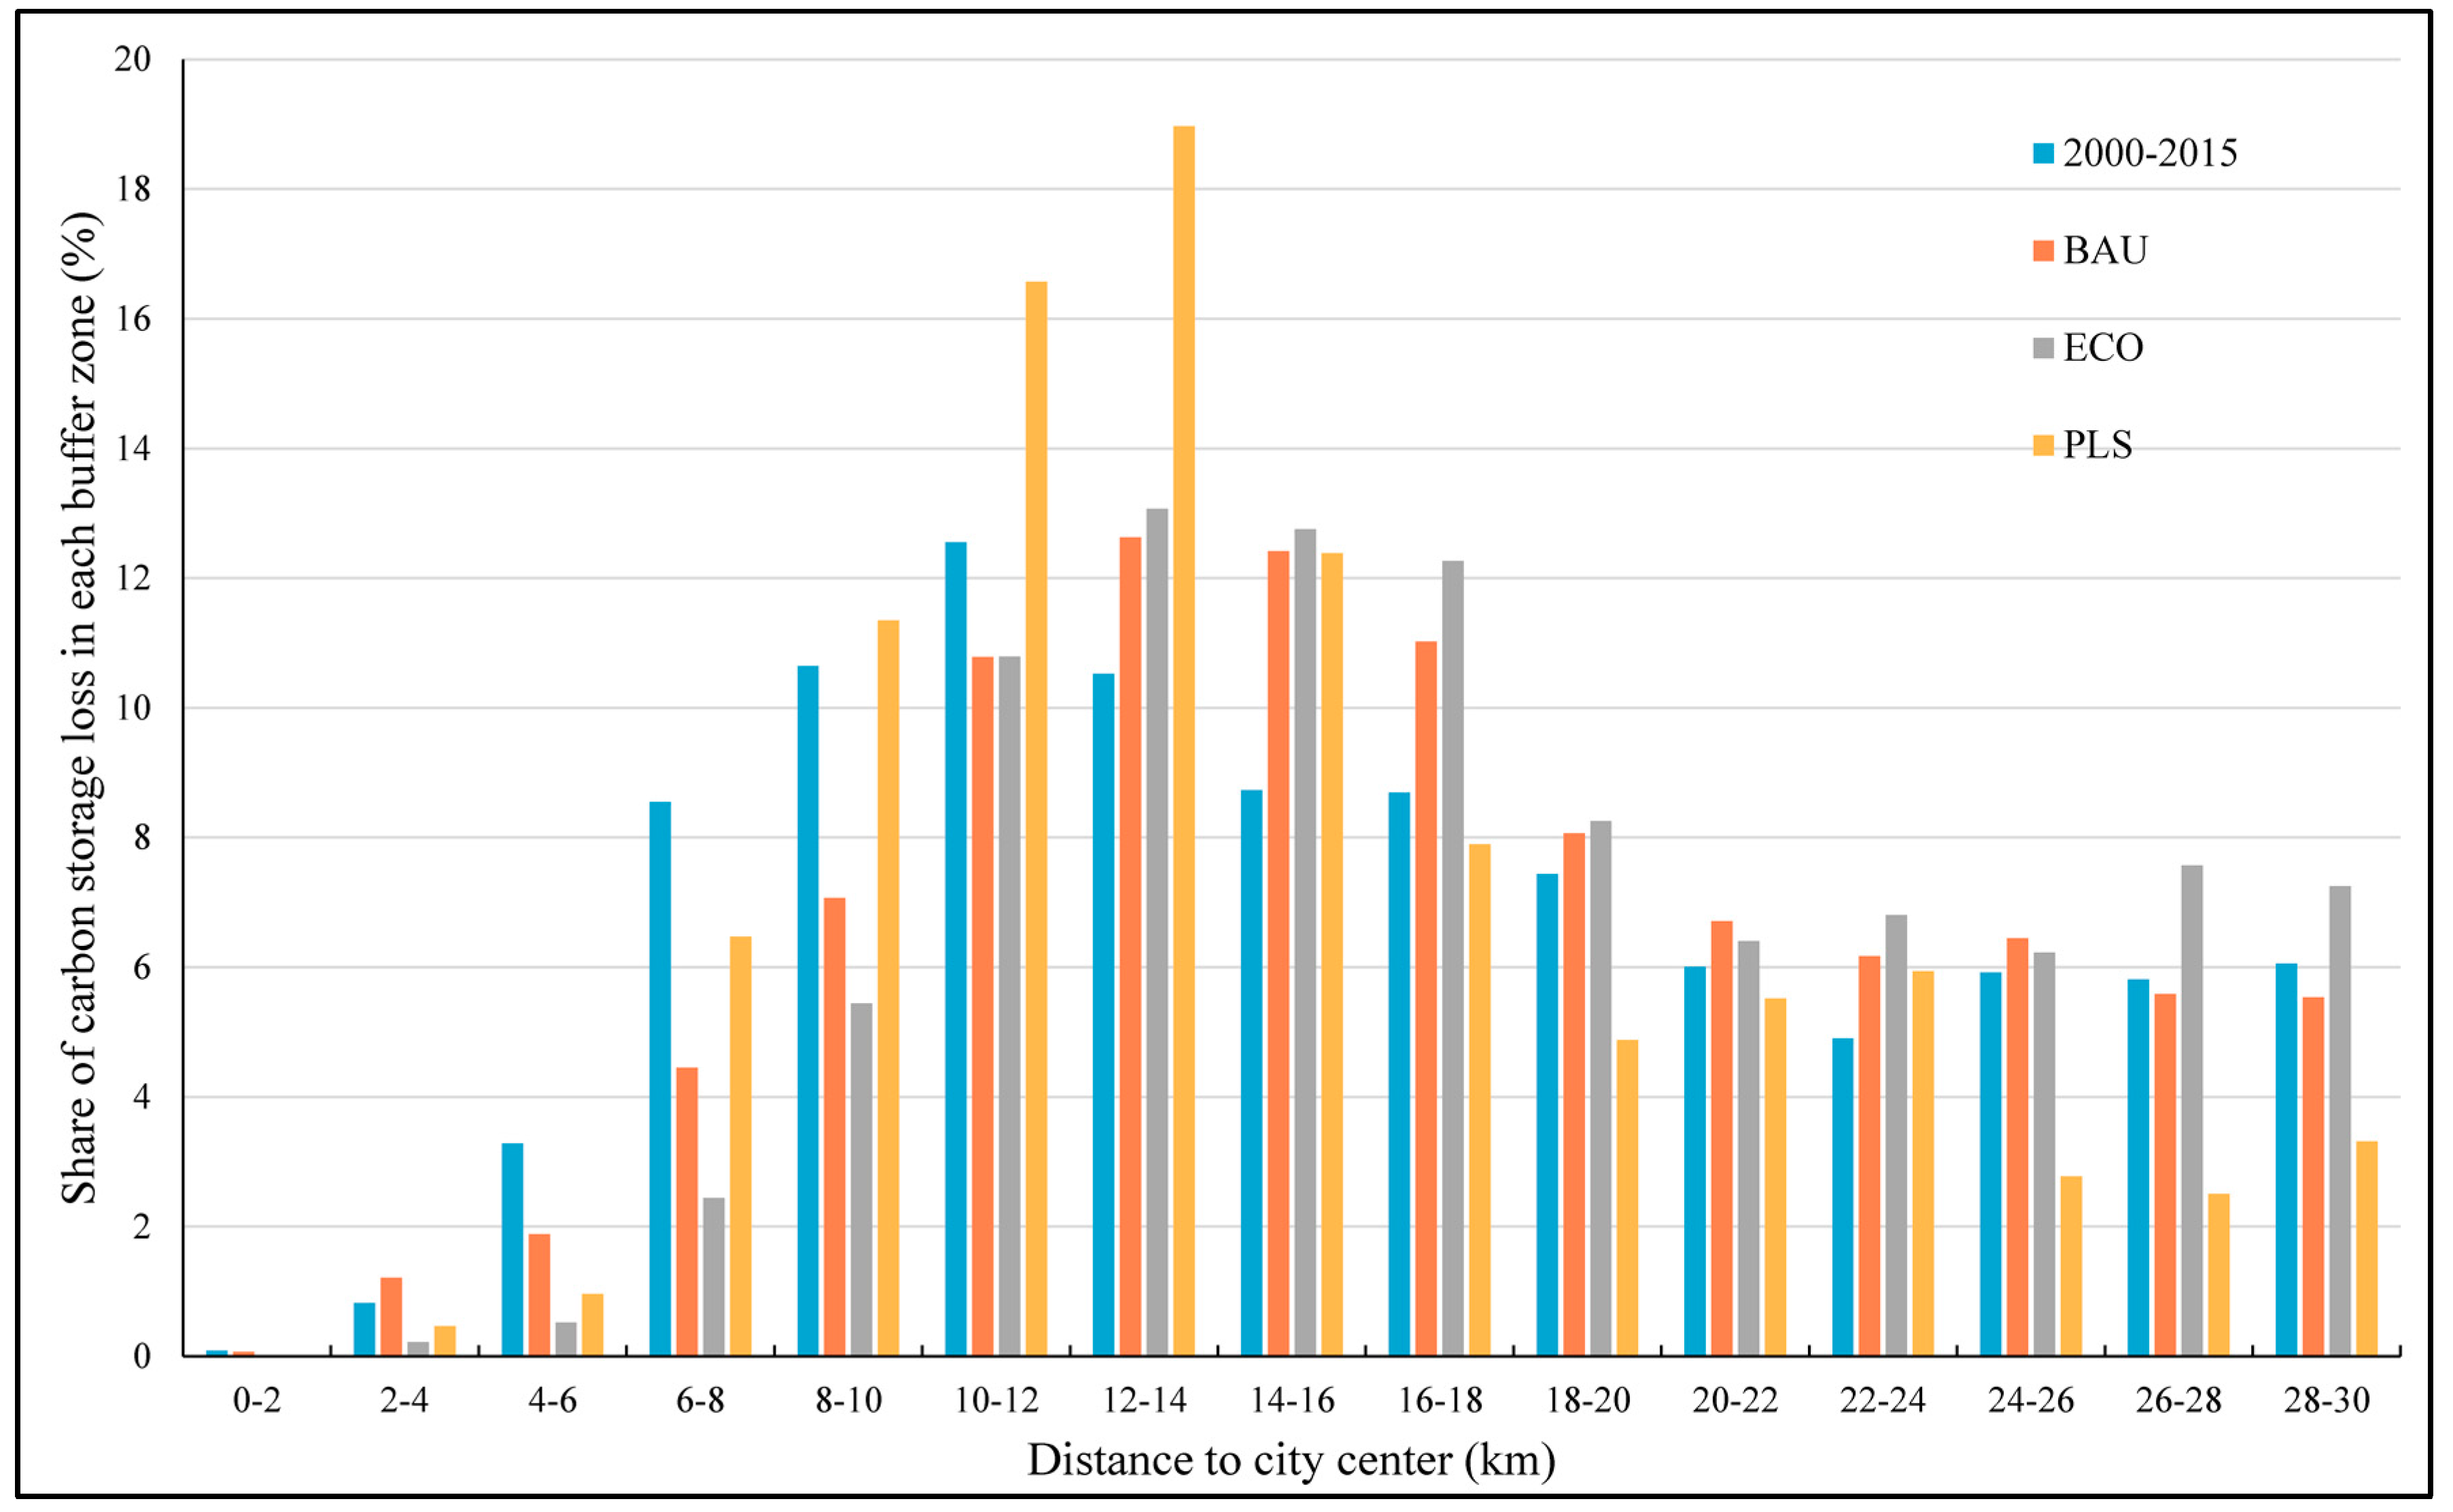
To further evaluate and compare these scenarios, a buffer analysis was applied to clarify the differences in the relationships between carbon storage loss and distance from the city center under the various scenarios.
Figure 5 shows the share of carbon storage loss in each buffer zone. By using the FR indicator, the results of the buffer analysis of carbon storage loss under the three scenarios are shown in
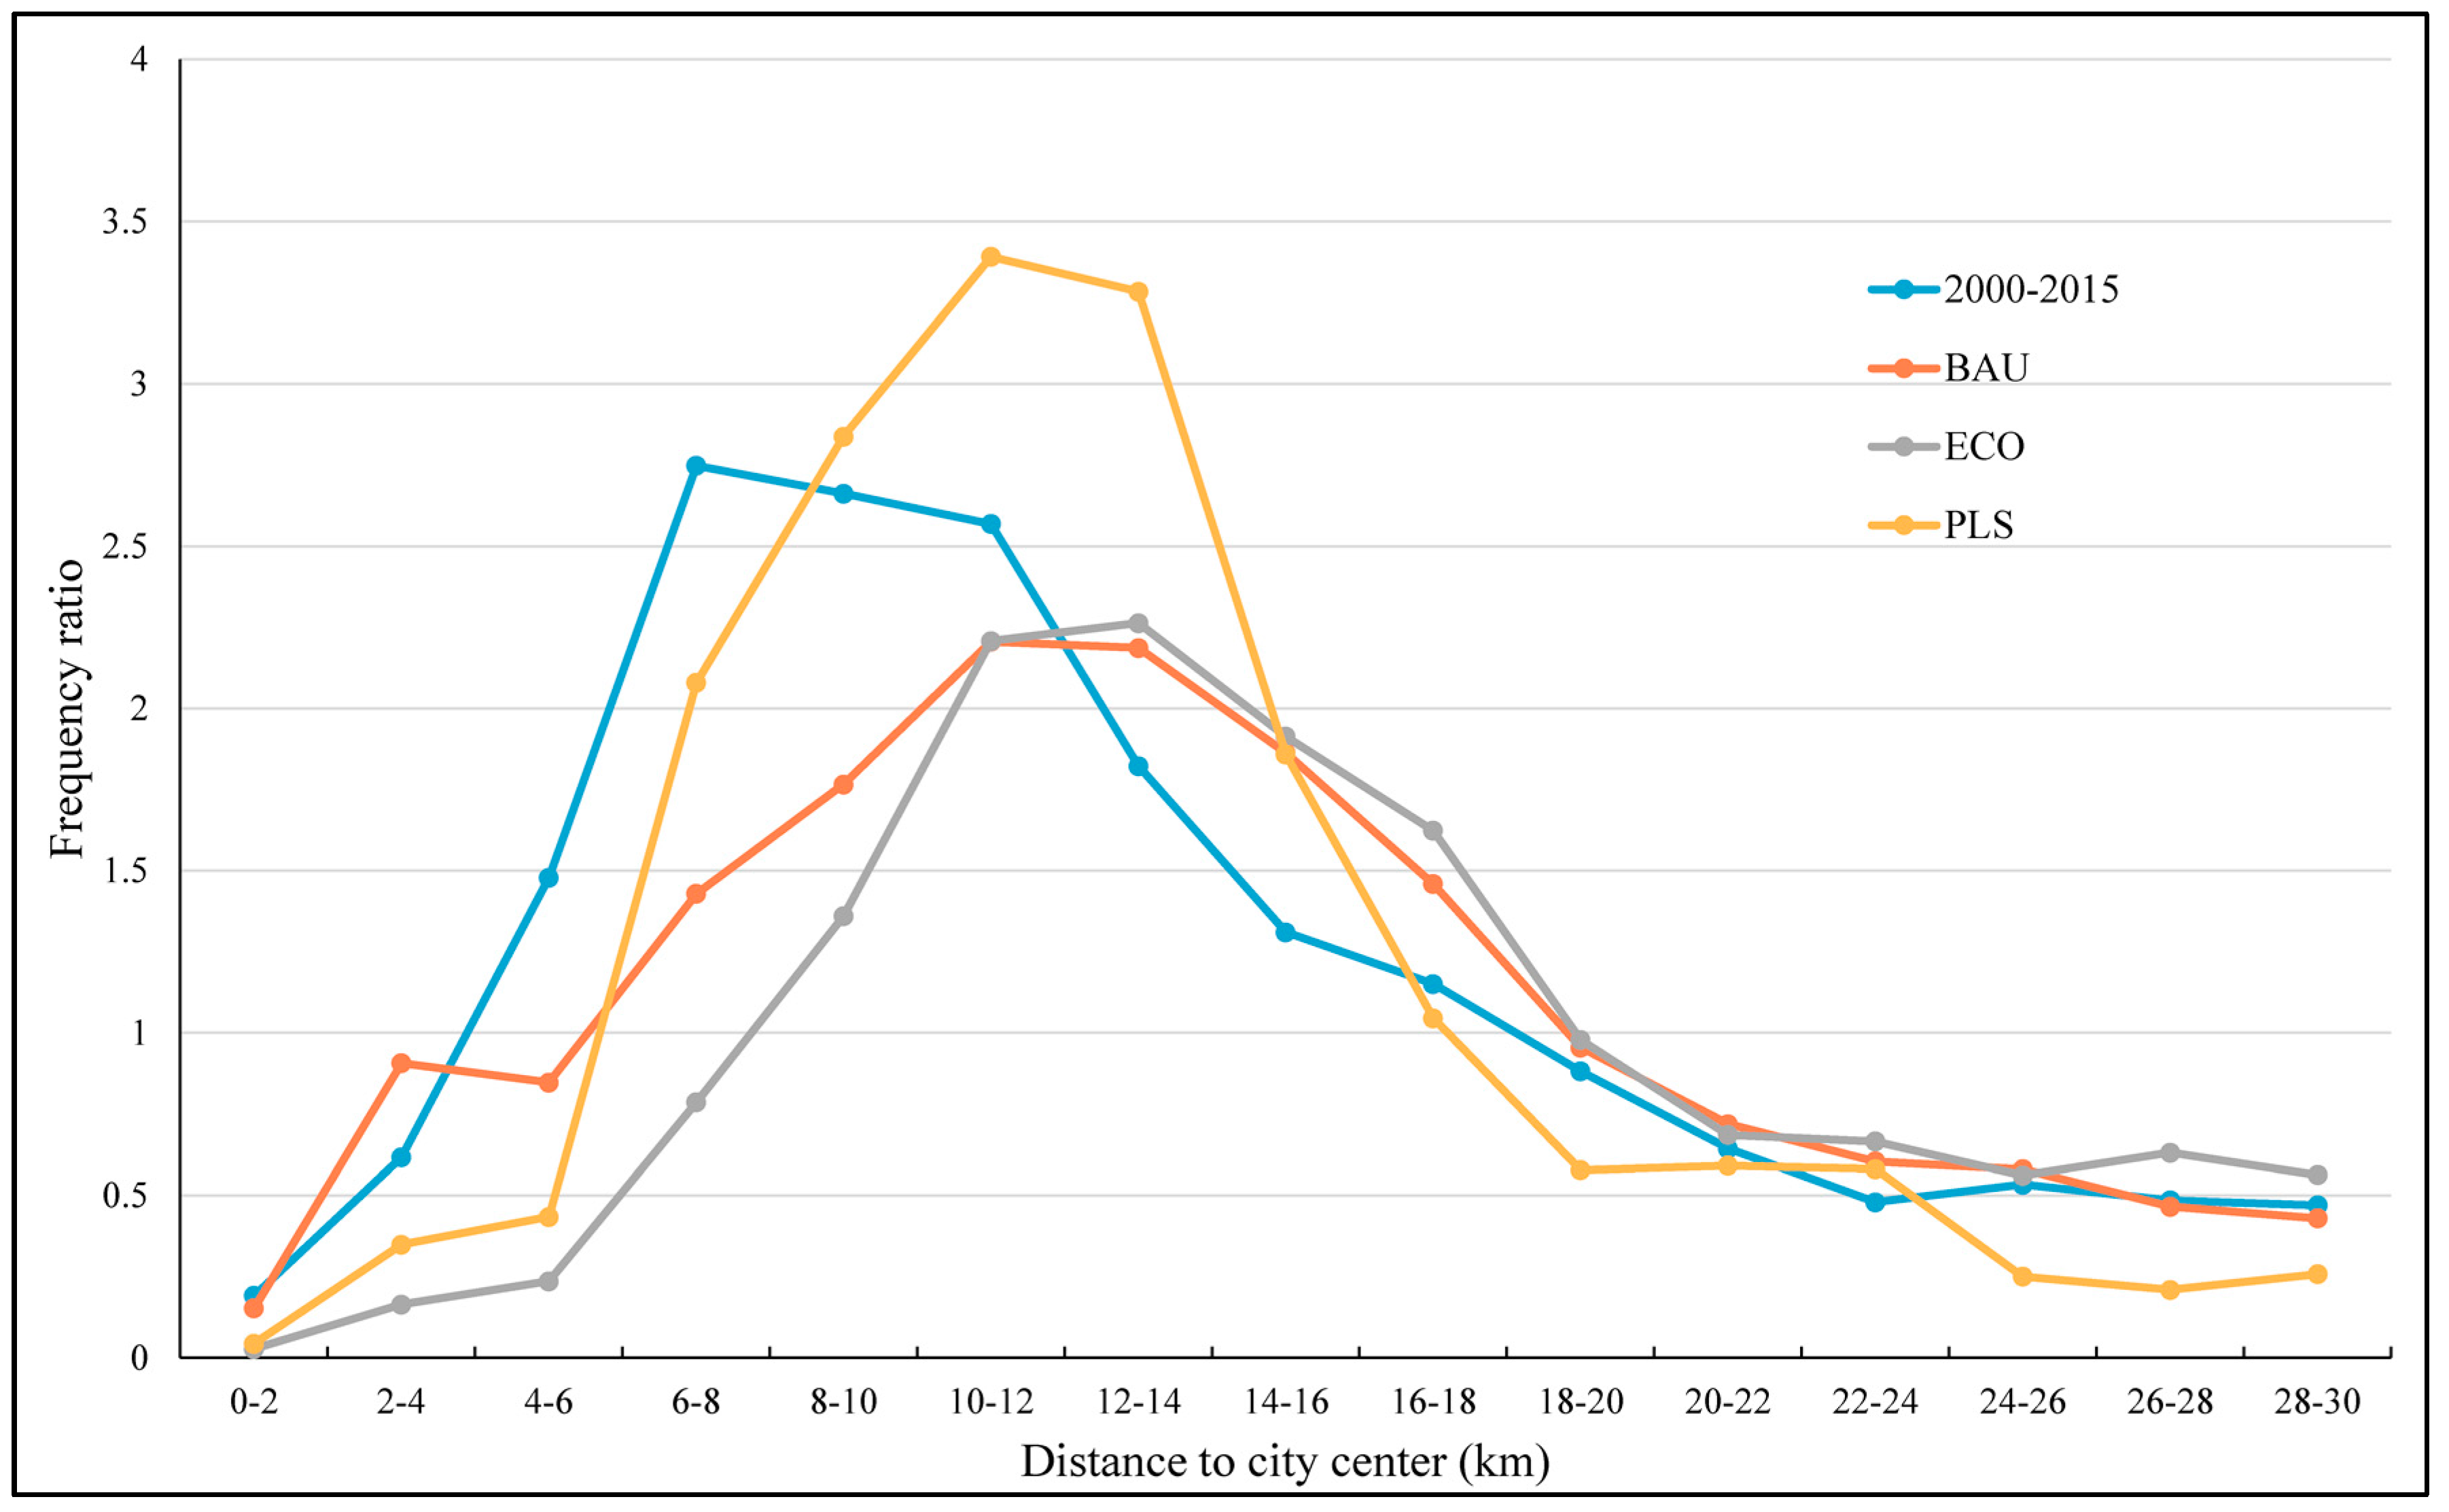
Figure 6, which reflects the losses and spatial dynamics of carbon storage.
Overall, the intensity of carbon storage loss was related to the distance to the city center in Xuzhou City. The intensity of carbon loss increases to a maximum and then exhibits a declining tendency.
From 2000–2015, the historical carbon storage experienced the most intensive loss in the 6–8 km buffer zone with a peak FR value of 2.75, which indicates that the area experienced high-intensity carbon storage losses. Beyond 8 km, the FR value decreases gradually as the distance to the city center increases. Furthermore, as illustrated in
Figure 5, the amount of carbon storage loss within the 10–12 km radius of the center of Xuzhou City accounted for 12.55% of the total carbon storage loss in the buffer zones of 0–30 km, which suggests that the carbon storage losses were mainly concentrated between the radial distances of 8 and 12 km from the city center in Xuzhou City during 2000–2015.
Compared with the period of 2000–2015, the carbon storage loss curves under the three scenarios present significant differences in both magnitude and intensity of carbon storage loss. Under the BAU scenario, the peak FR value is observed in the 10–12 km buffer zone, which indicates that the area that experienced serious carbon storage losses expanded outward. Thus, this finding can also be considered as an indicator of urban expansion. As the distance to the city center increases, the share value increases from 0.07% within the 0–2 km buffer zone to 12.63% within the 12–14 km buffer zone. The differences indicate that there is little land available for urban expansion within the city core.
Under the ECO scenario, the peak FR value is observed in the range from 12 to 14 km around the Xuzhou City center, which is similar to that of the BAU scenario. Between the radial distances of 0 and 12 km from the Xuzhou City center, the FR values are lower than those in the BAU scenario. This result indicates that the carbon storage losses due to land cover changes are restricted in the environmental protection areas. The carbon storage experienced less intense loss in the buffer zone when there were environmental protection areas around the city core.
Under the PLS scenario, the results of the buffer analysis reflect that the spatial pattern of carbon storage loss had similar characteristics as those in the BAU and ECO scenarios. However, a more significant increase in the carbon storage loss intensity is observed between 0 and 12 km from the city center. The highest FR value of 3.39 is found within 10–12 km, which is higher than the FR values in the other scenarios. The results on the share of carbon storage loss in each buffer zone are also consistent, which show that the share values are greater than those in the other scenarios from 6 to 14 km to the city center. This finding could be attributed to the fact that some areas are defined as future development hotspots that are potential future urban expansion areas according to the master plan of Xuzhou City. Most of the land expansion under the PLS scenario is concentrated in these regions, where a large part of the non-urban land is identified to be converted to built-up land. Therefore, the hotspots are the main areas of carbon storage loss under the PLS scenario.


