Managing Water Sustainability: Virtual Water Flows and Economic Water Productivity Assessment of the Wine Trade between Italy and the Balkans


1
Department of Economics and Management, University of Salento, 73100 Lecce, Italy
2
Department of Management, LUM University, 70010 Casamassima, Italy
*
Author to whom correspondence should be addressed.
Sustainability 2018, 10(2), 543; https://doi.org/10.3390/su10020543
Submission received: 2 January 2018
/
Revised: 13 February 2018
/
Accepted: 14 February 2018
/
Published: 18 February 2018
(This article belongs to the Special Issue Water Footprint in Supply Chain Management)
Abstract
:The management of natural resources in economic activities has become a fundamental issue when considering the perspective of sustainable development. It is necessary to rethink every process in order to reach efficiency from different points of view, not only environmentally but also economically. Water scarcity is growing because of economic and population growth, climate change, and the increasing water demand. Currently, agri-food represents the most water consumptive sector, and the increasing importance of international trade in this industry puts freshwater issues in a global context that should be analyzed and regulated by sustainable policies. This analysis is focused on virtual water flows and economic water productivity related to the wine trade, and aims to evaluate water loss/savings achieved through bilateral trade relations. The choice fell on Italy, the first wine producer in the world, and the Balkan countries. The latter are new markets for wine production/consumption, in which Italian wines are strongly positioned for different reasons. The results show that, from a national point of view and considering wine trade, Italy exports water in virtual form to the Balkan countries, more than it imports, so that in effect it partially uses its own water resources for the wine supply of the Balkans. The latter, on the other hand, being a net importer of wine, partially depends on Italian water resources and exerts less pressure on their own water basins in the supporting wine supply. We also observed that the wine trade between Italy and the Balkans implies global water savings.
1. Introduction
The use of natural resources in economic activities has been subjected, in the last decades, to a deep revision. It is the consequence of the “new idea” of economic growth, strictly connected with the sustainability issue, as sanctioned by the Brundtland Report in 1987.
Companies need to reduce their environmental impact [1], considering, in the enlarged vision, all dimensions (environmental, social, and economic) of sustainable development [2].
This could be difficult, but considering first materials, energy savings, and switching to cleaner productions, it is often a source for competitive advantage in terms of cost savings and/or differentiation, as stated by different authors [3,4,5,6].
Many companies are going green, having realized, for example, that pollution reduction and increasing profits are not mutually exclusive [7]. The green change has a positive effect not only in terms of economic and technological efficiency but, as observed above, it is a very notable way to differentiate products and services [8], transforming the modern evolution of marketing into sustainable marketing [9], which has the goal of creating customer value, as well as social and ecological value [10].
The path to sustainability can surely engage all company strategies and actions, from the corporate level to market relations, creating a valid response to institutional and stakeholder pressures regarding environmental, social, and economic affairs.
In particular, considering the environmental impact, there is the possibility to officially formalize this green commitment, with the introduction of an Environmental Management System (EMS). This can be accomplished with the voluntary adoption of an environmental certification such as the ISO 14001. The latter is one of the most popular [11], and its standard defines EMS as “the general part of management that includes the organizational structure, the activity planning, the responsibilities, the practices, the procedures, the processes and the resources to develop, implement, carry out, and revise the environmental policy and keep it up to date.” According to Boiral [12], ISO 14001 is a contemporary internal management tool and a way of advertising an organization’s legitimacy among stakeholders. ISO 14001 is also an answer to the greener conscience of final customers [13,14], expressed through the interest in environmental certifications [15]. Moreover, ISO 14001 is not related to a specific resource, and it is one of the first certifications established.
The aim of this work is to focus on one of the most important and strategic natural resources. Water is not unlimited and water scarcity is growing due to economic and population growth, climate change, and the increasing water demand [16]. Water scarcity can be observed in river flow reduction and in lake narrowing, and in its pollution and the modification of its natural flow, leading to undesired consequences for ecosystems and downstream users. The main sector for water consumption is agriculture. Sixty-nine percent of world water withdrawal is for the agricultural sector, 19% is for the industrial sector and 12% is for municipalities. The percentage of water withdrawal distribution varies in each single country, depending on the climate and the importance of the agri-food sector in the economy. Between 1900 and 2010, global agriculture water withdrawal consumption increased from 600 km3/year to about 2700 km3/year [17], and the forecast for 2050 predicts an increase of about 20% if there is not an improvement in the efficiency of agricultural production systems [18].
The most important concepts in water consumption assessment are the Water Footprint and Virtual Water. The Water Footprint is an indicator that includes direct and indirect freshwater use by a consumer or a producer. The production process of a good or service needs water, and the water “used” for a product is called “virtual water”. Consequently, if one country exports a product to another country, it also exports water in a virtual form. The international virtual water trade represents 30% of global water withdrawal [19].
Virtual water trade studies have been criticized by Merrett [20] and Wichelns [21]. They affirmed that countries import food, not virtual water. However, in the scientific literature, the virtual water trade concept is used as an analytical, not a prescriptive tool. Virtual water trade, in fact, has been used to examine the option of increased net virtual water import in water-scarce countries, but this is essentially different from the proposition that they should increase imports. The concept should not be viewed as a panacea; neither should it be interpreted as an inclusive approach to solving the water crisis [22].
Moreover, the increasing attention related to this resource generated also a new standard, the ISO 14046, which measures the impact of water use and promotes efficiency in water management [23].
Previously, other labels, called eco-labels, certified a voluntary adoption of good practices for natural resource utilization, including water, but their proliferation has been not always been a good opportunity for differentiation [24].
Therefore, the efficiency and the correct use of water is a delicate challenge not only for the productive system but also for international trade systems, since, as stated by Shrivastava [3], the transfer of products and production systems across national boundaries will require environmental impact assessments.
International trade and water use are two closely inter-connected activities. The increasing importance of international trade, especially in agri-food products, puts freshwater issues in a global context that should be analyzed and regulated by sustainable policies.
It could be difficult to produce a global comparison of this type. For this reason, the present work realizes a well-defined analysis, addressing the issues of freshwater scarcity in the trade relations between Italy and the Balkan region related to the wine sector.
The reasons at the base of this choice are different and are listed below:
- The wine sector is strictly connected with agricultural activity, above mentioned as being responsible for 69% of the world’s water withdrawal;
- wine import/export between the two areas has generally increased in the last decade (the observed period);
- there is an interesting possibility of cooperation from a strategic point of view, considering that the two territories are very close (they are separated, geographically, only by the Adriatic Sea);
- it could be possible to verify the real presence of eco-efficiency solutions in trade relationships.
The paper is organized as follows: Section 2 provides a literature review and background related to the water footprint in international trade and the trade relationships between Italy and the Balkan region. Section 3 is devoted to discussing the data used and the overall logical framework and methodology. Section 4 presents the discussion of results and Section 5 concludes.
2. Literature Review and Background
2.1. Virtual Water and International Trade
Virtual water is identified as the volume of water used for the production of goods or services. This concept was first introduced by Tony Allan in the early 90’s when he studied water issues, explaining how they are linked to agriculture and climate change, while also referring to the social and political contexts that influence and determine water use and water policy. Allan developed the idea of using virtual water import (linked to goods or services imports) as a method to ease the pressure on the scarcely available domestic water resources [27,28,29,30].
Therefore, the import of virtual water can be considered as an alternative source of water, which can be a substitute for the traditional endogenous water sources, thus taking on the name of “exogenous water” [31].
This concept was further discussed and developed; it aimed to identify the principles and the visions useful for assessing the value of virtual water trade.
In particular, according to Renault [32], there are five principles for assessing the value of virtual water: the principle of common value, based on actual water consumption recorded at selected real production sites; the principle of marginal gain in water productivity; the principle of nutritional equivalence among food products; the principle of substitution, to transform virtual water imports into real water savings; and the principle of deflation based on historical studies (Table 1).
Only in recent years has the relation between water use and international trade been recognized and has water been considered a global resource too.
The effects of international trade on virtual water are very important, especially for water-scarce countries, that, through commodity importation, can save their own water resources. According to Hoekstra [38], if water-intensive commodities were traded from countries with high water productivity to countries with low water productivity, there would be a reduction of 5% in global water use.
In an open global market, according to the theory of international commerce, countries try to gain profits by exporting commodities that are produced through their abundantly available resources, importing products whose raw materials are scarce. The large volume of international virtual water flows and associated external water dependencies confirm the global approach to water scarcity issues [39,40].
In light of this, virtual water assessment can be an important mechanism in regulating domestic water scarcity, considering its growing demand as shown by Allan’s [27] study on water use and development in Middle Eastern and North African countries.
After Allan’s forerunning research, Hoekstra and Hung [41,42] studied the international virtual water flows in relation to crop trade between 1995–1999, finding that the flows were about 13% of total global water use.
Yang et al. [43] revealed that the total virtual water trade is dominated by green virtual water, which implies a low opportunity cost of water use as opposed to blue virtual water and stated also that virtual water flows from countries of high crop water productivity to countries of low crop water productivity, generating a global saving in water use.
Chapagain et al. [44,45] evaluated the water saved through international trade on agricultural products and, one year later, Hoekstra and Chapagain [46] showed, through two case studies, that both Morocco and The Netherlands import more virtual water than they export; thus, they are dependent on water resources outside their own borders by 14% and 95%, respectively.
Chapagain and Hoekstra showed that 16% of global water use is assigned to producing commodities for exports [47].
Countries that import water-intensive commodities save water. For this reason, it is becoming increasingly important to put freshwater issues in a global context. Local water depletion and pollution are often closely tied to the structure of the global economy [38].
The international food trade has led to enhanced savings in global water resources, indicating its growing efficiency in terms of global water use, as demonstrated by the doubled number of connections in the virtual water trade network observed from 1986 to 2007 [48].
Most studies in the field of virtual water trade concentrate either on the global, national, or sub-national level. Bilateral trade cooperation is analyzed, for example, for agricultural products between Germany and China during the period 2008–2010, and the amount of global and national water savings is also assessed [49].
More recently Schwarz et al. [50] used the virtual water approach to analyze, over the period 1986-2011, the relationship between global agri-food trade and its structure and water flows, with a particular focus on the economic water efficiency of imports and exports, demonstrating that trade values increased more rapidly than virtual water volumes.
The study of global virtual water flow trends over the period 1965–2010 confirms a gradual increase in virtual water exchange, related to the upsurge of agricultural product trade which, despite improvements in crop yields and reallocations of production, continues via intensive commercial exchanges [51].
Serrano et al. [52] conducted a consumption-based assessment of virtual water flows in the EU, finding that Europeans imported around 28% of global virtual water trade flows and suggesting a reconsideration of water policy, especially in the water-scarce parts of EU.
These results were confirmed by Lutter et al. [53]. They assessed the water footprints of total final demand in the EU-27 on a detailed product level and spatial scale, and found that the EU-27 import large volumes of green and blue virtual water, far exceeding the water used for domestic purposes.
Across the Mediterranean basin, the analysis of bilateral virtual water flows associated with the international agricultural trade, conducted by Fracasso et al. [54], confirms the hypothesis, according to which larger water endowments do not necessarily lead to a larger export of virtual water.
Other applied papers concentrated on virtual water trade assessment for nations and cities. In particular, Duarte et al. [55] examined the impact on water use in Spain, identifying the scale effect, i.e., the growing integration into international markets, as the driving force of the increase in virtual water trade. The case study of Macao shows that cities depend on water-intensive products and can be sustained only by external water resources [56].
Water and trade policy reforms on virtual water flows are the subjects of analysis in the study of Hassan and Thiam [57]. Since water became more expensive under wider open competition, the introduction of policies that enhance higher water use efficiency within agricultural sector has been essential.
International bilateral trade promotes efficient water use, through the diffusion of water-saving technologies and the change in industry composition, showing that trade openness has effects on the degree of water withdrawn and consumed [58].
Tuninetti et al. [59], applying a new method to the network of virtual water trade for link prediction, found that over the period 1986–2011 population and agricultural efficiency were the major driving forces for the link activation or deactivation.
Balancing environmental resource savings with economic return, Toma et al. [60] observed a consistent heterogeneity of countries’ efficiency performances and the potential for increasing agricultural production in the EU, demonstrating the existence of a competitive context.
Since environmental sustainability of countries depends on water resource savings, it becomes essential to consider virtual water as an alternative source and an opportunity deriving from the growing liberalization of international commerce [61]. Future actions should be addressed to self-sufficiency through more efficient processes and to the development of a shared market of virtual water between trading partners [62].
2.2. European Unionand Italy’s Relations with the Balkans
The European Union is looking for a better integration with the Balkan area. In particular, the attention is focused on the Western Balkans (Albania, Bosnia-Herzegovina, Kosovo, FYROM— Former Yugoslav Republic of Macedonia, Montenegro, and Serbia), since there is a very important group of countries that currently are not in the EU, even if the preliminary activities for membership have already begun [63].
The objective is to promote the stabilization of the region and its progressive European integration as sanctioned in the framework of the Western Balkans Process in the context of EU foreign policy (this principle was recently reaffirmed during the fourth and last Western Balkans Summit, held in July 2017 in Italy, in the city of Trieste) [64].
Therefore, there economic cooperation is strategically important, since it is a useful instrument for creating better integration.
Consequently, evaluating the favourable institutional pressure and the geographic proximity, this is an interesting opportunity for Italian companies to strengthen their productive and trade relationships with the Western Balkans and the area as a whole.
Italian companies have already reached privileged positions in this context. Italy is a very strategic partner for all these countries and the number of Italian companies located there is also relevant.
The latest data available, disseminated by the Italian Foreign Minister and shown in the following Table 2, demonstrate what has been mentioned above.
Moreover, the Balkans represent an interesting opportunity, not only for the relocation of industrial production, but also as new markets, considering the global number of population (more than 60 million people) and the Gross National Income per capita (where more than half of the population has an income close or clearly superior to 10,000 $/year), as shown in the Table 3.
Finally, the global trading exchange between Italy and the mentioned countries is shown below in Table 4.
As it is possible to observe from Table 4, the volume of trading exchange is very important, and the potentiality for future cooperation is concrete. The Balkans are surely projected into a developing period, having as a goal the achievement of the same economic and social condition of the other EU countries.
There is definitely a concrete framework for building a new sustainable development where the environment, as well as the social and cultural aspects, could be a wider basis for a profitable cooperation.
2.3. The Wine Sector in Italy, the Balkans, and Their Relationships
Following the previous overview, agribusiness is a strategic field. Many areas of the Balkans have the same climate as Italy, and this represents a basis of comparison with similar productions, where cooperation can be easier to establish.
The wine sector is surely a significant area to test this kind of new sustainable relationship. Wine production groups include Italy and all countries of the Balkan region, since they have been involved in this segment since ancient times.
Following the indications provided by Hudelson [26], the Balkan inhabitants were the first, about 6000 years ago, to cultivate the Vitis vinifera, the main European wine grape in that age. Currently there are more than 400 autochthonous varieties of wine grapes, each of which is identified with a single territory, strictly connected with local culture.
These countries represent a new interesting perspective to analyze. Wine and all related activities have a recognized strategic presence above all in Romania [68], Bulgaria, Slovenia, and Croatia [69], and in FYROM, Montenegro, and Serbia [70].
The wine trade relationship between Italy and the Balkans over the last 10 years is shown in Table 5.
These figures show fluctuating trends but, in this last decade, different exogenous factors, such as the global economic crisis [72] and climatic influences [73], have affected the performances.
Anyway, considering the first and the last year of the observed period, Italian import/export with the Balkans is in a positive trend (only the quantities imported have decreased but, evaluating the economic result, a higher price has guaranteed a higher revenue). Moreover, the average price shows at the same time an increased value, confirming the focus on quality. Concerning Italian exports, there are no doubts regarding the strong link with the Balkans, but this could be an expected result since Italy, as above stated, is the first wine producer in the world.
Therefore, there are interesting basic conditions for the continuation of cooperation, exchanging traditions, cultures, know-how, and market approaches.
The Balkans needs a more stable production to make a real effort for exportation (Table 6), since this is the proper way to achieve better product valorisation.
3. Materials and Methods
3.1. The Study Area
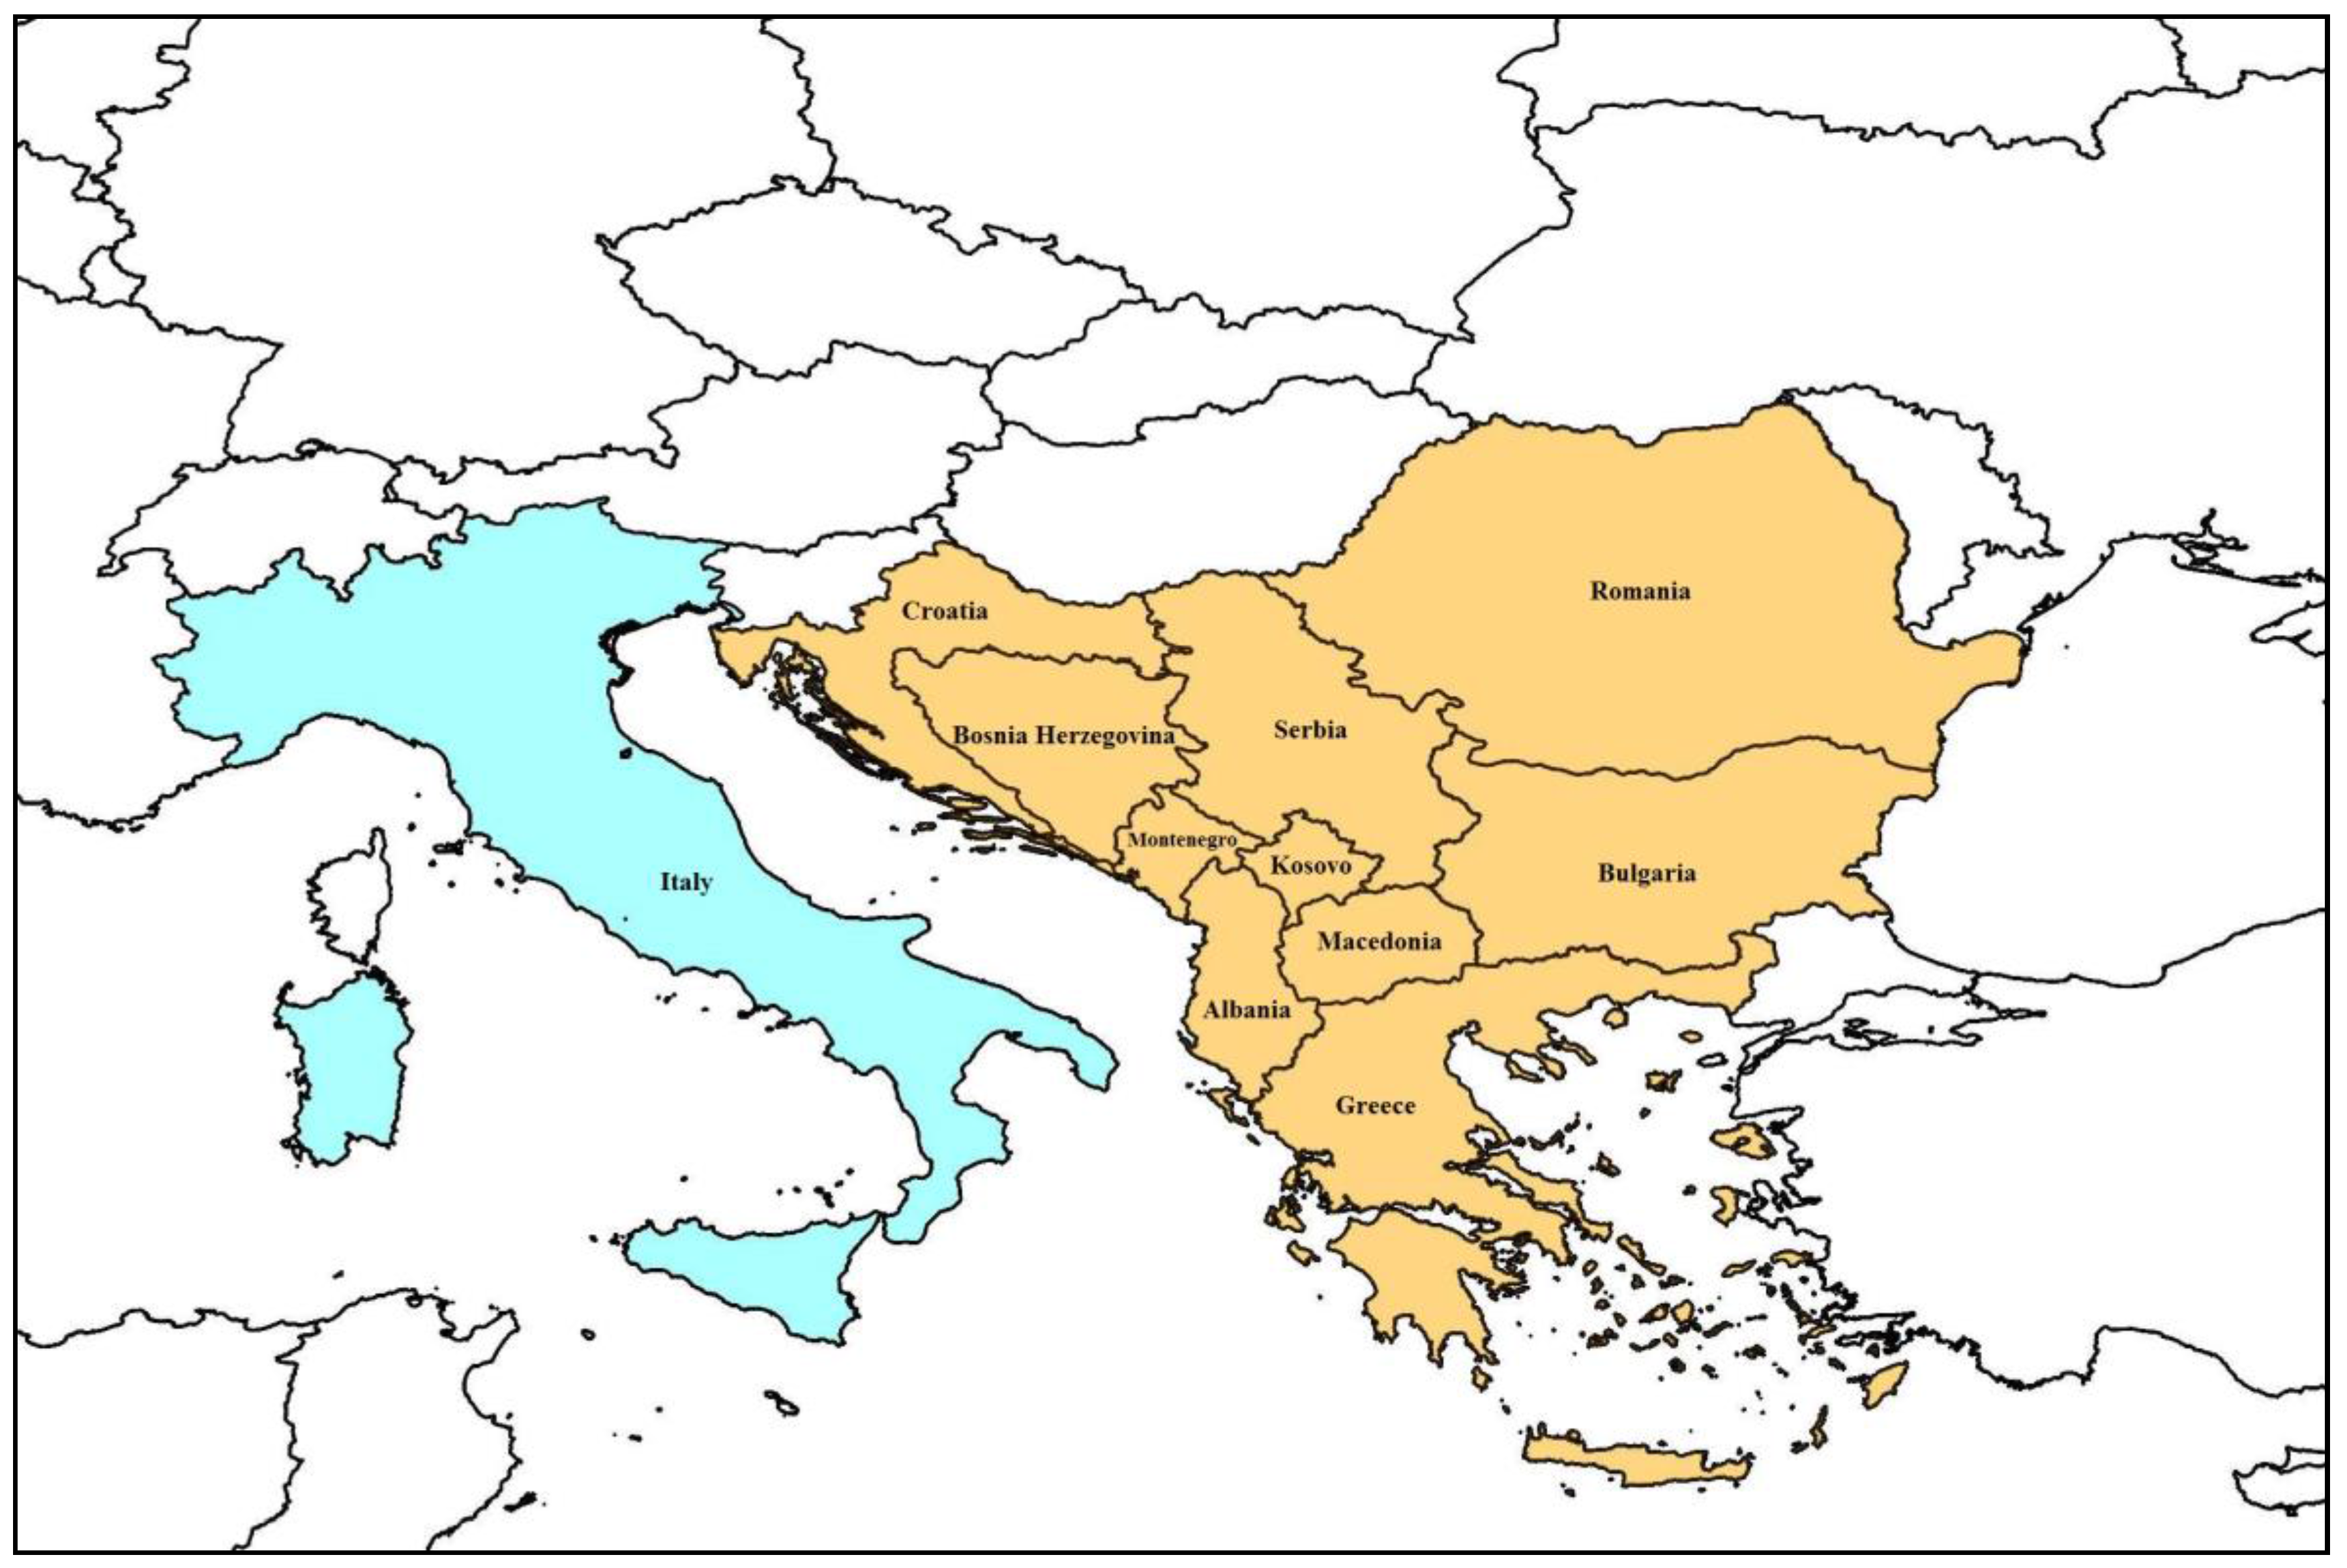
The study was conducted considering economic relations between Italy and the Balkans. The Balkan Peninsula forms an irregular, inverted triangle of land, which extends from Central Europe in the north to the Eastern Mediterranean in the south, and is bounded on most sides by the Adriatic, Ionian, Aegean, and Black Seas (Figure 1).
A common definition of the Balkan Peninsula, used by the authors for the purpose of this study, includes parts (or all) of the modern political countries of Albania, Bosnia-Herzegovina, Bulgaria, Croatia, Greece, Kosovo, FYROM, Montenegro, Romania, Slovenia, Serbia, and the Thracian portion of Turkey [74]. For the scope of collecting data, the latter was not included in this survey. It would be impossible, in fact, to identify commodity fluxes between Italy and a portion of a country that does not have its own trade autonomy.
3.2. Data Sources and Description
The paper used secondary data from 2007 to 2016, and it does not go further, because the analyzed period includes years when complete and reliable data for the variables used in our framework have been previously observed and were annually available.
For the purposes of this study, we considered products identified with the following six-digit level codes: 220410, 220421, 220429, and 220430 of Harmonized Commodity Description and Coding System, also known as the Harmonized System (HS) of tariff nomenclature.
Mekonnen and Hoekstra [75] provided data on water footprints of derived crop products for different countries. According to the HS of tariff nomenclature, Mekonnen and Hoekstra, in fact, analyzed the water content of products coded at a six-digit level.
In our study, the water content of the heading HS code 2204, named Wine of fresh grapes, including fortified wines, grape must, partially fermented and with an actual alcoholic strength > 0.5% vol. or having an actual content, by weight, > 0.5% vol. of added alcohol, has been calculated as having the average water contents of correspondent products coded at the six-digit level [49].
The data pertaining to trade between Italy and each country of the Balkan Peninsula were extracted for the selected derived crop products identified with 2204 HS code from Coeweb, database of Italian National Institute of Statistics (ISTAT), for the stated period [71].
Coeweb is the on-line information system fully dedicated to foreign trade statistics that provides, on a monthly basis, information about Italy’s trade flows with the rest of the world. The information comes for non-EU countries from the Single Administrative Document and for the EU countries from the Intrastat models acquired by the Customs Agency. The collected data, concerning quantity and value of traded products, identified by the HS codes, once received by ISTAT, are first processed in accordance with EU rules on foreign trade statistics and subsequently revised and validated by auditors.
3.3. Methodological and Empirical Framework
In line with the above-mentioned scientific literature, this study distinctly quantified the proportion of the total water footprint, that is, blue, green, or grey, in the wine value chain, adopting terminologies and empirical procedures outlined by Hoekstra et al. [31].
Conceptually, the surface and groundwater utilized for irrigating crop products is quantified as the blue water footprint of that product and it is equal to:
WFblue = Blue Water Evaporation + Blue Water Incorporation + Lost Return Flow [volume/time]
The rainwater absorbed by the crops is quantified as the green water footprint of that product and it is equal to:
WFgreen = Green Water evaporation + Green Water incorporation [volume/time]
The amount of water required to assimilate a polluting load produced from crop production, bringing back the water quality to its allowable standard, represents instead the grey water footprint [31,76] and is equal to:
in which L represents the pollutant load [mass/time]; cmax is the maximum acceptable concentration [mass/volume]; and cnat is the natural concentration in the receiving water body [mass/volume].
WFgrey = L/(cmax—cnat ) [volume/time]
The concept of virtual water is different from that of the water footprint. The former refers to the water volume embodied in a product, while the latter also captures other aspects, such as the localization and the source of water used. In the context of this study, the virtual water content is considered similar to the water footprint [31].
For the scope of this paper, the virtual water related to imports VWi [p] is defined as the amount of water embodied in imported product p to a country A from another country B in a specific year, and is calculated using the following formula:
in which Ti [p] is the volume of imported product p [p units/time] in the country A from the country B; WFB [p] represents the water footprint of the product, i.e., the water content of the product p as it is produced in its country of origin B.
VWi [p] = Ti [p] × WFB [p] [volume/time]
While the virtual water related to exports VWe [p] is defined as the amount of water embodied in exported products p from a country A to another country B in a specific year, and is calculated using the following formula:
in which Te [p] is the volume of exported product p [p units/time] from the country A to the country B; WFA [p] represents the water footprint of the product, i.e., the water content of the product p as it is produced in its country of origin A.
VWe [p] = Te [p] × WFA [p] [volume/time]
After extracting the HS 2204 products water footprints for the different production countries considered in this study, weighted averages were calculated in order to determine total, blue, green, and grey water footprints for the whole Balkans, intended as a single area for the aim of the study.
Virtual water flows related to the wine trade between Italy and the whole Balkan area, with a distinction of green, blue, and grey water, were computed and trends in time were assessed.
Since the importance of economic potential is noted and a limited number of studies have assessed the virtual water trade from an economic perspective [77], after calculating the virtual water flows in the considered time period, economic water productivities are further calculated in this study following Owusu-Sekyere et al. [78].
Given that VWi,e is measured in m3, the economic water productivity of a particular derived crop product EWP [p] is measured in (€/m3) and expressed in equation:
in which Valuei,e [p] is the value of imported or exported product p [p units/time]; VWA [p] represents the water footprint of the product, i.e., the water content of the product p as it is produced in its country of origin A.
EWP [p] = (Valuei,e[p])/(VWi,e[p])
The monetary value attained from every cubic meter of water used in producing any of the crop products then becomes the economic water productivity of that product [79]. Economic water productivities were estimated for HS 2204 products considered in the study.
The national water saving SA [p] indicates the amount of water saved by a country A as a result of trade in a product p and is equal to [28]:
in which Ti [p] is volume of imported product p [p units/time]; Te [p] is volume of exported product p [p units/time]; WFA [p] = water footprint of product p in the analyzed country A.
SA [p] = (Ti [p]—Te [p] ) × WFA [p] [volume/time]
If SA is a positive number, the country saves water; on the contrary, if SA is negative the country loses water.
The global water saving Sg [A,B,p] corresponds to the sum of the national savings for each years considered in the study [31]. If Sg [A,B,p] is negative there is a global water loss; otherwise, it implies a global water saving.
4. Results and Discussion
4.1. Virtual Water Trade Flows and Water Productivities
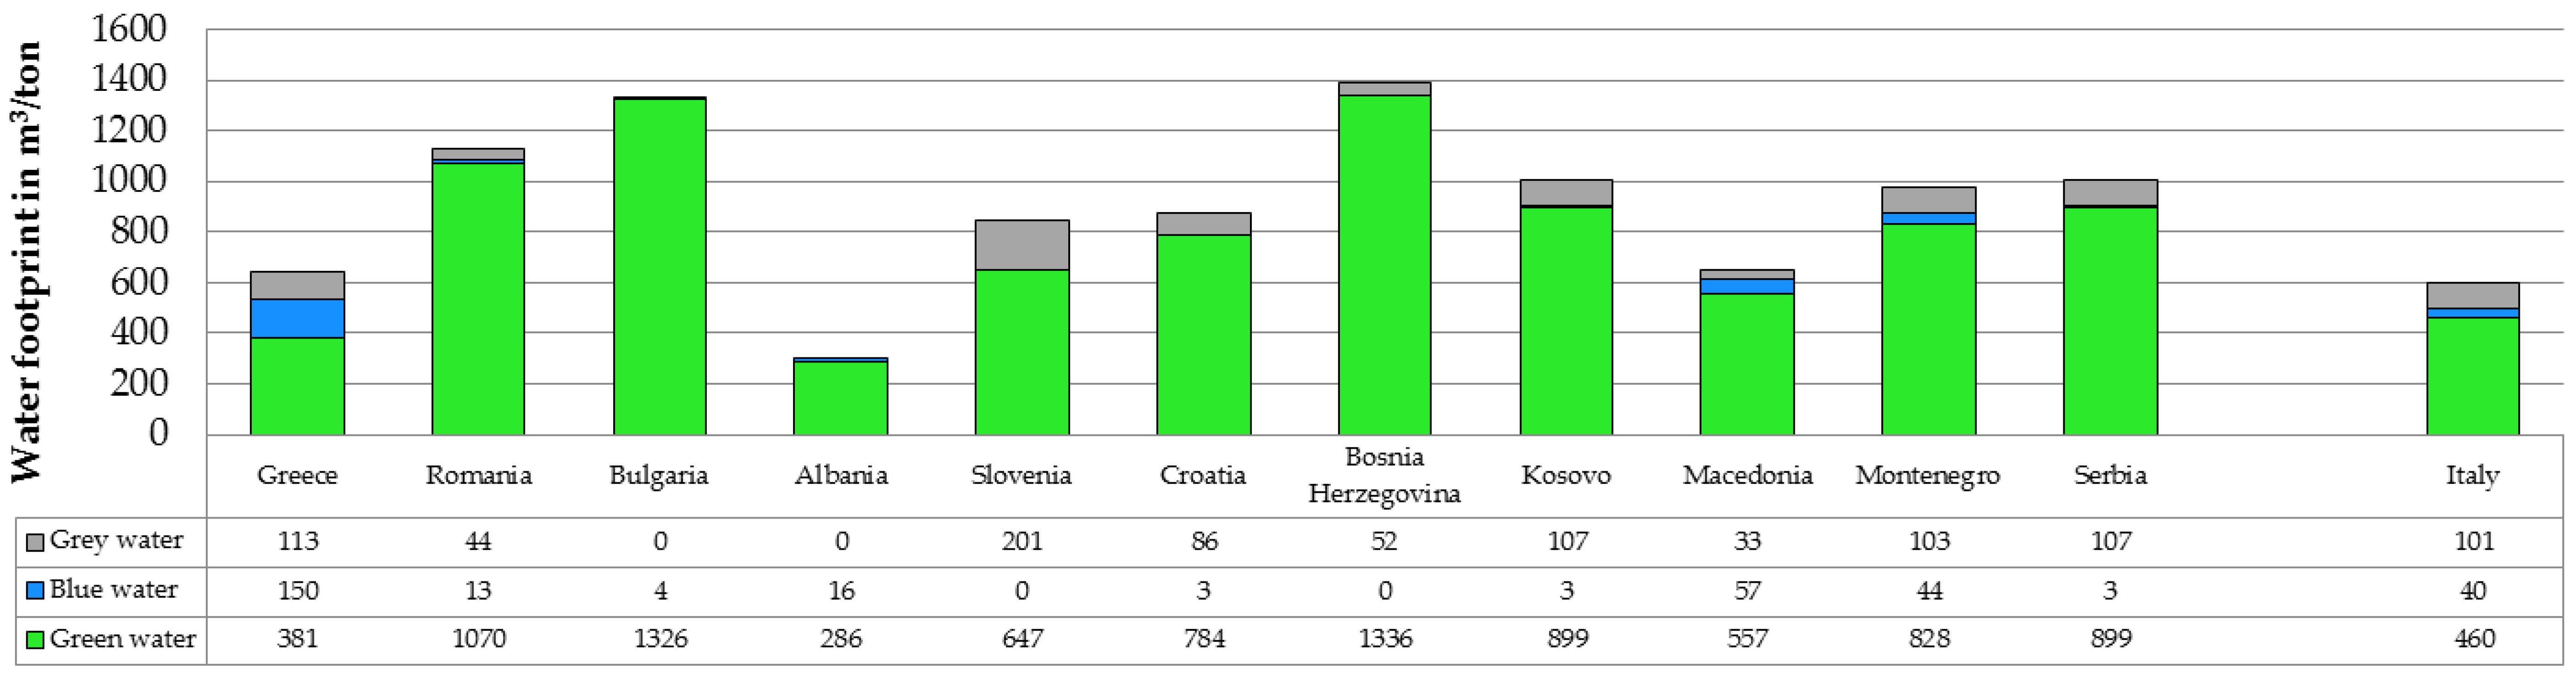
Italy and the countries belonging to the geographical boundaries of the Balkan Peninsula have different water footprint structures concerning wine productions (Figure 2).
As can be seen in Figure 2, the composition of the water footprints of wine produced in the Balkan Peninsula varies significantly among countries with three peaks for Romania, Bulgaria, and Bosnia-Herzegovina, which register values higher than 1000 m3/ton, mainly due to the green component. The latter in fact exceeds in itself the 1000 m3/ton threshold for these countries, while the blue component assumes values 13, 4, and 0 m3/ton for Romania, Bulgaria, and Bosnia-Herzegovina, respectively. Together with FYROM these countries also register the lowest values of the grey water.
Turning the attention to the countries with lowest water footprints, Greece and FYROM register 644 and 647 m3/ton comparable with the Italian value (600 m3/ton), while Albania has the lowest value of water footprint due to the green and blue component (286 and 16 m3/ton, respectively), highlighting an attitude to wine production from a water reduction perspective.
As illustrated in Table 7 if we analyze traded volumes of wines between 2007 and 2016, the Balkan wines imported into Italy registered a peak in 2012 with 10,892 tons. The average traded volume in the analyzed period is about 4490 tons. Related virtual water flow assumes an inverted-U trend and an average amount over the period of 3.7 million of m3.
Italian wines imported into the Balkan Peninsula over the period also have a general inverted-U trend with a peak in 2011 corresponding to 38,348 tons. The virtual water flow in the same year amounts to 23.02 million of m3.
The average volume of Italian wines imported into the Balkans over the analyzed period (28,842 tons) is about 6.5 times greater than the volume of Balkan wines imported into Italy (4490 tons).
The average virtual water flow of Italian wines imported into the Balkans (17.31 million of m3) is instead almost 4.7 times greater than the average virtual water flow of Balkan wines imported in Italy (3.7 million of m3).
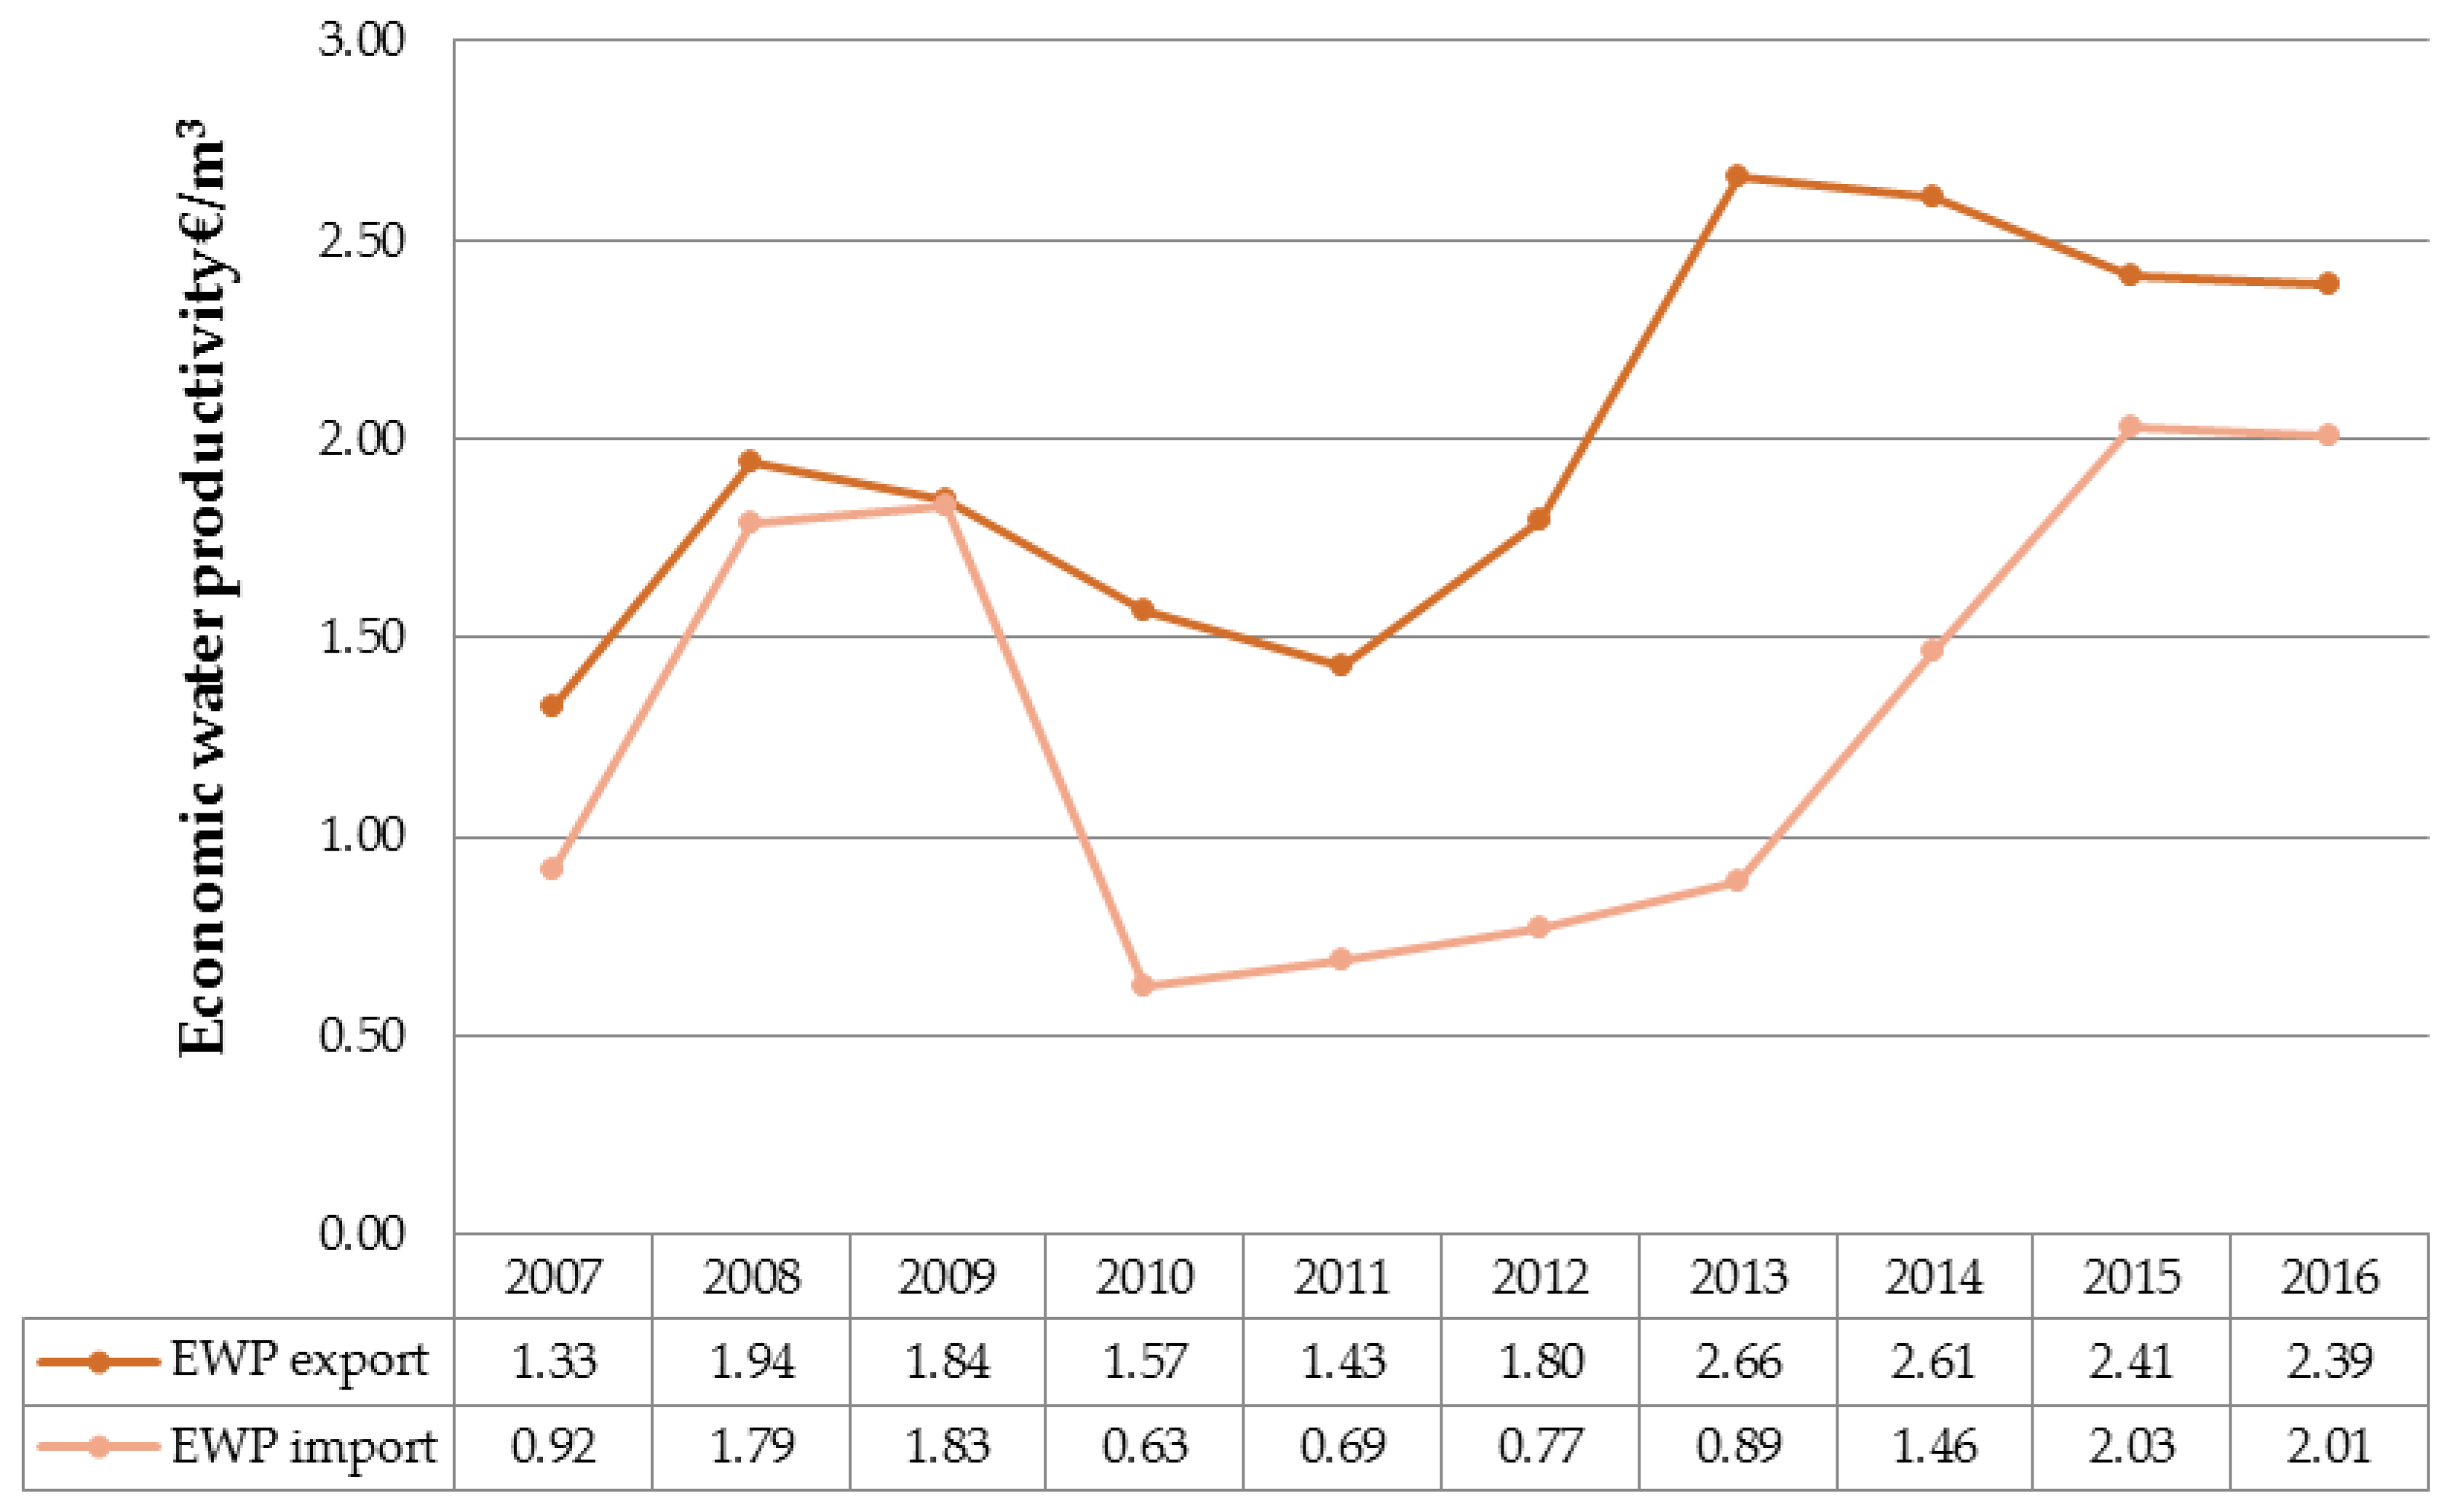
Figure 3 presents the water productivities of the wine products (HS 2204) traded between Italy and the Balkan peninsula over the period 2007–2016. The water productivity is expressed in economic terms. For both imports and exports, the results highlight approximately the same trend-shape, even if reporting different absolute values. The maximum value of economic water productivity for Italian wines exported to the Balkan peninsula was registered in 2013 (2.61 €/m3), while for Balkan wines imported into Italy the peak corresponds to 2.03 €/m3 in 2015.
Considering the period 2007–2016, as we could expect, economic water productivity is always higher for Italian wine exports, since the Italian product is much more established and appreciated in the world, due to its organoleptic and cultural characteristics, and is relatively water-extensive.
Nevertheless, Balkan wines imported into Italy have been experiencing in recent years an overall increase in their economic water productivity, mainly due to their economic valorization, rather than to the reduction of their virtual water content. This section may be divided by subheadings. It should provide a concise and precise description of the experimental results, their interpretation, as well as the experimental conclusions that can be drawn.
4.2. Water Savings through Trade
To calculate the global and national water savings, both the Italian and Balkan HS 2204 wine products have been taken into account.
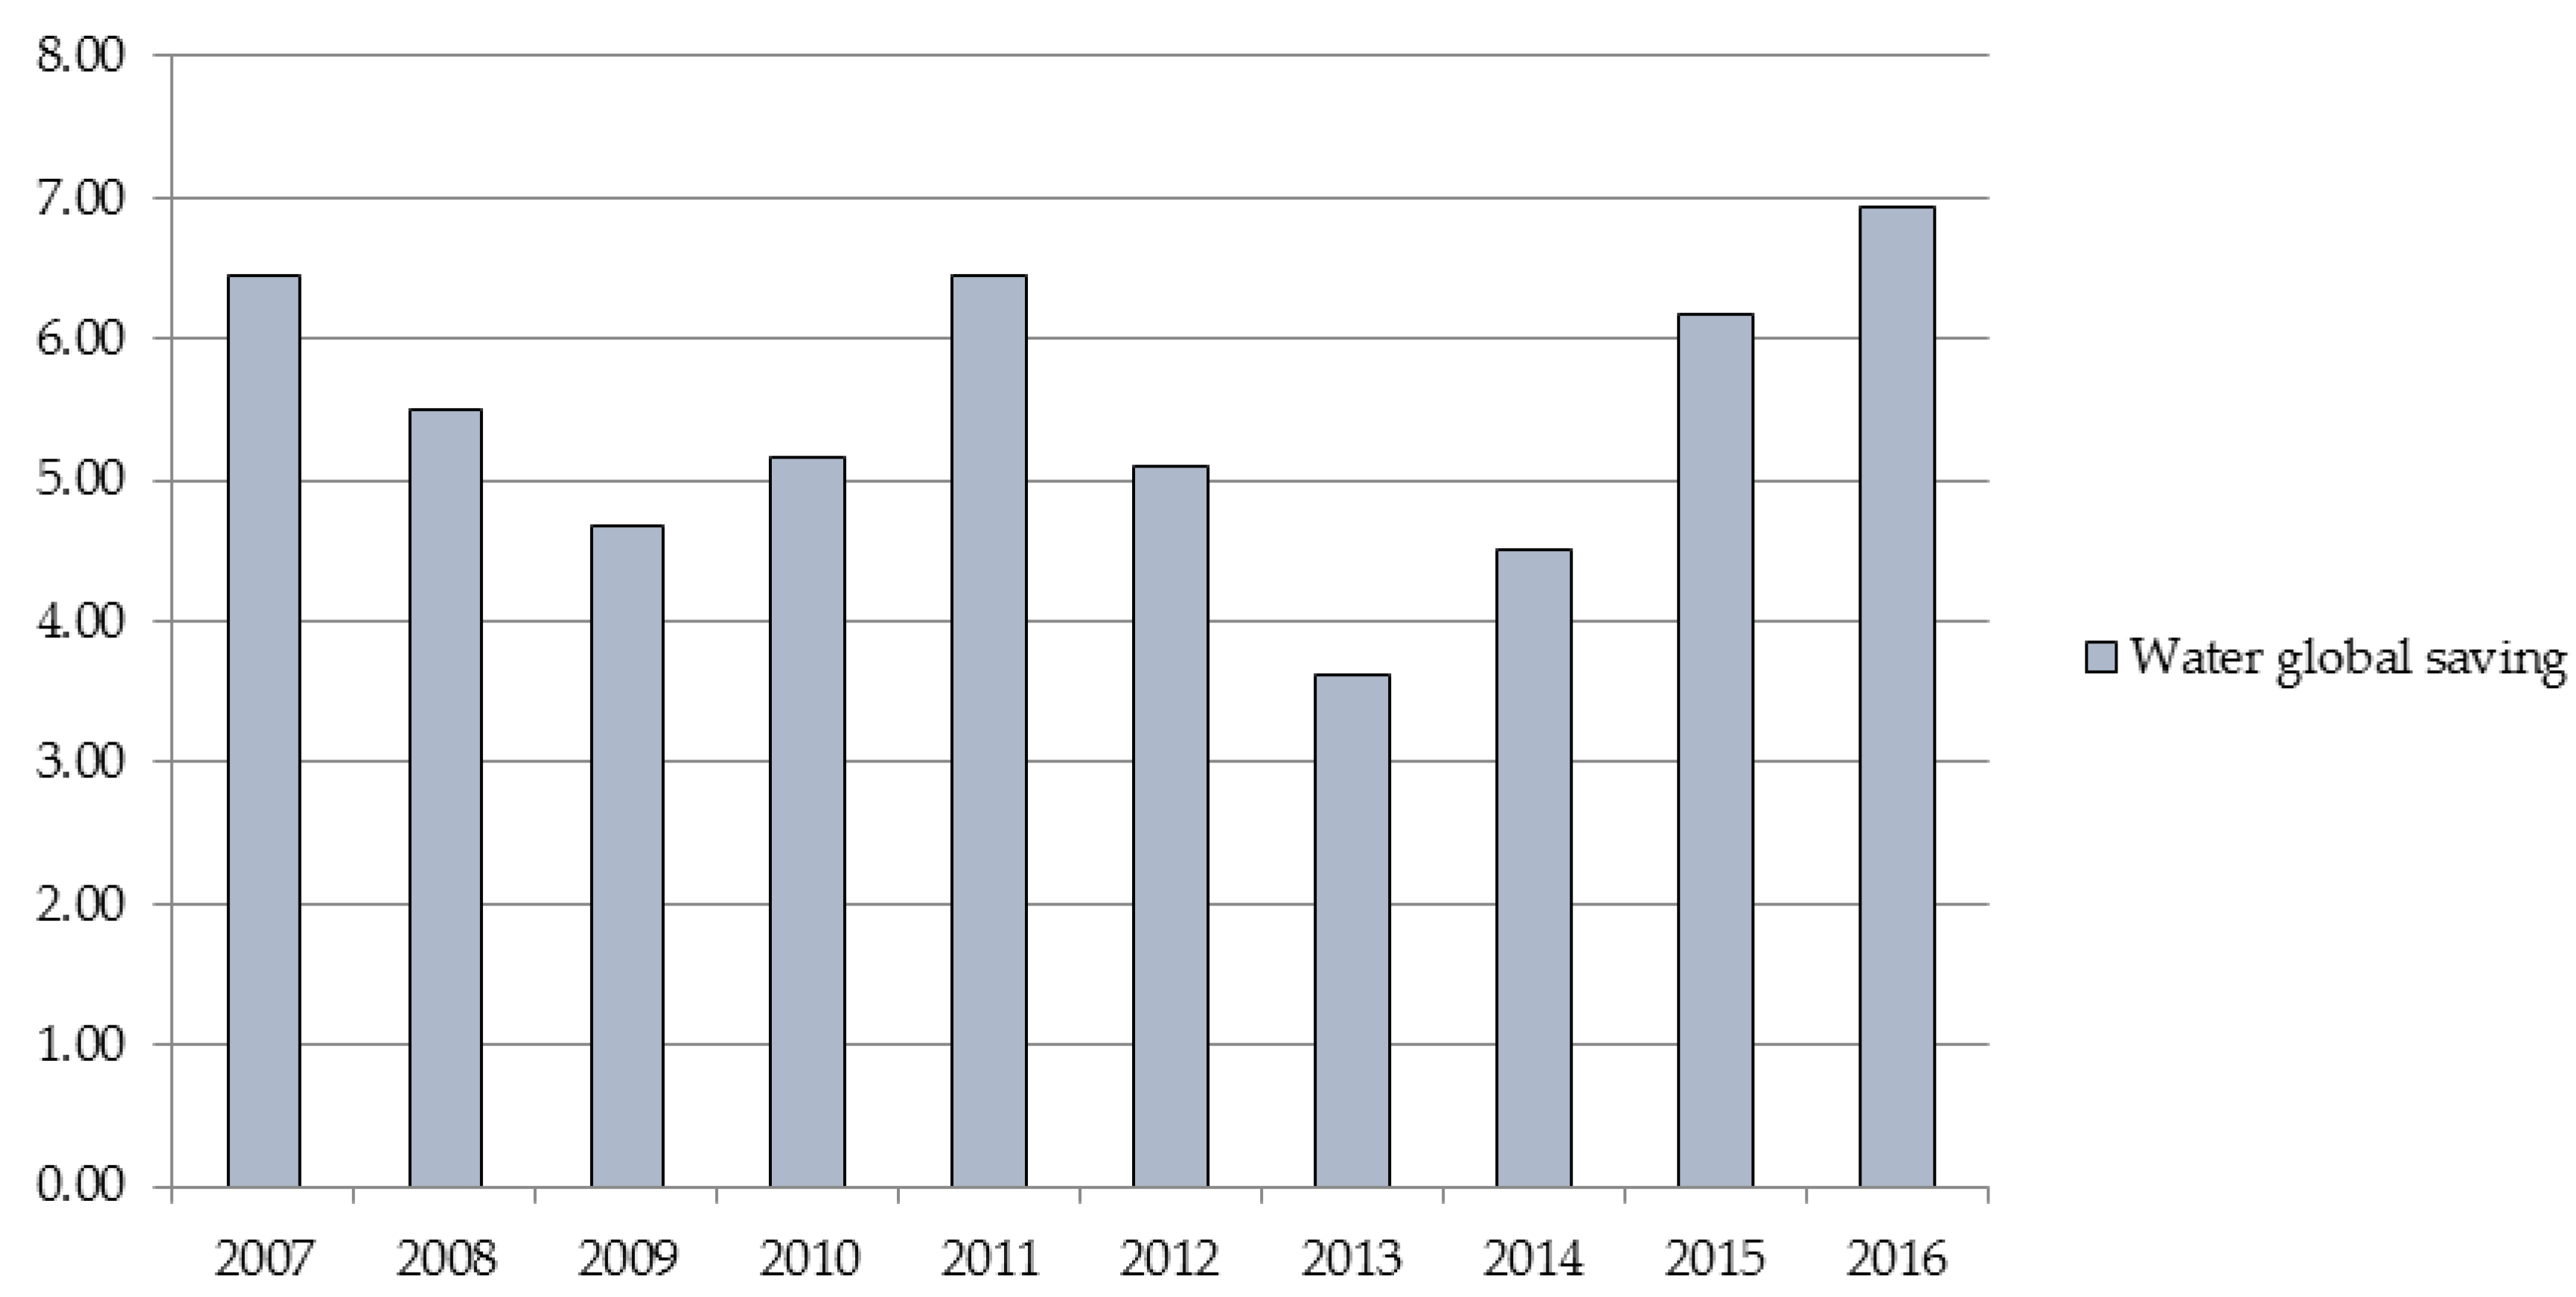
The results show that Italy had a national water loss in the period 2007–2016 on average of 14.62 million m3, and countries belonging to the Balkan Peninsula had water savings on average of 20.07 million m3. So, on a global level there was global water savings on average of 5.46 million m3 (Table 8).
Italian national water loss was mainly due to the prevalence of exports over imports in the wine trade with the Balkans. Considering the latter, the situation is completely overturned, with Italian wine imports being much higher than the Balkan wine exports.
Since the global water savings corresponds to the sum of national savings, we can conclude that the above-mentioned global water savings is due to the circumstance that differences in terms of wine water footprints between the two analyzed areas have highlighted a productive specialization of Italy from a water impact point of view.
In fact, wine is traded from the area with higher water productivity to a geographical area with lower water productivity, and it is important to underline that in this case, Italian wine productions appear overall more water friendly than the Balkan ones.
Considering the period 2007–2016, it is easy to observe a fluctuating trend but also an overall slight increase in water global savings, which registered an average variation of +0.83%, computed as geometrical mean of the annual change rates (Figure 4).
5. Conclusions
In this study we show that, from a national point of view and considering the wine trade, Italy exports water in virtual form to the Balkan countries, more than it imports, so that in effect it partially uses its own water resources for the wine supply of the Balkans. The latter, on the other hand, being a net importer of wine, partially depends on Italian water resources, exerting less pressure on its own water basins when supporting the wine supply. We also demonstrate that wine trade between Italy and the Balkans implies global water savings, derived by the sum of national savings, as highlighted in Table 8.
In line with the latest scientific literature [80,81], the study highlights also a spatially explicit differentiation of blue, green, and grey water in virtual water flows related to the wine trade between Italy and the Balkans. Green water dominates the virtual water flows, since the external water footprint both for Italy and the Balkan countries is mainly constituted by its green water component. Blue water flows characterize wine trade between Italy and, specifically, Greece, FYROM, and Montenegro. Grey water component is embodied in virtual water flows between Italy and mainly Slovenia, Greece, Serbia, and Montenegro, but generally represents the second component after the green one in each virtual water trade flow related to wine.
The results of the study can be considered a first step towards a better alignment of water policy with agricultural policy.
In line with other recent literature [82,83], the study, in fact, demonstrates that, since the agri-food commodity trade significantly influences the water appropriation in a country, the agri-food trade policy should therefore include an analysis of the effects on water resources, which receive little attention from both economists and water managers.
Notwithstanding, by focusing just on water, policy-makers and water managers cannot identify the best choices and smart strategies regarding both water resources and international trade [84], because the latter cannot be explained solely on the basis of territorial water abundance or shortage, but depends on a lot of other factors, such as availability of land, labor, knowledge and capital, competitiveness, national subsidies, and taxes [46].
To assess whether the implications resulting from virtual water studies provide insight regarding sustainability and efficiency, we need to focus on the foundations of the WF concept and methodology. Further scientific efforts have to be devoted to developing and critically examining the implications of VW estimations as policy tools [85]. In this sense, we are still far away from understanding how to manage footprints with a sustainable approach and steps forward have to be made [22,86].
However, it could be a real starting point to create a complete and integrated holistic model of natural resources utilization, in which water savings are surely a global benefit, not only for the social context but for company productivity too [6].
This important issue can move company strategy in precise directions, to search for the way to produce and to cooperate, locating the operations in which the natural conditions and technical efficiencies could be the best available. The result could not only be a reduction in terms of natural resources impacts, but also in terms of costs.
Even if, in all countries analyzed, the green component of water footprints is the main one, relations among companies could be a good context for the reduction of the grey and blue components where they have a remarkable presence as well, through know-how and expertise transferring.
Another consideration is referred to the value of production.
Our case demonstrates that specialization in technical efficiency and good promotion in foreign markets are the real tools that are necessary to build a solid position in customer preferences. This is even truer when these results are obtained in developing countries, where the selling of high price wines could be more difficult. It is still important to remember that the developing countries analyzed in this work have a great opportunity to enhance their autochthonous varieties, more than 400, since this could represent another way to reduce water footprints [87,88], as well as to improve the local culture and related economic activities.
A greener approach has to be considered for the future playground for all markets, since consumer attitudes towards a more responsible consumption were first heard more than forty years ago [89]. Consumers still need time for a total green conversion but some means, such as single-issue labels [90], can accelerate this process. In fact, the role of environmental certification, which produces an effective result on consumer, is highly relevant, and it is important that it is clearly explained [91].
Further research developments should be addressed towards estimating the global impact of the wine trade on the overall environment, through a comprehensive and integrated perspective. Taking into account the local environmental and socio–economic context, research should also address the improvement of resource value assessment, enhancing the applicability of decision-making and scenario analysis [92].
Author Contributions
The following authors contributed in full to this work. Domenico Morrone analyzed the sources and the literature and contributed to the data collection. Pier Paolo Miglietta contributed to the research design and methodology and carries out a detailed revision too. Both authors wrote the body of the paper and read and approved the final manuscript.
Conflicts of Interest
The authors declare no conflict of interest.
References
- Shrivastava, P. The role of corporations in achieving ecological sustainability. Acad. Manag. Rev. 1995, 20, 936–960. [Google Scholar] [CrossRef]
- Elkington, J. Partnerships from cannibals with forks: The triple bottom line of 21st-century business. Environ. Qual. Manag. 1998, 8, 37–51. [Google Scholar] [CrossRef]
- Shrivastava, P. Environmental technologies and competitive advantage. Strateg. Manag. J. 1995, 16, 183–200. [Google Scholar] [CrossRef]
- Porter, M.E.; Van der Linde, C. Toward a new conception of the environment-competitiveness relationship. J. Econ. Perspect. 1995, 9, 97–118. [Google Scholar] [CrossRef]
- Kramer, M.R.; Porter, M.E. Strategy and society: The link between competitive advantage and corporate social responsibility. Harvard. Bus. Rev. 2006, 84, 78–92. [Google Scholar]
- Kramer, M.R.; Porter, M.E. Creating shared value: Redefining capitalism and the role of the corporation in society. Harvard. Bus. Rev. 2011, 89, 62–77. [Google Scholar]
- Hart, S.L. Beyond greening: strategies for a sustainable world. Harvard. Bus. Rev. 1997, 75, 66–77. [Google Scholar]
- Polonsky, M.J. An introduction to green marketing. In Global Environment: Problems and Policies, 1st ed.; Atlantic Publishers and Distributors: New Delhi, India, 2008; pp. 1–15. [Google Scholar]
- Morrone, D. The influence of sustainable development on marketing theory. Megatrend Rev. 2012, 9, 1–20. [Google Scholar]
- Belz, F.M. Marketing in the 21st century. Bus. Strateg. Environ. 2006, 15, 139–144. [Google Scholar] [CrossRef]
- González-Benito, J.; González-Benito, O. An analysis of the relationship between environmental motivations and ISO14001 certification. Brit. J. Manag. 2005, 16, 133–148. [Google Scholar] [CrossRef]
- Boiral, O. Corporate greening through ISO 14001: A rational myth? Organ. Sci. 2007, 18, 127–146. [Google Scholar] [CrossRef]
- Gallup, G., Jr.; Newport, F. Americans strongly in tune with the purpose of earth day 1999. Gallup Poll Mon. 1990, 295, 5–14. [Google Scholar]
- Mainieri, T.; Barnett, E.G.; Valdero, T.R.; Unipan, J.B.; Oskamp, S. Green buying: The influence of environmental concern on consumer behavior. J. Soc. Psychol. 1997, 137, 189–204. [Google Scholar] [CrossRef]
- Vlosky, R.P.; Ozanne, L.K.; Fontenot, R.J. A conceptual model of US consumer willingness-to-pay for environmentally certified wood products. J. Consum. Mark. 1999, 16, 122–136. [Google Scholar] [CrossRef]
- Miglietta, P.P.; De Leo, F.; Toma, P. Environmental Kuznets curve and the water footprint: An empirical analysis. Water Environ. J. 2017, 31, 20–30. [Google Scholar] [CrossRef]
- FAO. ACQUASTAT database. 2010. Available online: http://www.fao.org/nr/water/aquastat/data/query/index.html?lang=en (accessed on 30 August 2017).
- UNWATER. Water and Jobs—Facts and Figures. 2016. Available online: http://unesdoc.unesco.org/images/0024/002440/244041e.pdf (accessed on 30 August 2017).
- Chen, Z.M.; Chen, G.Q. Virtual water accounting for the globalized world economy: National water footprint and international virtual water trade. Ecol. Indic. 2013, 28, 142–149. [Google Scholar] [CrossRef]
- Merett, S. Virtual water and Occam’s Razor. Water. Int. 2003, 28, 103–105. [Google Scholar] [CrossRef]
- Wichelns, D. Do the virtual water and water footprint perspectives enhance policy discussions? Int. J. Water. Resour. D. 2011, 27, 633–645. [Google Scholar] [CrossRef]
- Hoekstra, A.Y. Water footprint assessment: Evolvement of a new research field. Water. Resour. Manag. 2017, 31, 3061–3081. [Google Scholar] [CrossRef]
- International Organization for Standardization [ISO]. Environmental Management—Water Footprint—Principles, Requirements and Guidelines. 2014. [Google Scholar]
- Antonicelli, M.; Calace, D.; Morrone, D.; Russo, A.; Vastola, V. Information or confusion? The role of ecolabels in agrifood sector. Analele Universităţii din Oradea, Fascicula Ecotoxicologie, Zootehnie şi Tehnologii de Industrie Alimntară 2015, 14, 187–195. [Google Scholar]
- Organisation Internationale de la Vigne et du Vin. StatOIV Extracts. 2017. Available online: http://www.oiv.int/it/database-e-statistiche/statistiche (accessed on 30 August 2017).
- Hudelson, J.E. Eastern promises: The potential future for wine tourism in the Balkans. A. J. Tour. Manag. 2014, 3, 34–50. [Google Scholar] [CrossRef]
- Allan, J.A. Water Use and Development in Arid Regions: Environment, Economic Development and Water Resource Politics and Policy. RECIEL 1996, 5, 107–115. [Google Scholar] [CrossRef]
- Allan, J.A. Virtual Water: A Long Term Solution for Water Short Middle Eastern Economies? British Association Festival of Science—University of Leeds: Leeds, UK, 1997. [Google Scholar]
- Allan, J.A. Water stress and global mitigation: Water, food and trade. Arid Lands Newsletter. 1999. Available online: https://cals.arizona.edu/OALS/ALN/aln45/allan.html (accessed on 18 February 2018).
- Allan, J.A. The Middle East Water Question: Hydropolitics and the Global Economy; I.B. Tauris: London, UK, 2001. [Google Scholar]
- Hoekstra, A.Y.; Chapagain, A.K.; Aldaya, M.M.; Mekonnen, M.M. The Water Footprint Assessment Manual: Setting the Global Standard; Earthscan: London, UK, 2011. [Google Scholar]
- Renault, D. Value of virtual water in food: Principles and virtues. In Virtual Water Trade, Proceedings of the International Expert Meeting on Virtual Water Trade—Value of Water Research Report Series no. 12: Delft, 12–13 December 2002; UNESCO-IHE: Delft, The Netherlands, 2002; pp. 77–91. [Google Scholar]
- Wichelns, D. The role of ‘virtual water’ in efforts to achieve food security and other national goals, with an example from Egypt. Agr. Water Manag. 2001, 49, 131–151. [Google Scholar] [CrossRef]
- WWC-CME. L’eau au XXIème Siècle; Document présenté par le Conseil Mondial de l’Eau à la Conférence de Paris, Mars 1998; Ministère fédéral de l’Environnement, de la Protection de la Nature et de la Sûreté nucléaire (BMU): Berlin, Germany, 2009. [Google Scholar]
- Turton, A.R. Precipitation, People, Pipelines and Power: Towards A “Virtual Water” Based Political Ecology Discourse; MEWREW Occasional paper, Water issues Study group, School of Oriental and African Studies (SOAS) University of London: London, UK, 2000. [Google Scholar]
- Meissner, R.; Turton, A.R. The hydrosocial contract theory and the Lesotho Highlands Water Project. Water Policy 2003, 5, 115–126. [Google Scholar]
- Renault, D.; Wallender, W.W. Nutritional water productivity and diets. Agr. Water Manag. 2000, 45, 275–296. [Google Scholar] [CrossRef]
- Hoekstra, A.Y. The Relation between International Trade and Freshwater Scarcity (No. ERSD-2010–05); WTO Staff Working Paper: Geneva, Switzerland, 2010. [Google Scholar]
- De Leo, F.; Miglietta, P.P. Water footprint and virtual water trade of olive oil. In Proceedings of the 18th IGWT Symposium of Technology and innovation for a sustainable future: A commodity science perspective, Roma, Italy, 24–28 September 2012; Communication Unit of ENEA—IGWT—AISME: Rome, Italy, 2012. [Google Scholar]
- Miglietta, P.P.; De Leo, F.; Toma, P. Il ‘virtual water trade balance’ come indicatore di sostenibilità del settore vitivinicolo italiano. In Lo Sviluppo Sostenibile. Ambiente, Risorse, Innovazione, Qualità; Guido, G., Massari, S., Eds.; Franco Angeli: Milan, Italy, 2013; pp. 485–496. [Google Scholar]
- Hoekstra, A.Y.; Hung, P.Q. Virtual Water Trade: A Quantification of Virtual Water Flows Between Nations in Relation to International Crop Trade—Value of Water Research Report Series no. 11; UNESCO-IHE: Delft, The Netherlands, 2002. [Google Scholar]
- Hoekstra, A.Y.; Hung, P.Q. Globalization of water resources: International virtual water flows in relation to crop trade. Global Environ. Cha. 2005, 15, 45–56. [Google Scholar] [CrossRef]
- Yang, H.; Wang, L.; Abbaspour, K.C.; Zehnder, A.J.B. Virtual water trade: An assessment of water use efficiency in the international food trade. Hydrol. Earth. Syst. Sc. 2006, 10, 443–454. [Google Scholar] [CrossRef]
- Chapagain, A.K.; Hoekstra, A.Y.; Savenije, H.H.G. Saving Water through Global Trade—Value of Water Research Report Series no. 17; UNESCO-IHE: Delft, The Netherlands, 2005. [Google Scholar]
- Chapagain, A.K.; Hoekstra, A.Y.; Savenije, H.H.G. Water saving through international trade of agricultural products. Hydrol. Earth Syst. Sci. 2006, 10, 455–468. [Google Scholar] [CrossRef]
- Hoekstra, A.Y.; Chapagain, A.K. The water footprints of Morocco and The Netherlands: Global water use as a result of domestic consumption of agricultural commodities. Ecol. Econ. 2007, 64, 143–151. [Google Scholar] [CrossRef]
- Chapagain, A.K.; Hoekstra, A.Y. The global component of freshwater demand and supply: An assessment of virtual water flows between nations as a result of trade in agricultural and industrial products. Water. Int. 2008, 33, 19–32. [Google Scholar] [CrossRef]
- Dalin, C.; Konar, M.; Hanasaki, N.; Rinaldo, A.; Rodriguez-Iturbe, I. Evolution of the global virtual water trade network. PNAS 2012, 109, 5989–5994. [Google Scholar] [CrossRef] [PubMed]
- Jiang, W.; Marggraf, R. Bilateral virtual water trade in agricultural products: A case study of Germany and China. Water. Intl. 2015, 40, 483–498. [Google Scholar] [CrossRef]
- Schwarz, J.; Mathijs, E.; Maertens, M. Changing patterns of global agri-food trade and the economic efficiency of virtual water flows. Sustainability 2015, 7, 5542–5563. [Google Scholar] [CrossRef] [Green Version]
- Duarte, R.; Pinilla, V.; Serrano, A. Understanding agricultural virtual water flows in the world from an economic perspective: A long term study. Ecol. Indic. 2016, 61, 980–990. [Google Scholar] [CrossRef]
- Serrano, A.; Guan, D.; Duarte, R.; Paavola, J. Virtual Water Flows in the EU27: A Consumption-based Approach. J. Ind. Ecol. 2016, 20, 547–558. [Google Scholar] [CrossRef] [Green Version]
- Lutter, S.; Pfister, S.; Giljum, S.; Wieland, H.; Mutel, C. Spatially explicit assessment of water embodied in European trade: A product-level multi-regional input-output analysis. Global Environ. Change 2016, 38, 171–182. [Google Scholar] [CrossRef]
- Fracasso, A.; Sartori, M.; Schiavo, S. Determinants of virtual water flows in the Mediterranean. Sci. Total. Environ. 2016, 543, 1054–1062. [Google Scholar] [CrossRef] [PubMed]
- Duarte, R.; Pinilla, V.; Serrano, A. The effect of globalisation on water consumption: A case study of the Spanish virtual water trade, 1849–1935. Ecol. Econ. 2014, 100, 96–105. [Google Scholar] [CrossRef]
- Chen, G.Q.; Li, J.S. Virtual water assessment for Macao, China: Highlighting the role of external trade. J. Clean. Prod. 2015, 93, 308–317. [Google Scholar] [CrossRef]
- Hassan, R.; Thiam, D.R. Implications of water policy reforms for virtual water trade between South Africa and its trade partners: economy-wide approach. Water Policy 2015, 17, 649–663. [Google Scholar] [CrossRef]
- Kagohashi, K.; Tsurumi, T.; Managi, S. The effects of international trade on water use. PLoS. ONE 2015, 10. [Google Scholar] [CrossRef] [PubMed] [Green Version]
- Tuninetti, M.; Tamea, S.; Laio, F.; Ridolfi, L. To trade or not to trade: Link prediction in the virtual water network. Adv. Water. Resour. 2017, 110, 528–537. [Google Scholar] [CrossRef]
- Toma, P.; Miglietta, P.P.; Zurlini, G.; Valente, D.; Petrosillo, I. A non-parametric bootstrap-data envelopment analysis approach for environmental policy planning and management of agricultural efficiency in EU countries. Ecol. Indic. 2017, 83, 132–143. [Google Scholar] [CrossRef]
- De Leo, F.; Miglietta, P.P. The contribution of environmental indicators to the sustainable performance of countries. Int. J. Sustain. Policy Prac. 2015, 11, 12–26. [Google Scholar] [CrossRef]
- Liu, X.; Klemeš, J.J.; Varbanov, P.S.; Čuček, L.; Qian, Y. Virtual carbon and water flows embodied in international trade: A review on consumption-based analysis. J. Clean. Prod. 2017, 146, 20–28. [Google Scholar] [CrossRef]
- European Parliament. Fact Sheets on the European Union—The EU’s external relations—The Western Balkans. 2017. Available online: http://www.europarl.europa.eu/atyourservice/en/displayFtu.html?ftuId=FTU_6.5.2.html (accessed on 30 August 2017).
- Italian Minister of Foreign Affairs and International Cooperation. IV Vertice dei Balcani Occidentali. 2017. Available online: http://www.businessforumverticebalcanioccidentali.ice.it/evento (accessed on 30 August 2017).
- Italian Minister of Economic Development. Commercio internazionale—Schede Paese. 2017. Available online: http://www.sviluppoeconomico.gov.it/index.php/it/commercio-internazionale/2036136-scheda-paese-europa (accessed on 30 August 2017).
- Italian Minister of Foreign Affairs and International Cooperation. Overview dei rapporti con l’Italia. 2017. Available online: http://www.infomercatiesteri.it/paesi.php (accessed on 30 August 2017).
- World Bank. GNI per capita, Atlas method (current US$). 2017. Available online: https://data.worldbank.org/indicator/NY.GNP.PCAP.CD (accessed on 30 August 2017).
- Bărbulescu, O. Potential and risks in the Romanian wine industry. Bulletin Transilv.—Univ. Brasov. Econ. Sci. 2017, 10, 193–202. [Google Scholar]
- Marks, D. Competitiveness and the market for Central and Eastern European wines: A cultural good in the global wine market. J. Wine. Res. 2011, 22, 245–263. [Google Scholar] [CrossRef]
- Vujicic, M.; Ristic, L.; Vujicic, M. European integration and rural development policy of the Republic of Serbia and West Balkan countries. Bulg. J. Agr. Sci. 2012, 18, 519–530. [Google Scholar]
- ISTAT. Coeweb—Statistiche del commercio estero. 2017. Available online: https://www.coeweb.istat.it/ (accessed on 30 August 2017).
- Anderson, K.; Wittwer, G. Modeling global wine markets to 2018: Exchange rates, taste changes, and China’s import growth. JWE 2013, 8, 131–158. [Google Scholar] [CrossRef]
- Fraga, H.; Malheiro, A.C.; Moutinho-Pereira, J.; Santos, J.A. An overview of cLimate change impacts on European viticulture. Food Energy Security 2012, 1, 94–110. [Google Scholar] [CrossRef]
- Reed, J.M.; Kryštufek, B.; Eastwood, W.J. The physical geography of the Balkans and nomenclature of place names. Balkan Biodivers. 2004, 9–22. [Google Scholar] [CrossRef]
- Mekonnen, M.M.; Hoekstra, A.Y. The Green, Blue and Gray Water Footprint of Crops and Derived Crop Products -Value of Water Research Report Series no. 47; UNESCO-IHE: Delft, The Netherlands, 2010. [Google Scholar]
- Miglietta, P.P.; Toma, P.; Fanizzi, F.P.; De Donno, A.; Coluccia, B.; Migoni, D.; Bagordo, F.; Serio, F. A Grey Water Footprint Assessment of Groundwater Chemical Pollution: Case Study in Salento (Southern Italy). Sustain.-Basel 2017, 9, 799. [Google Scholar] [CrossRef]
- Oki, T.; Yano, S.; Hanasaki, N. Economic aspects of virtual water trade. Environ. Res. Lett. 2017, 12. [Google Scholar] [CrossRef]
- Owusu-Sekyere, E.; Jordaan, H.; Chouchane, H. Evaluation of water footprint and economic water productivities of dairy products of South Africa. Ecol. Indics. 2017, 83, 32–40. [Google Scholar] [CrossRef]
- Chouchane, H.; Hoekstra, A.Y.; Krol, M.S.; Mekonnen, M.M. The water footprint of Tunisia from an economic perspective. Ecolo. Indic. 2015, 52, 311–319. [Google Scholar] [CrossRef]
- Fader, M.; Gerten, D.; Thammer, M.; Heinke, J.; Lotze-Campen, H.; Lucht, W.; Cramer, W. Internal and external green-blue agricultural water footprints of nations, and related water and land savings through trade. Hydrol. Earth. Sys. Sci. 2011, 15, 1641–1660. [Google Scholar] [CrossRef] [Green Version]
- Shtull-Trauring, E.; Bernstein, N. Virtual water flows and water-footprint of agricultural crop production, import and export: A case study for Israel. Sci. Total Environ. 2018, 622, 1438–1447. [Google Scholar] [CrossRef]
- Lamastra, L.; Miglietta, P.P.; Toma, P.; De Leo, F.; Massari, S. Virtual water trade of agri-food products: Evidence from italian-chinese relations. Sci. Total. Environ. 2017, 599, 474–482. [Google Scholar] [CrossRef] [PubMed]
- Antonelli, M.; Tamea, S.; Yang, H. Intra-EU agricultural trade, virtual water flows and policy implications. Sci. Total. Environ. 2017, 587, 439–448. [Google Scholar] [CrossRef] [PubMed]
- Wichelns, D. Virtual water and water footprints do not provide helpful insight regarding international trade or water scarcity. Ecol. Indic. 2015, 52, 277–283. [Google Scholar] [CrossRef]
- Beltrán, M.J. Response—What do virtual water and water footprint conceal? Water Altern. 2016, 9, 162–164. [Google Scholar]
- Chenoweth, J.; Hadjikakou, M.; Zoumides, C. Quantifying the human impact on water resources: A critical review of the water footprint concept. Hydrol. Earth Syst. Sci. 2014, 18, 2325–2342. [Google Scholar] [CrossRef] [Green Version]
- Miglietta, P.P.; De Leo, F.; Massari, S. Water footprint assessment of some Italian wines: A territorial perspective. Int. J. Environ. Policy Dec. Mak. 2015, 1, 320–331. [Google Scholar] [CrossRef]
- De Leo, F.; Miglietta, P.P.; Massari, S. Water Sustainability Assessment of Italian Vineyards: Doc vs. Generic Wines. In Proceedings of the 1st specialized conference of Contemporary Trends and Perspectives in Wine and Agrifood Management, Lecce, Italy, 16–17 January 2015; Vrontis, D., Weber, Y., TsoUKatos, E., Maizza, A., Eds.; EuRomed Press: Nicosia, Cyprus, 2015; pp. 135–147. [Google Scholar] [CrossRef]
- Fisk, G. Criteria for a theory of responsible consumption. J. Market. 1973, 24–31. [Google Scholar] [CrossRef]
- Young, W.; Hwang, K.; McDonald, S.; Oates, C.J. Sustainable consumption: green consumer behaviour when purchasing products. Sustain. Dev. 2010, 18, 20–31. [Google Scholar] [CrossRef]
- Janssen, M.; Hamm, U. Product labelling in the market for organic food: Consumer preferences and willingness-to-pay for different organic certification logos. Food. Qual. Prefer. 2012, 25, 9–22. [Google Scholar] [CrossRef]
- Dalin, C.; Rodríguez-Iturbe, I. Environmental impacts of food trade via resource use and greenhouse gas emissions. Environ. Res. Lett. 2016, 11. [Google Scholar] [CrossRef]
Figure 1.
Map of Italy and Balkan countries considered in the present study.

Figure 2.
Composition of the water footprints of wine produced in the countries of the Balkan Peninsula and Italy. Elaboration based on Mekonnen and Hoekstra [75].
Figure 2.
Composition of the water footprints of wine produced in the countries of the Balkan Peninsula and Italy. Elaboration based on Mekonnen and Hoekstra [75].

Figure 3.
Economic water productivities of wine imports and exports for Italy. Elaboration based on ISTAT [71] and Mekonnen and Hoekstra [75].

Figure 4.
Global water saving due to the wine trade between Italy and the Balkans. Elaboration based on ISTAT [71] and Mekonnen and Hoekstra [75].


Table 1.
Visions on Virtual Water.
| Name | Description | References |
|---|---|---|
| The supply driven visions | They are based on the economic theory of comparative advantage. | |
| Strategic vision for food security | In order to reduce the pressure on natural resources, countries can use international markets for their food supply. | [29,33] |
| Liberal vision | Importing food (and so the water embedded within) is a way to open the national water market and guarantee profitable water use. | [29,34] |
| Ecological vision | Virtual water helps in water management and in conducting production to areas with better natural conditions, efficiency, and sustainability. | [35] |
| Solidarity vision | It admits that decisions in surplus countries may have real impacts on poor countries. | [36] |
| The demand driven vision | According to this vision, population, food habits (diets), and debate on “water for food” drive the amount of water required for food production. | [37] |
Authors’own elaboration based on Renault [32].
Table 2.
Italian position in trade relationship with the Balkan countries.
| Balkan Country | Italian Position in Trading | N° of Italian Companies |
|---|---|---|
| Albania | First trading partner (2016) | Almost 600 |
| Bosnia-Herzegovina | Second trading partner (2015) | Almost 70 |
| Bulgaria | Second importer and third supplier (2015) | Almost 2000 |
| Croatia | First importer and second supplier (2016) | Important presence |
| Greece | First importer and second supplier (2016) | Important presence |
| Kosovo | Third importer and sixth supplier (2015) | Almost 18 |
| FYROM | Fourth importer and sixth supplier (2015) | Important presence |
| Montenegro | Second importer and fourth supplier (2015) | Important presence |
| Romania | Second trading partner (2015) | Almost 23,000 |
| Serbia | First importer and second supplier (2015) | Almost 600 |
| Slovenia | Second trading partner (2016) | More than 1000 |
Table 3.
Balkans Population and Gross National Income per capita in 2016.
| Country | Population | GNI per Capita (Current U.S. $) |
|---|---|---|
| Albania | 2,876,101 | 4250 |
| Bosnia-Herzegovina | 3,516,816 | 4880 |
| Bulgaria | 7,127,822 | 7470 |
| Croatia | 4,170,600 | 12,110 |
| Greece | 10,746,740 | 18,960 |
| Kosovo | 1,816,200 | 3850 |
| FYROM | 2,081,206 | 4980 |
| Montenegro | 622,781 | 6970 |
| Romania | 19,705,301 | 9470 |
| Serbia | 7,057,412 | 5280 |
| Slovenia | 2,064,845 | 21,660 |
Elaboration based on World Bank [67].
Table 4.
Italy trade exchange with the Balkans (millions of Euro).
| Country | Trade Exchange | Export Italy | Import Italy | Trade Exchange Δ vs. Last Year |
|---|---|---|---|---|
| Albania * | 2166 | 1268 | 898 | 3.0% |
| Bosnia-Herzegovina *** | 1341 | 652 | 689 | 3.1% |
| Bulgaria ** | 3624 | 1631 | 1993 | 4.0% |
| Croatia *** | 4037 | 2549 | 1488 | 0.6% |
| Greece *** | 6383 | 3841 | 2542 | 2.1% |
| Kosovo *** | 95.2 | 89.9 | 5.3 | −7.1% |
| FYROM *** | 427 | 256 | 171 | −2.3% |
| Montenegro *** | 158 | 134 | 24 | −4.9% |
| Romania *** | 12,855 | 6609 | 6246 | −1.9% |
| Serbia *** | 3302 | 1514 | 1788 | 0.5% |
| Slovenia *** | 6234 | 3642 | 2592 | −1.7% |
Elaboration based on Italian Minister of Economic Development [65] (* data 2015; ** the period considered is Jan.–Oct. 2015; *** data 2016).
Table 5.
Italian wine import/export from/to the Balkans.
| Year | Italian Import | Italian Export | ||||
|---|---|---|---|---|---|---|
| Value (euro) | Quantity (Kg) | Value/Quantity (euro/Kg) | Value (euro) | Quantity (Kg) | Value/Quantity (euro/Kg) | |
| 2007 | 2,326,100 | 3,353,944 | 0.694 | 25,591,304 | 32,106,499 | 0.797 |
| 2008 | 1,059,769 | 653,601 | 1.621 | 29,380,267 | 25,192,191 | 1.166 |
| 2009 | 1,840,476 | 1,075,308 | 1.712 | 24,289,888 | 21,958,633 | 1.106 |
| 2010 | 2,752,869 | 5,832,173 | 0.472 | 27,191,282 | 28,828,646 | 0.943 |
| 2011 | 5,165,213 | 9,581,451 | 0.539 | 32,824,531 | 38,347,513 | 0.856 |
| 2012 | 7,071,017 | 10,892,308 | 0.649 | 36,255,691 | 33,609,986 | 1.079 |
| 2013 | 4,761,525 | 6,089,981 | 0.782 | 35,563,073 | 22,285,373 | 1.596 |
| 2014 | 3,820,866 | 3,252,157 | 1.175 | 36,605,162 | 23,384,883 | 1.565 |
| 2015 | 3,952,571 | 2,132,504 | 1.853 | 42,988,235 | 29,681,859 | 1.448 |
| 2016* | 3,929,525 | 2,040,597 | 1.926 | 47,406,929 | 33,027,731 | 1.435 |
Author’s own elaboration based on ISTAT(Italian National Institute of Statistics) [71] (* 2016: estimated value).
Table 6.
The Balkans wine production, consumption, and imports/exports.
| Year | Production (1000 hL) | Consumption (1000 hL) | Individual Consuption (L) | Import (1000 hL) | Export (1000 hL) |
|---|---|---|---|---|---|
| 2007 | 15,724 | 12.883 | 183 | 1.400 | 2.779 |
| 2008 | 15,688 | 14.375 | 235 | 1.247 | 2.533 |
| 2009 | 17,188 | 15.267 | 244 | 875 | 1.900 |
| 2010 | 13,042 | 14.575 | 244 | 964 | 1.929 |
| 2011 | 13,222 | 13.076 | 226 | 1.842 | 2.316 |
| 2012 | 12,873 | 13.451 | 228 | 1.415 | 2.534 |
| 2013 | 15,731 | 13.380 | 228 | 1.189 | 2.073 |
| 2014 | 12,384 | 13.235 | 225 | 1.263 | 1.821 |
Elaboration based on Organisation Internationale de la Vigne et du Vin [22] (2015 and 2016 are not currently available).
Table 7.
Traded volumes and related virtual water flows of wines between Italy and the Balkans, 2007–2016.
Table 7.
Traded volumes and related virtual water flows of wines between Italy and the Balkans, 2007–2016.
| Balkan Wines Imported in Italy | |||||||||||||||||||||||
|---|---|---|---|---|---|---|---|---|---|---|---|---|---|---|---|---|---|---|---|---|---|---|---|
| Volume of trade (tons) | Virtual water flow (million m3) | ||||||||||||||||||||||
| Product code (HS) | Description | 2007 | 2008 | 2009 | 2010 | 2011 | 2012 | 2013 | 2014 | 2015 | 2016 | Average | 2007 | 2008 | 2009 | 2010 | 2011 | 2012 | 2013 | 2014 | 2015 | 2016 | Average |
| 2204 | Wine of fresh grapes | 3354 | 654 | 1075 | 5832 | 9581 | 10,892 | 6090 | 3252 | 2133 | 2041 | 4490 | 2.53 | 0.59 | 1.01 | 4.40 | 7.45 | 9.14 | 5.37 | 2.61 | 1.95 | 1.96 | 3.70 |
| Italian wines imported in the Balkans | |||||||||||||||||||||||
| Volume of trade (tons) | Virtual water flow (million m3) | ||||||||||||||||||||||
| Product code (HS) | Description | 2007 | 2008 | 2009 | 2010 | 2011 | 2012 | 2013 | 2014 | 2015 | 2016 | Average | 2007 | 2008 | 2009 | 2010 | 2011 | 2012 | 2013 | 2014 | 2015 | 2016 | Average |
| 2204 | Wine of fresh grapes | 32,106 | 25,192 | 21,959 | 28,829 | 38,348 | 33,610 | 22,285 | 23,385 | 29,682 | 33,028 | 28,842 | 19.27 | 15.12 | 13.18 | 17.30 | 23.02 | 20.17 | 13.38 | 14.04 | 17.82 | 19.82 | 17.31 |
Table 8.
Time series of Italian, Balkan, and global water savings related to the wine trade.
| Years | S Italy (mln m3) | S Balkans (mln m3) | S Global (mln m3) |
|---|---|---|---|
| 2007 | −17.26 | 23.70 | 6.44 |
| 2008 | −14.73 | 20.23 | 5.50 |
| 2009 | −12.54 | 17.21 | 4.68 |
| 2010 | −13.80 | 18.96 | 5.15 |
| 2011 | −17.27 | 23.71 | 6.44 |
| 2012 | −13.64 | 18.73 | 5.09 |
| 2013 | −9.72 | 13.35 | 3.63 |
| 2014 | −12.08 | 16.59 | 4.51 |
| 2015 | −16.54 | 22.71 | 6.17 |
| 2016 | −18.60 | 25.54 | 6.94 |
| Average 2007–2016 | −14.62 | 20.07 | 5.46 |
© 2018 by the authors. Licensee MDPI, Basel, Switzerland. This article is an open access article distributed under the terms and conditions of the Creative Commons Attribution (CC BY) license (http://creativecommons.org/licenses/by/4.0/).
Share and Cite
MDPI and ACS Style
Miglietta, P.P.; Morrone, D. Managing Water Sustainability: Virtual Water Flows and Economic Water Productivity Assessment of the Wine Trade between Italy and the Balkans. Sustainability 2018, 10, 543. https://doi.org/10.3390/su10020543
AMA Style
Miglietta PP, Morrone D. Managing Water Sustainability: Virtual Water Flows and Economic Water Productivity Assessment of the Wine Trade between Italy and the Balkans. Sustainability. 2018; 10(2):543. https://doi.org/10.3390/su10020543
Chicago/Turabian StyleMiglietta, Pier Paolo, and Domenico Morrone. 2018. "Managing Water Sustainability: Virtual Water Flows and Economic Water Productivity Assessment of the Wine Trade between Italy and the Balkans" Sustainability 10, no. 2: 543. https://doi.org/10.3390/su10020543
Note that from the first issue of 2016, this journal uses article numbers instead of page numbers. See further details here.