1. Introduction
Currently, as human activity increases, the amount of land to support such activity becomes scarcer. Many cities have been developed through uncontrolled construction without sufficient planning, thereby resulting in their rapid expansion. In 1996, the United Nation’s Habitat Conference introduced the concept of liveability and noted that every city should be habitable. Since World War II, Gross Domestic Product (GDP) has become the standard measure of economic development even though it was only intended as a macroeconomic accounting tool. GDP has several disadvantages when it is used to measure the public’s tangible well-being [
1] (p. 13). stated that GDP does not account for factors such as pollution, environmental degradation, resource depletion, human liberty and the value of leisure. Consequently, several other city development indices have been developed in addition to GDP. Such indices assign countries numeric indicators of development, thereby ensuring ease in comparisons. One example is the Human Development Index (HDI) which is a simple average of three indices that reflect a country’s achievements in health and longevity, education, and living standards [
2]. Moreover, Mercer’s Quality of Living Survey is used to help governments and key corporations place personnel on international assignments. Also, the Quality of Living Survey is used to rank cities based on an evaluation of 39 factors, including political, economic, environmental, personal safety, health, education, transportation and other public service factors [
3]. Recently, the Economist Intelligence Unit (EIU)’s Global Liveability Report ranked cities according to aspects of widespread availability of goods and services, low personal risk, and effective infrastructure. The aspects were subdivided into nine factors to determine a nation’s score [
4]. In Thailand, a well-being index was initially developed in 2004 by the National Economic and Social Development Board (NESDB). This index measured cities on 3 dimensions with 41 factors [
5].
A variation of the Australian approach used six factors: remoteness from the local population, remoteness from national population centres, remoteness from mechanized access, apparent naturalness, biophysical centres, and altitude [
6] (pp. 24–29). They used a web application to allow users to explore the impacts of different factor weights on the resulting wildness maps. On the other hand, the Scottish Natural Heritage (SNH) generated data for the four principal factors that contribute to wildness in Scotland [
7] (pp. 144–152). These included perceived naturalness of land cover, absence of modern artefacts, rugged and physically challenging terrain, and remoteness. The resulting map of wildness is fuzzy and based on perceptions of wildness rather than strict ecological definitions. Planning and decision making bodies would like to be able to identify boundaries between ‘wild’ and ‘not wild’ for use in supporting decisions related to planning and developments. The liveable index should be able to cover a wide range of indicators that can be considered good determiners of the liveability level of the residents in the areas [
8,
9] (pp. 357–369), [
10].
Even though the environmental development of any specific location mostly involves both the natural and built environment [
11,
12,
13]. the scope and contents of urban development indicators may differ from one project to another [
14] (pp. 1768–1786). This study focused only on the physical surroundings built by human activities and relating to infrastructure services. Although there are various indices to measure city development, most of these considered only economic features, which are not strong indices of well-being. To enhance the liveability level of the urban areas, the concept of Knowledge-Based Urban Development (KBUD) has, for the past 10 years, been mentioned numerous times in literature as it aims to improve other dimensions of people’s living conditions and their quality of life [
15] (pp. 228–242), [
16] (pp. 374–382). For instance, the EIU’s index does not consider climate or the cost of living as a factor in evaluating the liveability of a city. Also, although there are numerous factors that have been used to score cities, there are no simple techniques that can be used to compare development across countries and time periods. Furthermore, it is difficult to determine how to weigh the importance of each variable. Most research in the domain of liveable cities did not aim to measure the quality of urban life from the perspective of permanent residents. Many liveable city indicators were not developed based on resident opinion surveys. Therefore, these indicators may not adhere to the residents’ definition of the liveability of their city. Furthermore, research should highlight the physical data that can be obtained to avoid biases and emotions associated with liveable city factors. As for developing countries like Thailand where internet access and usage is still limited, the mixture of both internet-based and paper-based surveys that was used for the data collecting process is crucially important in reaching out to those living in the remote areas. In sum, a proposed set of indices with a comprehensive coverage of key factors provides revealing findings that could be a proper guideline for the policy development and action planning of a sustainable urban future [
17] (pp. 509–532), [
18] (pp. 381–392), [
19] (pp. 7–24).
To overcome the limitations of the EIU’s and Mercer’s well-being measures, the main objective of the current study is to develop a Liveable City Index (LCI) and generate a Liveable City Zonation Map (LCZM). The Khon Kaen district in north-eastern Thailand, was selected as a case study to develop the LCI. The Medium class cities were the focus of this study due to the fact that there is still more room for development when compared to the Primary class cities in which there are already large numbers of people and developed infrastructure. The current study specifically considers peoples’ participation in the creation of the LCI to address the above-stated issues. Questionnaire survey responses from local community members and experts were used to choose and rank the factors using a spatial Multi-Attribute Decision Making (MADM) Technique in Geographic Information Systems (GIS).
2. Materials and Methods
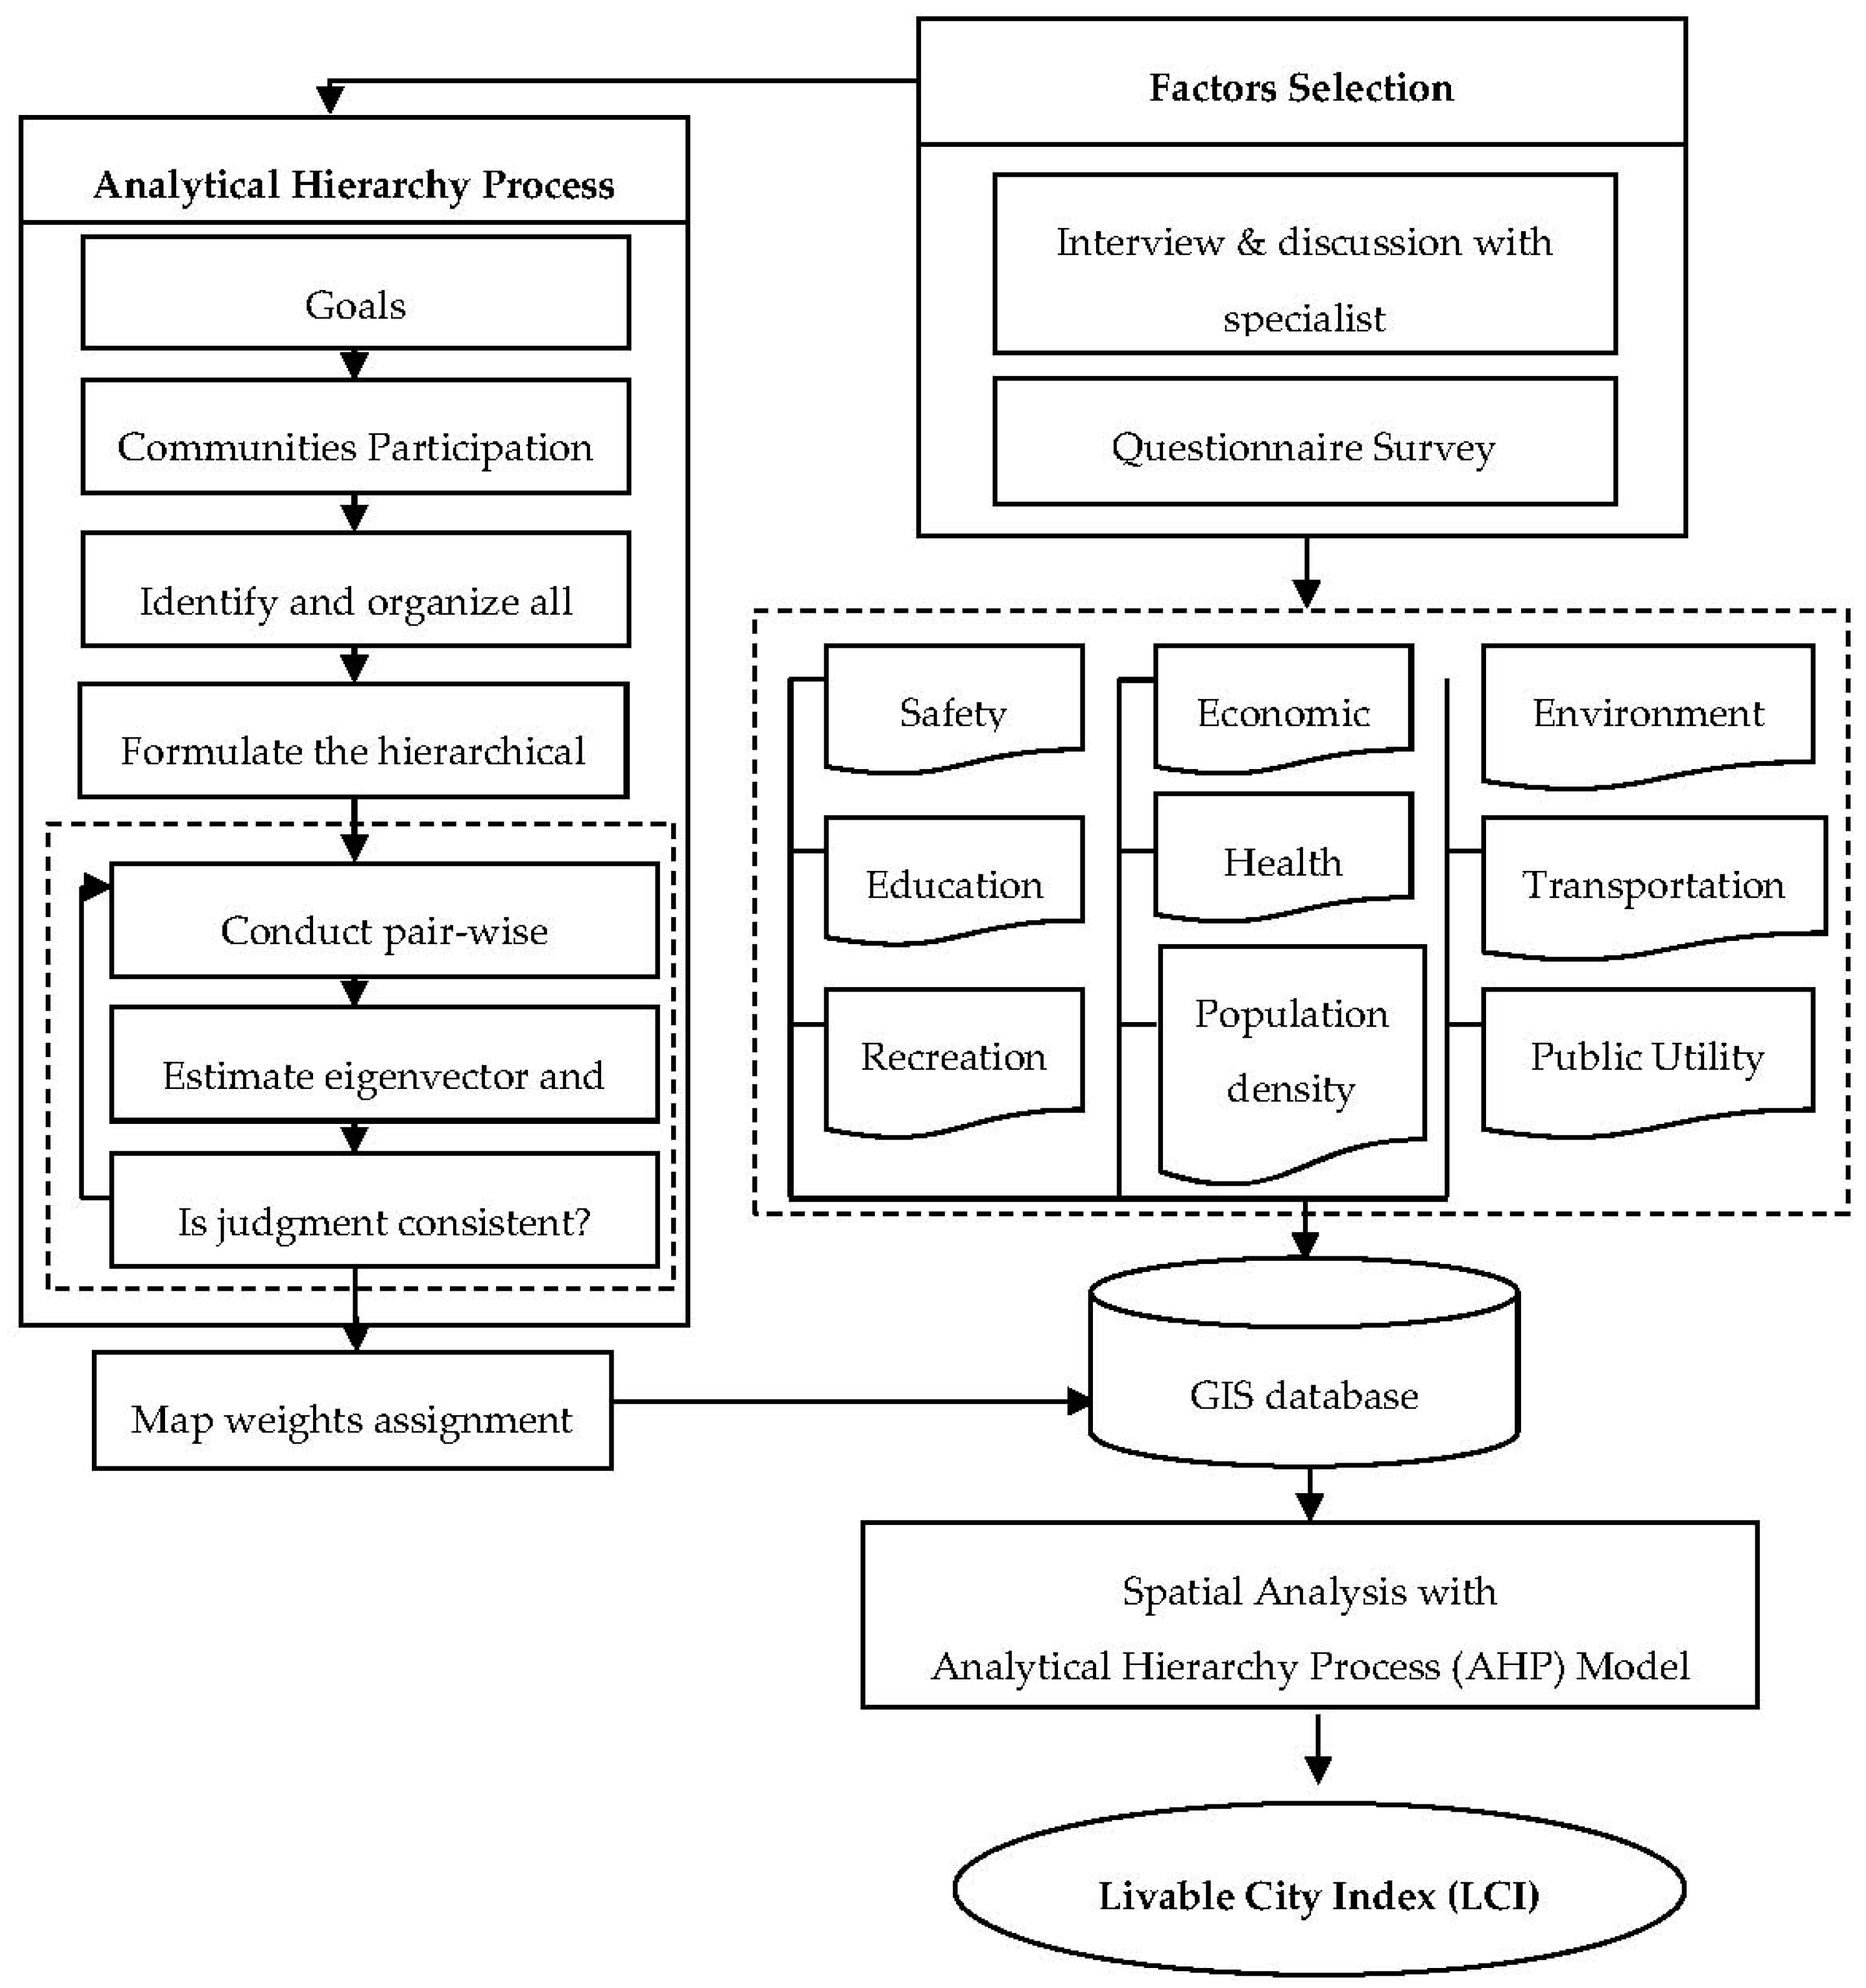
This study implemented a GIS based multi-attribute decision making analysis for developing a Liveable City Index (LCI) of the Muang district of Khon Kaen, Thailand, in the period 2003–2014. The major focus of this research was to include residents’ participation in different stages of the development process. In addition, the study also aimed to involve governmental organizations and academic institutes through formal interviews. The Analytic Hierarchy Process (AHP) used in this study employed pair-wise comparison of factors and sub-factors which was later translated into weights. The overall methodology is summarized in the flowchart shown in
Figure 1.
2.1. Analytic Hierarchy Process
A common technique which countenances and quantifies experts’ opinions in the form of weights is the Analytic Hierarchy Process. The AHP is a theory of measurement concerned with deriving dominance priorities (relative importance or relative weights) from paired comparisons of homogeneous or clustered heterogeneous decision elements with respect to a common attribute [
20] (p. 283). Saaty’s Weighting Method of AHP is used to determine the weights of indicators at different levels of an indicator system [
21] (pp. 2262–2277).
Furthermore, AHP can assist the decision maker in effectively summarizing and assessing all information, defining the right questions and determining the optimum and most appropriate solutions [
22] (pp. 645–656). The AHP method is applied to derive the weights of parameters because of its simple hierarchical structure, sound mathematical basis, widespread usage, and ability to measure inconsistencies in judgements [
23] (pp. 343–355). The AHP links the grey relational grades of the Macro Indicators (MIs) and Specific Indicators (SIs), which are obtained through the GTT (Global Trigger Tool) approach via the hierarchy calculation of the MI and SI grey matrices. This process is also used to define the final weights of the SIs in the urban area [
24] (pp. 2084–2108).
2.2. Study Area: The Muang District of Khon Kaen, Thailand
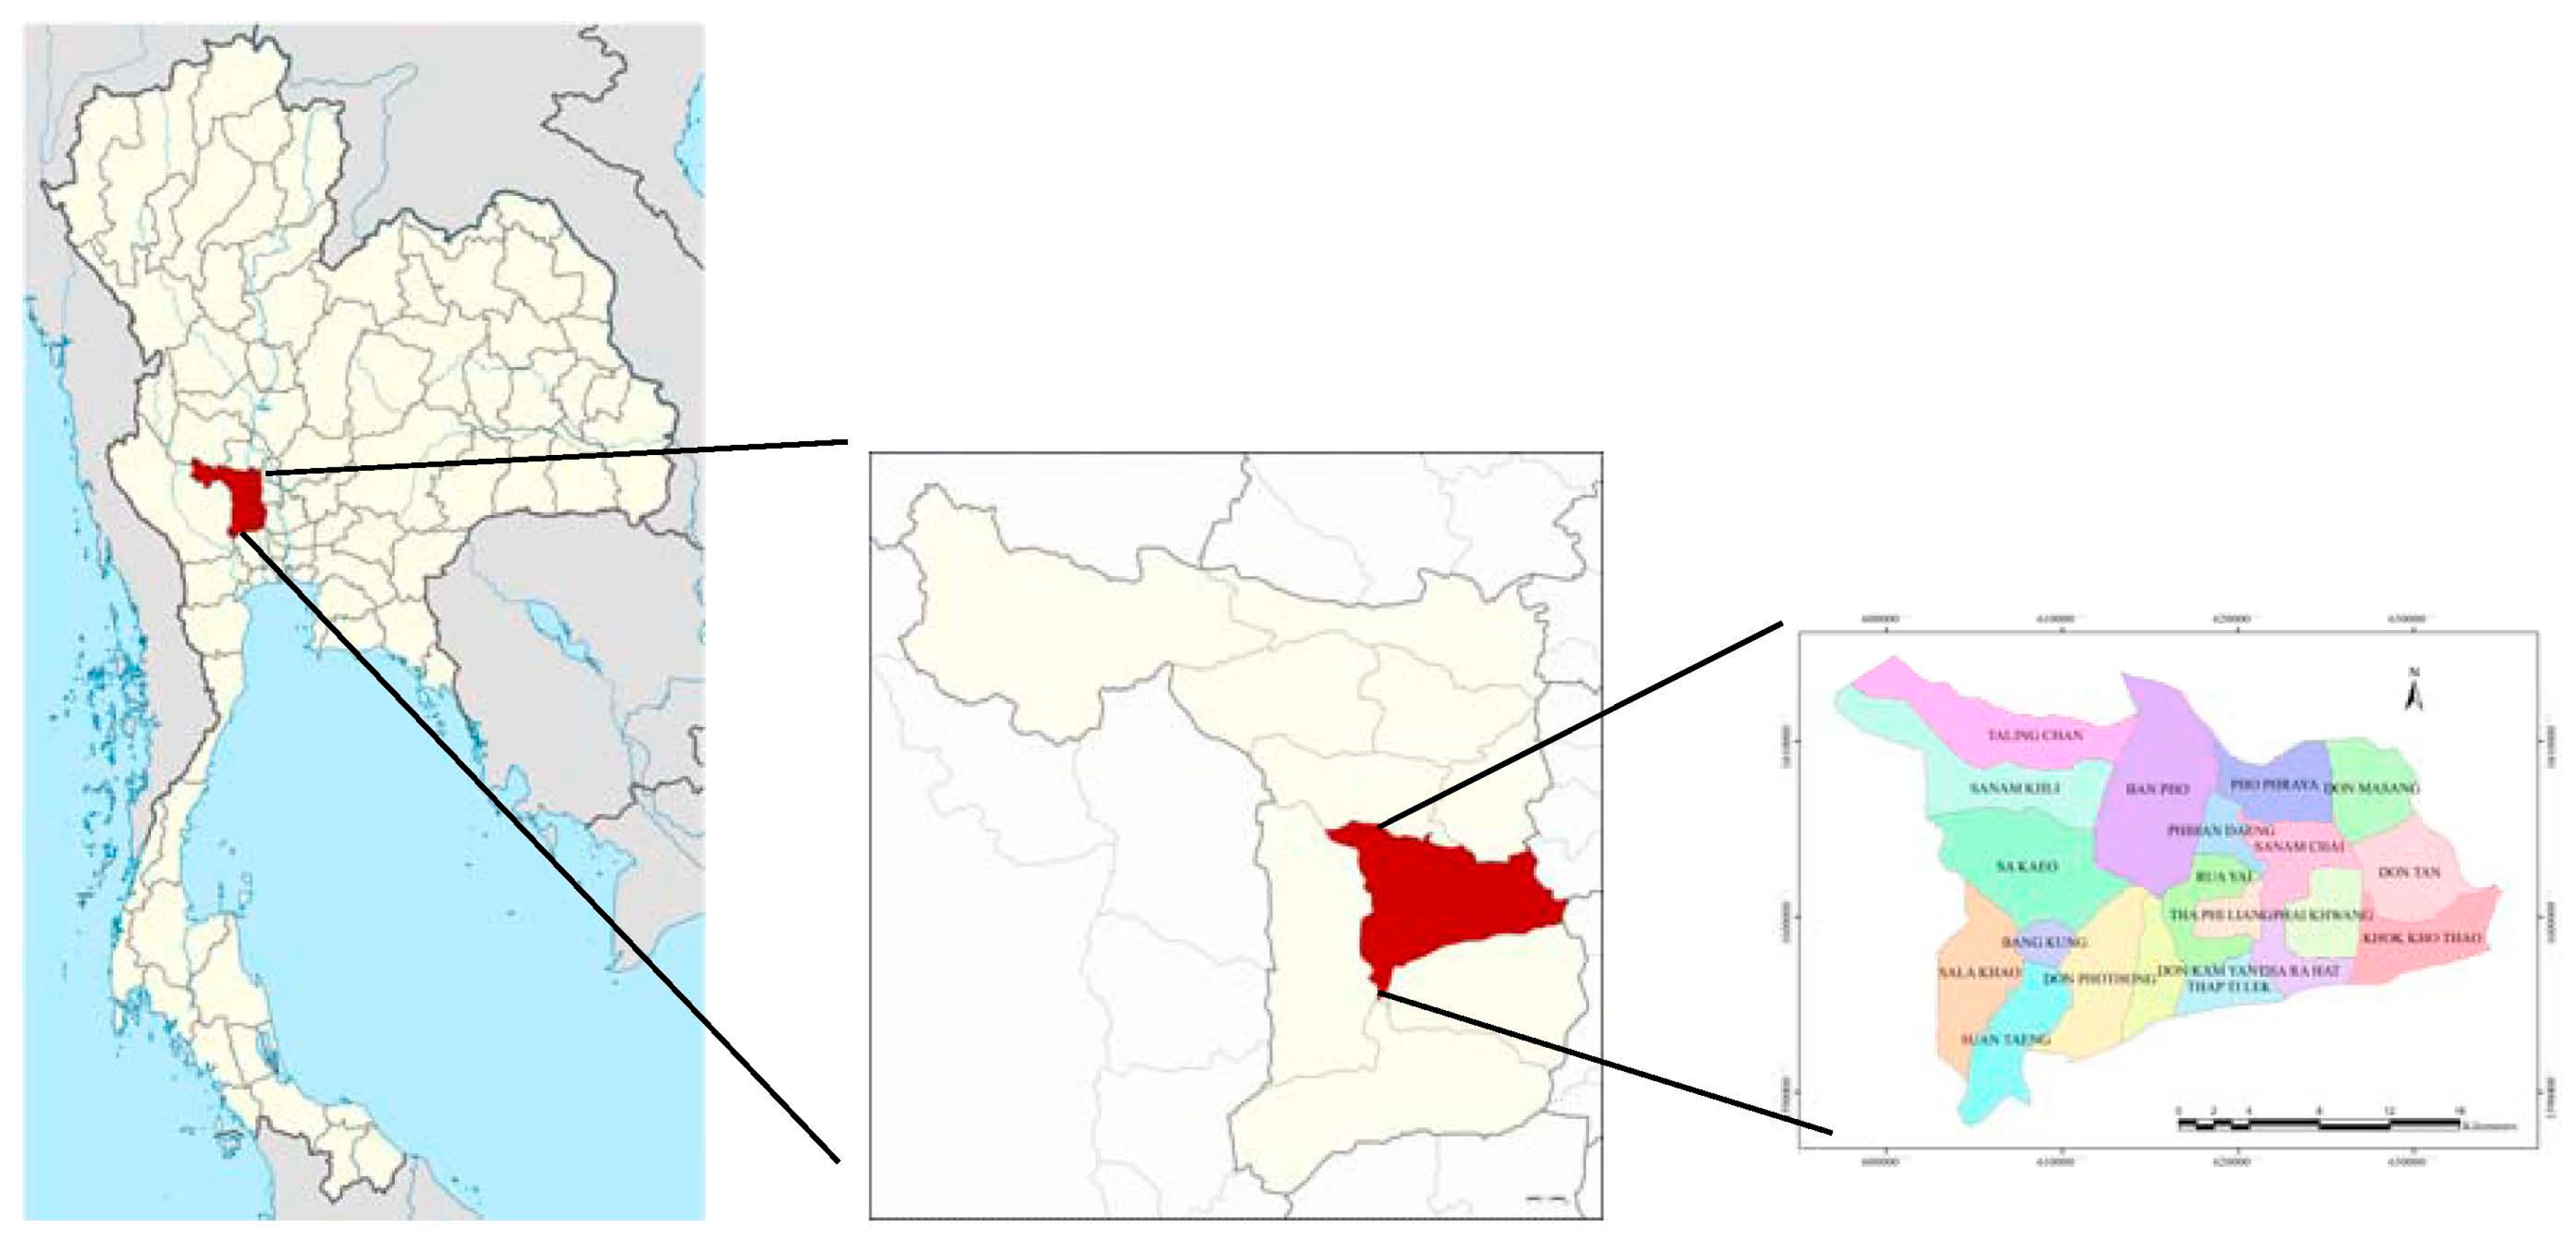
The Muang district of Khon Kaen, which is a Medium class city in the Northeast of Thailand, was selected for this research (
Figure 2). The district is divided into 18 sub-districts, which are further subdivided into 272 villages. The district is well-known for its economic diversity, landscape variety, and easily accessible logistics. The district is the regional centre for education, business, and transportation of north-eastern Thailand. Several governmental agencies and major organizations have been established in the central areas of the district. The major transportation networks and facilities include an airport, bus terminals, and railway. The Muang district of Khon Kaen covers an area of approximately 953 sq. km with a total population of 385,217, out of which, 187,547 are male and 197,670 are female [
25].
With a tropical savannah climate with a dry and very warm winter season, the highest average temperature in Khon Kaen in the summer season is 36.5 °C, while the lowest average temperature stands at 16.2 °C in the winter. The average annual accumulated precipitation is 1214.4 mm in the monsoon season which typically runs from March until October.
The initial selection of the factors for the development of the LCI was based on an open questionnaire survey with the residents of the Muang district of Khon Kaen. This is the pioneer study for the Khon Kaen district to create the model for a Liveable City Index (LCI). The questionnaire development procedure first involved distributing the open-ended questionnaire to 100 potential respondents asking them to rate the city on its liveability. The questionnaire allowed the residents of the Muang district to choose and rank potential liveability factors. In the second step, a closed-ended questionnaire was developed by selecting the most frequently reported city liveability factors in the first step. After that, the formulated closed-ended questionnaire was distributed through the internet and on paper. The final 618 were selected from 518 Internet-based respondents and 100 paper-based respondents. Thus, a total of 618 respondents scored the factors to create the final list of LCI factors. The results revealed the following liveability factors: Safety, Environment, Health, Transportation, Public Utility, Education, Economy, Population and Recreation. In the next stage, experts and city managers were invited to rank each factor and decide on sub-factors for each factor to be used in the AHP process.
2.3. Factors for LCI Development
As mentioned above, a total of nine factors for the development of the LCI were identified through questionnaire surveys. Data for each factor were collected from different sources (
Table 1), and factor layers were prepared in the ArcGIS 10.2 software for the implementation of the Multi-Criteria Decision Making (MCDM) analysis using AHP. Each factor and its sub-factors are discussed in detail below.
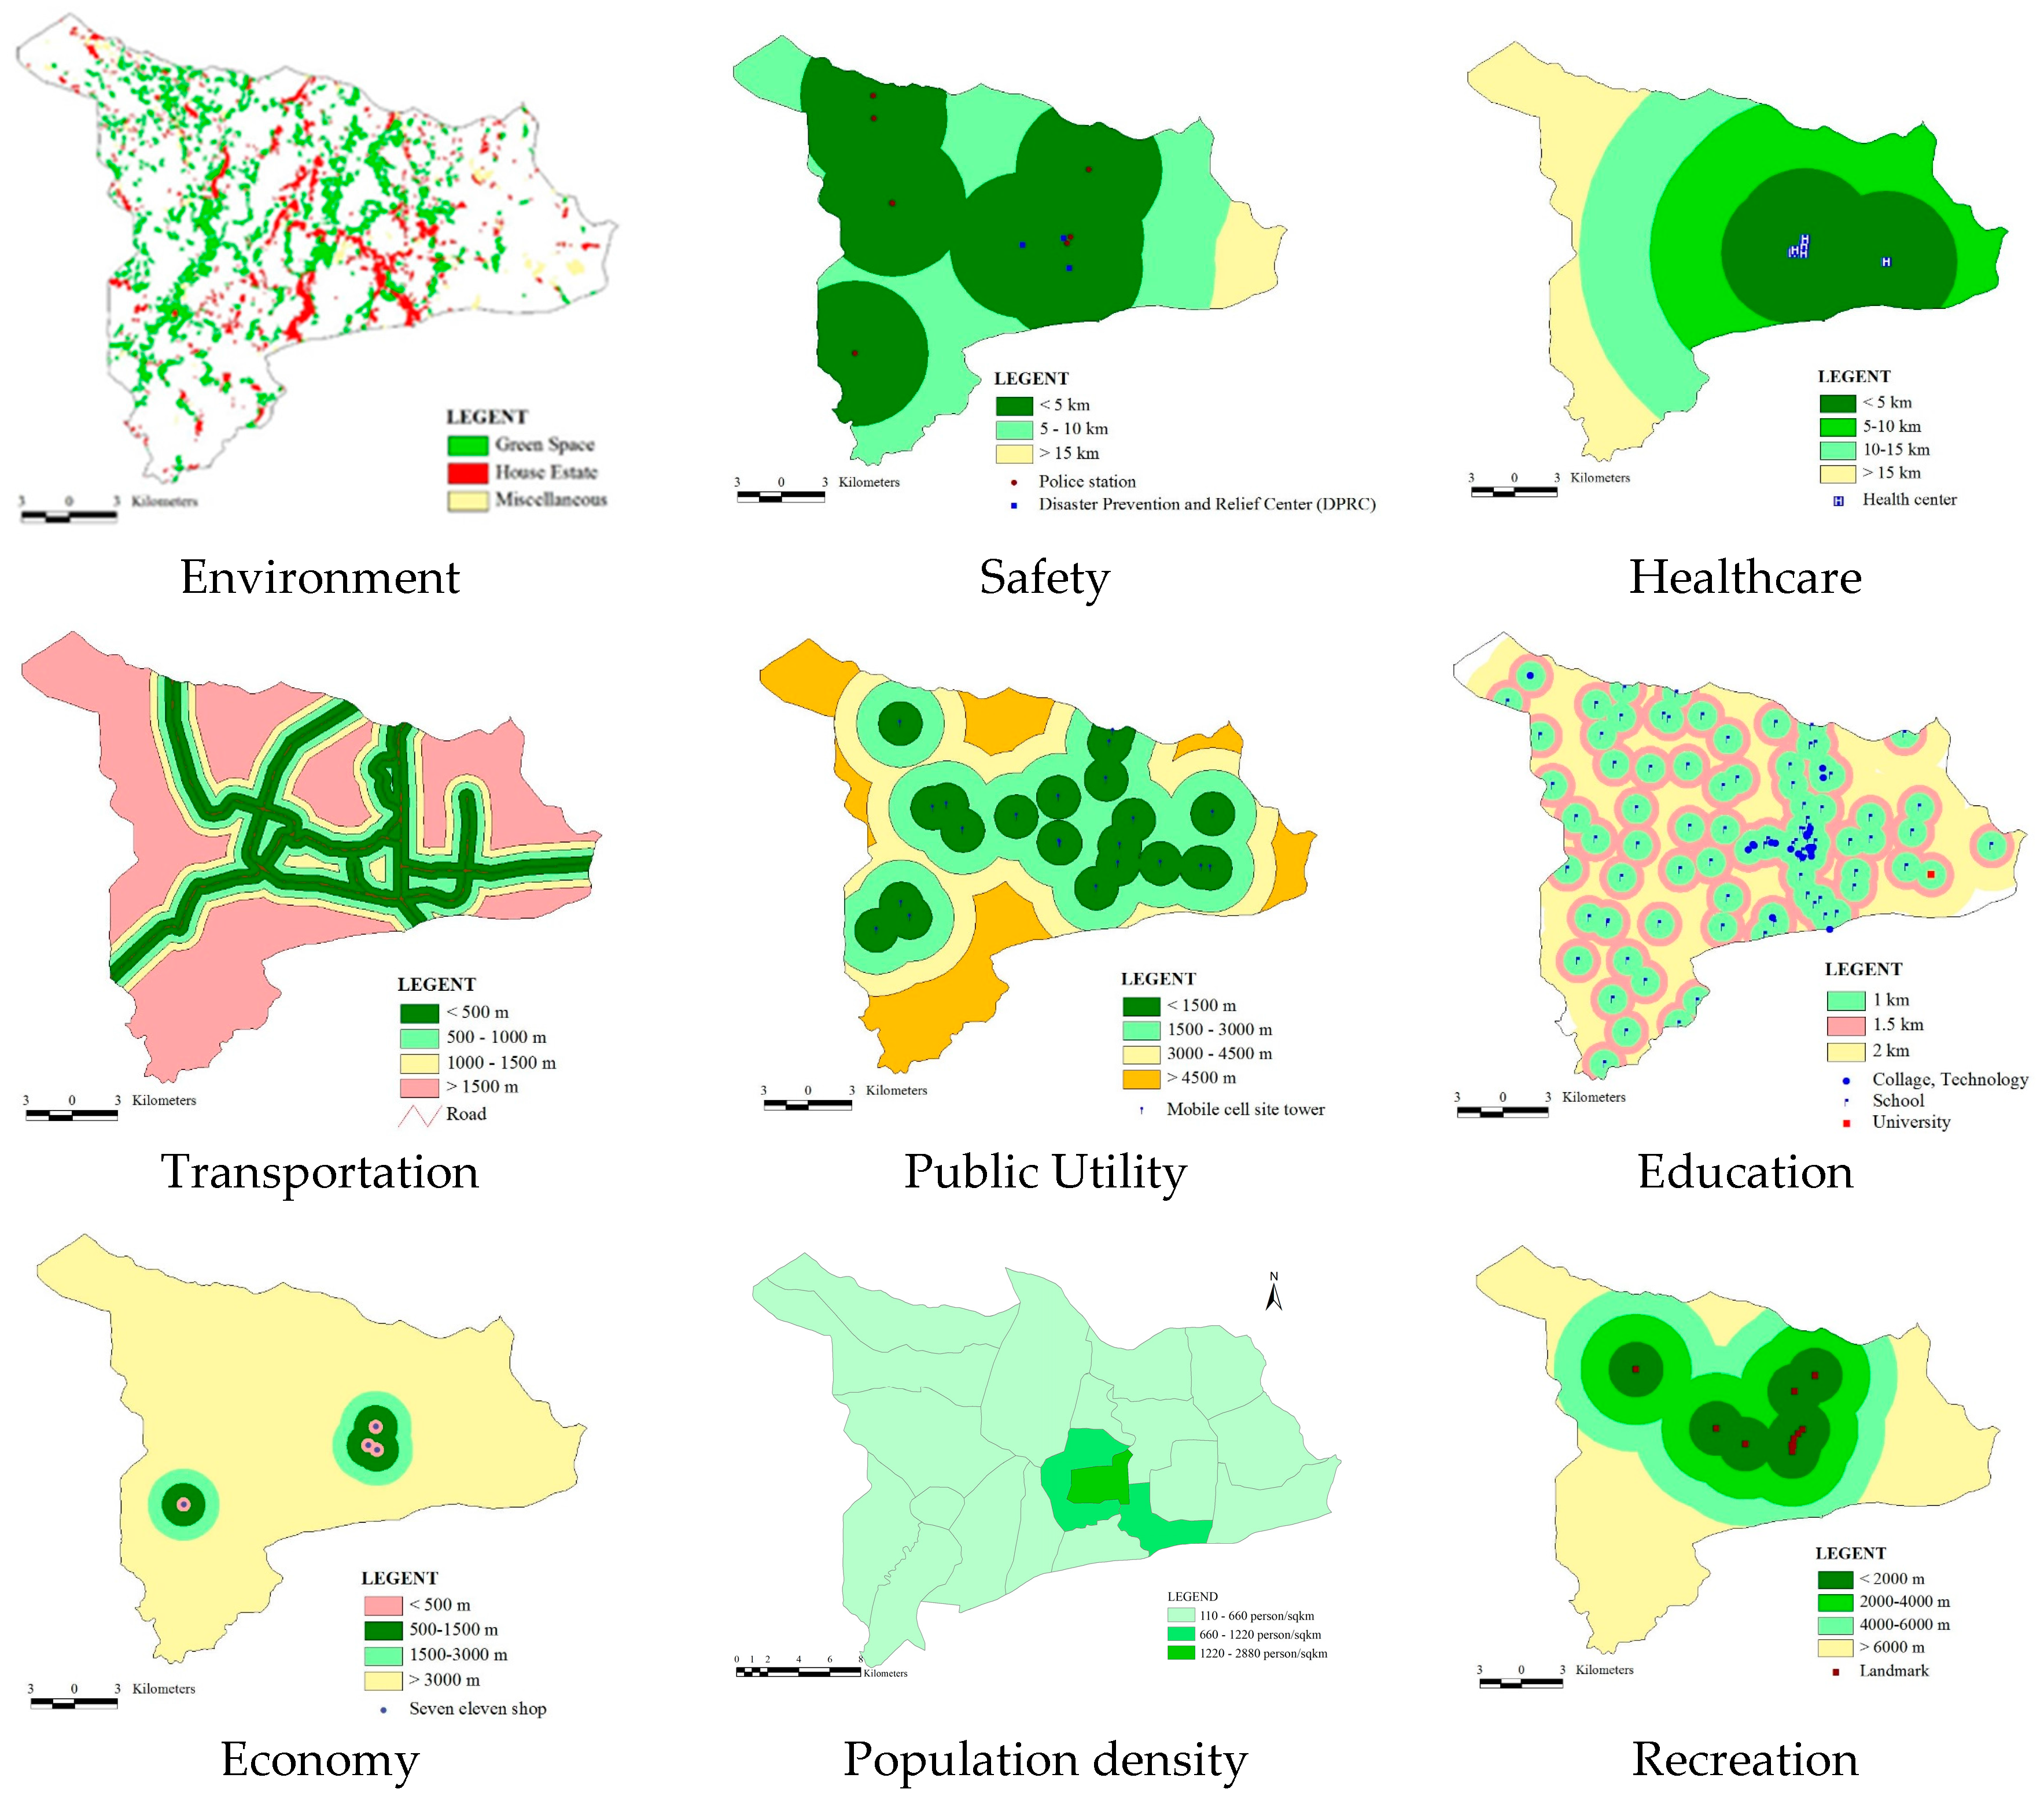
Based on information gained from experts for each of the nine factors, buffer zones of multiple radiuses were created for the LCI analysis as shown in
Figure 3. However, this approval is very much related to local conditions of populations and facilities.
Safety: The Safety factor was based on the locations of police stations, and disaster prevention and relief centres. There were 13 police stations and 15 disaster prevention and relief centres within the Muang district. The Safety layer was generated for each location with 4 buffering zones: under 5 km, 5 to 10 km, 10 to 15 km, and over 15 km. The radius was chosen based on interviews with expert persons. The buffering tool was used to create buffer polygons around specified input coverage features and the distance was used to create buffer zones around input coverage features.
Environment: The Environment factor was based on land cover in the study area. The data for 2010 were collected from Thailand’s Land Development Department (LDD). Land use was classified into farm areas (further classified into various types of crops), forests, rice fields, urban/village/housing areas, water bodies, and so forth. These types of land use were grouped into three categories: villages/housing estates, mixed green areas, and miscellaneous areas.
Health: The Health factor was based on the location of both private and public hospitals. The buffering zones of the 10 hospital locations were categorized into 4 zones: under 5.0 km, 5.0 to 10.0 km, 10.0 to 15.0 km, and over 15.0 km. The radius was chosen based on interviews with expert persons.
Transportation: The Transportation factor was based on the locations of main roads and highways. The data were collected from Thailand’s Department of Transportation. The following buffering distances were generated: within 0.5 km, 0.5 to 1.0 km, 1.0 to 1.5 km, and over 1.5 km. The radius was chosen based on interviews with expert persons.
Public utility: The Public Utility factor was based on the locations of mobile network towers. Telecommunications is a set of technologies, devices, equipment, facilities, networks, and applications that support communication at a distance. It has become a hugely important aspect of present society and a major interest of the residents. The location data were collected from the Telecommunications Consumer Protection Institute (TCI) of Thailand 2013. The buffering zones simulated using the positions of mobile network towers were generated for distances of within 1.5 km, 1.5 to 3.0 km, 3.0 to 4.5 km, and over 4.5 km, by interviewing the telecom engineering experts.
Education: The Education factor was based on the locations of a total of 198 academic institutes reported by the Ministry of Education (MoE). In this study, they were classified into three categories: (i) university (ii) college/technology and (iii) school. All locations were given the buffering zones of 2.0, 1.5, and 1.0 km. The radius was chosen based on interviews with education experts.
Economy: The Economy factor was based on the locations of the convenience store chain, 7-Eleven. In Thailand, one criterion for establishing 7-Eleven convenience stores (7–11 s) is that the location must have sufficient consumption volume. In addition to serving the function of providing people with daily consumer goods, 7–11 s provide financial services such as bill payments, ticketing, insurance, and money transactions to its customers. It should also be noted here that statistical analyses are always conducted before the construction of a 7–11, which is demonstrative of the economy in that area. The 4 buffering zones were generated for a total of 21 shop locations: under 0.5 km, 0.5 to 1.5 km, 1.5 to 3.0 km, and over 3.0 km. The distance was chosen based on the company regulations.
Population density: The Population Density factor was based on the data on the total population for each sub-district in 2010 collected from the Department of Administration of Thailand (DOPA).
Recreation: The Recreation factor was based on the locations of recreational spots in the study area: fishing parks, gardens, sports training centres, public golf courses, and movie theatres. These were assigned through the AHP weight method after being ranked by questionnaire respondents. The four buffering zones were under 2.0 km, 2.0 to 4.0 km, 4.0 to 6.0 km, and over 6.0 km. These were chosen by expert persons. The data were collected from Thailand’s Land Development Department (LDD) in 2010.
2.4. Hierarchical Modelling Using AHP
For each factor described in the previous section, a set of relative weights was estimated for the development of the LCI as the next step. The Analytical Hierarchy Process (AHP) method was employed to derive the weights assigned to each factor. The AHP, which follows a pair-wise comparison approach, provides a means to calibrate a numerical scale, particularly in new areas where measurements and quantitative comparisons do not exist [
26] (pp. 403–424). The AHP is based on empirical findings whereby humans have certain difficulties in simultaneously addressing many (seven, plus or minus two) decision criteria or alternatives but which they are well capable of evaluating in pairs. Thus, the pair-wise comparison approach coupled with a ratio scaling method has been used to determine the relative importance among all decision elements in a multiple-attribute decision-making environment. This is because of its simplicity, accuracy, theoretical robustness, and ability to address both intangible and tangible criteria. Also, the method can be used to group decision-making problems and directly measure inconsistencies in a respondent’s judgements [
20] (p. 283). The AHP is based on the following factors:
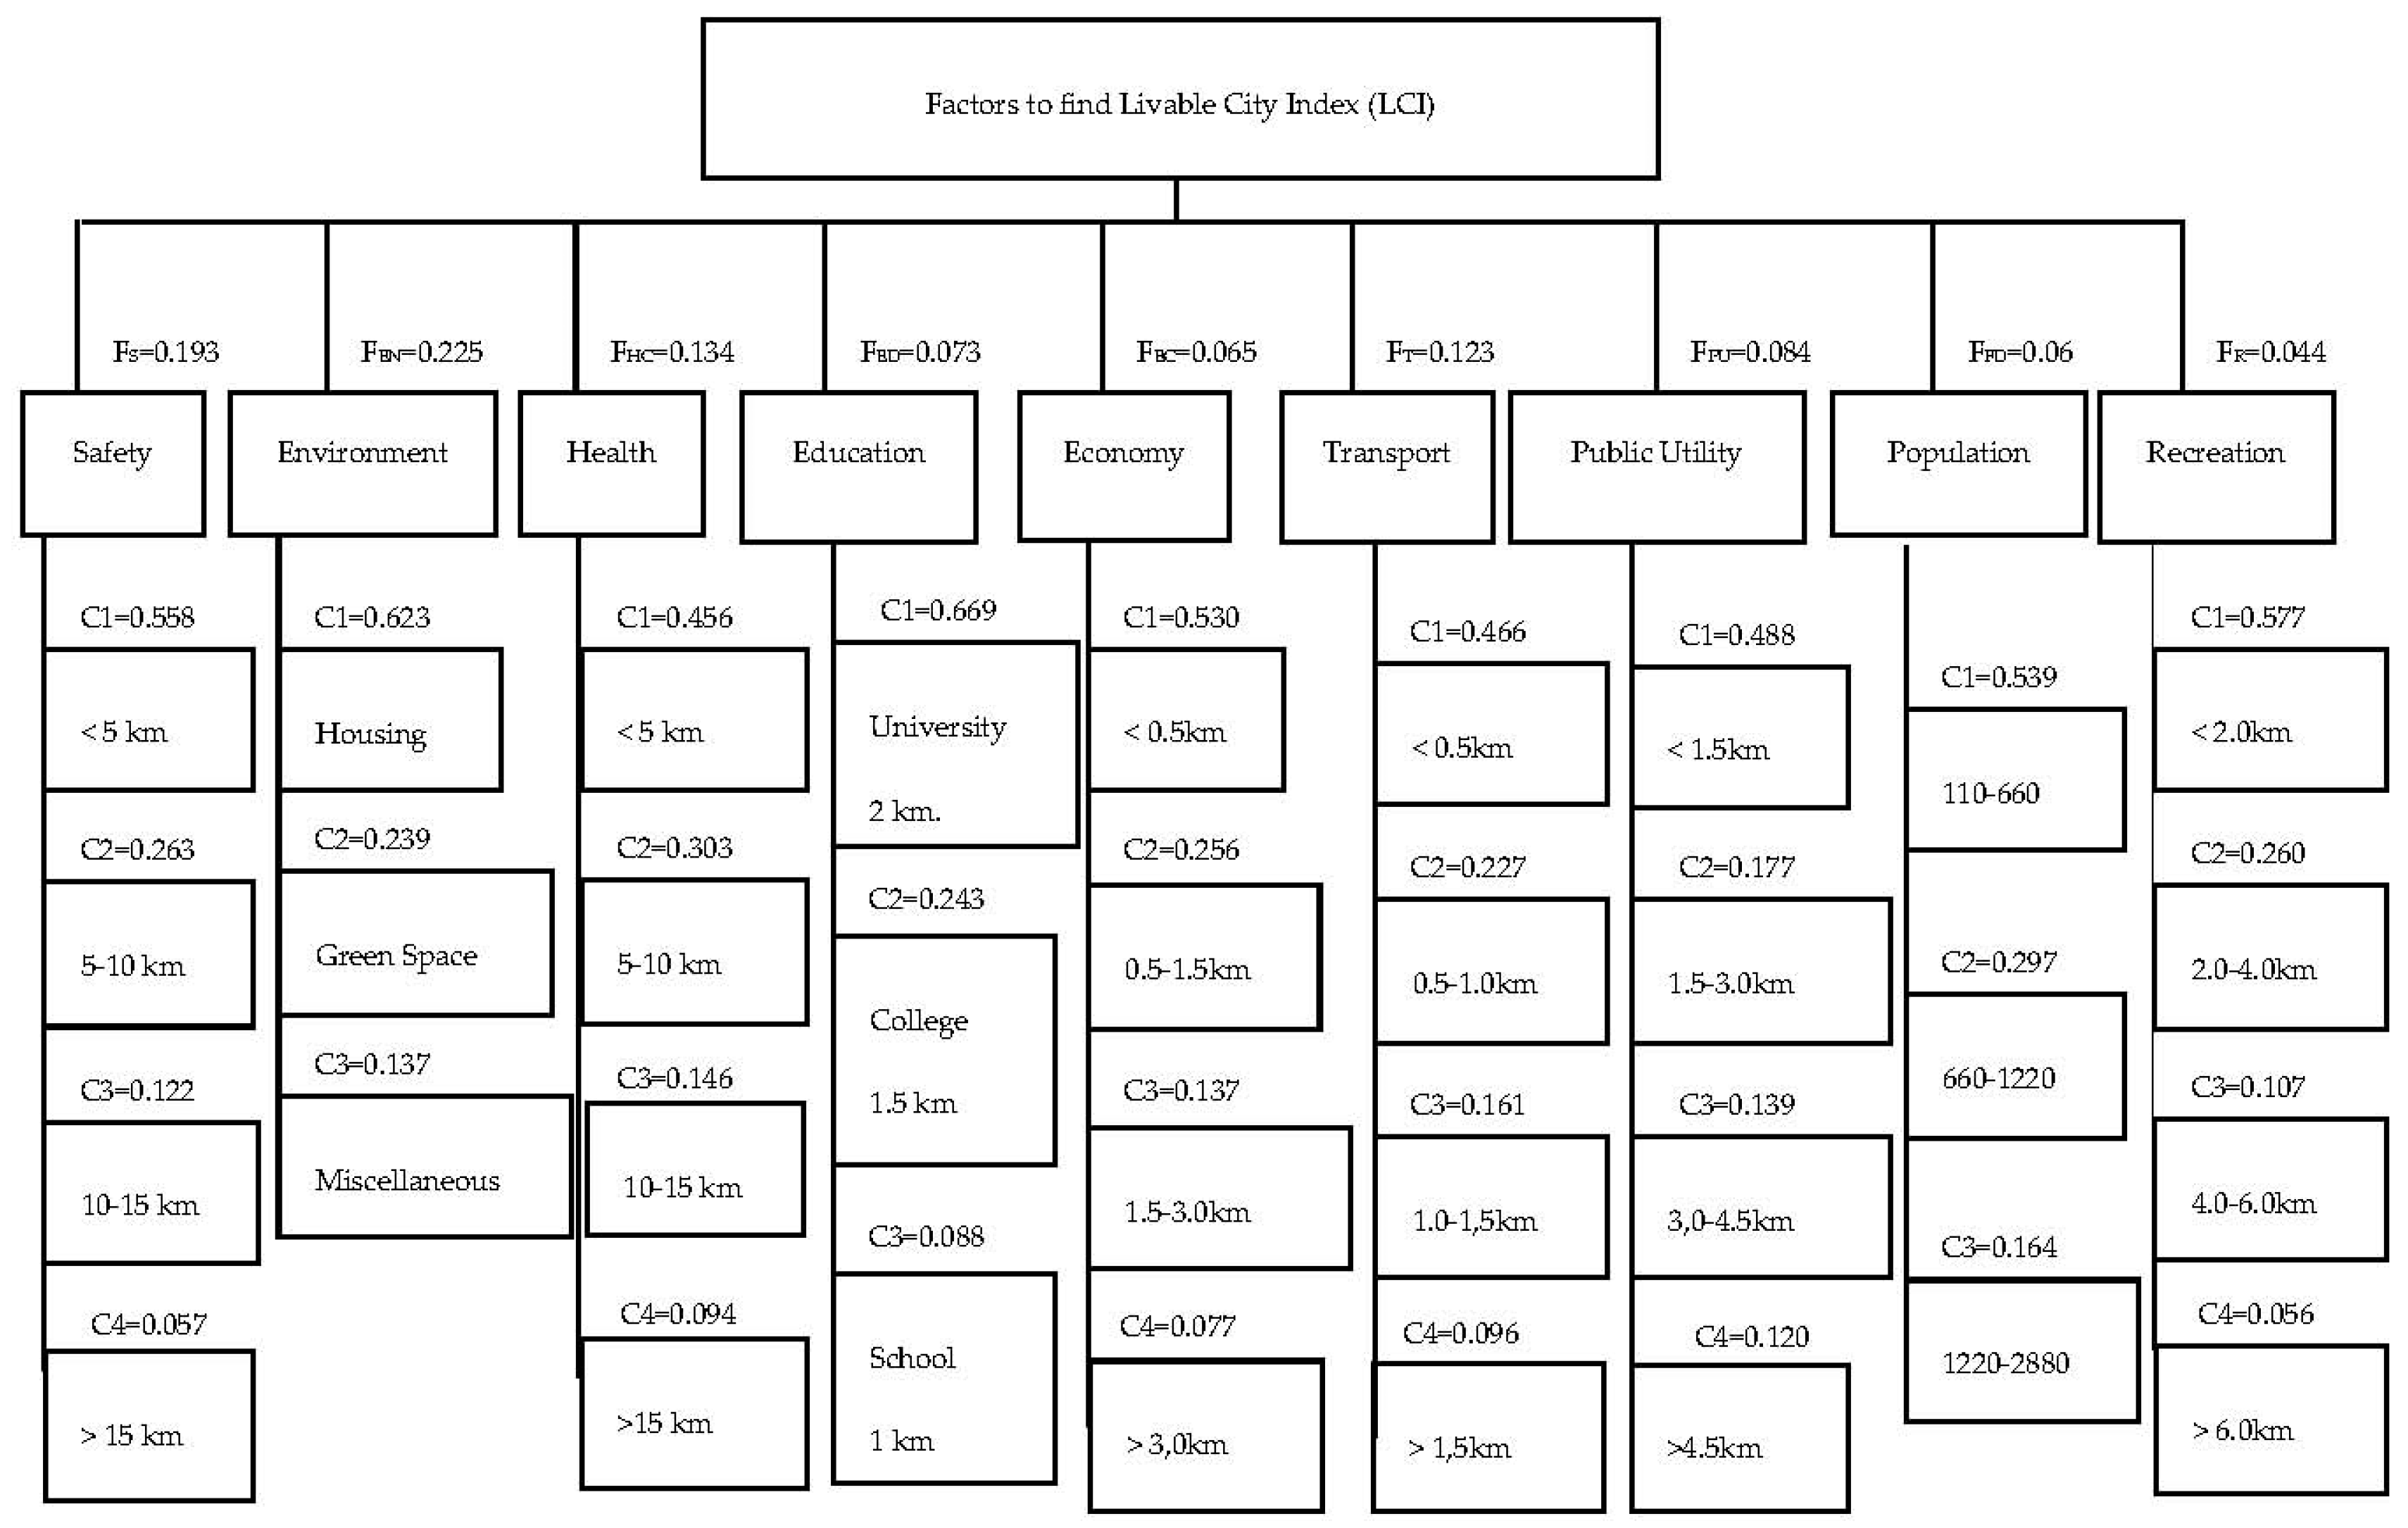
Decomposition: A complex problem is decomposed into a hierarchy of interrelated decision elements. A hierarchical structure is established to interrelate and chain all decision elements of the hierarchy from the top level down [
23] (pp. 343–355). The global objective (in the current study, LCI) is placed at the top of the hierarchical structure. The lower level of the hierarchical structure consists of more detailed elements, which are interrelated with the criteria in the next higher level. The hierarchical structure for this study is presented in
Figure 4. It also includes the factor weights which are discussed in detail in the Results section.
Prioritization: After the hierarchical structure is established, the relative importance of all decision elements is captured and revealed through pair-wise comparisons, which are used to create a ratio matrix. Pair-wise comparisons of the main and sub-criteria within the same hierarchical level are established. The numerical scale as proposed by Saaty, ranging from 1 to 9, was used in the pair-wise comparison matrices [
20].
Synthesis: To generate the liveable city zonation map, the weighted linear combination (WLC) method, which is one of the most frequently used techniques in spatial multi-attribute decision making (MADM), is used [
27] (p. 387), [
22] (pp. 645–656). The WLC method, which is based on the concept of a weighted average, is used to assess the weights of factors and to map the risks in various zones [
28] (pp. 1–11). Relative weights are assigned to each attribute. The weights of the main criteria are multiplied by the weights of sub-criteria within the same hierarchical level, and the sum of the products over all attributes is calculated to obtain total scores (
Ri) using the following formula:
where
wk and
rik are vectors of the priorities of the main criteria and sub-criteria, respectively.
Evaluation: A CR of 0.1 or less was considered acceptable and demonstrated good consistency in judgment [
29] (pp. 234–281).
3. Results and Discussion
This research adopted a MADM approach using AHP to develop a Liveable City Index with residents’ participation at several stages. In the process of AHP, pair-wise comparison matrices of each factor and sub-factors were implemented through consultation with experts who had field experience. The survey scores for each of these elements in Saaty’s score of importance were applied in the matrices to be translated into weights. The pair-wise comparisons for the main criteria (
Table 2), sub-criteria (
Table 3) and weights are presented along with the value of the consistency index (CI), the consistency ratio (CR) and (λ
max) values.
The CR value of 0.037 was less than 0.1 from Saaty values in the first hierarchy level of the AHP process which implies that the weight distribution among the factors is acceptable and demonstrates good consistency in the judgement. It was ranked by the questionnaires from residents and by administrator interview. It is also evident that Environment (weight 0.238) and Safety (weight 0.206) are the two most important factors which may allow Khon Kaen to become a liveable city although no factors can be ignored (
Table 2). Interestingly, the Public Utilities, the Education, and the Economy factors are relatively less important (weights < 0.1) despite the fact that economic development is often viewed as one of the key factors in building a liveable city. Nevertheless, a pleasant, natural, and safe environment is a basic condition for habitability and can be considered as the main criteria for assessing the liveability of Khon Kaen.
In the next level of factors, CR values of Safety (S), Environment (EN), Healthcare (HC), Transportation (T), Public Utility (PU), Education (ED), Economy (EC), Population Density (PD), and Recreation (R) are 0.044, 0.016, 0.030, 0.011, 0.028, 0.006, 0.003, 0.008, and 0.013, respectively (
Table 3). According to Satay, a value of less than 0.1 is acceptable. These values imply that all weights are acceptable and signify consistency in the weight distributions to the sub-factors. The composite index developed from these factors and weights will be more acceptable since it considers all factors ranked by the residents in the study area.
More interestingly, based on the questionnaire responses of 618 respondents and the interviews with the experts and city managers, these results revealed the importance levels of the sub-factors significant for a city to be considered liveable. The Safety, Healthcare, Transportation, and Recreation factors are considered in distances. However, these distances have marked differences in scale. A distance of under 5 km from places representing the Safety factor or the Healthcare factor ranks an are as highly liveable, whereas residents reportedly consider the distance of under 500 m from transportation or a recreation centre as liveable. A housing estate is preferred over green spacious areas (
Table 3). A housing estate here refers to an area with clusters of buildings orhouses, with easy access to facilities and utilities. Furthermore, areas with high population density are reportedly preferred and considered more liveable.
According to Saaty, the normalized weights of the main criteria were multiplied by the normalized weights of the sub-criteria, thereby multiplying the resultant with each factor layer to produce a single resultant layer for each factor. By performing union operations, these resultant layers were merged into a single layer to produce the final LCI map. The developed model for generating the LCI map is given in Equation (2).
where
F is the factor weight for Safety (S), Environment (EN), Healthcare (HC), Transportation (T), Public Utility (PU), Education (ED), Economic (EC), Population Density (PD), and Recreation (R),
Ci is the class weight of the sub-criteria and
Wi is the weight of the
ith criterion.
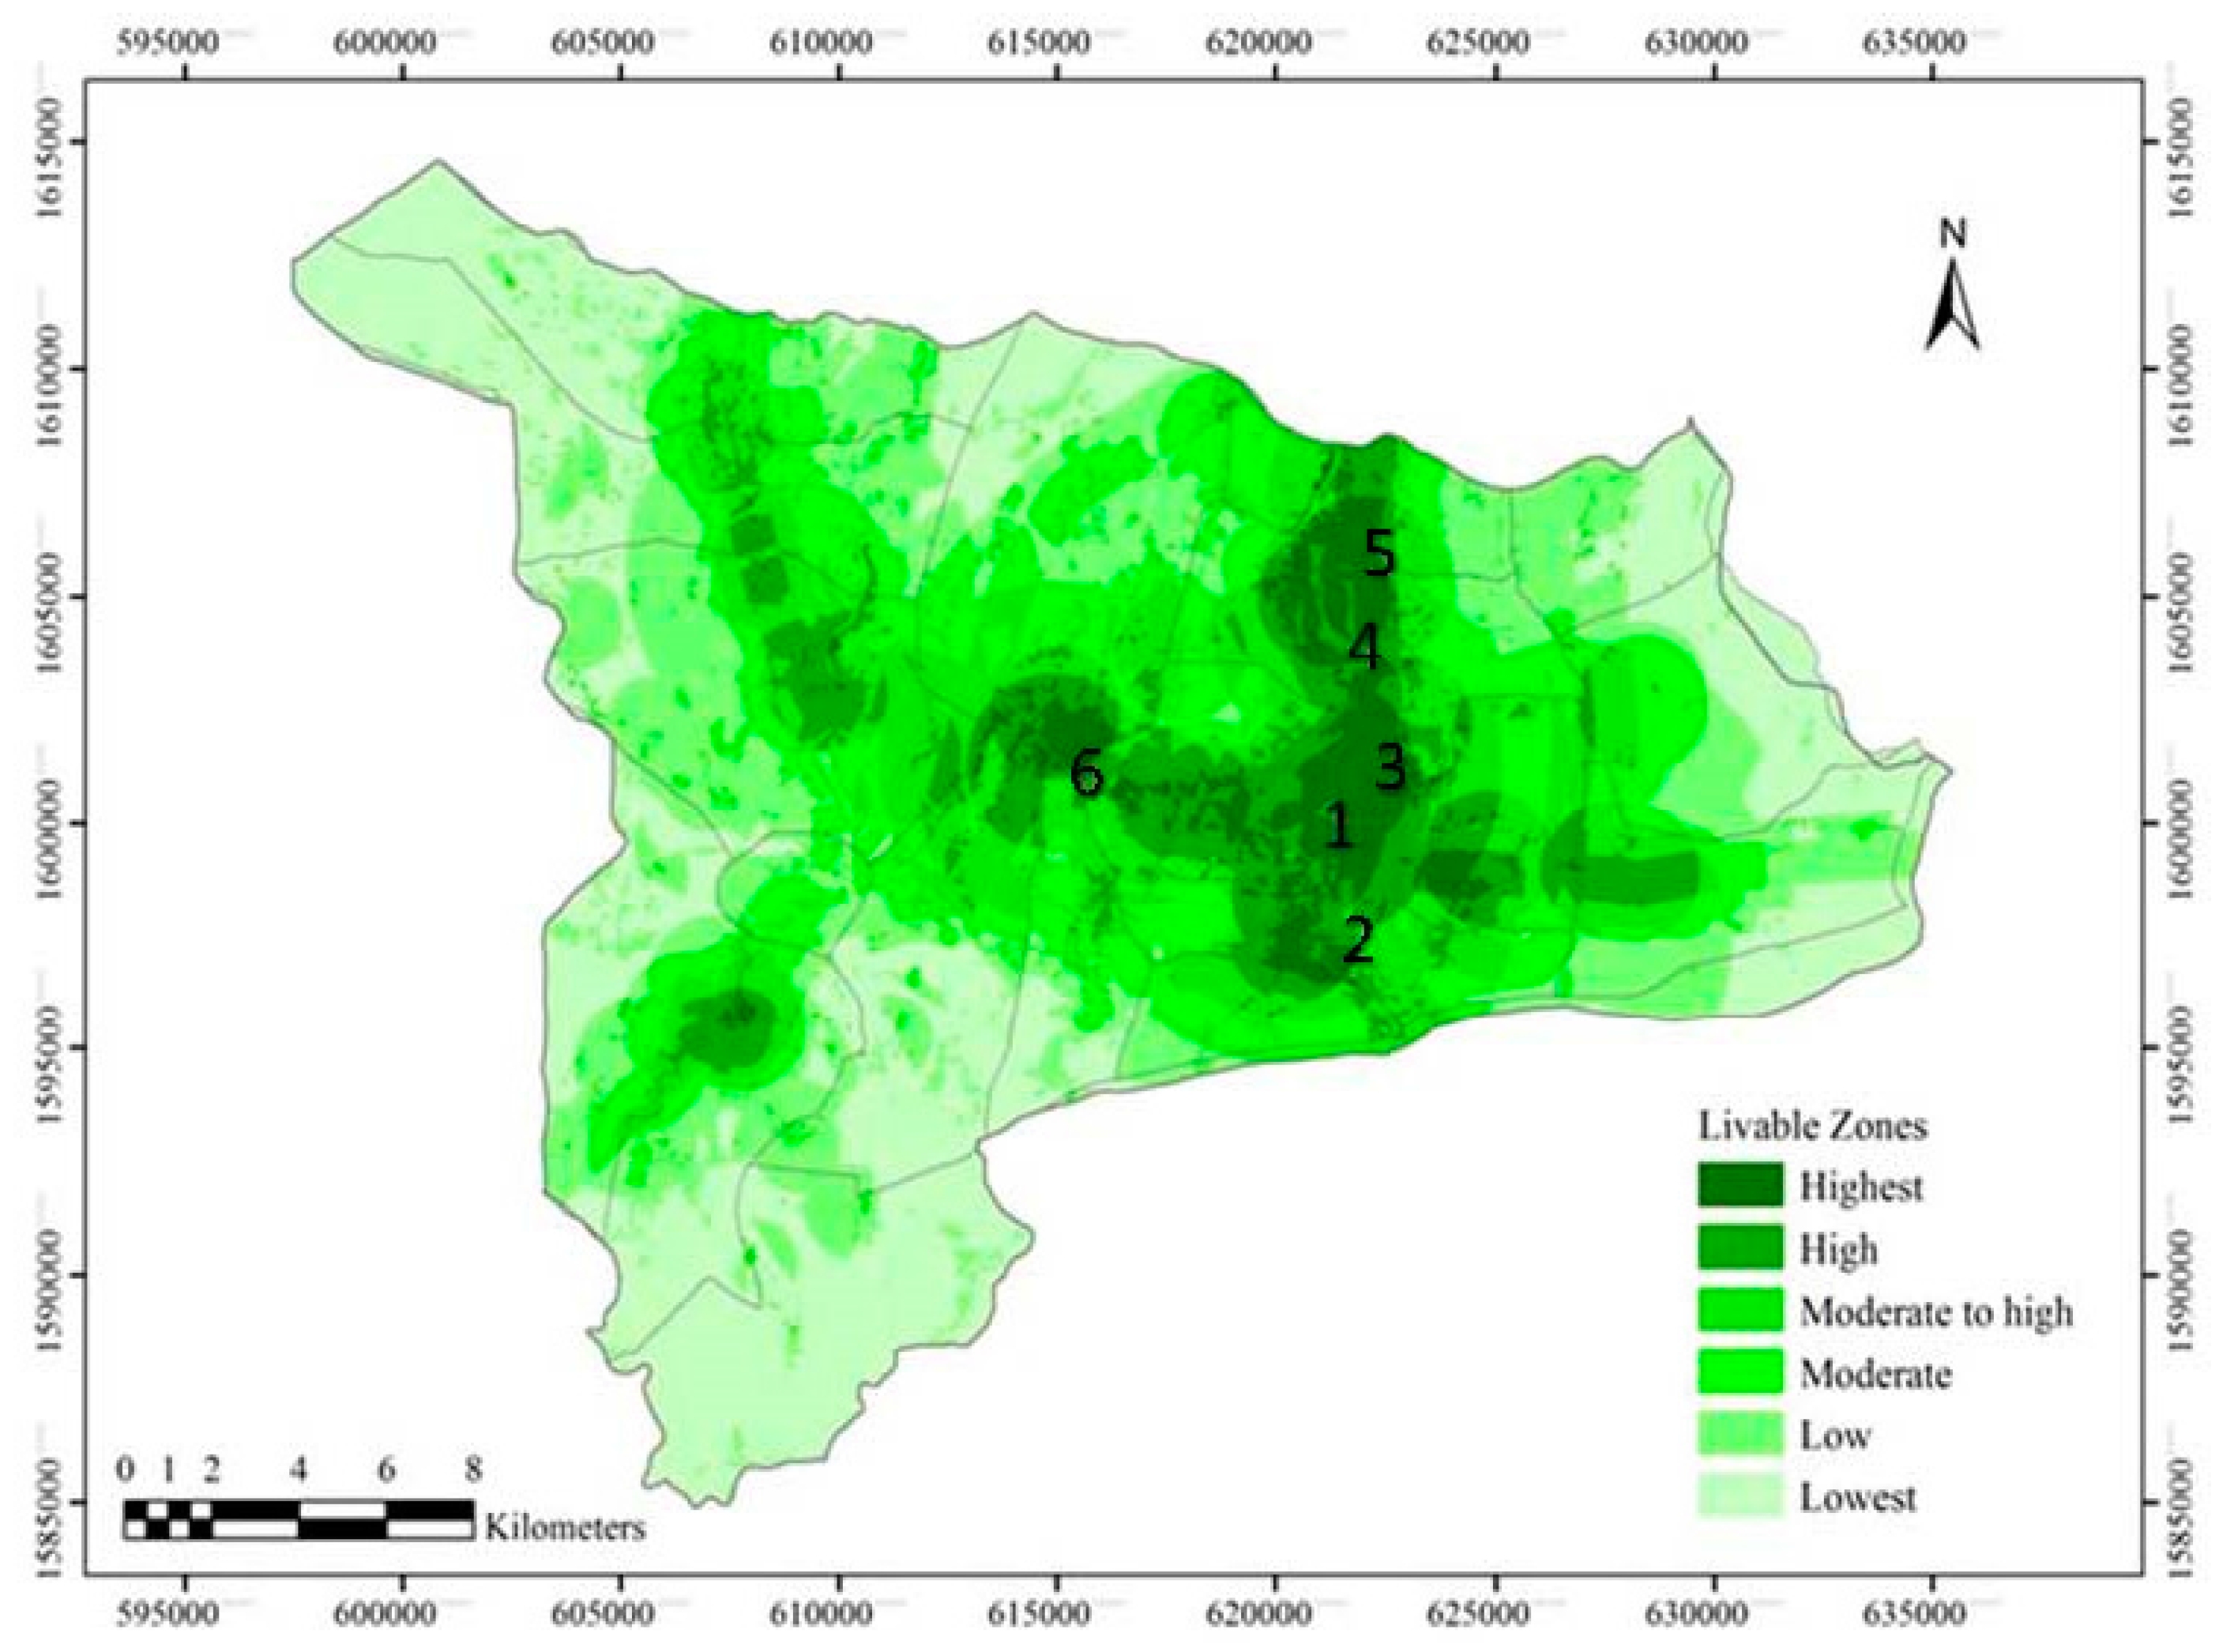
The values in the LCI have no physical meaning other than to describe the study area in relative quantities of LCI values. These values of the Liveable City Index (LCI) ranged from 3 to 48.39 in 953 sq. km of Muang Khon kaen district. An equal interval method (Thirumalaivasan et al., 2003; Pawattana and Tripathi, 2008) was used to define six liveability levels: highest, high, moderately high, moderately low, low, and lowest (
Table 4 and
Figure 5). It is evident that only 3.49% (0.33% in highest, 2.49% in high and 0.67% in moderate to high) of the area represents areas with high liveability. The results from this study contrast with this ranking as it is found that 80.10% of the area is considered low in liveability (
Table 3). The results show that there are important factors other than the economic factor that determine the liveability of a city. Also, this has been supported by the data from the interviews with the experts and the city managers.
The LCI map is overlaid on the sub-district boundary shown in
Figure 5 to identify the sub-districts with the highest liveability. The results showed that four sub-districts, namely Nai Muang, Muang Kao, Don Chang, and Tha Phra are found to be the most liveable areas in Khon Kaen dostrict. However, most of the sub-districts of the study area represent areas with low liveability except the west part of Pralab and Sueng niam in Zone 2 and one-third of the west part of the Sa wat thi sub district.
Figure 5 also distinguishes three distinct zones with high liveability. In the following stage, each of these assigned three zones was evaluated. The moderately high liveability area to the highest liveability area was shown in the center of Khon Kaen district mostly because of liveability factors built up in the center of the Khon Kaen district.
Table 4 shows the LCI values in six classes and the LCI levels for the six classes in square kilometers (sq. km), as well as the percentage of each class of the total area in the study. It can be seen from the table that areas classified as having moderate to high to highest liveability cover 147.13 sq. km which accounts for 16.24% of the total area of Muang District of Khon Kaen.
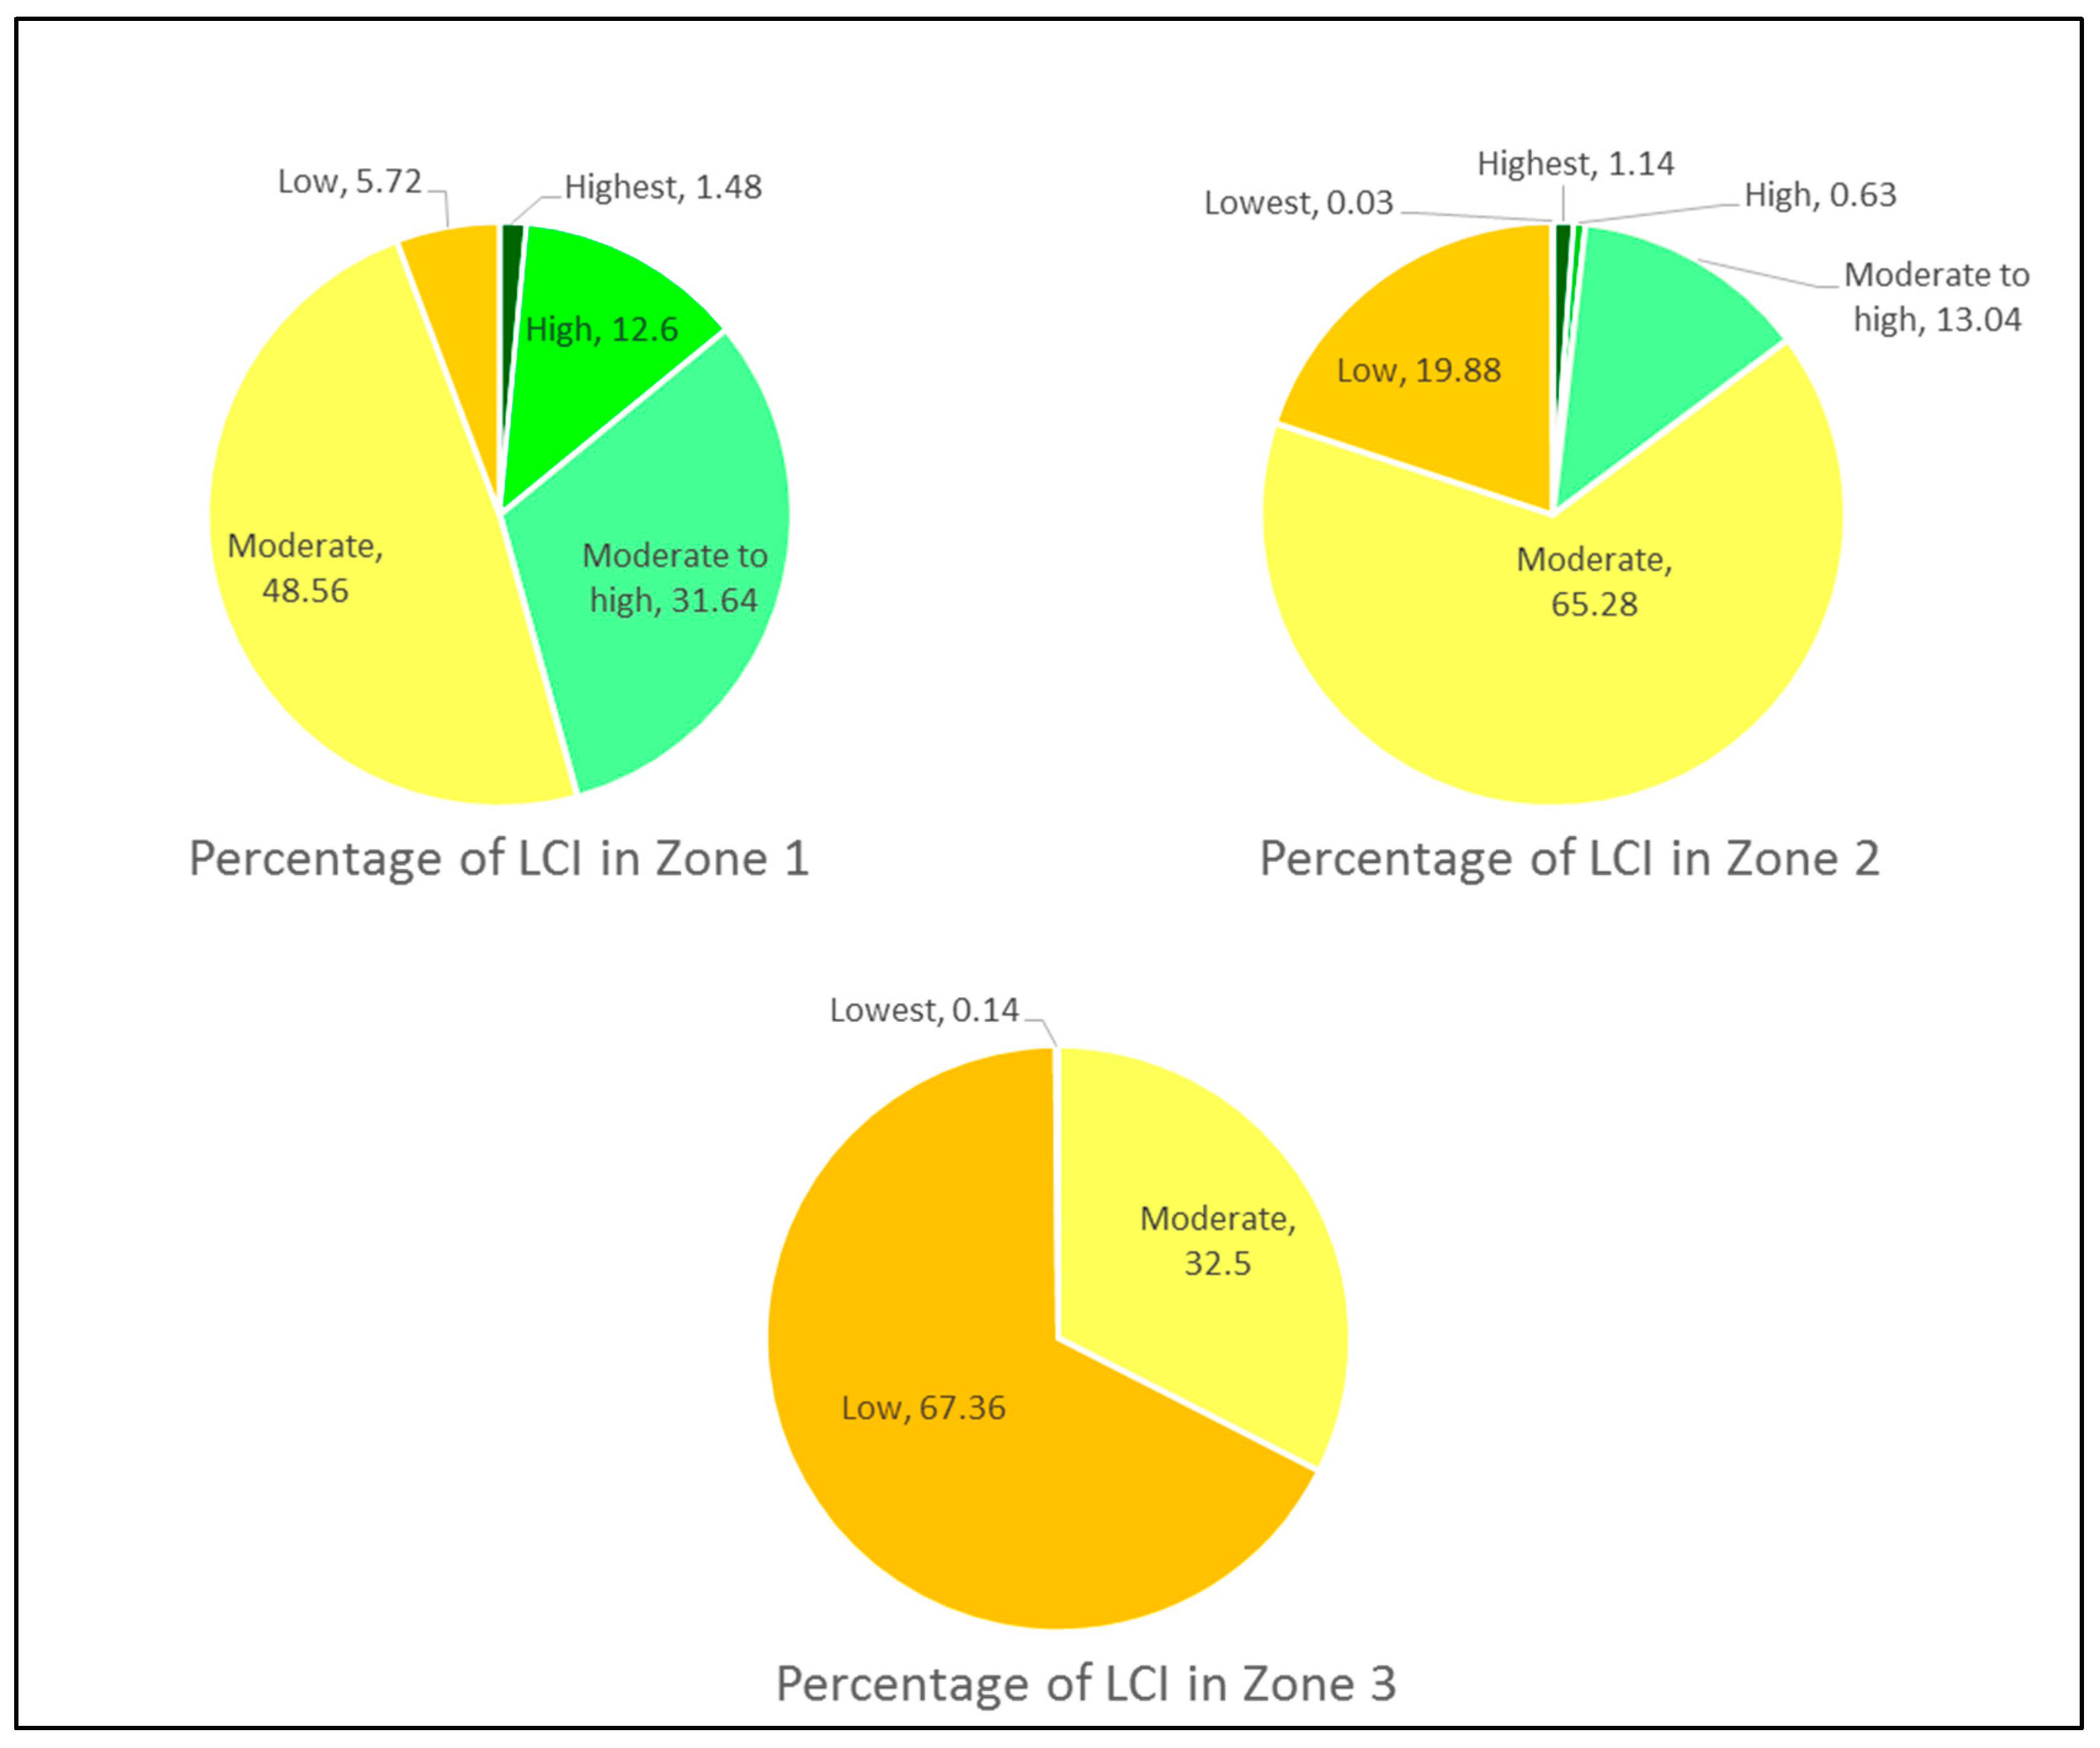
Table 5 shows the summarized results of area distributions of LCI in the three zones shown in
Figure 5. Highest and high liveability are found only in Zone 1 (with an area of 25.47 sq. km, or 14.08%) and Zone 2 (with an area of 0.59 sq. km, or 1.76%). In Zone 1, the area with moderate liveability covers 87.89 sq. km, which is 48.56% of the area in that zone. In Zone 2, the area with moderate liveability covers 21.83 sq. km, which is 65.29% of the area in that zone. In Zone 3, the area with moderate liveability covers 8.10 sq. km accounting for 32.50% of the area.
Figure 6 shows the LCI percentages in Zone 1. The category with the largest percentage in Zone 1 was the moderate liveability, accounting for 48.56%.
Zone 2 represents nearly half of Phra Lap and some parts of the Bueng Niam and Don Han districts and totalled 33.44 sq. km. The category with the largest percentage in Zone 2 areas is the moderate liveability category, representing 65.28% of the area. Furthermore, Zone 3 only shows three levels, none of which are greater than the moderate level. This zone covers part of the Sa Wa Thi district, with 24.91 sq. km. Most of the Zone 3 areas (67.36%) are classified as areas with low liveability as shown in
Figure 6.
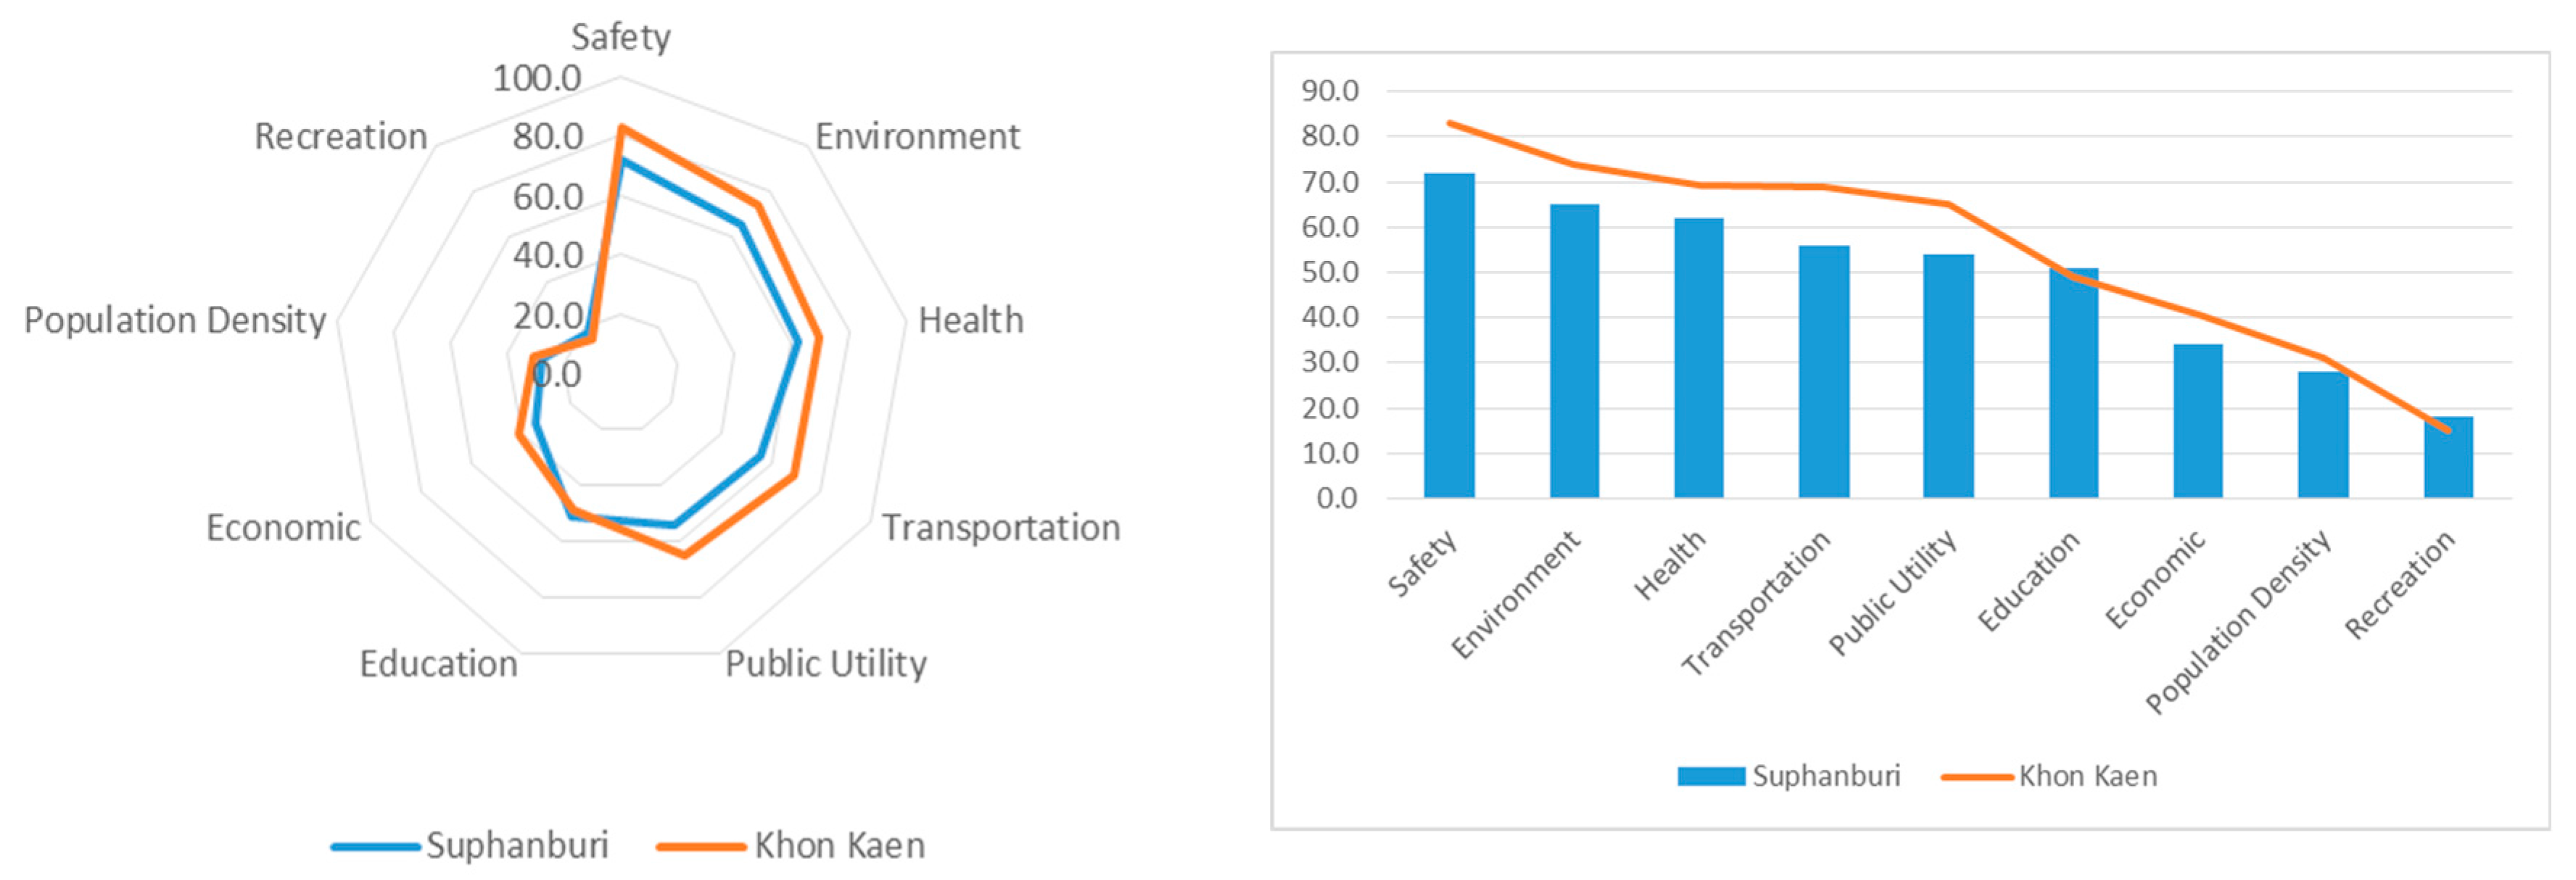
After the developed LCI had been used to create a liveability index and a map of liveable areas in the Muang district of Khonkaen, the model was applied to another area in order to determine its reliability. To examine whether the LCI model can be use in other sites and to validate it with feedback from local citizens, The Muang district of the Suphanburi province was selected as it is considered to be one of the most developed provinces in Western Thailand. The district is divided into 20 sub-districts as shown in
Figure 7, which are further subdivided into 123 villages. The Muang district of Suphanburi covers an area of approximately 565.74 sq. km with a total population of 167,591 out of which, 79,635 are male and 87,956 are female (DOPA, 2016). The terrain of the district is mostly low river plains with the Suphanburi (Tha-chin) River passing through the center. The district provides its residents with an efficient transport system. The highest average temperature in Muang Suphanburi is 42 °C, while the lowest average temperature is 13 °C. The average annual accumulated precipitation is 1090.9 mm.
The methodology and the process of analysis followed the prior study conducted in Khon Kane. The Analytical Hierarchy Process (AHP) was used to weigh and develop the Liveable City Index (LCI). The consistency ratio of Suphanburi was 0.045, which was <0.1 and thus found to be acceptable. The Environmental factor was the most sensitive, with a CR and CI of 0.009 and 0.012, respectively. Based on this analysis, parts of the study area were labelled as highest, high, moderately high, moderately low, low, and lowest liveability. It was found that 34.52% of the study area was considered to have lowest liveability, and only 4.81% was considered to have highest liveability. The map of the nine factors is shown in
Figure 8 below.
Table 6 shows the results of area distributions of LCI, and
Figure 9 shows the overlays of the nine maps representing the nine factors (shown in
Figure 8) illustrating the levels of liveability of Muang Suphaburi with the boundaries of 20 sub-districts. As can be seen, highest liveability was found in 6 sub-districts, namely Tha Phi Liang, Tha ra hat, Sanam Chai, Phi han daeng, Pho Phraya, and the bottom part of Ban Pho (with an area of 27.19 sq. km, or 4.80%), whereas lowest liveability was found far away from the centre of the city covering an area of 195.30 sq. km, or 34.52%. The LCI map of the Muang of Suphanburi seems to suggest that the Liveable City Index may correlate to the development of the transportation system as areas along the main road of the district were shown to have higher liveability.
5. Conclusions
This paper proposed a method to develop a Liveable City Index (LCI) by integrating rigorous questionnaire surveys, the Analytical Hierarchy Process (AHP) and GIS techniques. The Muang district of Khon Kaen was chosen as a case study for this research. As an initial step, a questionnaire survey was conducted with the residents in the study area to select relevant factors for a liveable city. In the second stage, recommendations were collected from the experts to identify the sub-factors for nine shortlisted factors using a simple majority analysis. In the third stage, a questionnaire was developed to generate a multi-factor evaluation of the factors: Safety, Environment, Healthcare, Transportation, Public Utility, Education, Economy, Population Density and Recreation, and their sub-factors. Responses from a total of 618 respondents (residents and experts) were collected. AHP was used to weigh and develop the LCI. The consistency ratio was 0.037, which was <0.1 and thus found to be acceptable. The Environment factor was the most sensitive among all the factors, with the normalized data of 5.553. Based on this analysis, the study area was categorized using the following labels: highest, high, moderately high, moderately low, low, and lowest liveability. It was found that, 80.10% of the study area was considered to have lowest liveability, and only 0.33% was considered to have highest liveability. The LCI map showed that the most liveable areas were Nai Muang and Khon Kaen Municipality.
In order to test the reliability of the model, the proposed LCI was used in the Muang district of Suphanburi in the West of Thailand. A questionnaire was developed to generate a multi-factor evaluation of the same factors and sub-factors used in the Muang district of Khon Kaen. AHP was used to weigh and develop the LCI. The consistency ratio was 0.045, which was <0.1 and thus found to be acceptable. The Environmental factor was the most sensitive. It was found that, 34.52% of the study area was considered to have lowest liveability, and only 4.80% was considered to have highest liveability.
The study employed the nine factors identified in a survey with the local residents and interviews with local experts and authorities which can be considered reliable sources of information regarding the liveability of a given city. This can reduce time in generating a map and the liveability index. Moreover, the model of the zonation map and the liveability index of Khon Kaen can be used in the Muang district of Suphanburi which shows that the model can be easily adapted in different areas with the same size.


