Energy-Independent Architectural Models for Residential Complex Plans through Solar Energy in Daegu Metropolitan City, South Korea

1
Department of Electrical Energy Engineering, Keimyung University, 1095 Dalgubeol-daero, Daegu 42601, Korea
2
Department of Architecture, Keimyung University, 1095 Dalgubeol-daero, Daegu 42601, Korea
3
Department of Landscape Architecture, Keimyung University, 1095 Dalgubeol-daero, Daegu 42601, Korea
*
Authors to whom correspondence should be addressed.
Sustainability 2018, 10(2), 482; https://doi.org/10.3390/su10020482
Submission received: 4 December 2017
/
Revised: 1 February 2018
/
Accepted: 7 February 2018
/
Published: 11 February 2018
(This article belongs to the Section Sustainable Engineering and Science)
Abstract
:This study suggests energy-independent architectural models for residential complexes through the production of solar-energy-based renewable energy. Daegu Metropolitan City, South Korea, was selected as the target area for the residential complex. An optimal location in the area was selected to maximize the production of solar-energy-based renewable energy. Then, several architectural design models were developed. Next, after analyzing the energy-use patterns of each design model, economic analyses were conducted considering the profits generated from renewable-energy use. In this way, the optimum residential building model was identified. For this site, optimal solar power generation efficiency was obtained when solar panels were installed at 25° angles. Thus, the sloped roof angles were set to 25°, and the average height of the internal space of the highest floor was set to 1.8 m. Based on this model, analyses were performed regarding energy self-sufficiency improvement and economics. It was verified that connecting solar power generation capacity from a zero-energy perspective considering the consumer’s amount of power consumption was more effective than connecting maximum solar power generation capacity according to building structure. Moreover, it was verified that selecting a subsidizable solar power generation capacity according to the residential solar power facility connection can maximize operational benefits.
1. Introduction
With the importance of renewable energy becoming widely recognized, the energy paradigm is rapidly shifting from fossil energy to renewable energy, especially in developed countries [1,2]. In terms of energy consumption, saving energy in the construction sector is very important. The construction sector accounts for 36% of energy consumption worldwide. Since buildings, once built, have long-term impacts of more than 30 years, various studies have been conducted on increasing efficiency while reducing energy consumption [3,4,5]. Moreover, people’s awareness of energy consumption reduction is also expanding [6,7].
Various studies have been conducted on improving buildings’ energy self-reliance using renewable energy sources while also reducing energy consumption [8,9,10]. A power system that can improve energy self-reliance in buildings was developed in China using solar and geothermal energy [9]. Further studies are being conducted on the operation of power systems by analyzing energy consumption patterns in buildings to use renewable energy sources more efficiently [10].
Financial issues are also important considerations for introducing and enlarging energy-independent buildings using renewable energy sources. Economic aspects of various energy configurations have been compared [11]. Technical solutions for optimizing energy demands, along with financial considerations, have been suggested to move current dwellings toward becoming nearly zero-energy buildings (nZEB) with remarkable environmental benefits [12]. Further, the implications of existing electricity tariff arrangements for financial attractiveness have been modeled [13].
Research on architectural types and designs has also been conducted for maximizing the use of renewable energy in buildings. An ideal hybrid system—including a photovoltaic cell, wind turbine, and battery—was introduced to meet the electrical energy needs of a residential building in Tehran [14]. Aside from buildings that combine various renewable energy sources, building technologies focused on a single type of renewable energy, such as wind power [15] or sunlight [16], are frequently discussed. Among these, solar energy technology is one of the most promising renewable energy sources for meeting future global energy demands, despite certain drawbacks [17]. Using solar energy, attempts have been made to analyze the integration of residential buildings with photovoltaic (PV) systems in various ways, including facades, sunshades, and rooftops [18].
Korea has good meteorological characteristics for solar energy utilization since about 63% of the land is mountainous. Thus, for residential areas with high energy use, solar energy is preferable to wind power, and various aspects of solar-energy-related issues have been investigated, such as photovoltaic panels, economics, and so forth [19,20]. However, there remains a lack of studies concerning optimized architectural types and PV panels for the best performance of solar energy combined with the best locations. Without a consideration of locations for optimizing solar energy performance, additional PV panels are needed to achieve the same performance, which leads to additional financial burdens and changes in building design.
This research aims to develop energy-independent architectural models for residential complex plans through solar energy optimized for specific locations. Daegu Metropolitan City in South Korea was specifically selected as the target area for the residential complex and for a concrete analysis of the consumption and production of energy in a specific area. To maximize the production of solar energy in a manner suitable to the corresponding local characteristics, optimal places in Daegu were drawn. Several architectural design models (types) were developed to maximize the use of solar energy within the optimal place. Moreover, an economic analysis was performed considering the profit generated from the use of solar energy sources after analyzing the energy use patterns of each design model. In this way, the optimum residential building model (type) was identified.
2. Characteristics of Energy Supply and Use in Daegu
2.1. Study Area
Along with Andong and Jinju, Daegu Metropolitan City is among the Korean cities that are rich in solar radiation. Located in the middle of the Sun Belt that connects Andong, Daegu, and Jinju, Daegu is an excellent location for solar energy utilization [21]. Therefore, it has very high potential for the distribution and expansion of solar energy facilities. In addition, since it was selected as a Solar City, the distribution and installation of photovoltaic power generation facilities for solar energy production are being expanded in Daegu. However, Daegu’s photovoltaic energy production was 10,828 TOE (Tonnage of Oil Equivalent) as of 2015, representing about 1.3% of the entire national production (849,379 TOE) and ranking fourteenth in the country [22]. The significantly low photovoltaic energy production of Daegu shows that, in contrast with the city’s potential, the distribution and expansion of photovoltaic facilities are insufficient.
2.2. Characteristics of Energy Supply and Use in Daegu
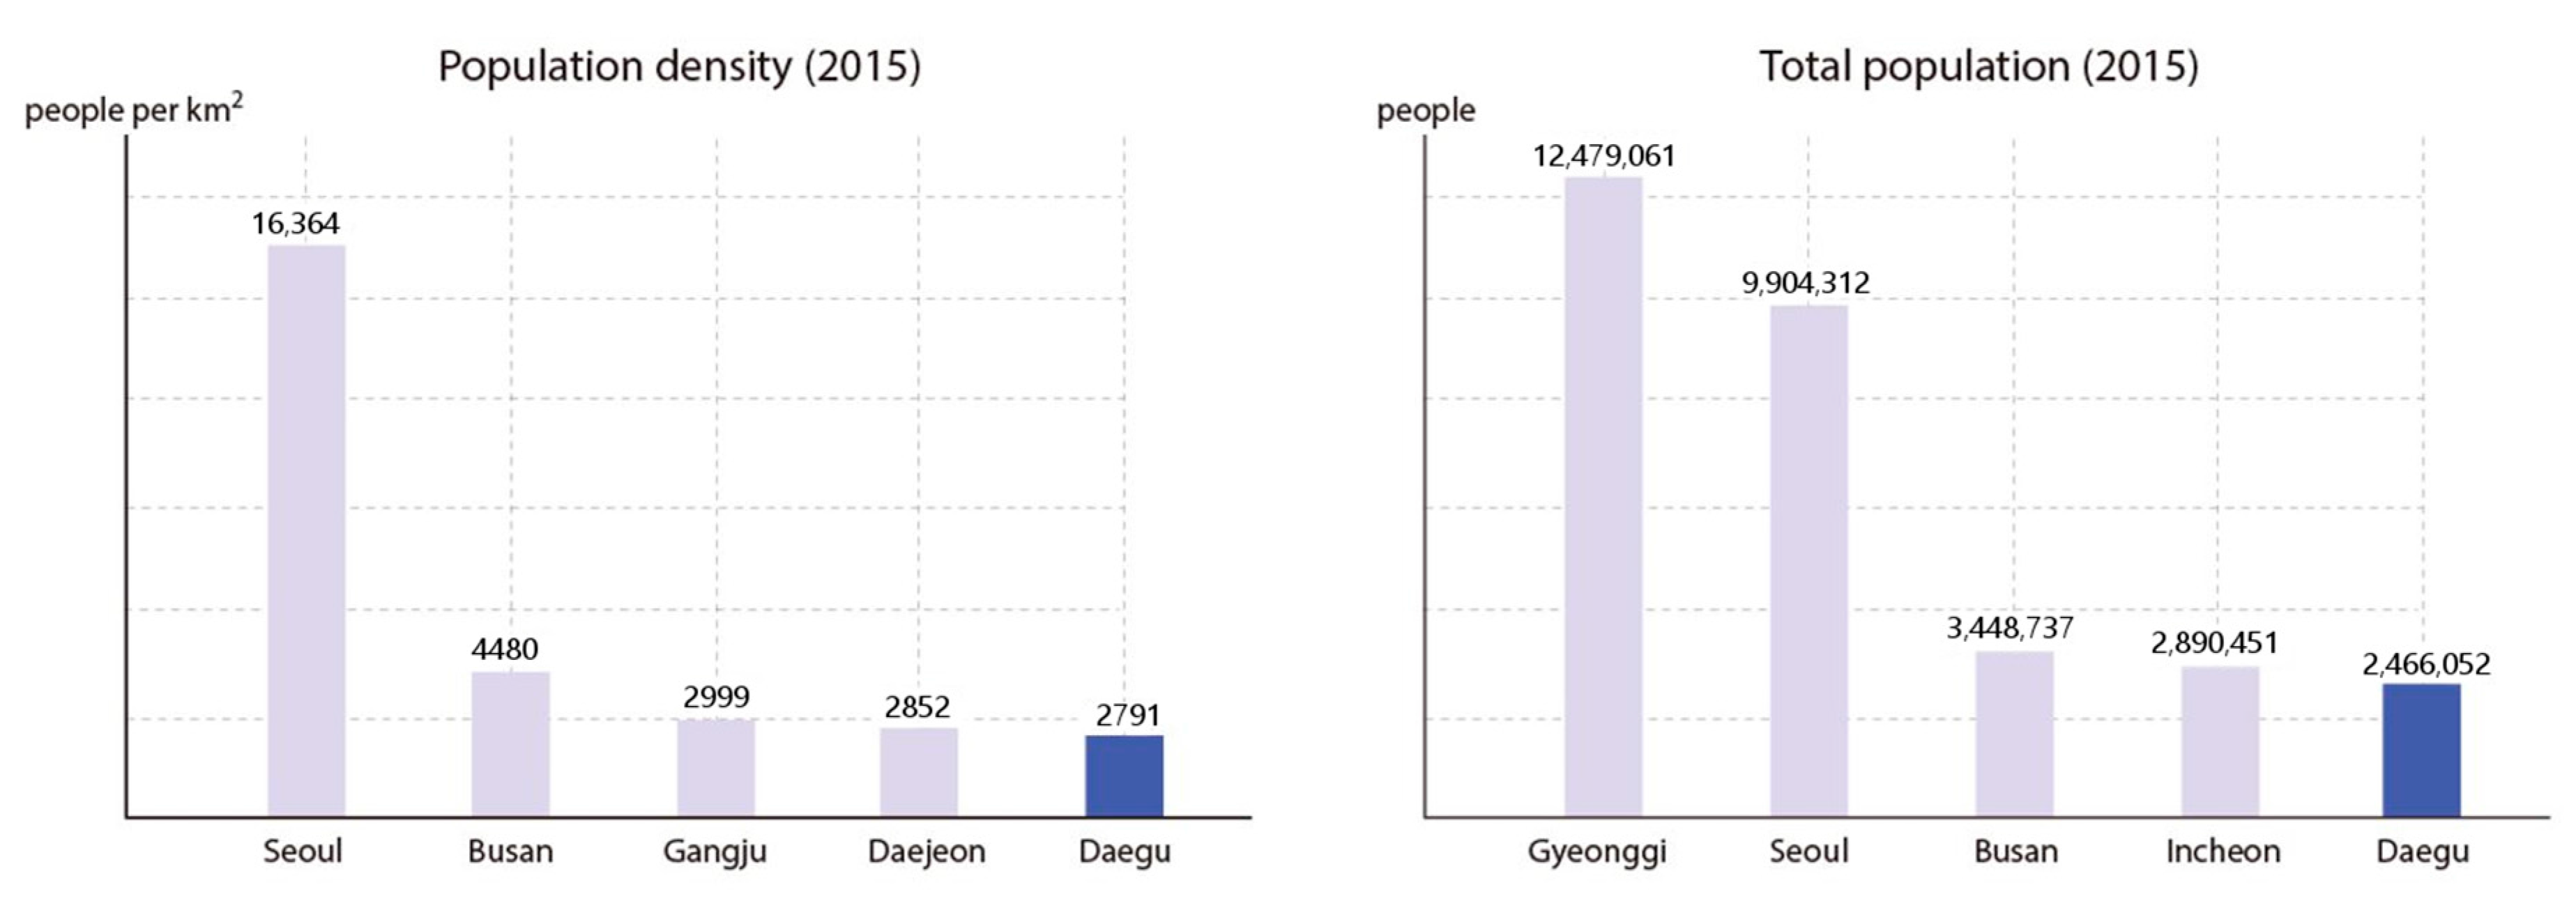
Daegu has a population of 2,466,052, making it Korea’s fifth-largest city (Figure 1). Analyzing the energy consumption status of Daegu, we find that, first, the final energy consumption trend comprises oil (43.9%), electric power (26.1%), and gas (19.2%), accounting for 89.2% of the total energy consumption (Figure 2). When compared with other cities in terms of energy consumption, the percentage of gas energy is relatively high, and gas consumption is increasing every year (Figure 3) [23].
Second, in terms of energy consumption by sector, Daegu is characterized by low energy consumption in the industrial sector and high energy consumption in the residential and commercial sector compared to other cities (Figure 4). When examining Daegu’s energy consumption state in the residential and commercial sector, a high dependence is observed in electricity (36%), gas (34%), and oil (22%), occupying 92% of the overall energy consumption of the residential and commercial sector. Daegu’s energy consumption in the residential and commercial sector accounts for 4.7% of the entire energy consumption nationwide (Figure 5) [23].
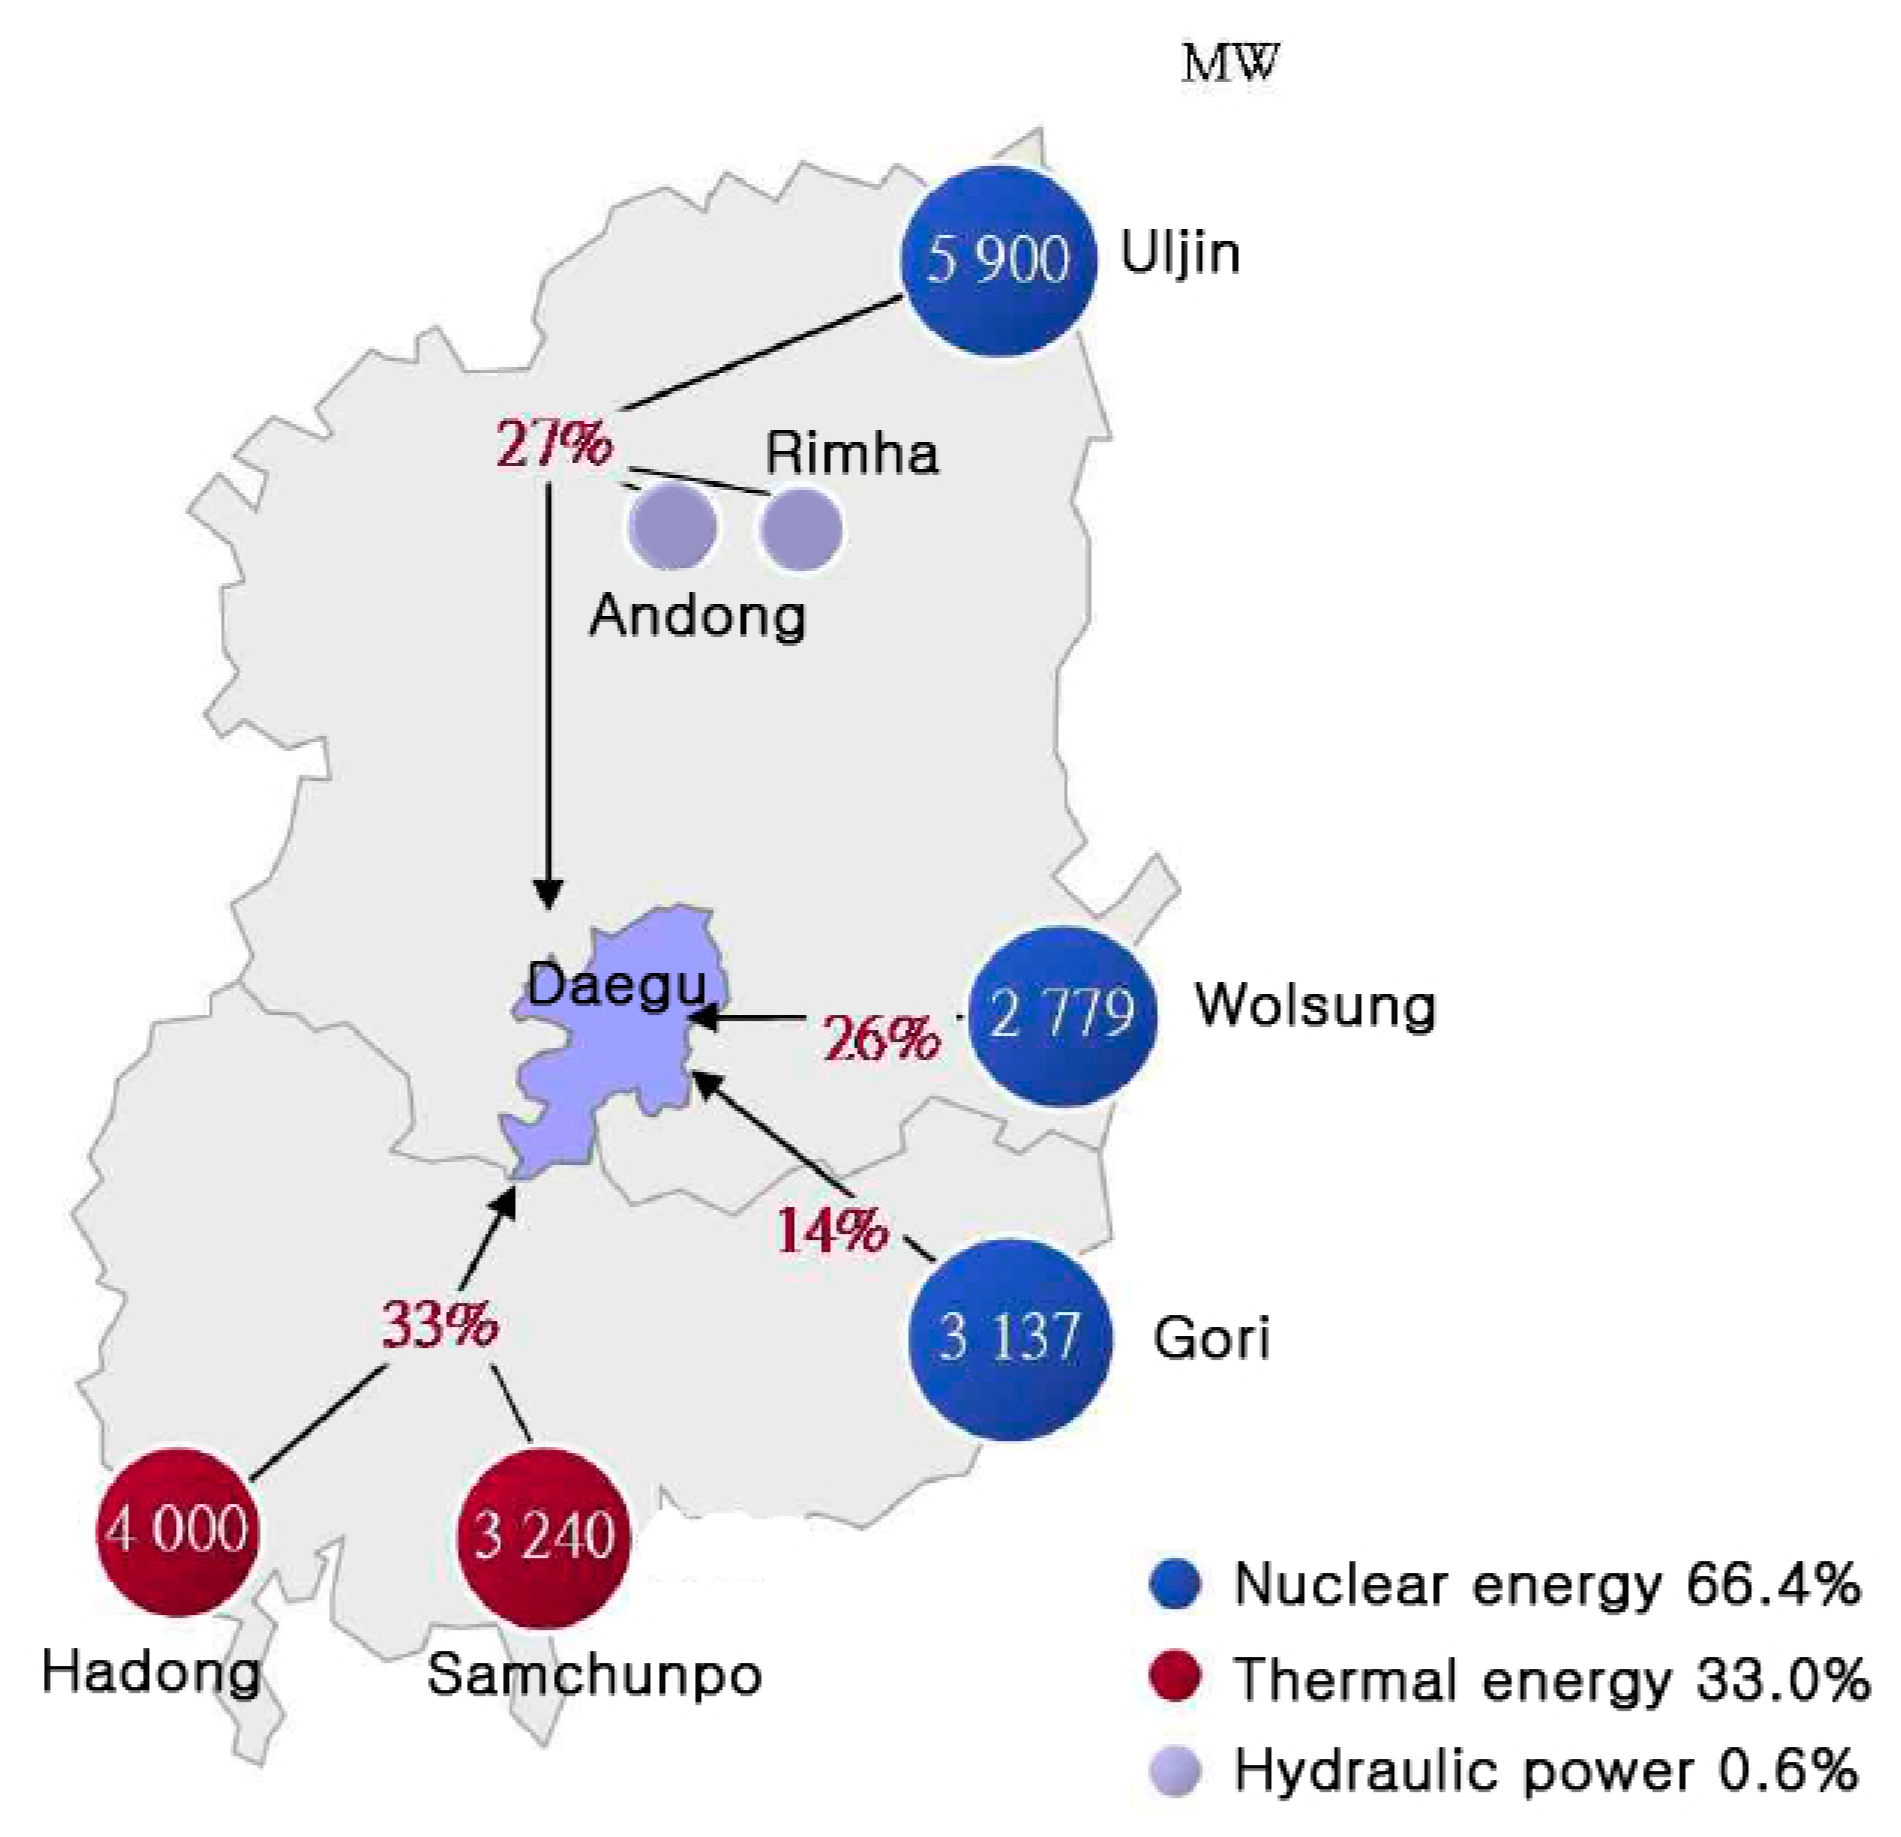
In particular, when examining the power system diagram of Daegu, which has the highest energy consumption in Daegu’s residential and commercial sector, it can be seen that Daegu is receiving 100% of its electric power from nearby cities. The cities of Uljin, Wolseong, and Gori supply 66.4% of the total electricity of Daegu from nuclear energy, which is the most-used power supply source; 33% of the electricity of Daegu is supplied with thermoelectric power from the cities of Hadong and Samcheonpo’ and 0.6% of Daegu’s electricity is supplied with hydroelectric power from the cities of Hadong and Imha (Figure 6) [23].
Analyzing such energy consumption and supply trends in Daegu reveals that Daegu’s degree of dependence of on primary energy, which is the main cause of environmental pollution, is very high, showing high energy consumption in the residential and commercial sector, which is a point of distinction with other cities. In particular, electric demands in Korea are constantly rising [26], and the consumption of energy in the residential and commercial sector in Daegu is higher than in other cities. Therefore, if the energy supplied to this sector from primary energy sources is replaced with environmentally friendly renewable energy, the ripple effect should be very large in environmental terms. Recently, the government announced a new energy policy based on reducing dependence on coal and nuclear energy. A retreat from coal and nuclear power will increase reliance on renewable energy sources as well as LNG. In these respects, Daegu and the government have set policies and provided support for solar energy systems in the residential and commercial sector to improve energy independence and security.
2.3. Policies for Activating Renewable Energy Sources in South Korea
In Korea, policies are being practically implemented for the activation of renewable energy sources. The “1 Million Green Homes” program, which grants subsidies to introduce the use of renewable energy in houses, is being promoted by the government under the purpose of developing one million green homes by 2020 [19,27]. Furthermore, policies for the activation of a small power market to promote the dissemination of residential power generation systems that use renewable energy sources are being implemented. Examples of typical power trading systems are Net Metering and PPA (Power Purchase Agreement) [27]. In Korea, the residential electricity billing system has maintained a progressive fee system in which the electricity rate increases rapidly by each segment depending on monthly power consumption. Therefore, high power consumers can expect electricity fee reductions by lowering the progressive burden using the abovementioned Net Metering. The other power trading system, PPA, refers to a contract system on sales of power produced through KEPCO (Korea Electric Power Cooperation, Naju, Korea), KPX (Korea Power Exchange, Naju, Korea), and renewable energy sources. At this time, an appropriate contract can be selected by considering the advantages according to the type of power trading [28].
3. Data and Methodology
3.1. Site Analysis for Residential Area Using Solar Energy
In the residential sector, electric power from the utility can be reduced by solar energy, which is called “net metered”. It is expected to be economically beneficial by lowering the utility bill. Furthermore, the peak demands mostly occur two times in day time and evening time in South Korea, while the output of solar systems is the maximum at around noon. Thus, solar systems can help reduce the first peak demand in a day. In this respect, solar energy can contribute to leveling off energy supply and demand in the government and Daegu Metropolitan City, and it ensures a stable and reliable power supply.
Normally, climatic conditions such as solar irradiance, sunshine duration, mean temperature, amount of rainfall, and relative humidity are important indicators when determining the best lands for photovoltaic facilities. Among those, solar irradiance and temperature conditions must be considered first [29,30]. In addition, since dissimilar metals can cause contact corrosion and efficiency reduction in solar cell modules, pollution and saltiness are also conditions that must be considered [29,30]. Therefore, in spatial terms, distance from roads and rivers plays a major role in site selection for photovoltaic facilities [30]. Furthermore, past records regarding winter snowfall, icing, and thunderstorm disasters must be considered; in-depth analyses of the expected installation site must be performed [29]; and topography-related factors such as gradient, elevation, and slope direction must be considered [23].
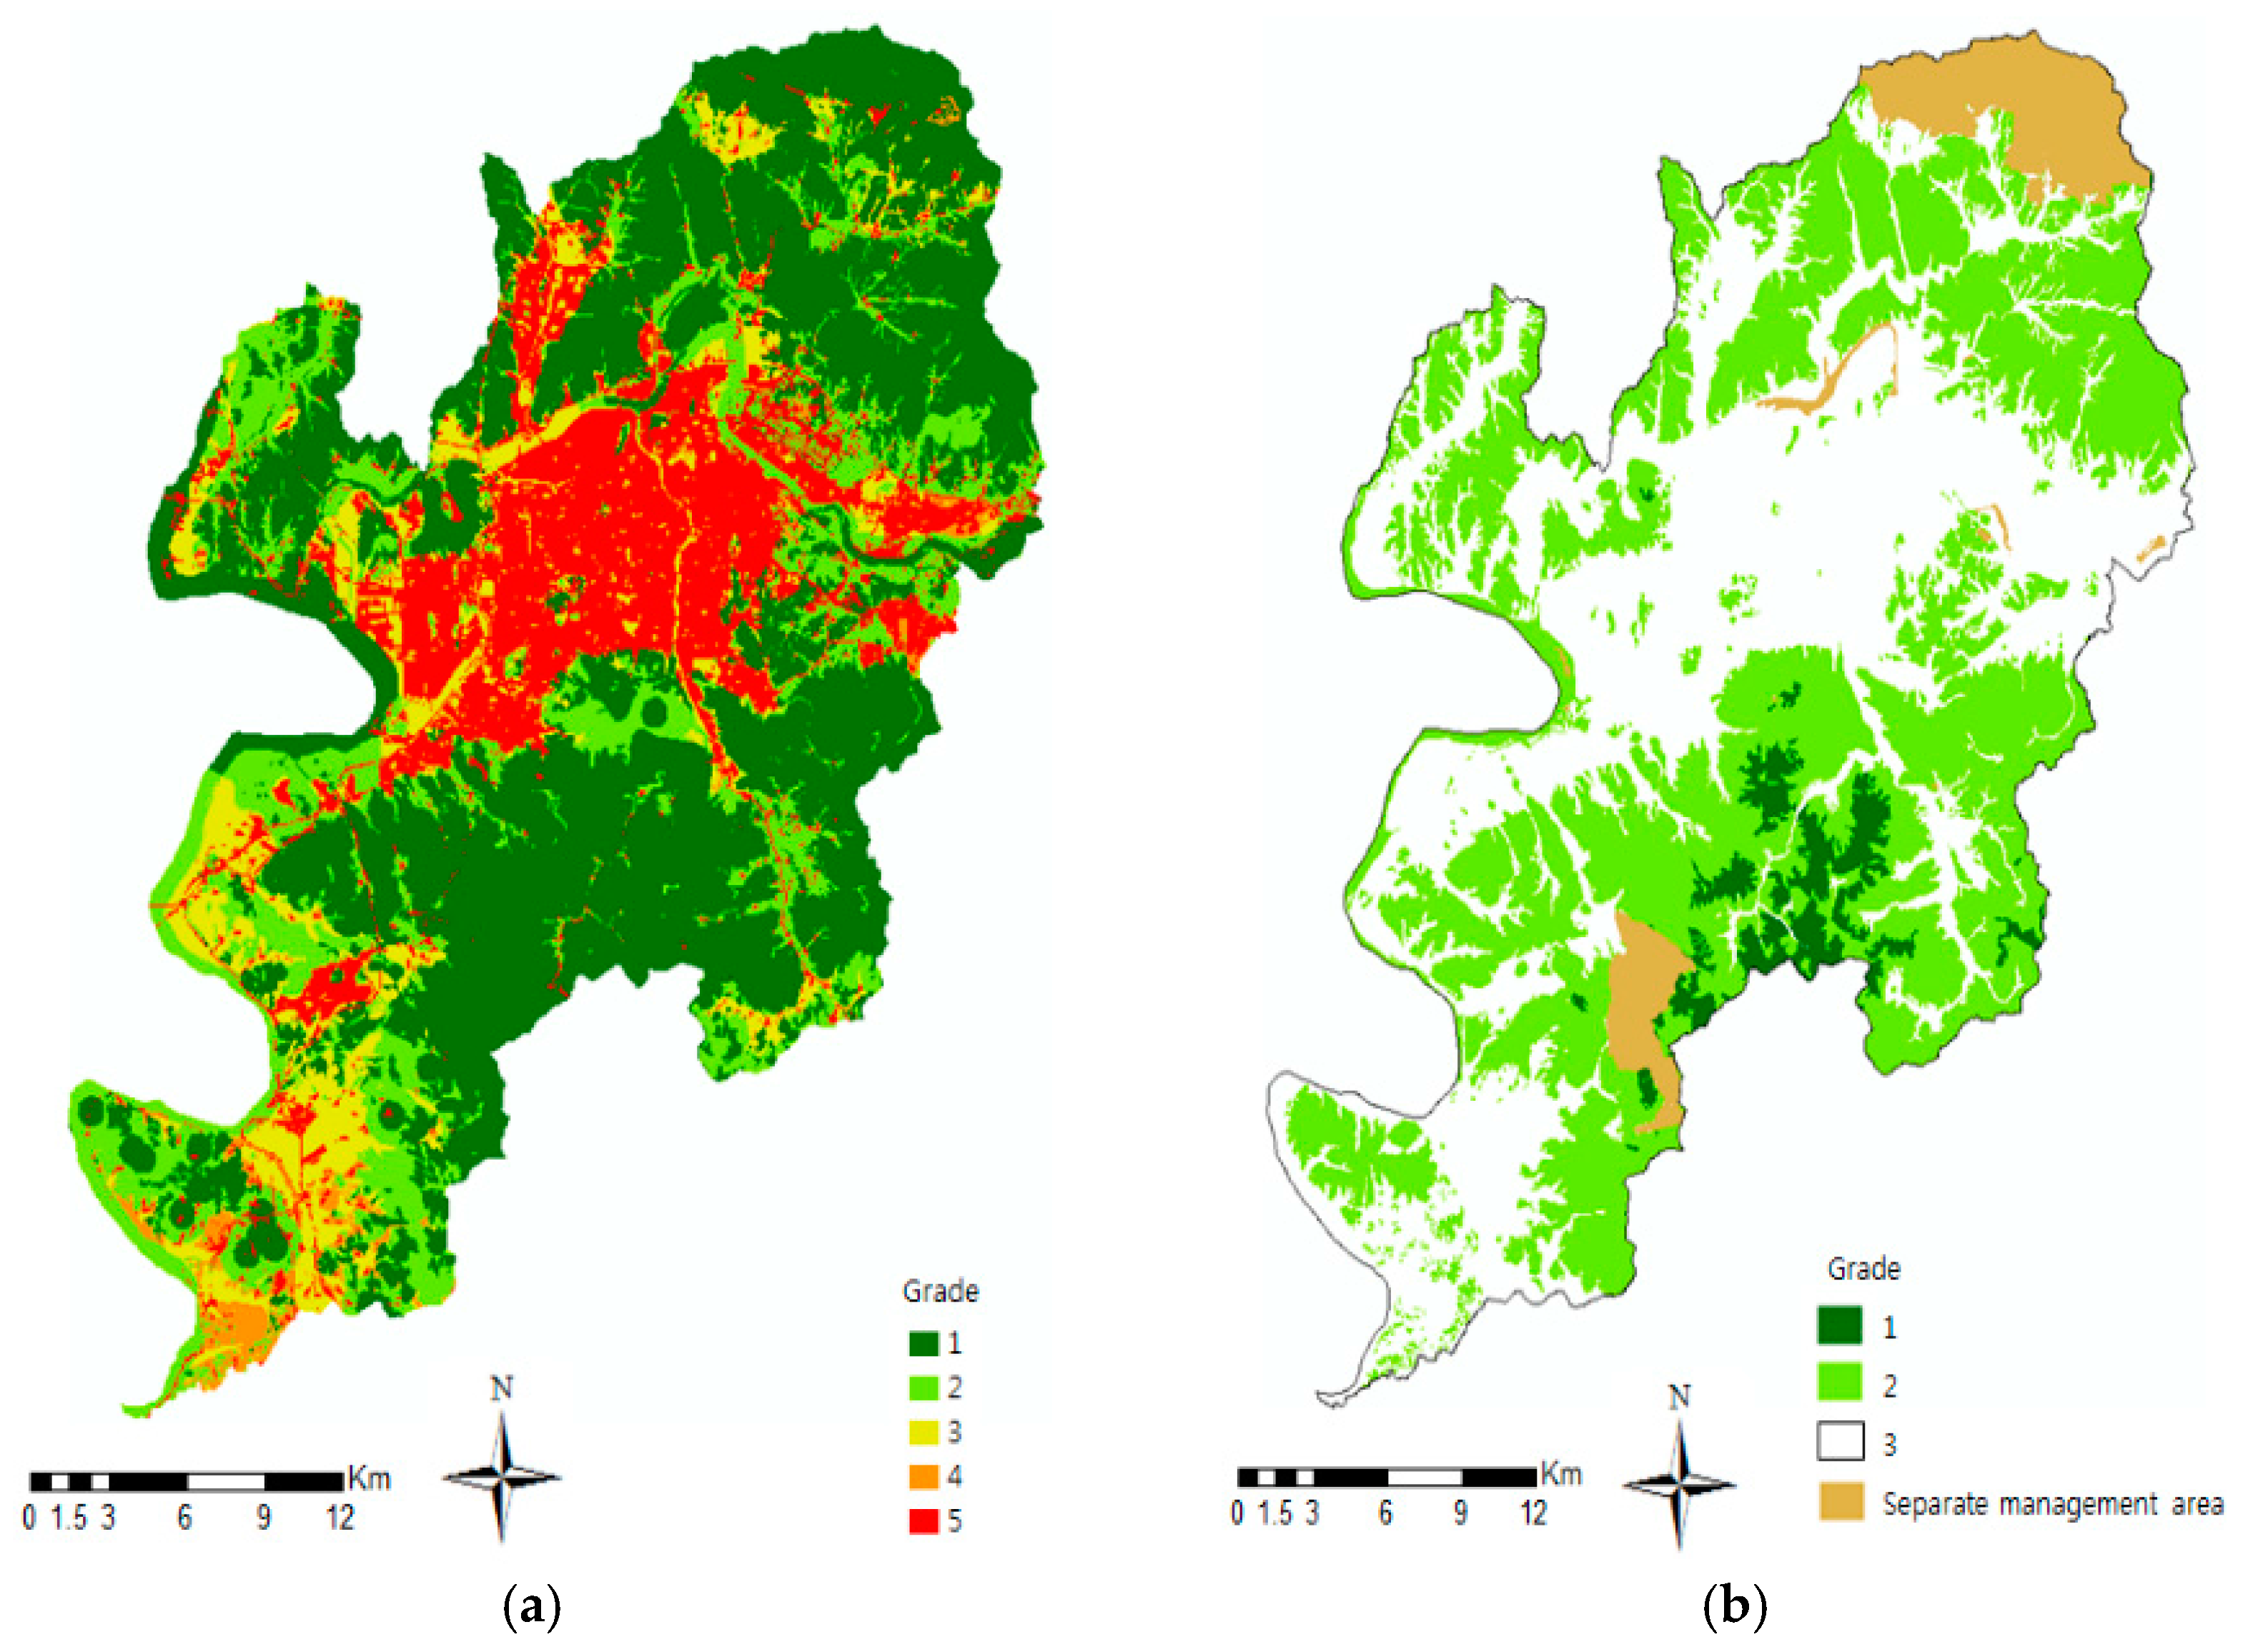
In this research, seven indicators were selected based on the literature (Table 1) to analyze the optimum places to install photovoltaic facilities in Daegu and to further discuss energy-independent architectural models. The indicators were classified into exclusion conditions and location conditions. The national environmental zoning map and the ecological zoning map were selected as exclusion conditions, and elevation, slope direction, distance from roads, distance from rivers, and solar irradiance were selected as location conditions. First, the national environmental zoning map, which is one of the exclusion conditions, is a thematic map that comprehensively evaluates environmental factors for the eco-friendly preservation, development, and use of the land. This map is classified into five ranks. Ranks 1 and 2 are for preservation areas, Rank 3 is for buffer areas, and Ranks 4 and 5 are for eco-friendly development induction areas. In this research, Rank 1 and Rank 2 areas, in which development is restricted, were set as exclusion conditions. The ecological zoning map is a map ranked depending on the ecological value, naturalness, and scenic value of natural environments with regard to mountains, rivers, inland wetlands, lakes, farmlands, and cities. Rank 1 areas and separate management areas were selected as exclusion conditions because they contain the main ecological axis and eco-corridors—areas that are the main habitat of endangered fauna and flora, areas with excellent ecosystems, or areas with particularly spectacular landscapes. Elevation, which is one of the location conditions, was set below 100 m for being easier for the installation of photovoltaic facilities. The gradient was set within 10°, and the slope direction was set toward the southeast/southwest direction to maximize photovoltaic energy generation efficiency. In addition, the distance from roads was set to more than 50 m to minimize the impact of dust and particles by cars since air pollution can cut solar panel efficiency by 17–25% [31,32]. Solar irradiance was set to a standard of more than 4000 MJ/m2, which is enough for photovoltaic energy generation [33]. However, analysis results for Daegu’s solar irradiance revealed that the solar irradiance of the entire research site is above 4000 MJ/m2, which is suitable for the solar irradiance standard. Therefore, to select a relatively more efficient and suitable place in terms of solar irradiance indicators, an overlap analysis of location conditions and exclusion conditions was performed before drawing a solar irradiance map.
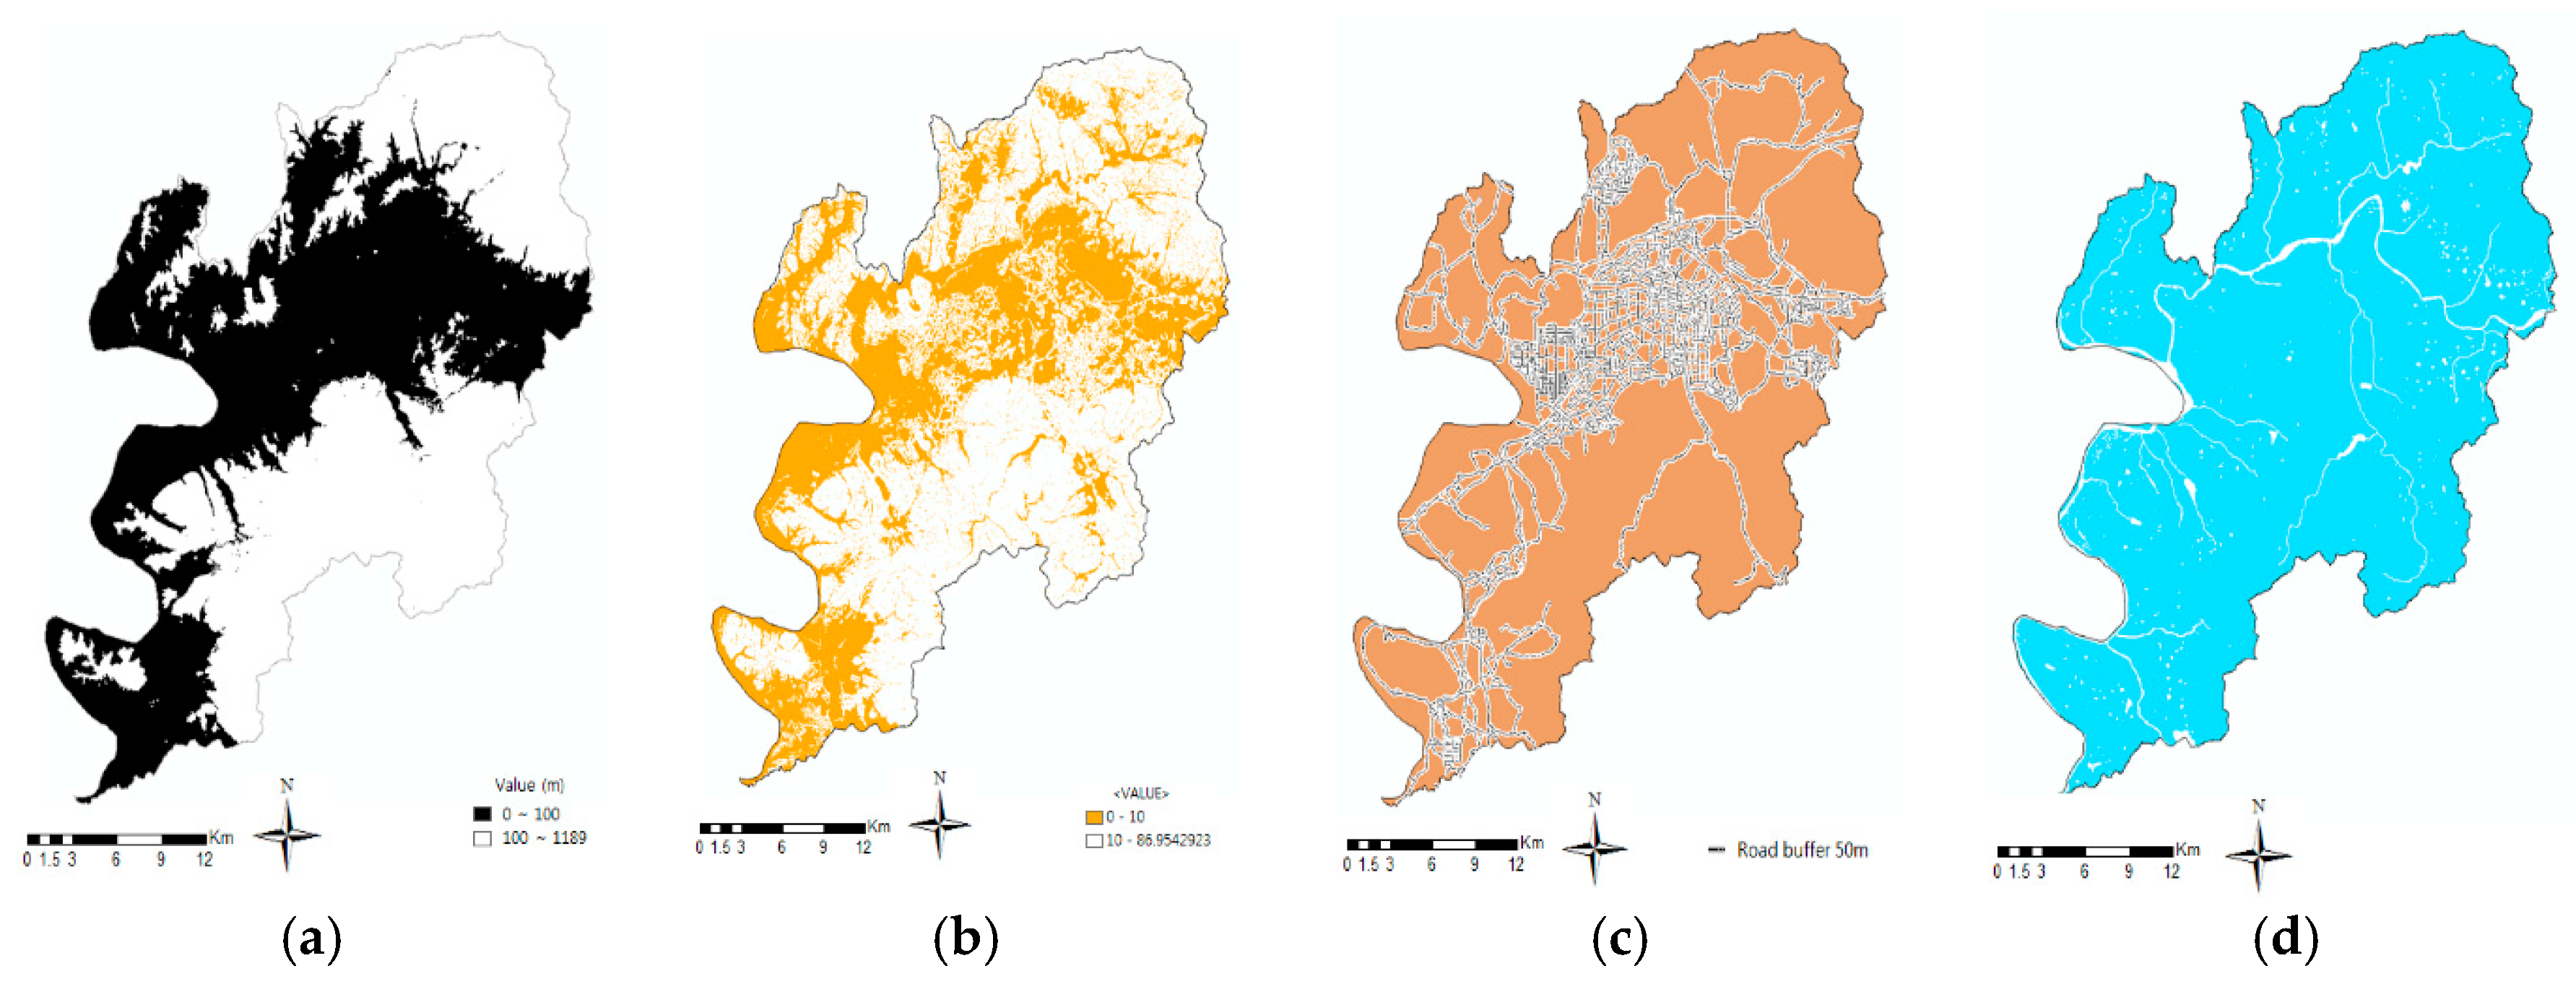
For this research, ArcGIS ver. 10 was used. First, Daegu Metropolitan City was extracted from the national environmental and ecological zoning maps provided by the Ministry of Environment to analyze exclusion conditions (Figure 7). Then, after extracting the layers of intermediate and index contour lines using a 1/25,000 digital map of Daegu, a TIN (triangulated irregular network) and DEM (digital elevation model) were generated, and an analysis of elevation, gradient, and slope direction—which were selected as location conditions—was performed. In addition, to analyze the distance from roads, ArcGIS buffer functions were used, calculating a separation distance of 50 m from roads. Figure 8 shows the results of the analysis of location conditions, indicating regions with less than 100 m of altitude, regions with less than 10° of gradient, regions with 50 m of distance from roads, and excluded regions with water environments.
Since Daegu’s solar resource map, created by the Korea Meteorological Administration, is a numerical virtual resource map with a spatial resolution of 1 km × 1 km provided in CSV (comma separated value) form, it was primarily converted into processible data using ArcGIS’s geoprocessing functions and then converted into spatial information using IDW (inverse distance weight) interpolation methods. To allow for a clear comparison, solar irradiance distribution was indicated from Rank 1 (highest solar irradiation) to Rank 7 (lowest solar irradiation). Finally, after analyzing a suitable place for photovoltaic energy generation based on the exclusion and location condition results obtained through data overlap analysis, solar irradiance and slope direction data were reflected to finally draw a map of suitable solar places in Daegu.
3.2. Architectural Design for Solar Energy Utilization
3.2.1. Considerations for the Design of Buildings that Use Solar Energy
Buildings that utilize solar energy can be mainly classified into two categories. First, there are buildings that use sunlight. These buildings require the installation of photovoltaic systems and include the installation of solar cells in places such as the building’s roof to convert natural sunlight energy into the electric energy needed in the building. Second, there are buildings that use solar heat. These buildings require the installation of solar collectors in places such as the building’s rooftop to use heated water for heating or as service hot water [34]. Likewise, buildings that produce energy using sunlight or solar heat have solar cell modules for solar energy supply located mainly on the rooftop or balcony. The position and direction of solar cell modules is very important for maximizing energy production. The energy-production maximizing position for solar cell modules is 90° with solar cell module plates and sunrays, obtaining the highest efficiency when facing south. In Korea, the highest energy production was obtained when solar cell module plates were inclined 30° from the ground (Figure 9) [35].
3.2.2. Urban-Scale Building Complex Plan Utilizing Solar Energy
Starting with the Kyoto Protocol in 1997, the entire world has responded actively to environmental problems. Especially in Europe, eco-friendly residential complexes started to be planned from the early 1990s with the purpose of reaching an energy self-sufficiency rate of 100%. These European eco-friendly residential complexes were part of an urban-scale solar energy distribution program called “Solar City”, which was planned for alternative energy production (especially solar energy) and carbon dioxide reduction in all countries [36]. Solar-energy-utilizing residential complexes in European cities are characterized by being planned on low-floor scales. Normally, low-rise residential complexes consume less energy for the maintenance of the building than high-rise buildings [34]. In addition, since the height of the building is low, shadow interference between buildings is minimized, allowing solar cell modules to be usefully placed on railings or rooftops. In this research, based on this analysis of European low-rise residential complex cases, a low-rise residential complex plan for solar energy utilization was developed for the target site.
3.3. Optimum Solar Power Generation Facility Planning and Operating Strategy for Buildings
To improve the energy self-sufficiency of buildings using solar power generation, analysis of solar panel installation angles, maximum installable capacity, and energy production through the installed solar panels is required, considering the climatic characteristics of the building site and the design characteristics of the building, which were determined based on solar location conditions. To determine the optimum solar power generation facility plan and power-trading method based on these analysis results, a power demand analysis of the building must be conducted first. In this regard, the building’s power demand data can be analyzed based on statistics provided by the KPX.
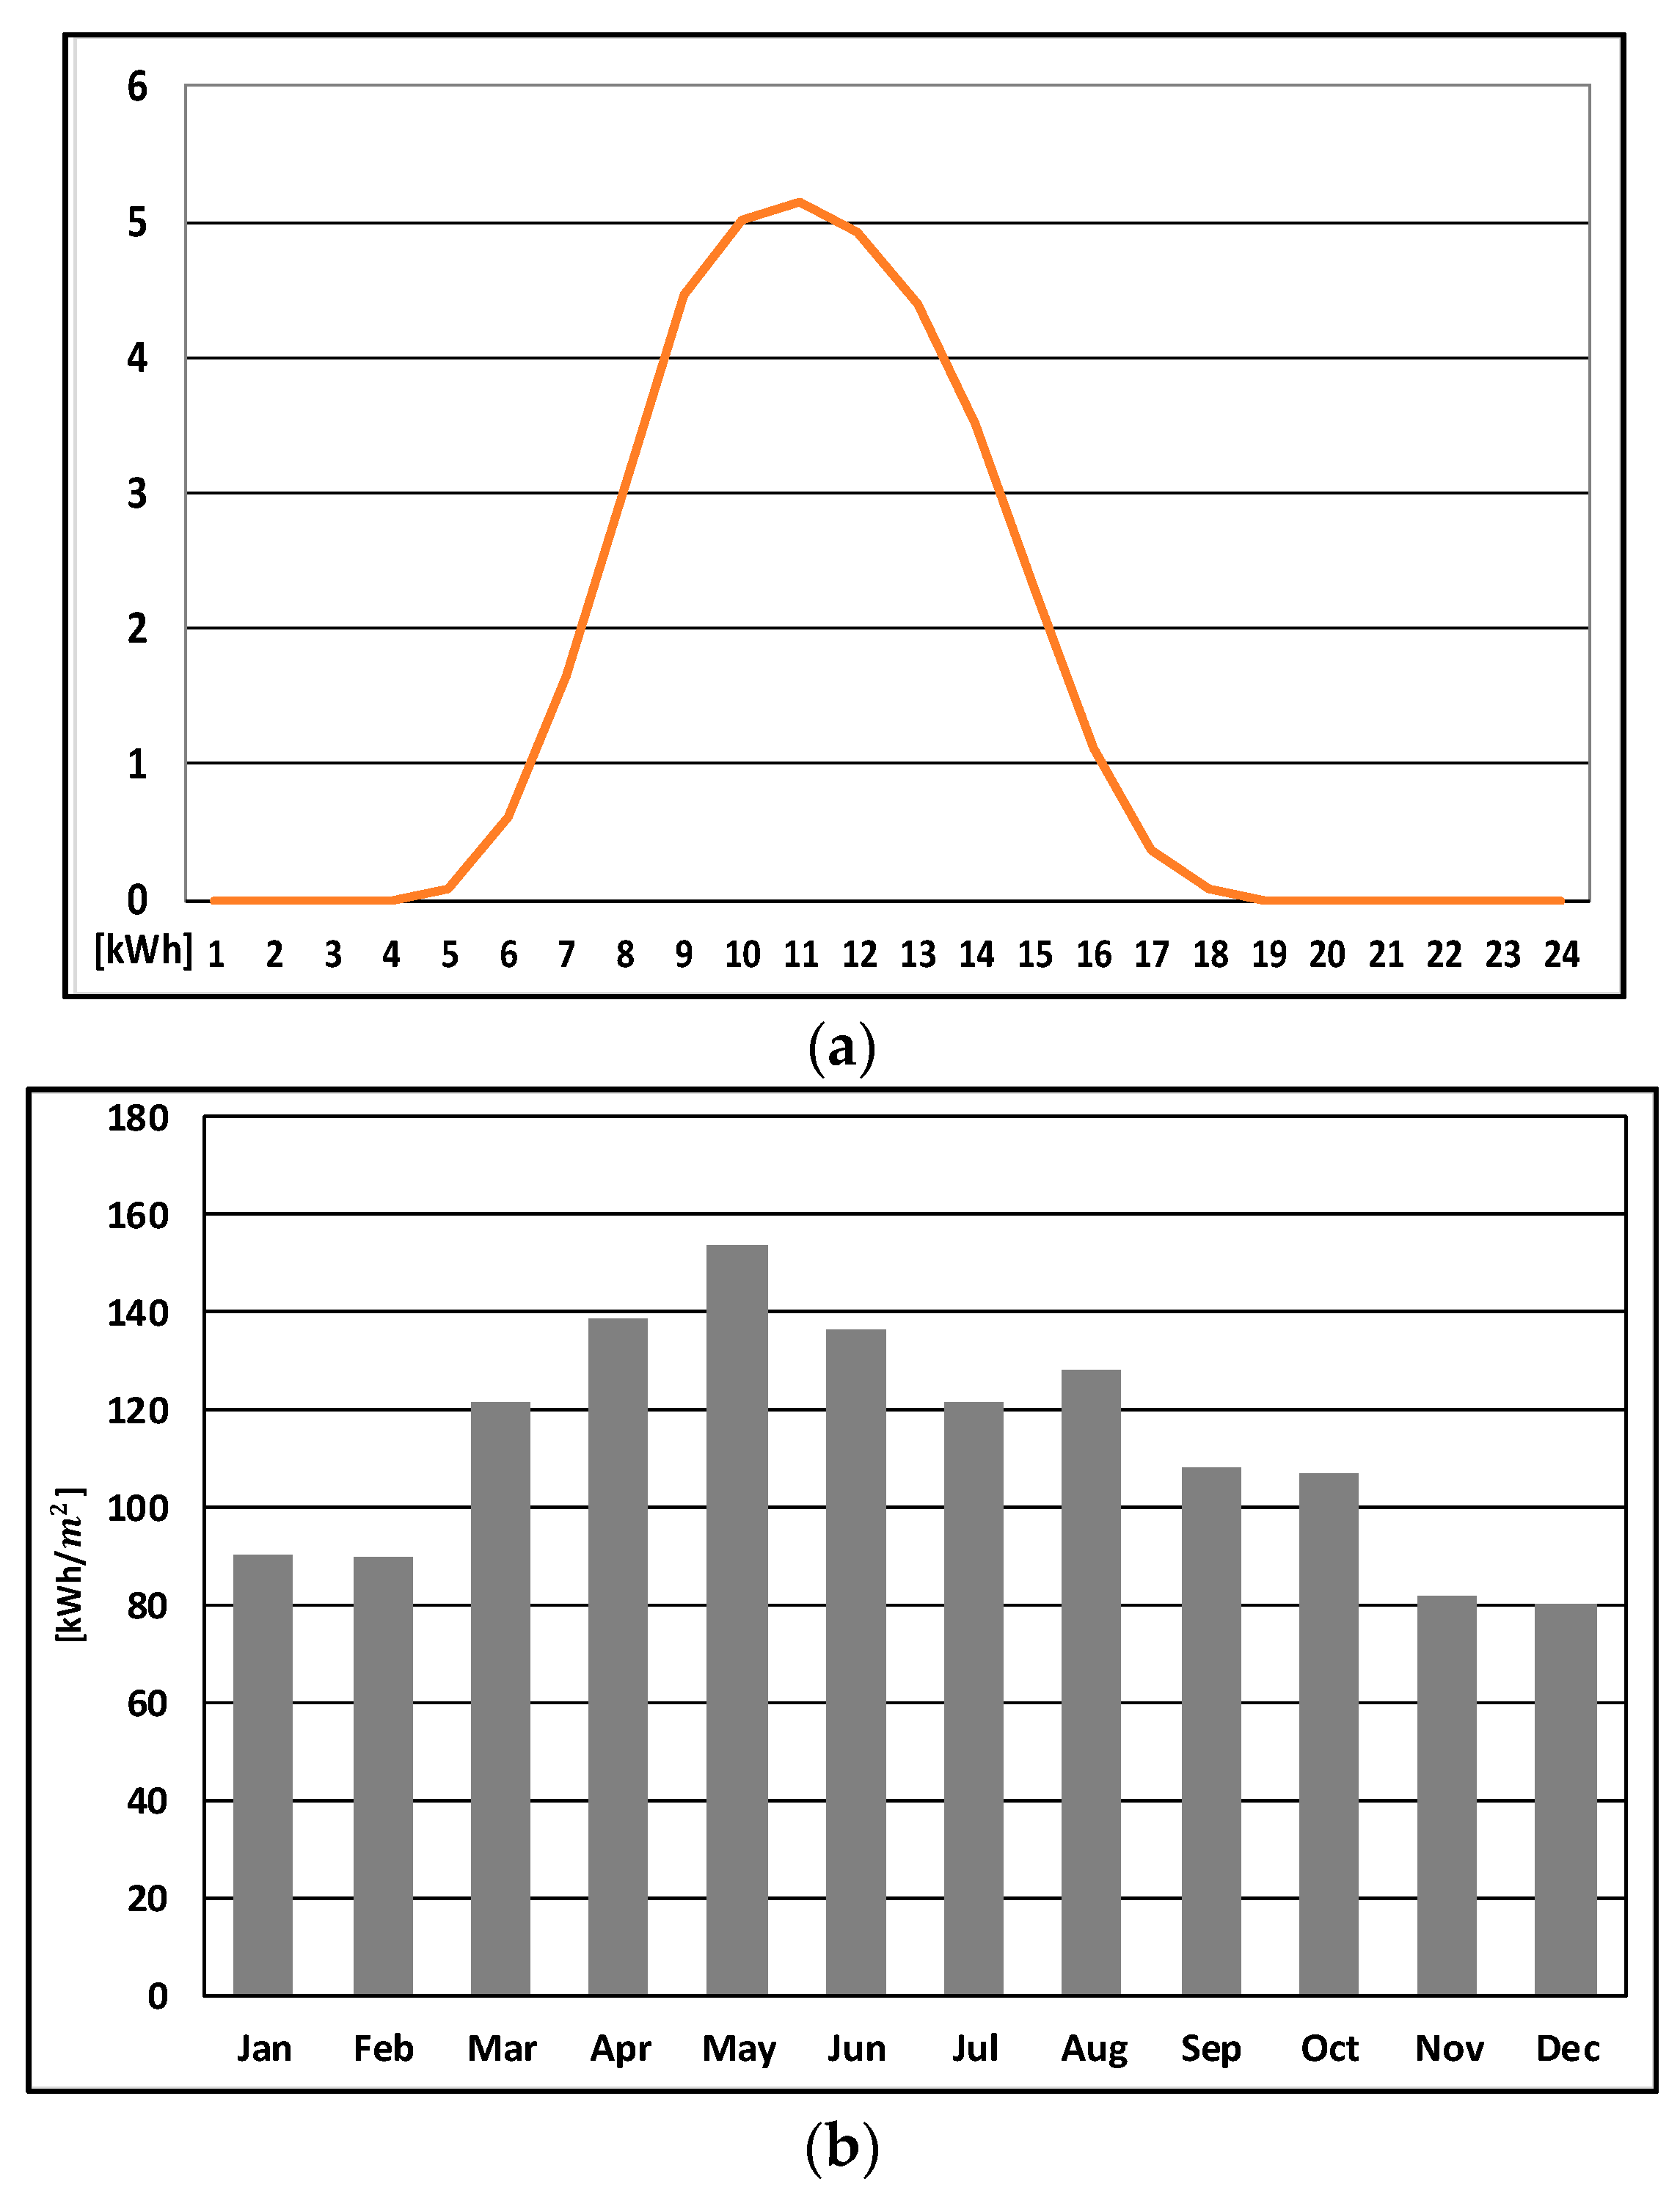
Solar power generation characteristics are affected by climatic characteristics such as solar irradiance and temperature. The optimum installation angle was calculated when placing solar panels based on the weather data of the site. The optimum installation angle of solar panels can be calculated based on the maximum generation capacity and time. If architectural design plans are to be considered, the optimum installation angle considering the maximum generation capacity of solar panels is 15°. However, the maximum power generation time using solar panels varies depending on the weather conditions of the site. Assuming a solar panel is placed with the maximum installation capacity based on architectural design plans, the daily average solar power generation trend and monthly solar irradiance trend in Daegu are evaluated using weather data from the last five years from the Korea Meteorological Administration (Figure 10). As shown in Table 2, the optimal tilt of solar panel is determined by the weather condition in each region, and the optimal tilt of solar panel in Daegu, South Korea is 25°.
In this research, S/W Solar Pro was used to analyze the solar power generation characteristics of the site. When solar power generation is to be connected to residential buildings, not only can the building’s energy self-sufficiency be improved but electricity fee reductions and economic benefits through power sales can also be expected. However, economic losses can be caused when connecting solar power generation with the maximum installable capacity according to the building design without analyzing the building’s power use patterns. The selection of power trading methods through solar power generation also acts as a key factor in economic analyses. Currently, in Korea, the residential rate progression system is being used. In this system, higher rates are gradually applied as power usage increases. The residential electricity rate progression system is shown in Table 3.
The electricity rate is composed of the basic rate and the energy charge. For example, in the case of consumers using 300 kWh of electricity per month, a rate of $0.093/kWh is applied for the first 200 kWh, and $0.1879/kWh for the following 200 kWh, resulting in a total of $37.450. In this research, for the sake of the economic assessment of the operation of photovoltaic power generation, costs and benefits obtained through photovoltaic power generation were defined as solar panel operation benefits and government subsidies. The economic analysis method used was the net present value analysis method, as shown in Equation (1). Therefore, solar panel operation benefits are calculated as annual benefits, and government subsidies and initial capital costs are defined according to the installation capacity of solar panels. In the economic analysis, a discount rate of 5% was applied, and the entire period of the program was set to 20 years, which is the warranty period of solar panels. Additionally, maintenance costs are considered to prevent the efficiency reduction of solar panels due to temperature and dust accumulation on the solar panel.
where and represent the total solar irradiance of the solar panel at time and the sunshine amount at the reference conditions , respectively. , , and are, respectively, the temperature coefficient at maximum output , module temperature at time , and reference temperature . represents Power Purchase Agreement (NM: Net Metering, PPA: Power Purchase Agreement). and are photovoltaic power generation operation benefits per power purchase agreement and photovoltaic power generation initial cost per power purchase agreement, respectively. and are photovoltaic power generation subsidy and operation and maintenance costs of photovoltaic power generation, respectively. is photovoltaic power generation facility capacity. and are discount rate and year (: warranty period of solar panels), respectively.
The power purchase system is divided into two main categories by settlement method: Net Metering (NM), and Power Purchase Agreement (PPA).
NM is a trading method that allows for electricity fee reduction by subtracting surplus power returned to KEPCO from the amount of electricity used from the system. PPA is a trading method that allows cash settlement by applying the monthly weighted average SMP (system marginal price) to surplus power. Since settlement methods are different per power purchase type, an analysis of the user’s power consumption patterns is necessary for selecting the right trading agreement. Therefore, to select the appropriate trading method and solar power generation capacity for a specific purpose, energy self-sufficiency and economic analyses should be performed regarding surplus power generated through solar power generation per each power purchase type.
Through the flowchart shown in Figure 11, solar power generation facility plans and operational strategies can be proposed. The capacities of photovoltaic power generation facilities vary depending on the operational strategies. In this research, optimum installation capacities are proposed according to two operational perspectives.
First, the facility capacity can be calculated as follows when installing solar power generation systems for energy self-sufficiency purposes:
where , , and indicate power demand (kW), solar panel power generation (kW), and facility reserve rate 10% (R = 0.1 pu), respectively.
The fact that a consumer’s power consumption, including the solar power generation amount, approaches 0 shows a high degree of energy self-sufficiency. Therefore, in terms of energy self-sufficiency, a solar power generation facility capacity in which the final power consumption amount becomes the minimum should be selected as shown in Equation (3). Second, the facility capacity should be calculated as follows when installing solar power generation systems to obtain economic benefits:
In Korea, instead of PPA, it is more effective to apply net metering to those consumers who use more than 400 kWh monthly. Since consumers with low monthly power consumption are not greatly affected by the electricity rate progression system, when selecting a power purchase agreement for utilization of solar power, PPA trading benefits are higher than electricity cost savings provided by net metering. On the other hand, since consumers with high monthly power consumption are greatly affected by the electricity rate progression system, electricity cost savings provided by net metering are higher than PPA trading benefits. Therefore, it was verified that net metering is more advantageous than PPA when considering the power consumption and solar power generation amount calculated based on the residential planning proposed in this research. For all of this, in the case study, a concrete economic analysis was performed for net-metering-applied solar power generation capacity.
4. Results and Discussion
4.1. Results of the Selection of a Suitable Place for Solar Power Generation
The results of the analysis of the indicators of the exclusion conditions revealed that, in the national environmental zoning map, Rank 1 and Rank 2 exclusion regions have areas of 440 km2 and 180 km2, respectively, accounting for 60% of Daegu’s total area (about 883.48 km2). In particular, when compared between boroughs, exclusion regions were the most frequent in Dalseong county. In the ecological zoning map, Palgongsan Mountain, Biseulsan Mountain, and the mountain area of Hwawon Recreational Forest are classified as Rank 1, and separate management areas were identified as exclusion zones.
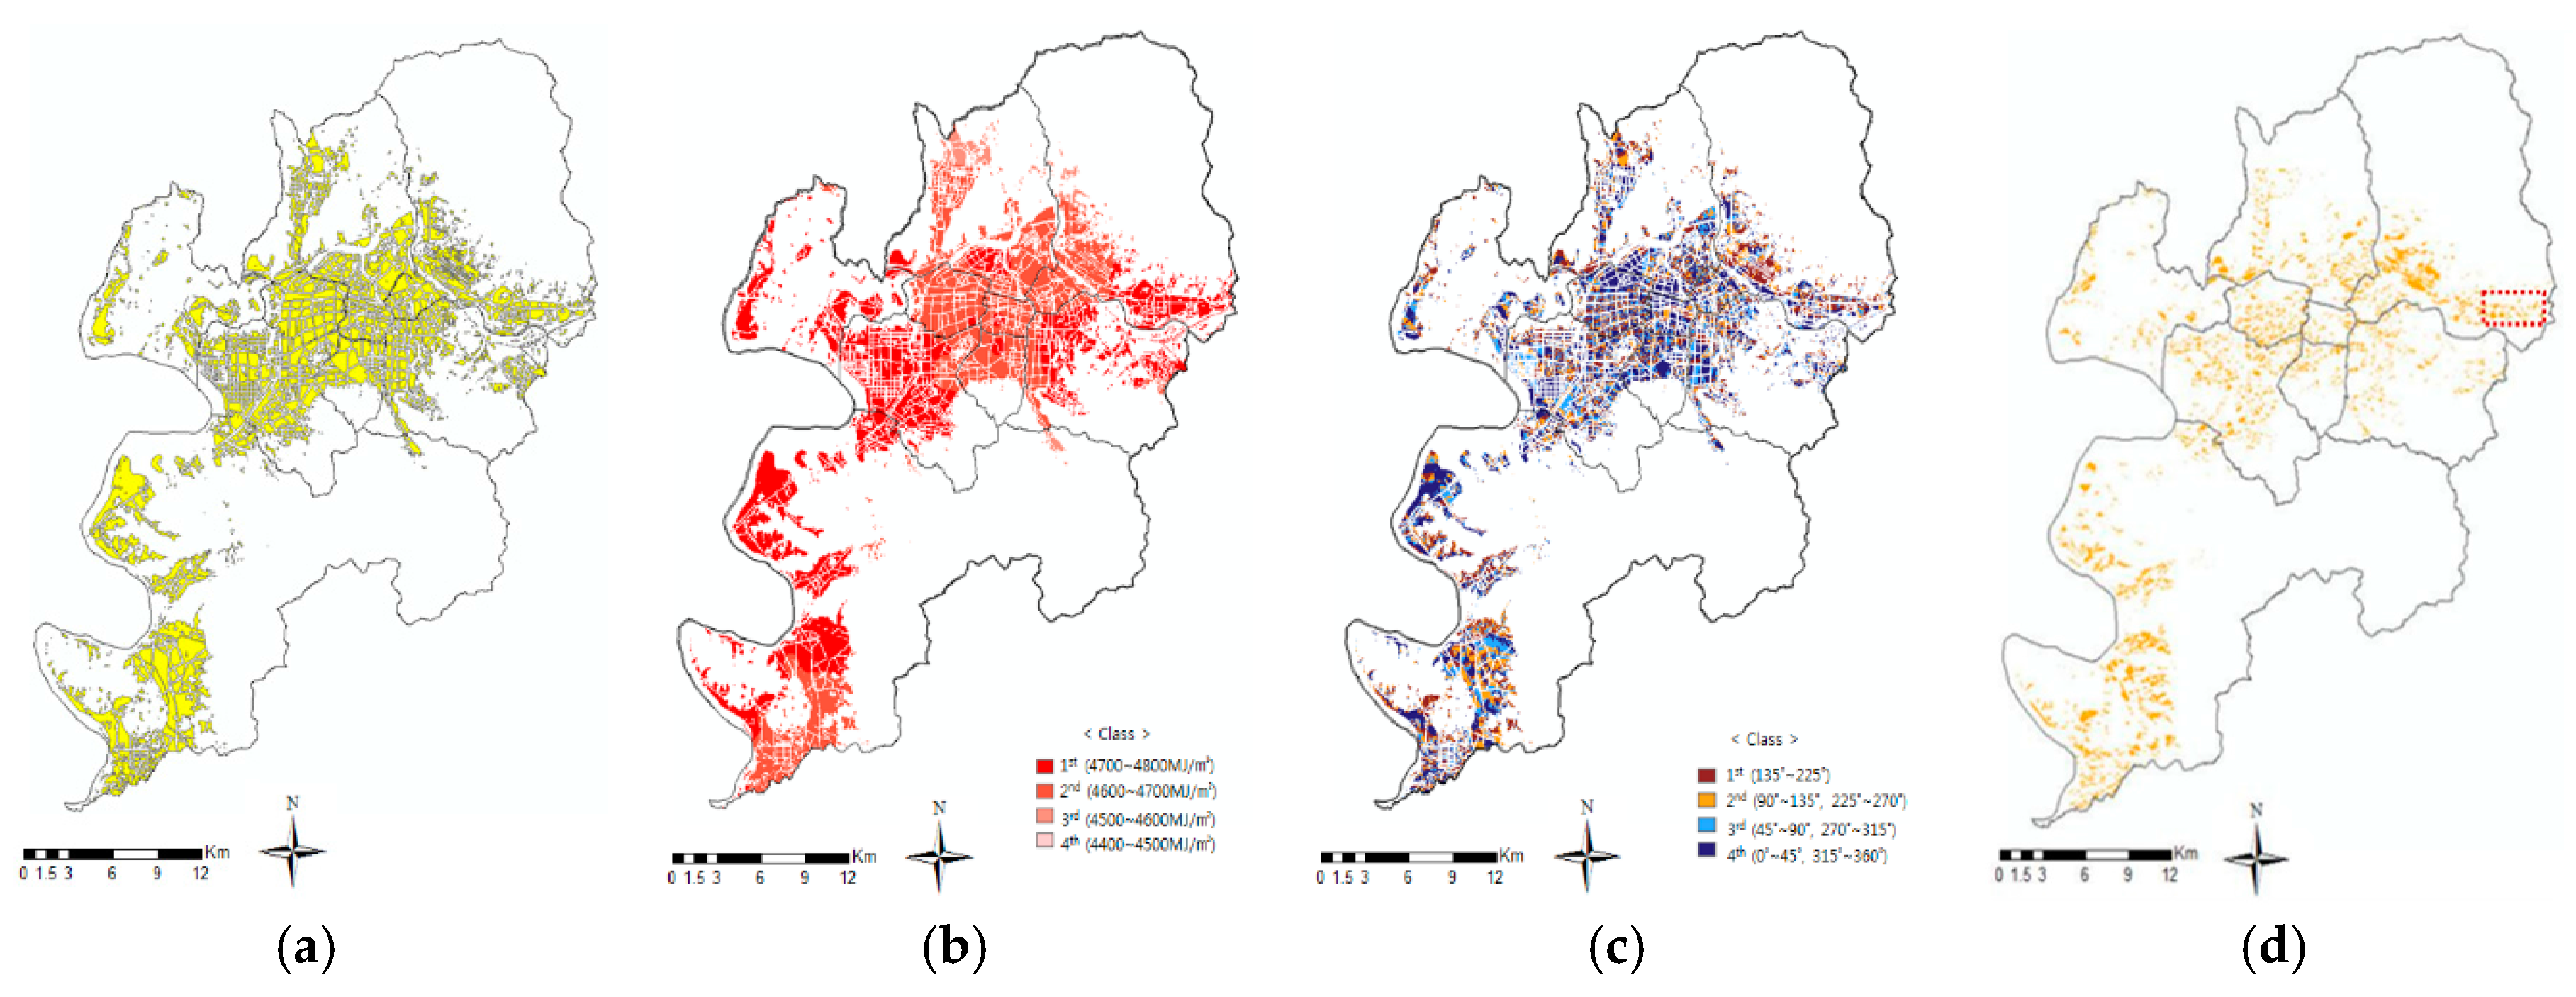
Figure 12 shows the primary suitable sites by overlapping exclusion conditions and location conditions, the solar irradiance grade map, and the slope direction; the final map showing appropriate spots for solar energy was developed by overlaying those three.
As result, Daegu’s eastern side (Dong-gu) and western side (Dalseo-gu and Dalseong-gun) were identified as relatively appropriate places for sunlight utilization. In particular, in the eastern regions—where SinSeo Innovative City (in which national public institutions will be settled) is being built—the construction of residential and business complexes that seek energy efficiency (e.g., solar towns) are being planned based on recent international trends.
4.2. Design of Buildings for Sunlight Utilization
4.2.1. Site Plan Drawing
The site selected in this research is a region with a private housing plan inside the SinSeo Innovative City in Daegu. This site is mainly divided into Zones A and B (Figure 13). Each parcel of the site follows district unit planning regulations, and the nature of the allowed buildings is residential. The height of buildings is up to three floors in Zone A and at least two floors in Zone B. The average size of parcels is 300 m².
4.2.2. District Unit Planning of the Site by Zone (A and B)
Residential buildings to be built on each parcel of Zones A and B follow district unit planning regulations regarding the purpose of use, coverage ratio, floor area ratio, height of buildings, number of households, and number of inhabitants. Table 4 shows the district unit planning by zone.
4.2.3. Building Design
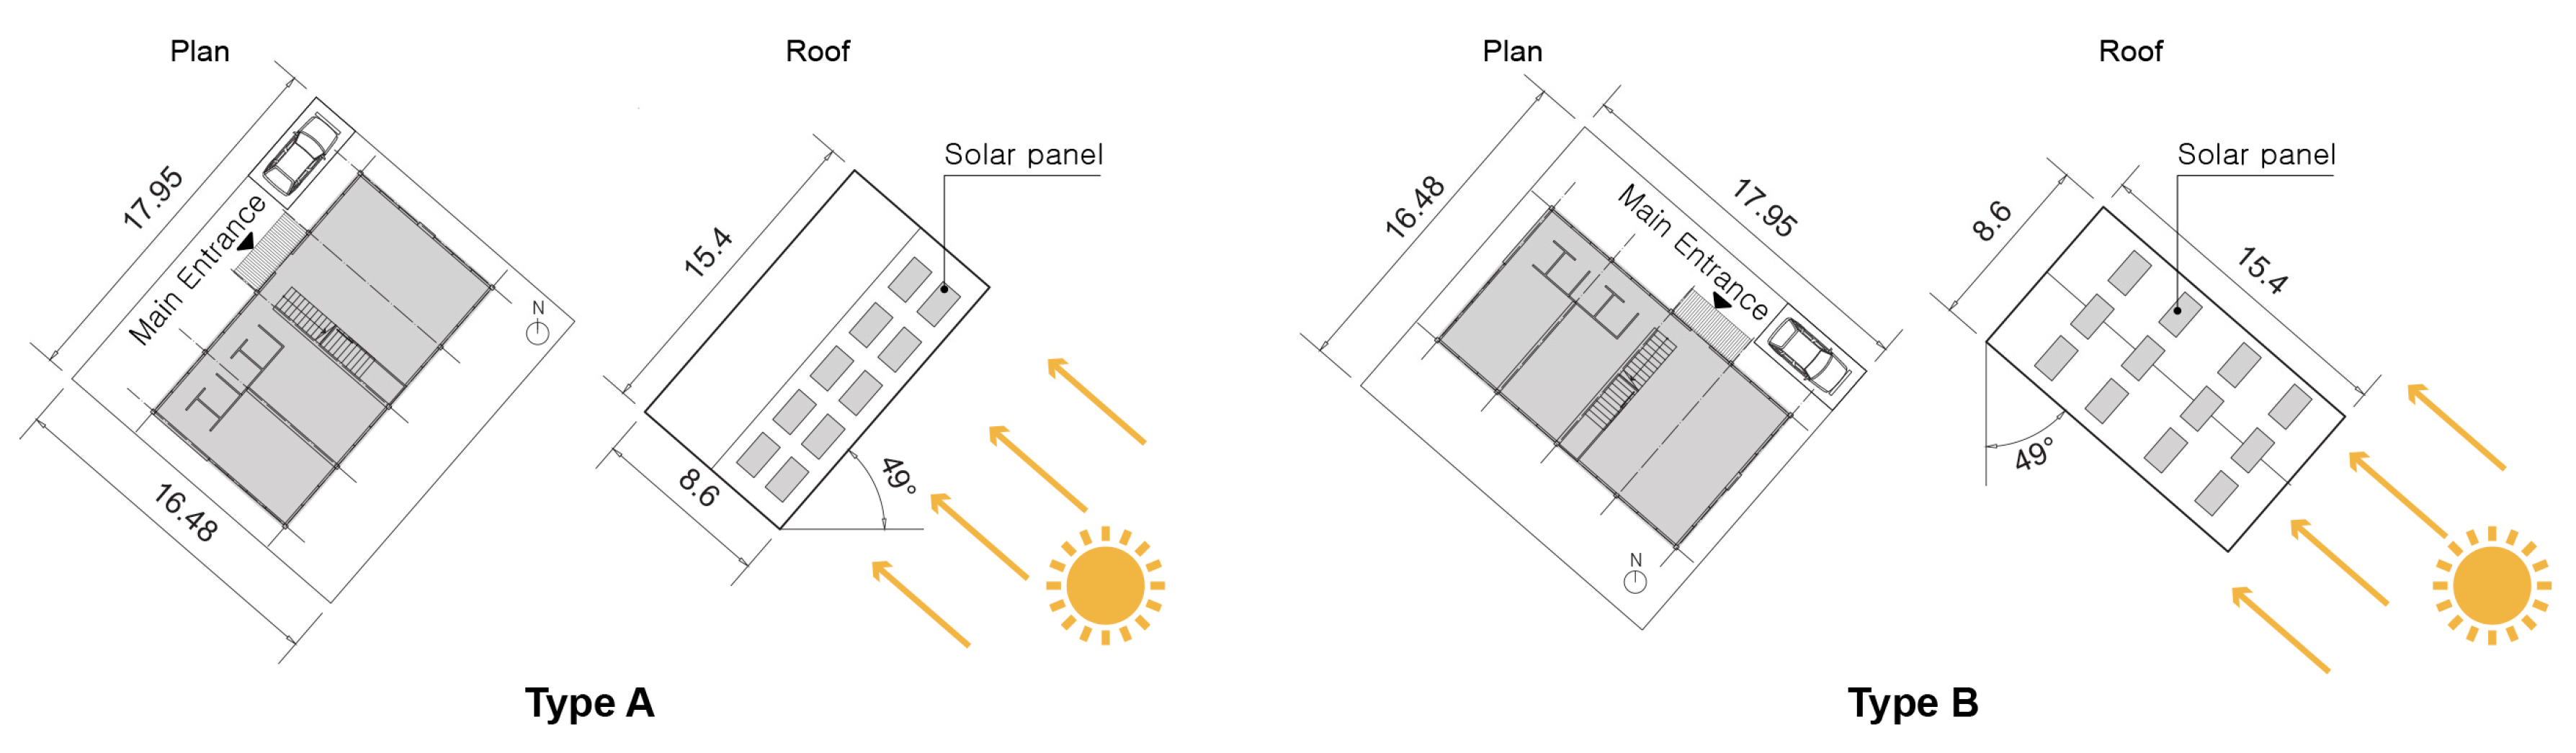
The total number of parcels in Zones A and B is 114. The size of each parcel is the same, but the front part of each parcel can be divided into two types, which are the southeast and the southwest. For the purpose of this study, we designed two types of residential buildings: Type A, which looks to the southeastern side of the parcel, and Type B, which overlooks the southwest side of the parcel. In terms of building layout planning, the frontal part of buildings to be constructed on each parcel of Zones A and B is located southeastward and southwestward, satisfying the fundamental building design by allowing the maximum amount of light to enter the building. The main purpose of residential buildings to be built on each parcel of Zones A and B is to increase the building’s energy self-efficiency using renewable energy. To ensure the renewable energy of residential buildings to be built on the site, sunlight is used as renewable energy source. To this end, solar panels are installed on the roofs of the buildings. To maximize the efficiency of the solar panels, building design is performed based mainly on the overall form of the buildings and the shape of the roofs. The overall form of the buildings is rectangular to allow the maximum amount of sunlight to reach the solar panels located on the roof, after placing the frontal part of the building southeastward. Rectangular buildings are placed on the middle of each parcel, avoiding shadow interference with buildings to be built on surrounding parcels (Figure 14).
Roofs are designed sloped in principle. The reasons for this is that, first, one side of the sloped roof faces southward to allow the maximum amount of direct sunlight to reach the solar panels; and, second, when the mean height of the highest floor of a building with a sloped roof is 1.8 m, it is provided as a free space that does not deviate from architectural regulations. Moreover, since solar panels in sloped roofs are exposed to the field of vision of external pedestrians, they can promote eco-friendly homes (Figure 15).
Array spacing calculation in solar power generation design is a main factor that should be considered to prevent solar power generation drops. The Korea Environment Corporation (Incheon, Korea) has established photovoltaic design/installation guidelines considering design factors that affect photovoltaic power generation outputs. The proper array spacing according to PV installation angles is determined by Equation (5). Since an increasing array spacing decreases the number of output drops caused by shadows, but also reduces the installable capacity in limited spaces, it is important to install sunlight arrays with the minimum spacing [37].
where, , , and represent solar array length, latitude of the installation place, and the installation angle of solar panels, respectively.
As mentioned in Section 3.3, the optimum installation angle of solar panels in Zones A and B is 15° based on the maximum solar power generation amount and 25° based on the maximum power generation time.
4.3. Results of the Analysis of Cases of Buildings Utilizing Solar Power
The power trading type in Zones A and B is set as net metering. Surplus power remaining after use can be carried over, but surplus power remaining after power trading cannot be sold. In the case studies, for more precision, economic assessment was performed, including meter installation and the bidirectional meter exchange charges required when trading power. Case 1 simulates a situation where the maximum solar power generation facility capacity is connected after installing solar panels at 15° (based on maximum facility capacity) on the rooftop of a building. Case 2 simulates a situation where the maximum solar power generation facility capacity is connected according to the installation of solar panels with an angle of 25° (based on maximum generation time) on the sloped roof of a building. Cases 3 and 4 simulate the connection of the solar power generation facility capacity in terms of zero energy at 25° on a sloped roof, and the connection of a subsidizable solar power generation facility capacity (less than 3 kW in Korea), respectively. Before performing the case studies, polycrystalline silicon solar panel model HSL60P-6-265 was used, and the power generated through these solar panels was converted with inverters for AC energy supply to houses. At this time, the inverter’s efficiency was 97.1%.
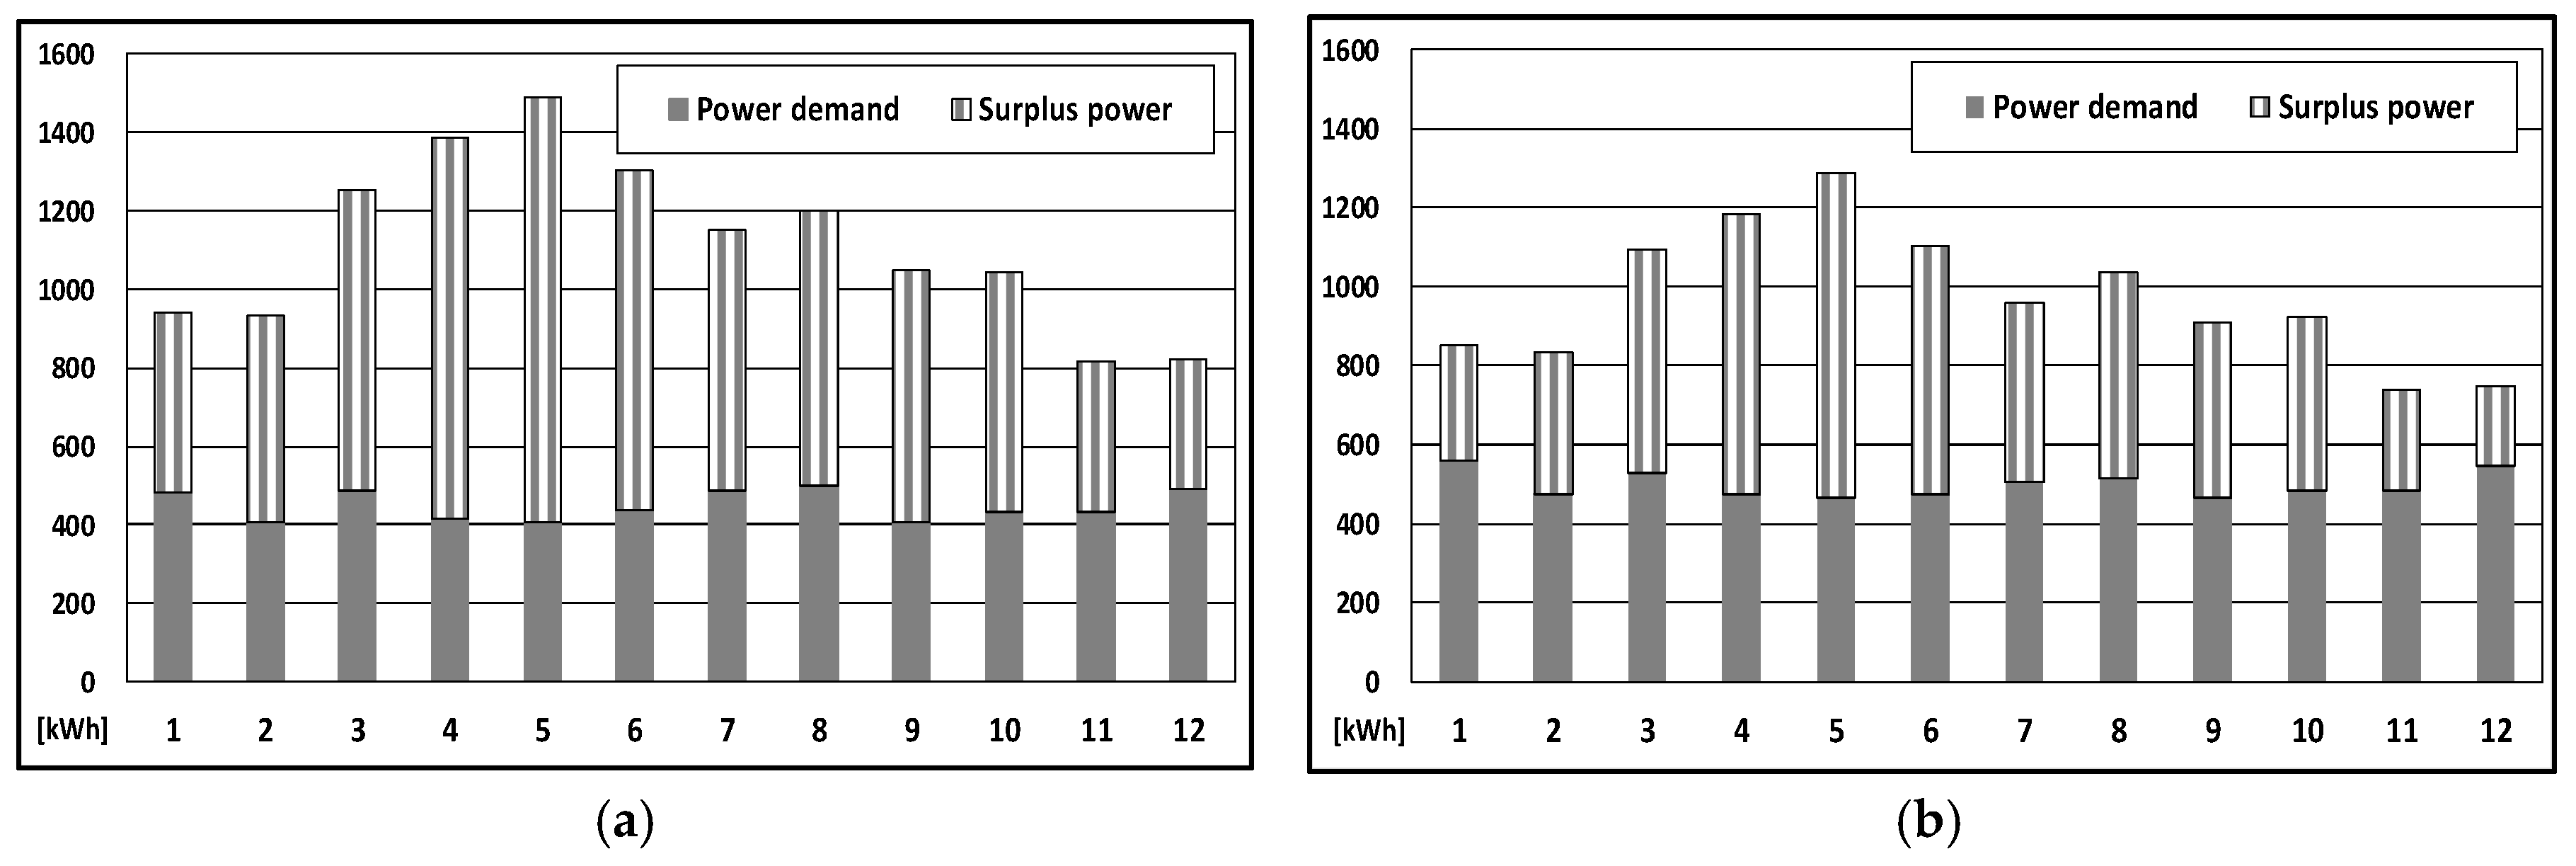
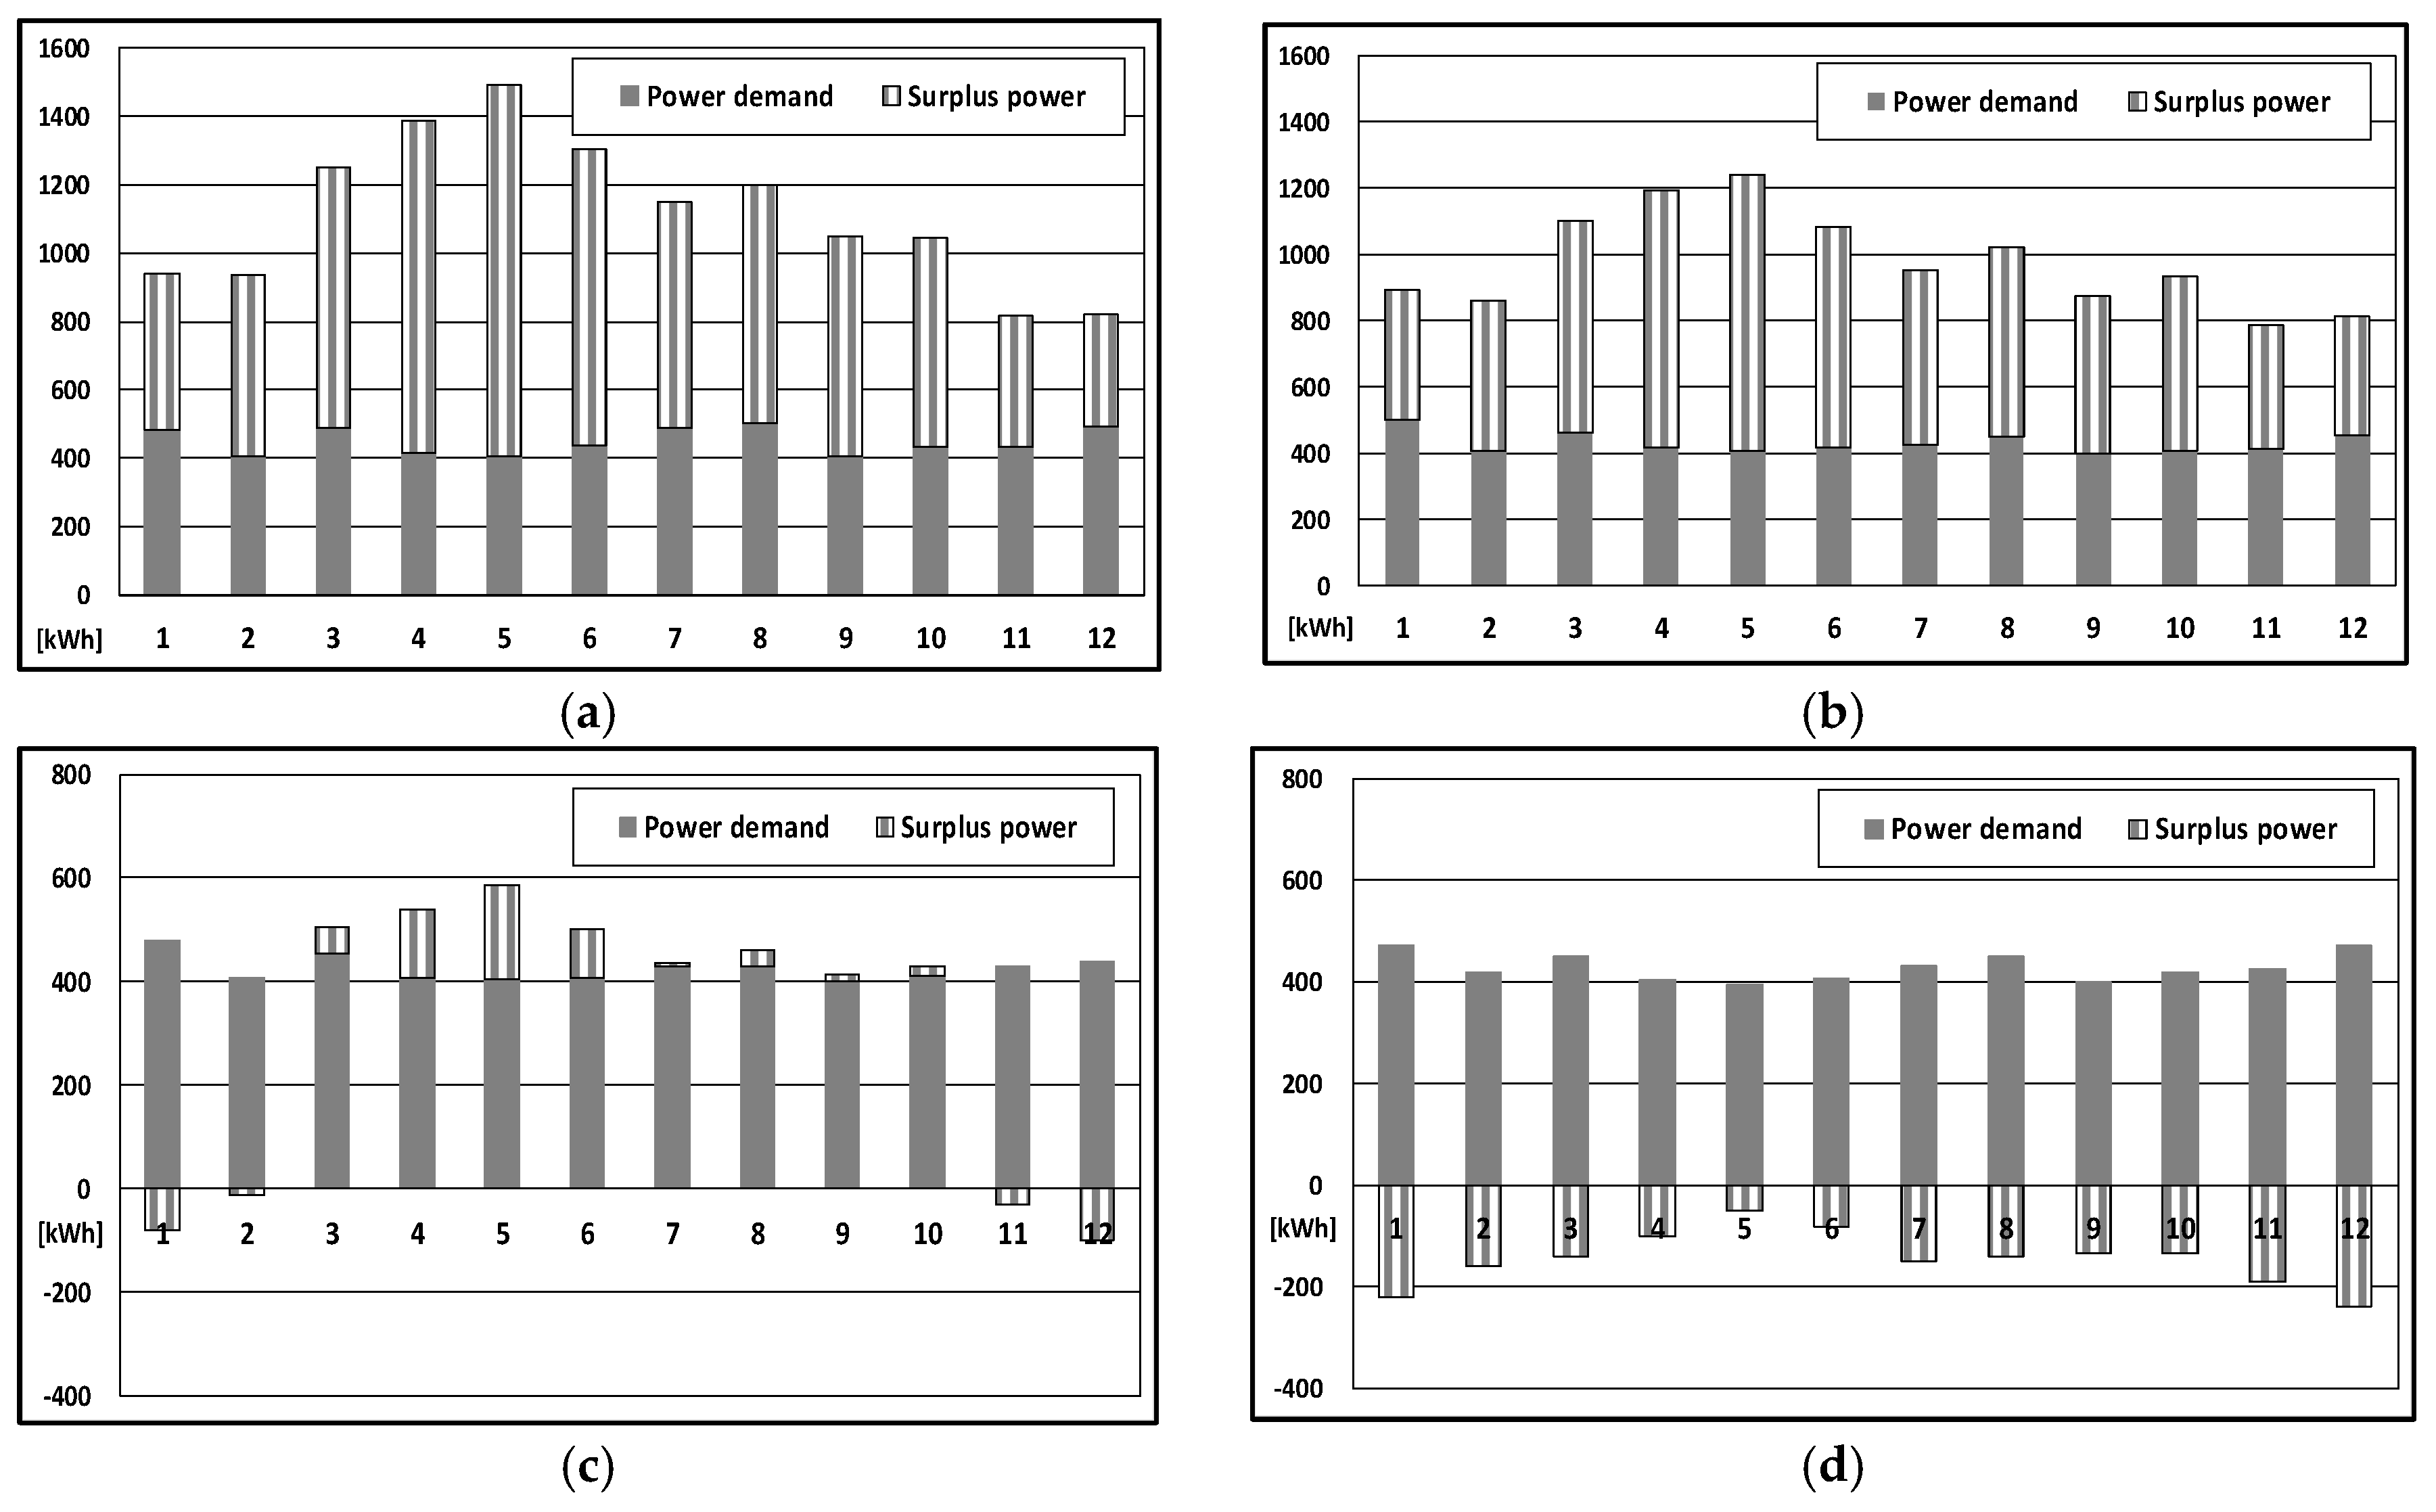
Power consumption was calculated based on design planning with building size and number of inhabitants per household using KPX’s data. The annual power consumption of Zones A and B was calculated, as shown in Table 5. As shown in Figure 16 and Figure 17, when the surplus power value is positive—because the solar panel power generation is satisfying the power consumption amount—surplus power is generated. On the contrary, when this value is negative, insufficient power is generated.
Table 5 shows the economic analysis and energy use of each case in Zones A and B. Here, it is assumed that annual operation and maintenance costs are 1% of PV installation costs.
In Cases 1 and 2, an annual power generation of at least two times the annual power consumption occurs. Since surplus power generated after self-consumption exceeds the power consumption, net metering benefits are electricity savings with no additional benefits. Meanwhile, in Case 3, the right installation capacity was selected considering the annual power consumption. Based on the results of Cases 1 and 2, power consumption after self-consumption decreases. In Cases 1–3, power is provided through solar panels, and the final power consumption reaches “0”. This is a case consistent with the zero-energy perspective, and solar panel operation benefits by net metering are the same. Since solar panel installation capacities in each case are different, it can be verified that, from the zero-energy perspective, operating solar panels with same right installation capacity of Case 3 is the most economical operation plan. In Cases 1–3, if the solar panel installation capacity exceeds the subsidizable range, the user covers all the initial capital costs, which makes it difficult to maximize economic benefits. Thus, as shown in Table 5, although Case 4 is unable to satisfy power consumption requirements through the power generation amount of solar panels, it has a subsidizable installation capacity, which mitigates initial capital costs. Case 4 can be selected as a plan to maximize the operational benefits of solar panels. Through the study of these cases, an optimum installation capacity for solar panels was proposed according to different operational perspectives. From the zero-energy perspective, Case 2 is the most recommendable, while, from the economic benefit perspective, Case 4 is the most recommendable.
5. Conclusions
In this research, an energy-independent residential complex was presented through the production of renewable energy, optimized for a specific area in Daegu Metropolitan City, Korea. Unlike other Korean cities, in Daegu, the degree of dependence on primary energy, which is the main cause of environmental pollution, is very high, especially in the residential and commercial sectors, which had the highest energy consumption. Since the residential and commercial sectors have higher energy consumption than other cities, if primary energy, which is the type of energy mainly supplied to these sectors, is replaced by eco-friendly renewable energy, the ripple effect would be very large in environmental terms. Moreover, the fact that the degree of dependence on nuclear energy—which is the energy source most used by the residential and commercial sectors—accounts for 66.4% of the total power supply suggests Daegu’s need to develop eco-friendly renewable energy supply sources in the future. Based on this analysis, to perform a concrete analysis of the consumption and production of the energy consumed in a specific area, and maximize the production of renewable energy using solar energy suitable for the corresponding local characteristics, optimum solar energy locations inside Daegu were drawn. As result, an architectural design model was developed to maximize solar energy use in the buildings of SinSeo Innovative City, which is the optimum location drawn. In the building design, factors such as building form, roof shape, and position were considered to increase the energy self-sufficiency of the building. As result, rectangular buildings with their frontal parts facing southeastward were placed in the center of each parcel, avoiding shadow interference. Roofs of buildings can be categorized into flat roofs and sloped roofs. On flat roofs, the maximum solar power generation capacity is obtained when solar panels are installed with angles of 15°. Meanwhile, at the site of this research, the optimum solar power generation efficiency is obtained when solar panels are installed with angles of 25°. Therefore, in this research, the sloped roof angle was set to 25° considering building regulations and the solar power generation characteristics of the site, and the average height of the internal space of the highest floor was designed to be 1.8 m. Based on this architectural model, an analysis was performed from the perspectives of energy self-sufficiency improvement and economics, and divided into three types: (1) one that allows maximum solar power generation capacity in connection with solar panel structures; (2) one for reaching zero energy; and (3) one that allows solar panel installation subsidization. As result, it was verified that, even from the economic point of view, connecting the solar power generation capacity from the zero-energy perspective considering the consumer’s power consumption amount is more effective than connecting the maximum solar power generation capacity according to the building structure. Furthermore, when considering only the economic aspects, it was verified that selecting a subsidizable solar power generation capacity according to the residential solar power facility connection is a method through which operational benefits can be maximized.
In this research, an architectural design plan for eco-friendly residential complexes was presented, applying solar energy as the power generation source that is closest to grid parity. In the future, research on architectural types using various renewable energy sources such as wind energy and energy storage devices is required. Research on real-time power demand in buildings and optimum operational strategies considering various energy sources must be performed as well. Finally, the validation of this simulation study will be conducted using a sample house in the SinSeo Innovative City through cooperation with Daegu Metropolitan City.
Acknowledgments
This research was supported by the Keimyung University Research Grant of 2015.
Author Contributions
Sung-Yul Kim, Jeong-Hee Eum and Ho-Soon Choi reviewed the theory and developed the analytical framework. Sung-Yul Kim had the original idea for this study. Jeong-Hee Eum drew the analysis figure and completed the literature. Ho-Soon Choi reviewed the theory and developed the analytical framework. All authors contributed to data collection and methodology.
Conflicts of Interest
The authors declare no conflict of interest.
References
- Xie, H.; Zheng, S.; Ni, M. Microgrid development in China: A method for renewable energy and energy storage capacity configuration in a megawatt-level isolated microgrid. IEEE Electrification Mag. 2017, 5, 28–35. [Google Scholar] [CrossRef]
- Shah, K.K.; Mundada, A.S.; Pearce, J.M. Perfomance of U.S hybrid distributed energy systems: Solar photovoltaic, battery and combined heat and power. Energy Convers. Manag. 2015, 105, 71–80. [Google Scholar] [CrossRef]
- Pérez-Lombard, L.; Ortiz, J.; Pout, C. A review on buildings energy consumption information. Energy Build. 2008, 40, 394–398. [Google Scholar] [CrossRef]
- Cruz-Lovera, C.; Perea-Moreno, A.-J.; Cruz-Fernández, J.-L.; Alvarez-Bermejo, J.A.; Manzano-Agugliaro, F. Worldwide Research on Energy Efficiency and Sustainability in Public Buildings. Sustainability 2017, 9, 1294. [Google Scholar] [CrossRef]
- Prieto, P.A.; Hall, C.A.S. Spain’s Photovoltaic Revolution; Springer: New York, NY, USA, 2013. [Google Scholar]
- Bernstein, H.M.; Russo, M.A. New and Remodeled Green Homes: Transforming the Residential Marketplace; McGraw Hill Construction Companies: New York, NY, USA, 2012; pp. 1–5. [Google Scholar]
- Woo, C.K.; Shiu, A.; Cheng, Y.S.; Li, R.; Ho, T.; Horowitz, I.; Wang, J. Residential Willingness-to-Pay for Reducing Coal-Fired Generation’s Emissions in Hong Kong. Electr. J. 2014, 27, 50–66. [Google Scholar] [CrossRef]
- Vieria, F.M.; Moura, P.S.; de Almeida, A.T. Energy storage system for self-consumption of photovoltaic energy in residential zero energy building. Renew. Energy 2017, 103, 308–320. [Google Scholar] [CrossRef]
- Li, H.; Xu, W.; Yu, Z.; Wu, J.; Sun, Z. Application analyze of a ground source heat pumpe system in a nearly zero energy building in China. Energy 2017, 125, 140–151. [Google Scholar] [CrossRef]
- Ren, Z.; Grozev, G.; Higgins, A. Modelling impact of PV battery systems on energy consumption and bill savings of Australian houses under alternative tariff structures. Renew. Energy 2016, 89, 317–330. [Google Scholar] [CrossRef]
- Kim, H.; Jung, T.Y. Independent solar photovoltaic with Energy Storage Systems (ESS) for rural electrification in Myanmar. Renew. Sustain. Energy Rev. 2018, 82, 1187–1194. [Google Scholar] [CrossRef]
- Salata, F.; Golasi, I.; Domestico, U.; Banditelli, M.; Lo Basso, G.; Nastasi, B.; de LietoVollaro, A. Heading towards the nZEB through CHP + HP systems. A comparison between retrofit solutions able to increase the energy performance for the heating and domestic hot water production in residential buildings. Energy Convers. Manag. 2017, 138, 61–76. [Google Scholar] [CrossRef]
- Oliva, S. Residential energy efficiency and distributed generation—Natural partners or competition? Renew. Sustain. Energy Rev. 2017, 76, 932–940. [Google Scholar] [CrossRef]
- Mohammadnezami, M.H.; Ehyaei, M.A.; Rosen, M.A.; Ahmadi, M.H. Meeting the Electrical Energy Needs of a Residential Building with a Wind-Photovoltaic Hybrid System. Sustainability 2015, 7, 2554–2569. [Google Scholar] [CrossRef]
- Sharpea, T.; Proven, G. Crossflex: Concept and early development of a true building integrated wind turbine. Energy Build. 2010, 42, 2365–2375. [Google Scholar] [CrossRef]
- Peng, C.; Huang, Y.; Wu, Z. Building-integrated photovoltaics (BIPV) in architectural design in China. Energy Build. 2011, 43, 3592–3598. [Google Scholar] [CrossRef]
- Kabir, E.; Kumar, P.; Kumar, S.; Adelodun, A.A.; Kim, K.-H. Solar energy: Potential and future prospects. Renew. Sustain. Energy Rev. 2018, 82, 894–900. [Google Scholar] [CrossRef]
- Gupta, N.; Tiwari, G.N. Energy Matrices of Building Integrated Photovoltaic Thermal Systems: Case Study. J. Archit. Eng. 2017. [Google Scholar] [CrossRef]
- Kim, K.W.; Seo, Y.K.; Hong, W.H. A Study on the Economic Evaluation of Green Home Applied Photovoltaic System: Focused on Dalseung-Gun of Daegu City in South Korea. J. Archit. Inst. Korea. 2014, 30, 221–228. [Google Scholar] [CrossRef]
- Yoon, N.R. Prediction of Output Power for PV Module with Titled Angle and Structural Design. Mater’s Thesis, Graduate School of Konkuk University, Seoul, Korea, 2012. [Google Scholar]
- Na, J.G. Measures to Cope with the Adoption of New and Renewable Energy Supply System in Daegu; Daegu Gyeongbuk Development Institute: Daegu, Korea, 2011; pp. 67–70. Available online: http://www.dgi.re.kr/Report/Detail?cd=1120000&rCd=RP072001&seq=-1&rSeq=2011120000119&page=9&pagesize=10 (accessed on 9 February 2018).
- Korea Energy Economics Institute. 2016 Regional Energy Statistics; Korea Energy Economics Institute: Ulsan, Korea, 2016; pp. 201–215. [Google Scholar]
- Daegu Metropolitan City. Masterplan of the Solar City for Daegu Metropolitan City; Daegu Metropolitan City: Daegu, Korea, 2009; Volume 6. Available online: http://naretis.energy.or.kr/AttachFile/nNotice/201103/N257/20110303112025232.pdf (accessed on 9 February 2018).
- National Statistical Information Service. 2018. Available online: http://kosis.kr/statisticsList/statisticsListIndex.do?menuId=M_01_01&vwcd+MT_ZTITLE&parmTabId+M_0101 (accessed on 9 February 2018).
- Korea Energy Agency. 2008 New & Renewable Energy White Paper; Korea Energy Agency: Gyeonggi, Korea, 2009; pp. 137–159. Available online: http://17greengrowth.pa.go.kr/?p=8147 (accessed on 9 February 2018).
- Cha, J.; Ku, B. A study on the summer and winter load forecasting by using the characteristics of temperature changes in Korean power system. J. Int. Counc. Electr. Eng. 2014, 4, 293–296. [Google Scholar] [CrossRef]
- Korea Energy Agency. 2008 New & Renewable Energy White Paper; Korea Energy Agency: Gyeonggi, Korea, 2016; pp. 177–275. Available online: https://www.data.go.kr/dataset/15017224/fileData.do (accessed on 9 February 2018).
- Korea Energy Economics Institute. Study on P2P Power Trading Possibility in Korea; Korea Energy Economics Institute: Ulsan, Korea, 2015; pp. 31–57. [Google Scholar]
- Lee, J.Y.; Kang, I.J. A study of PV system facilities using geo-spatial information system. Korean Soc. Geospat. Inf. Syst. 2010, 18, 99–105. [Google Scholar]
- Park, J.I. A Study on the Suitability Analysis of New and Renewable Energy Power Plant Using Correlation Analysis and GIS. Ph.D. Thesis, University of Mokpo, Mokpo, Korea, 2011. [Google Scholar]
- Jang, S.D. A Site Selection for New and Renewable Energy Facility Using GIS in Incheon. Master’s Thesis, Department of Civil and Environmental Engineering, Graduate School of Incheon University, Incheon, Korea, 2010. [Google Scholar]
- Bergin, M.H.; Choroi, C.; Dixit, D.; Schauer, J.J.; Shindell, D.T. Large reductions in solar energy production due to dust and particulate air pollution. Environ. Sci. Technol. Lett. 2017, 4, 339–344. [Google Scholar] [CrossRef]
- Kwon, Y.H.; Kim, J.Y.; Lee, M.J. Environmental Considerations in the Siting of Solar and Wind Power Plants; Korea Environment Institute Policy Report; Korea Environment Institute: Sejong, Korea, 2008. [Google Scholar]
- Jang, H.D. A Study on the Techniques for Ecological Housing Complex. Master’s Thesis, Graduate School of Semyung University, Jecheon, Korea, 2006. [Google Scholar]
- Choi, D.J. Comparison Researches for Installation of the Module Angles and Array Spacing on Photovoltaic Power System. J. Korean Inst. Illum. Electr. Eng. 2009, 23, 162–168. [Google Scholar]
- Kim, H.J.; Cho, D.S.; Hong, W.H. The concept of Solar City and the Case Study of Implementation in Daegu City. J. Archit. Inst. Korea. 2001, 10, 985–988. [Google Scholar]
- Choi, H.K.; Choi, D.W.; Yoo, H.C.; Choi, S.G.; Kim, Y.K. A study on the photovoltaic array optimal arrangement considering power output. J. Korean Inst. Illum. Electr. Eng. 2009, 23, 96–105. [Google Scholar]
Figure 1.
Population density and total population of major cities in South Korea [24].
Figure 1.
Population density and total population of major cities in South Korea [24].

Figure 2.
Comparison of final energy consumption nationwide with that of Daegu [25].
Figure 2.
Comparison of final energy consumption nationwide with that of Daegu [25].
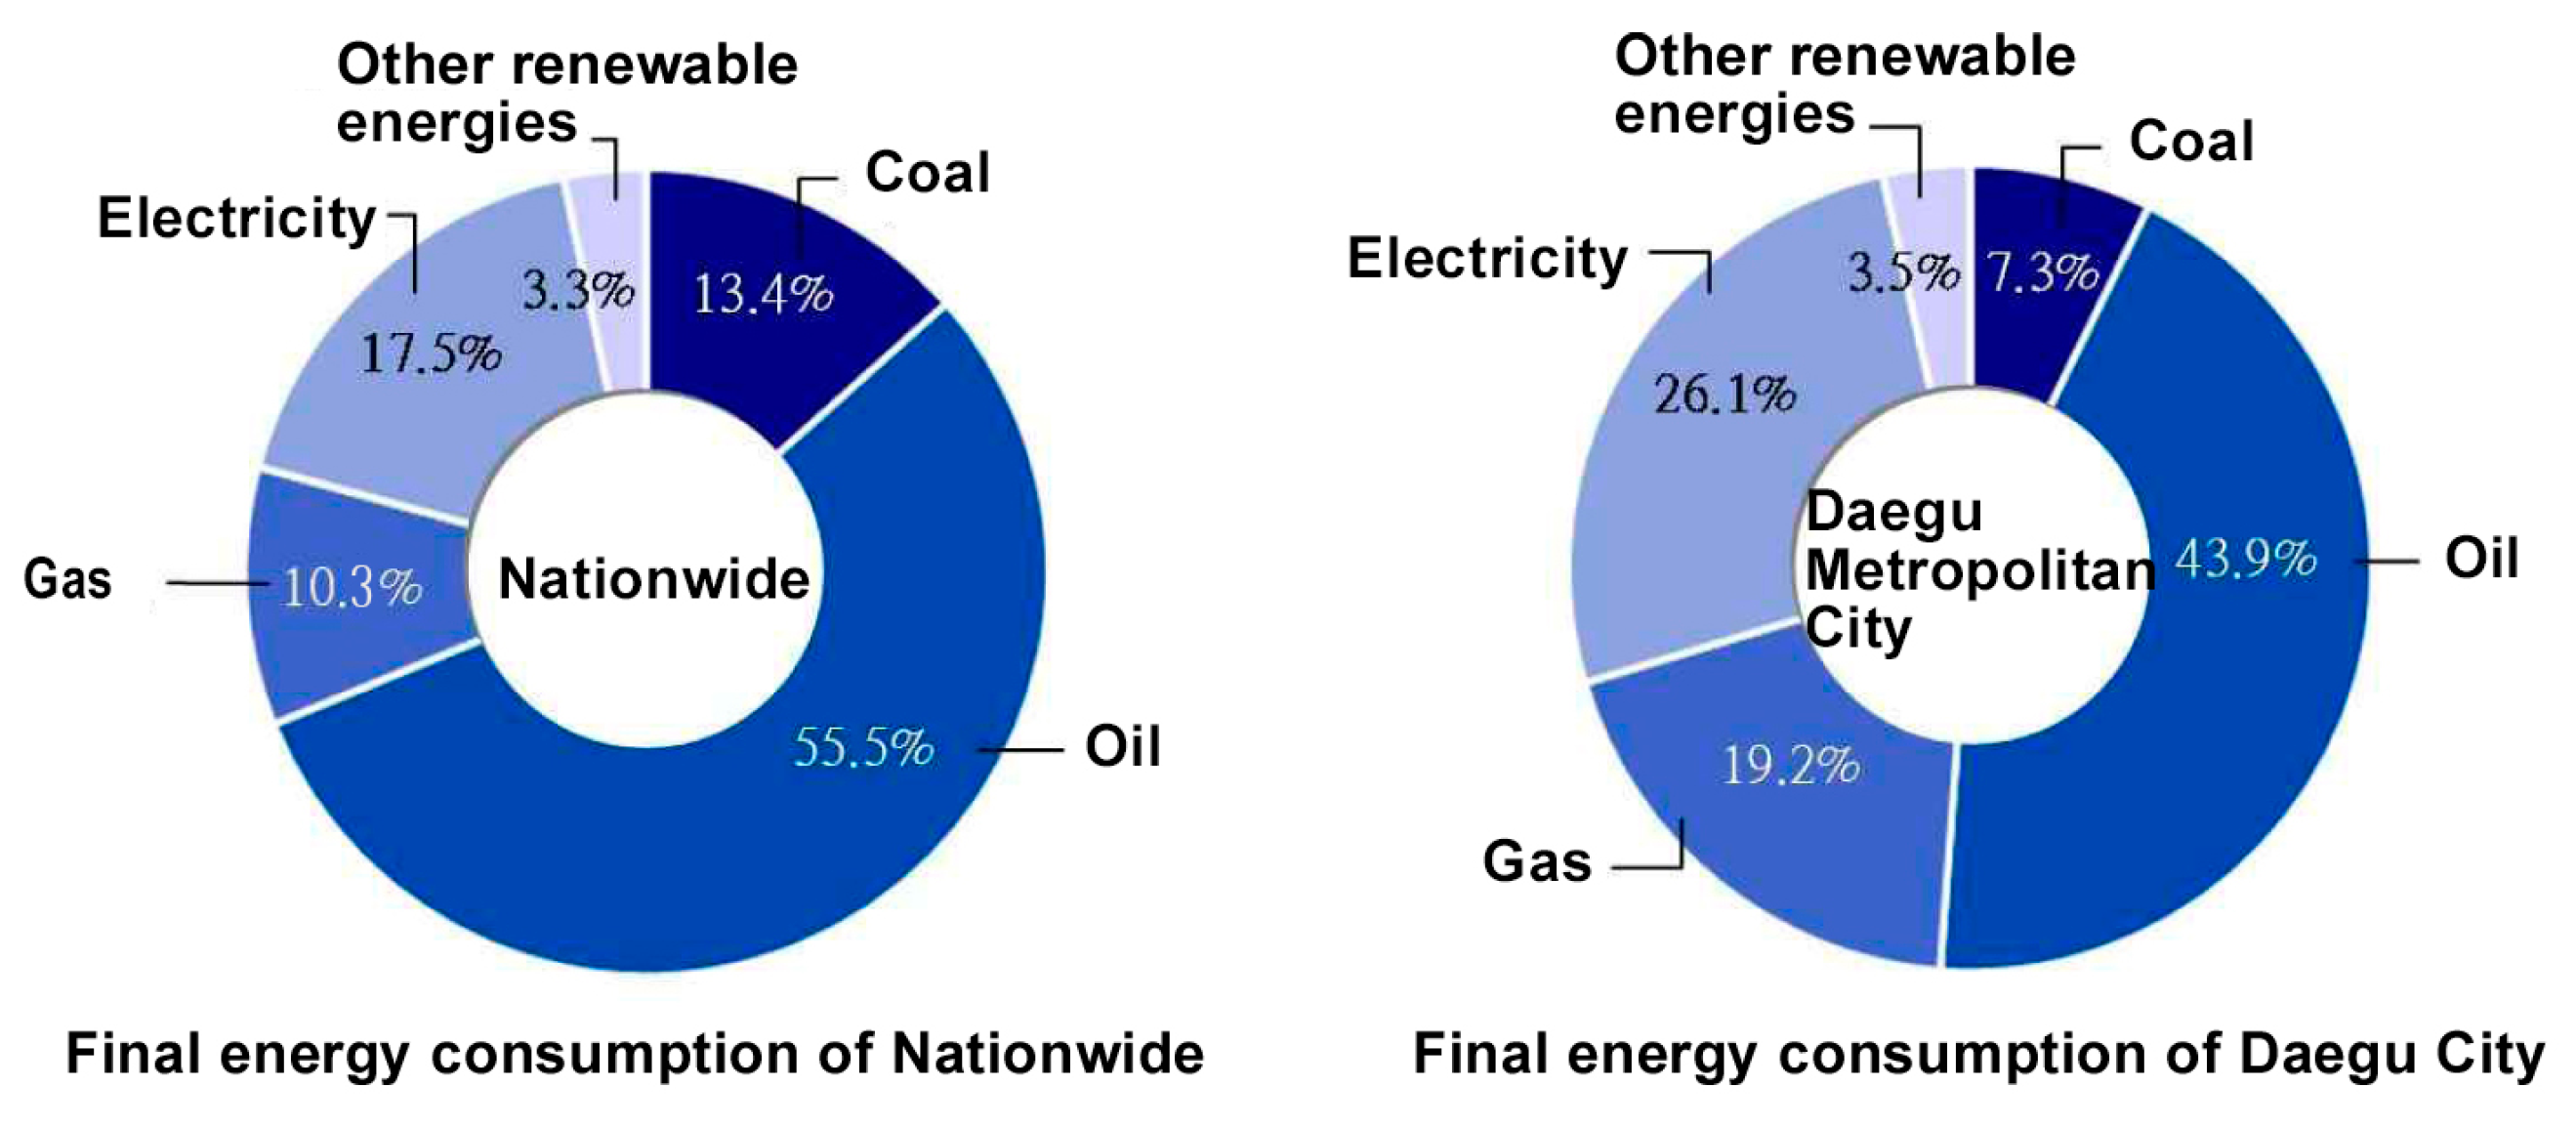
Figure 3.
Final energy consumption trend [25].
Figure 3.
Final energy consumption trend [25].
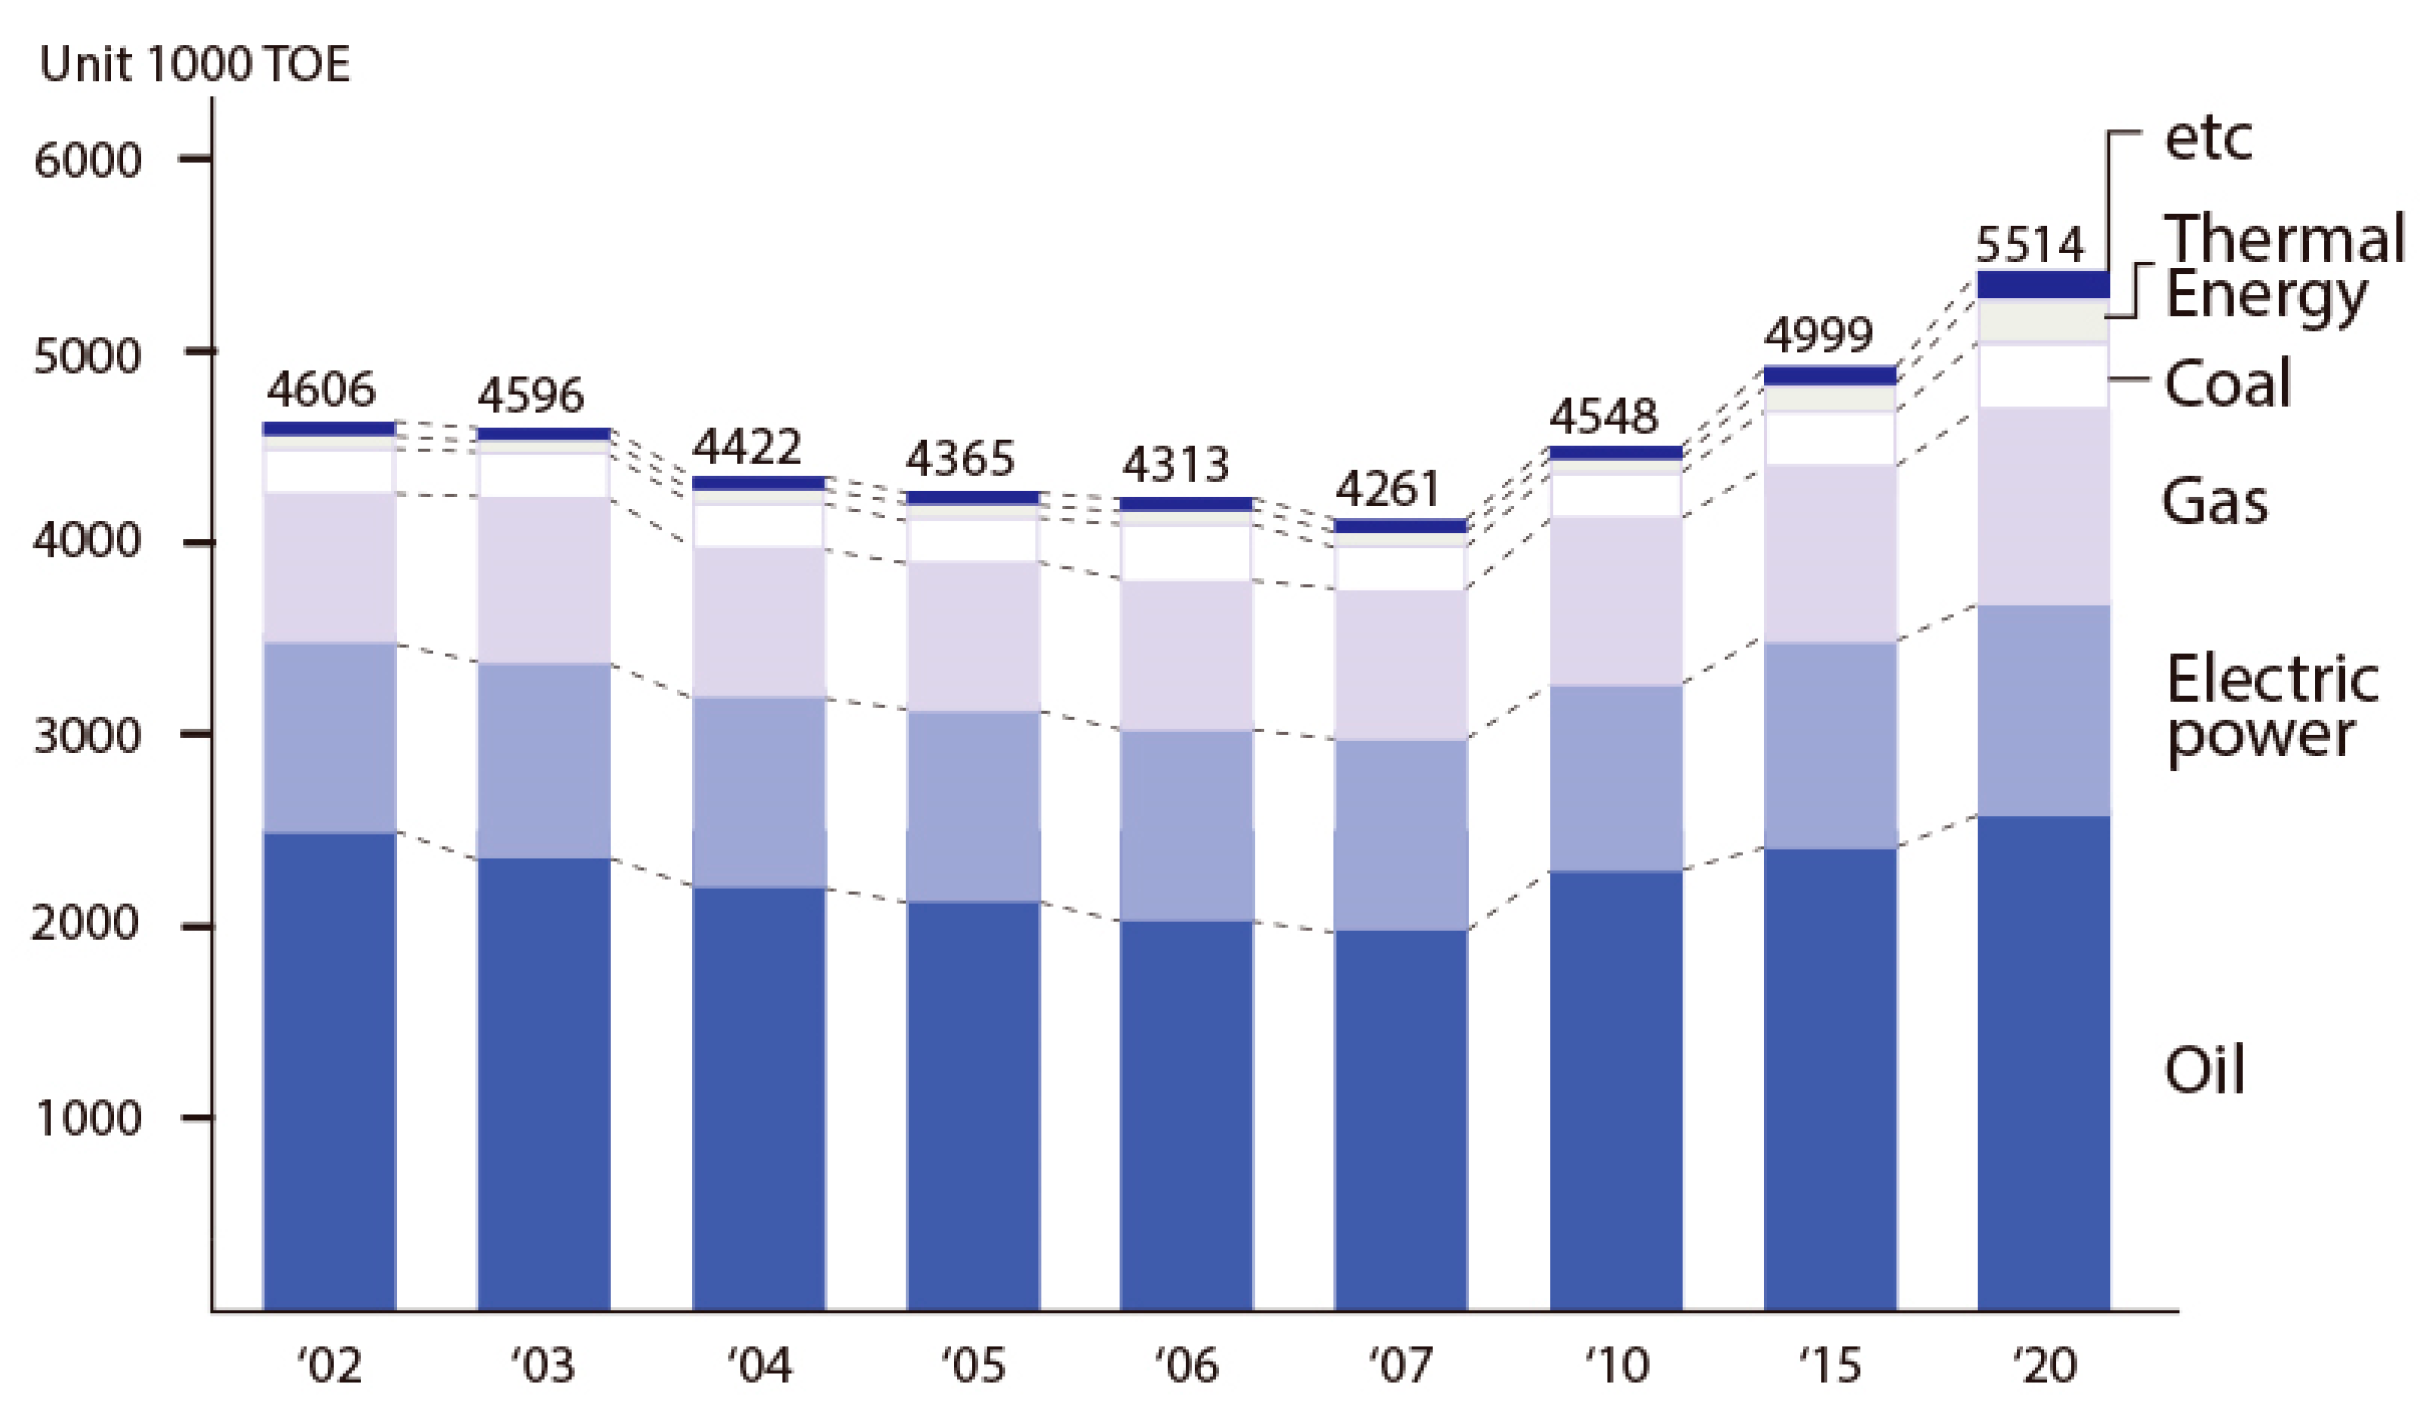
Figure 4.
Energy consumption ratio by sector [25].
Figure 4.
Energy consumption ratio by sector [25].
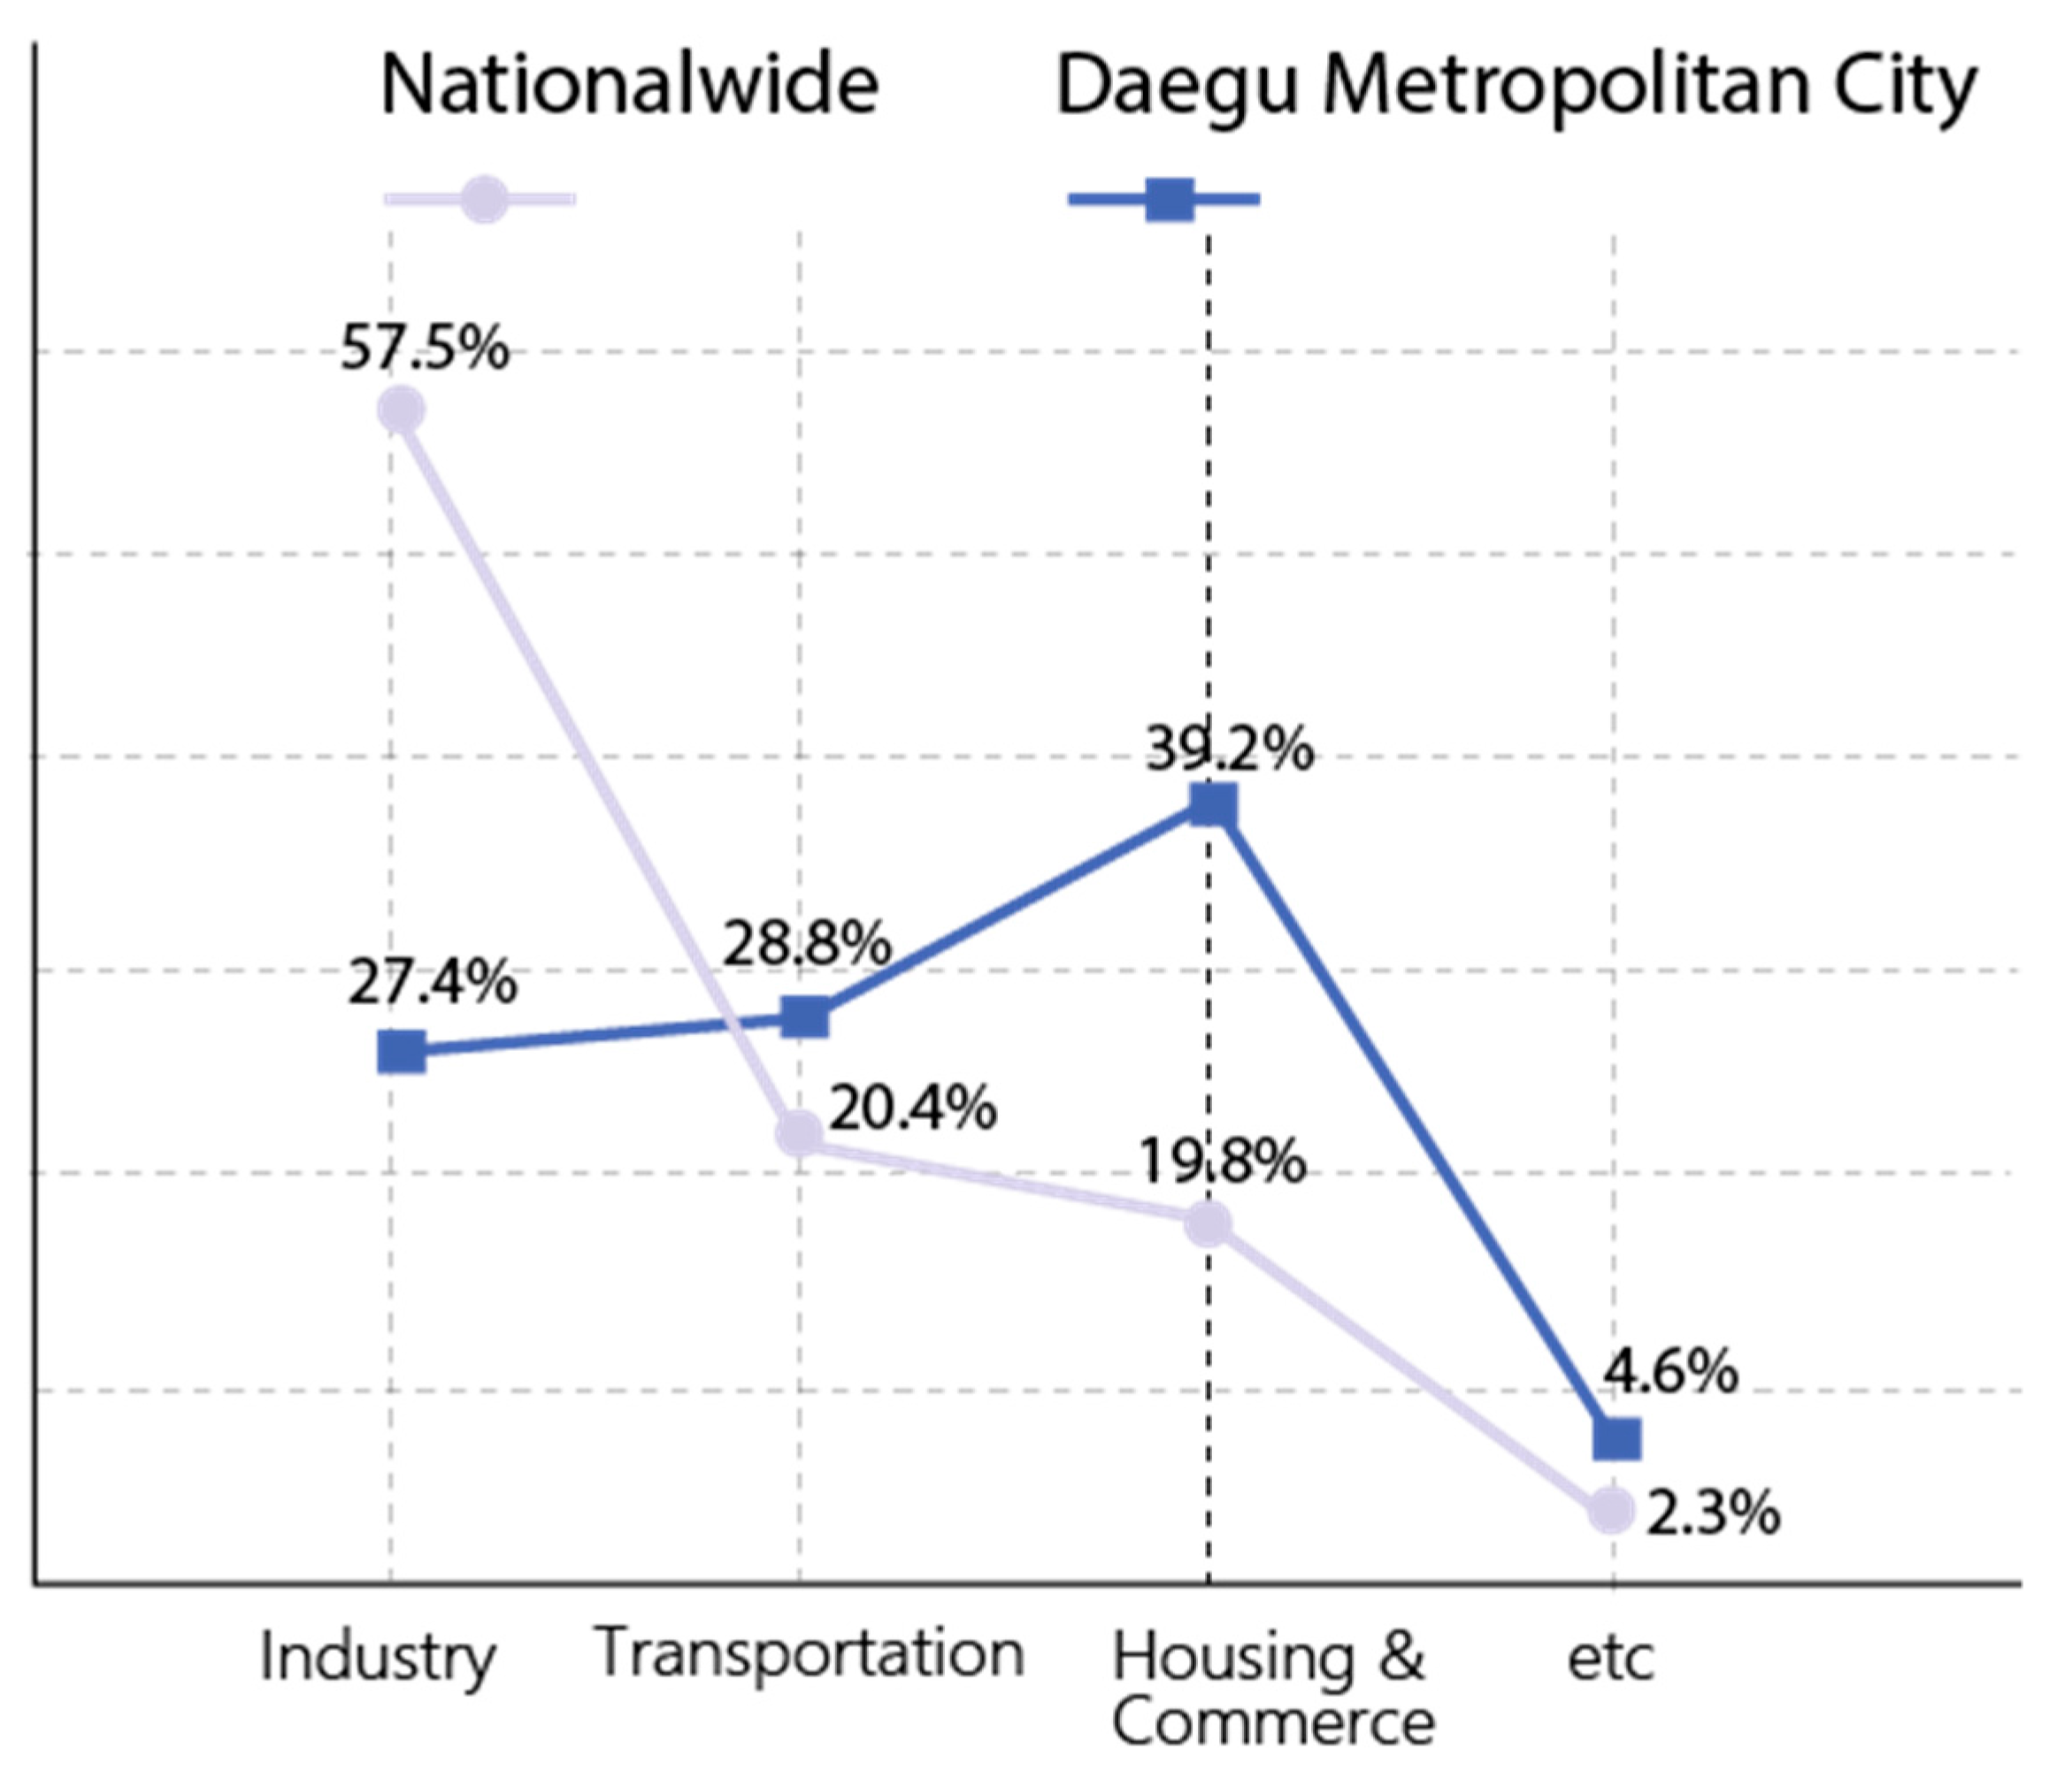
Figure 5.
Energy consumption of the housing and commerce sector in Daegu [25].
Figure 5.
Energy consumption of the housing and commerce sector in Daegu [25].
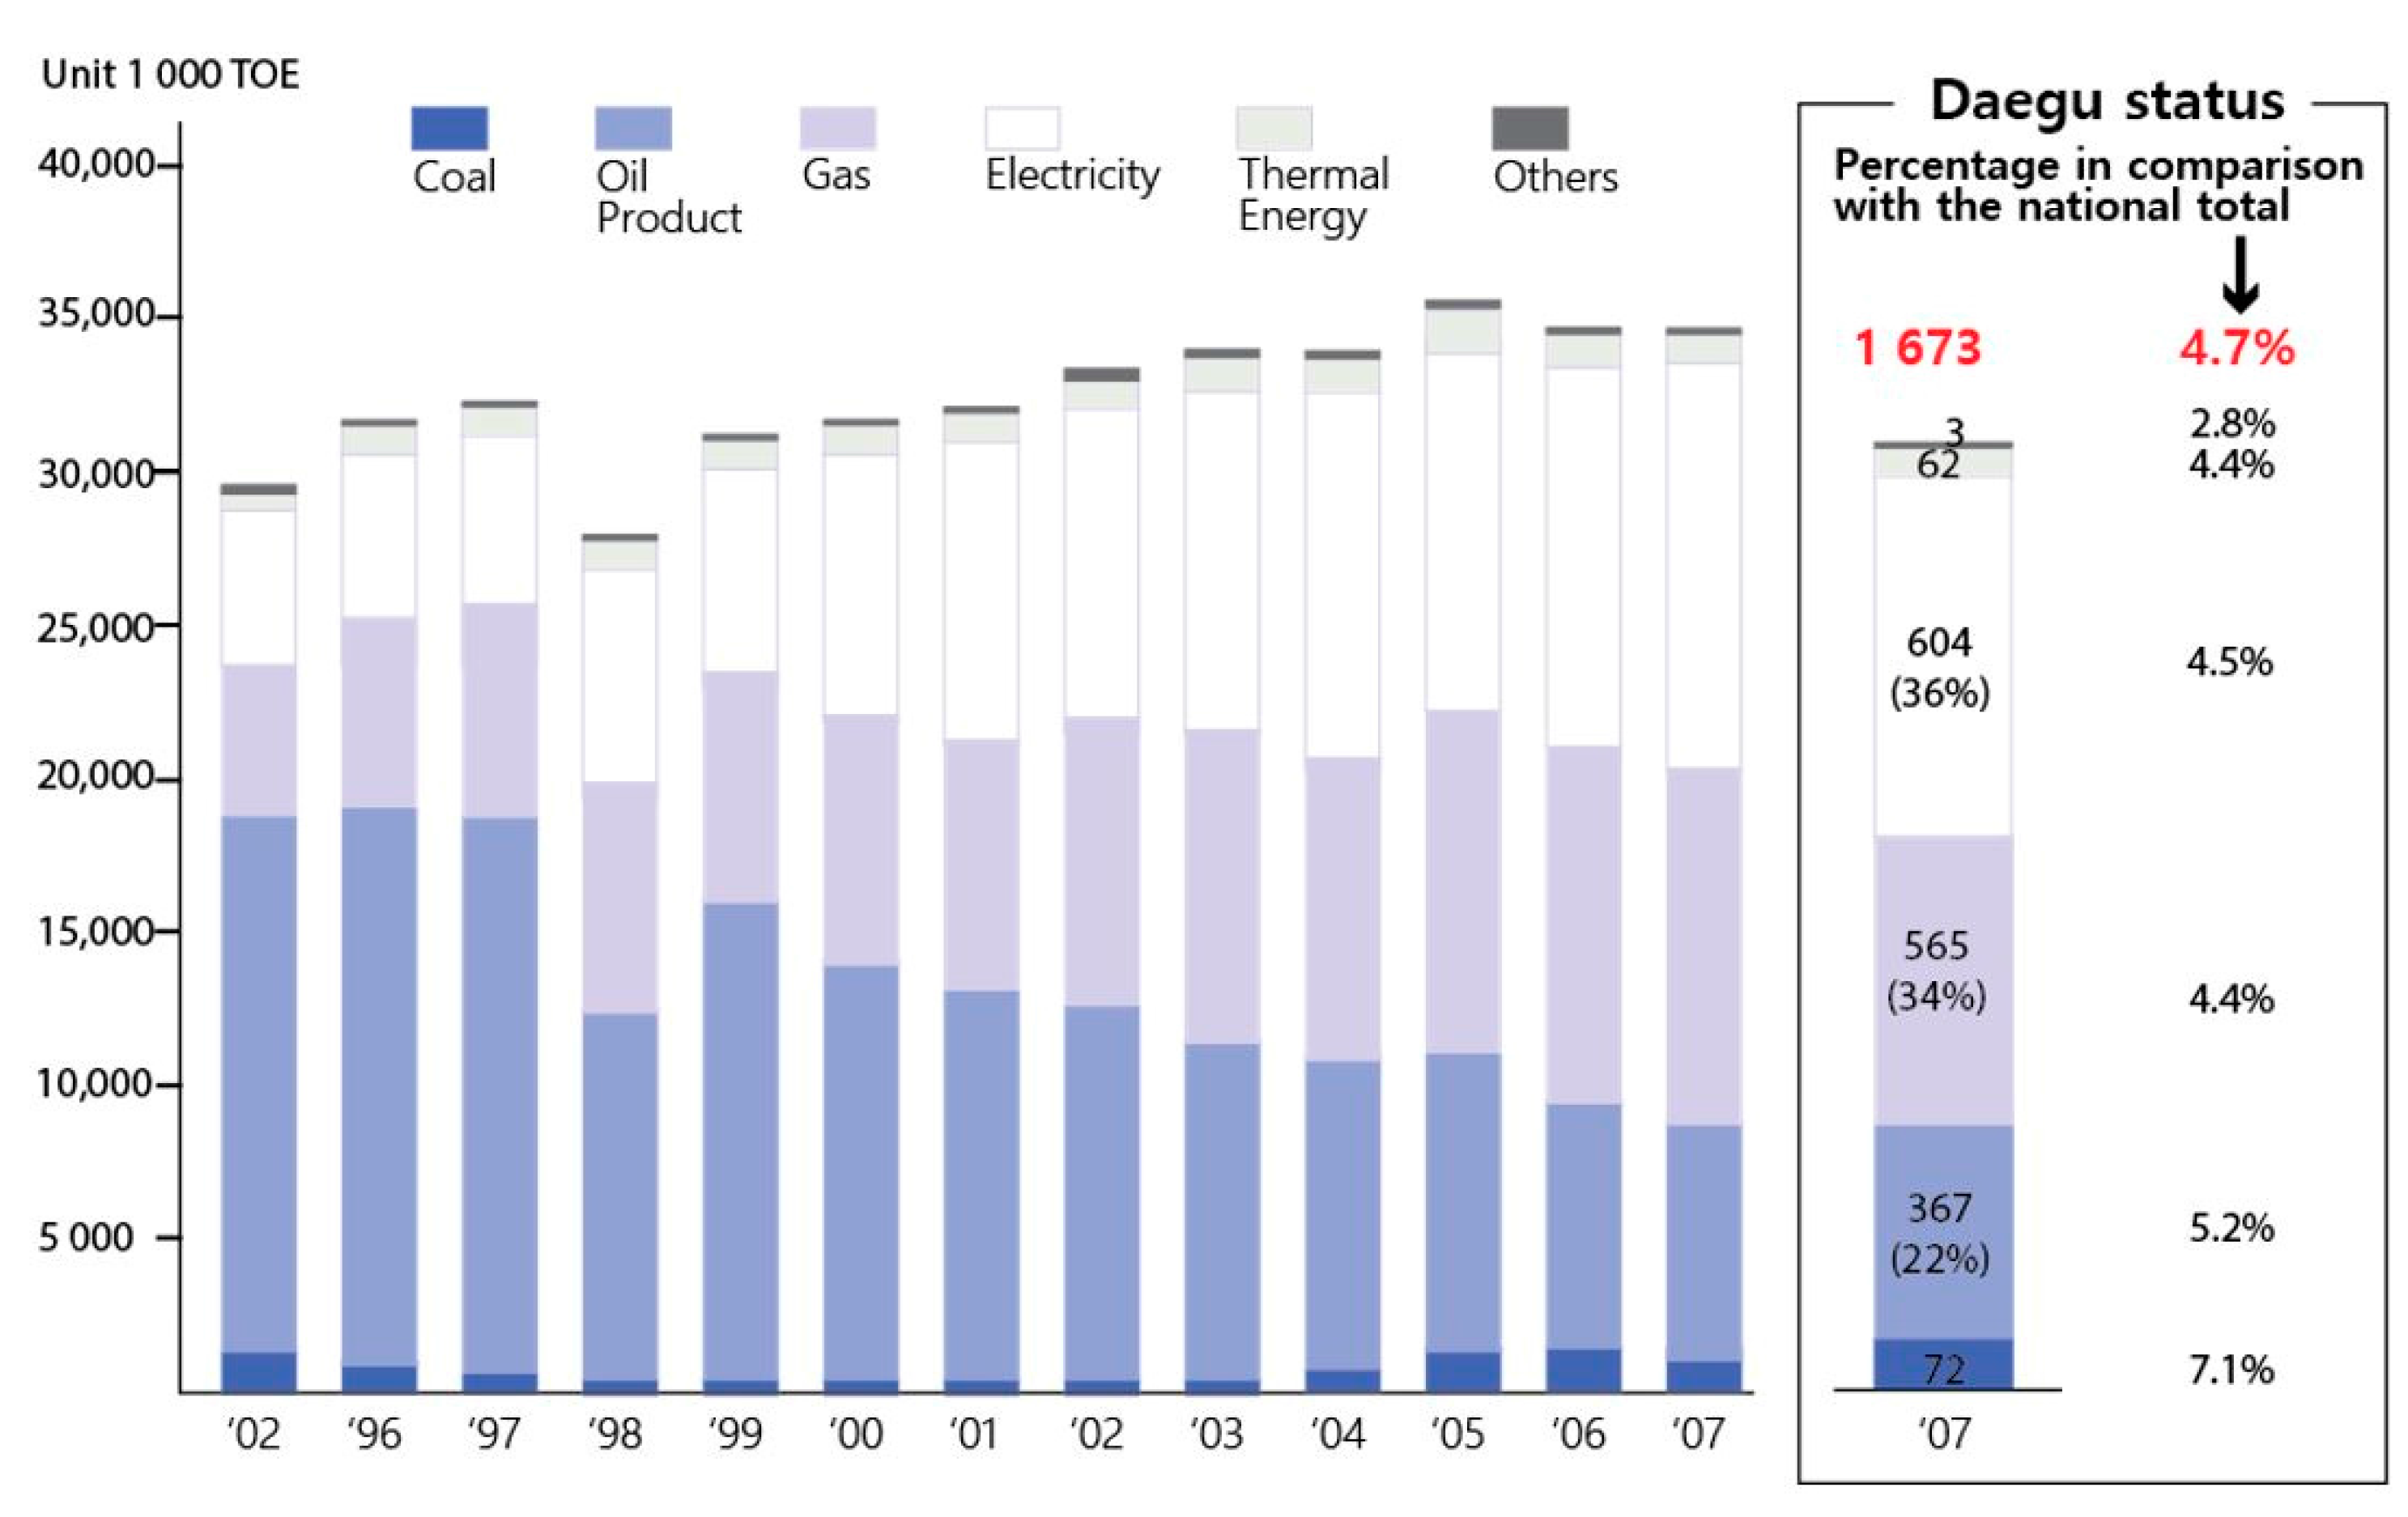
Figure 6.
Energy dependence: Electric power system in Daegu [25].
Figure 6.
Energy dependence: Electric power system in Daegu [25].

Figure 7.
Exclusion conditions for the selection of a solar power generation location: (a) national environmental zoning map; and (b) ecological zoning map.
Figure 7.
Exclusion conditions for the selection of a solar power generation location: (a) national environmental zoning map; and (b) ecological zoning map.

Figure 8.
Location conditions for the selection of a solar power generation location: (a) elevation; (b) slope; (c) distance from roads; and (d) exclusion of rivers.
Figure 8.
Location conditions for the selection of a solar power generation location: (a) elevation; (b) slope; (c) distance from roads; and (d) exclusion of rivers.

Figure 9.
Solar panel installation principle in South Korea.
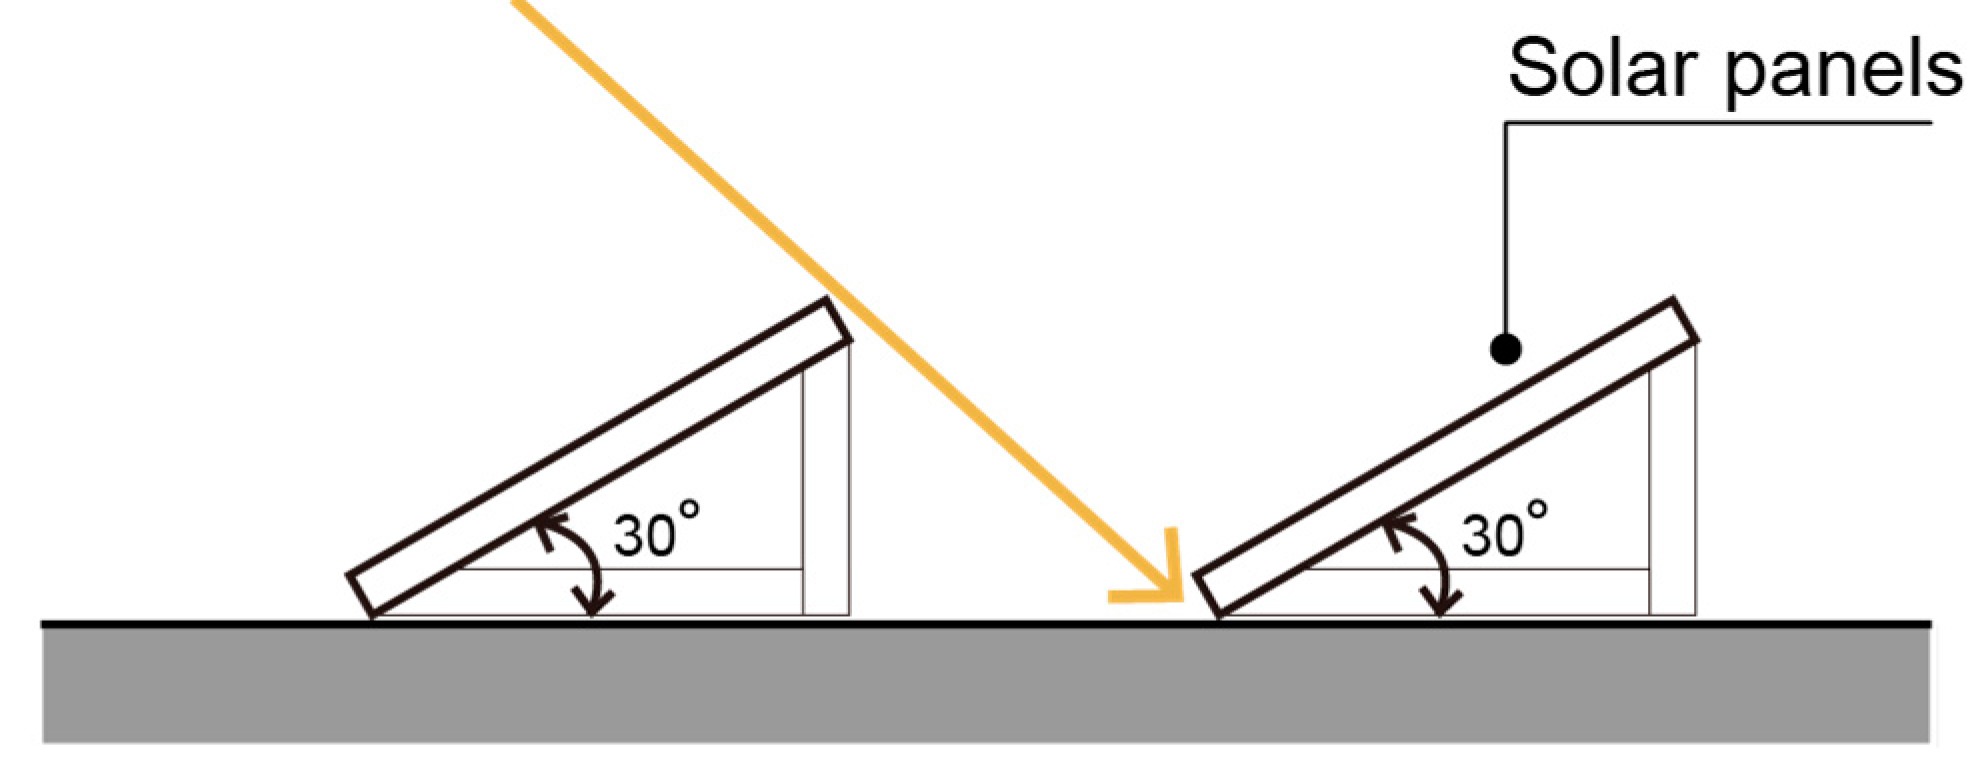
Figure 10.
Daily average production and monthly average irradiance in Daegu. (a) Daily average production of solar panel in Daegu, Korea; (b) Monthly average irradiance in Daegu, Korea.
Figure 10.
Daily average production and monthly average irradiance in Daegu. (a) Daily average production of solar panel in Daegu, Korea; (b) Monthly average irradiance in Daegu, Korea.

Figure 11.
Flow chart of the analysis of energy use.
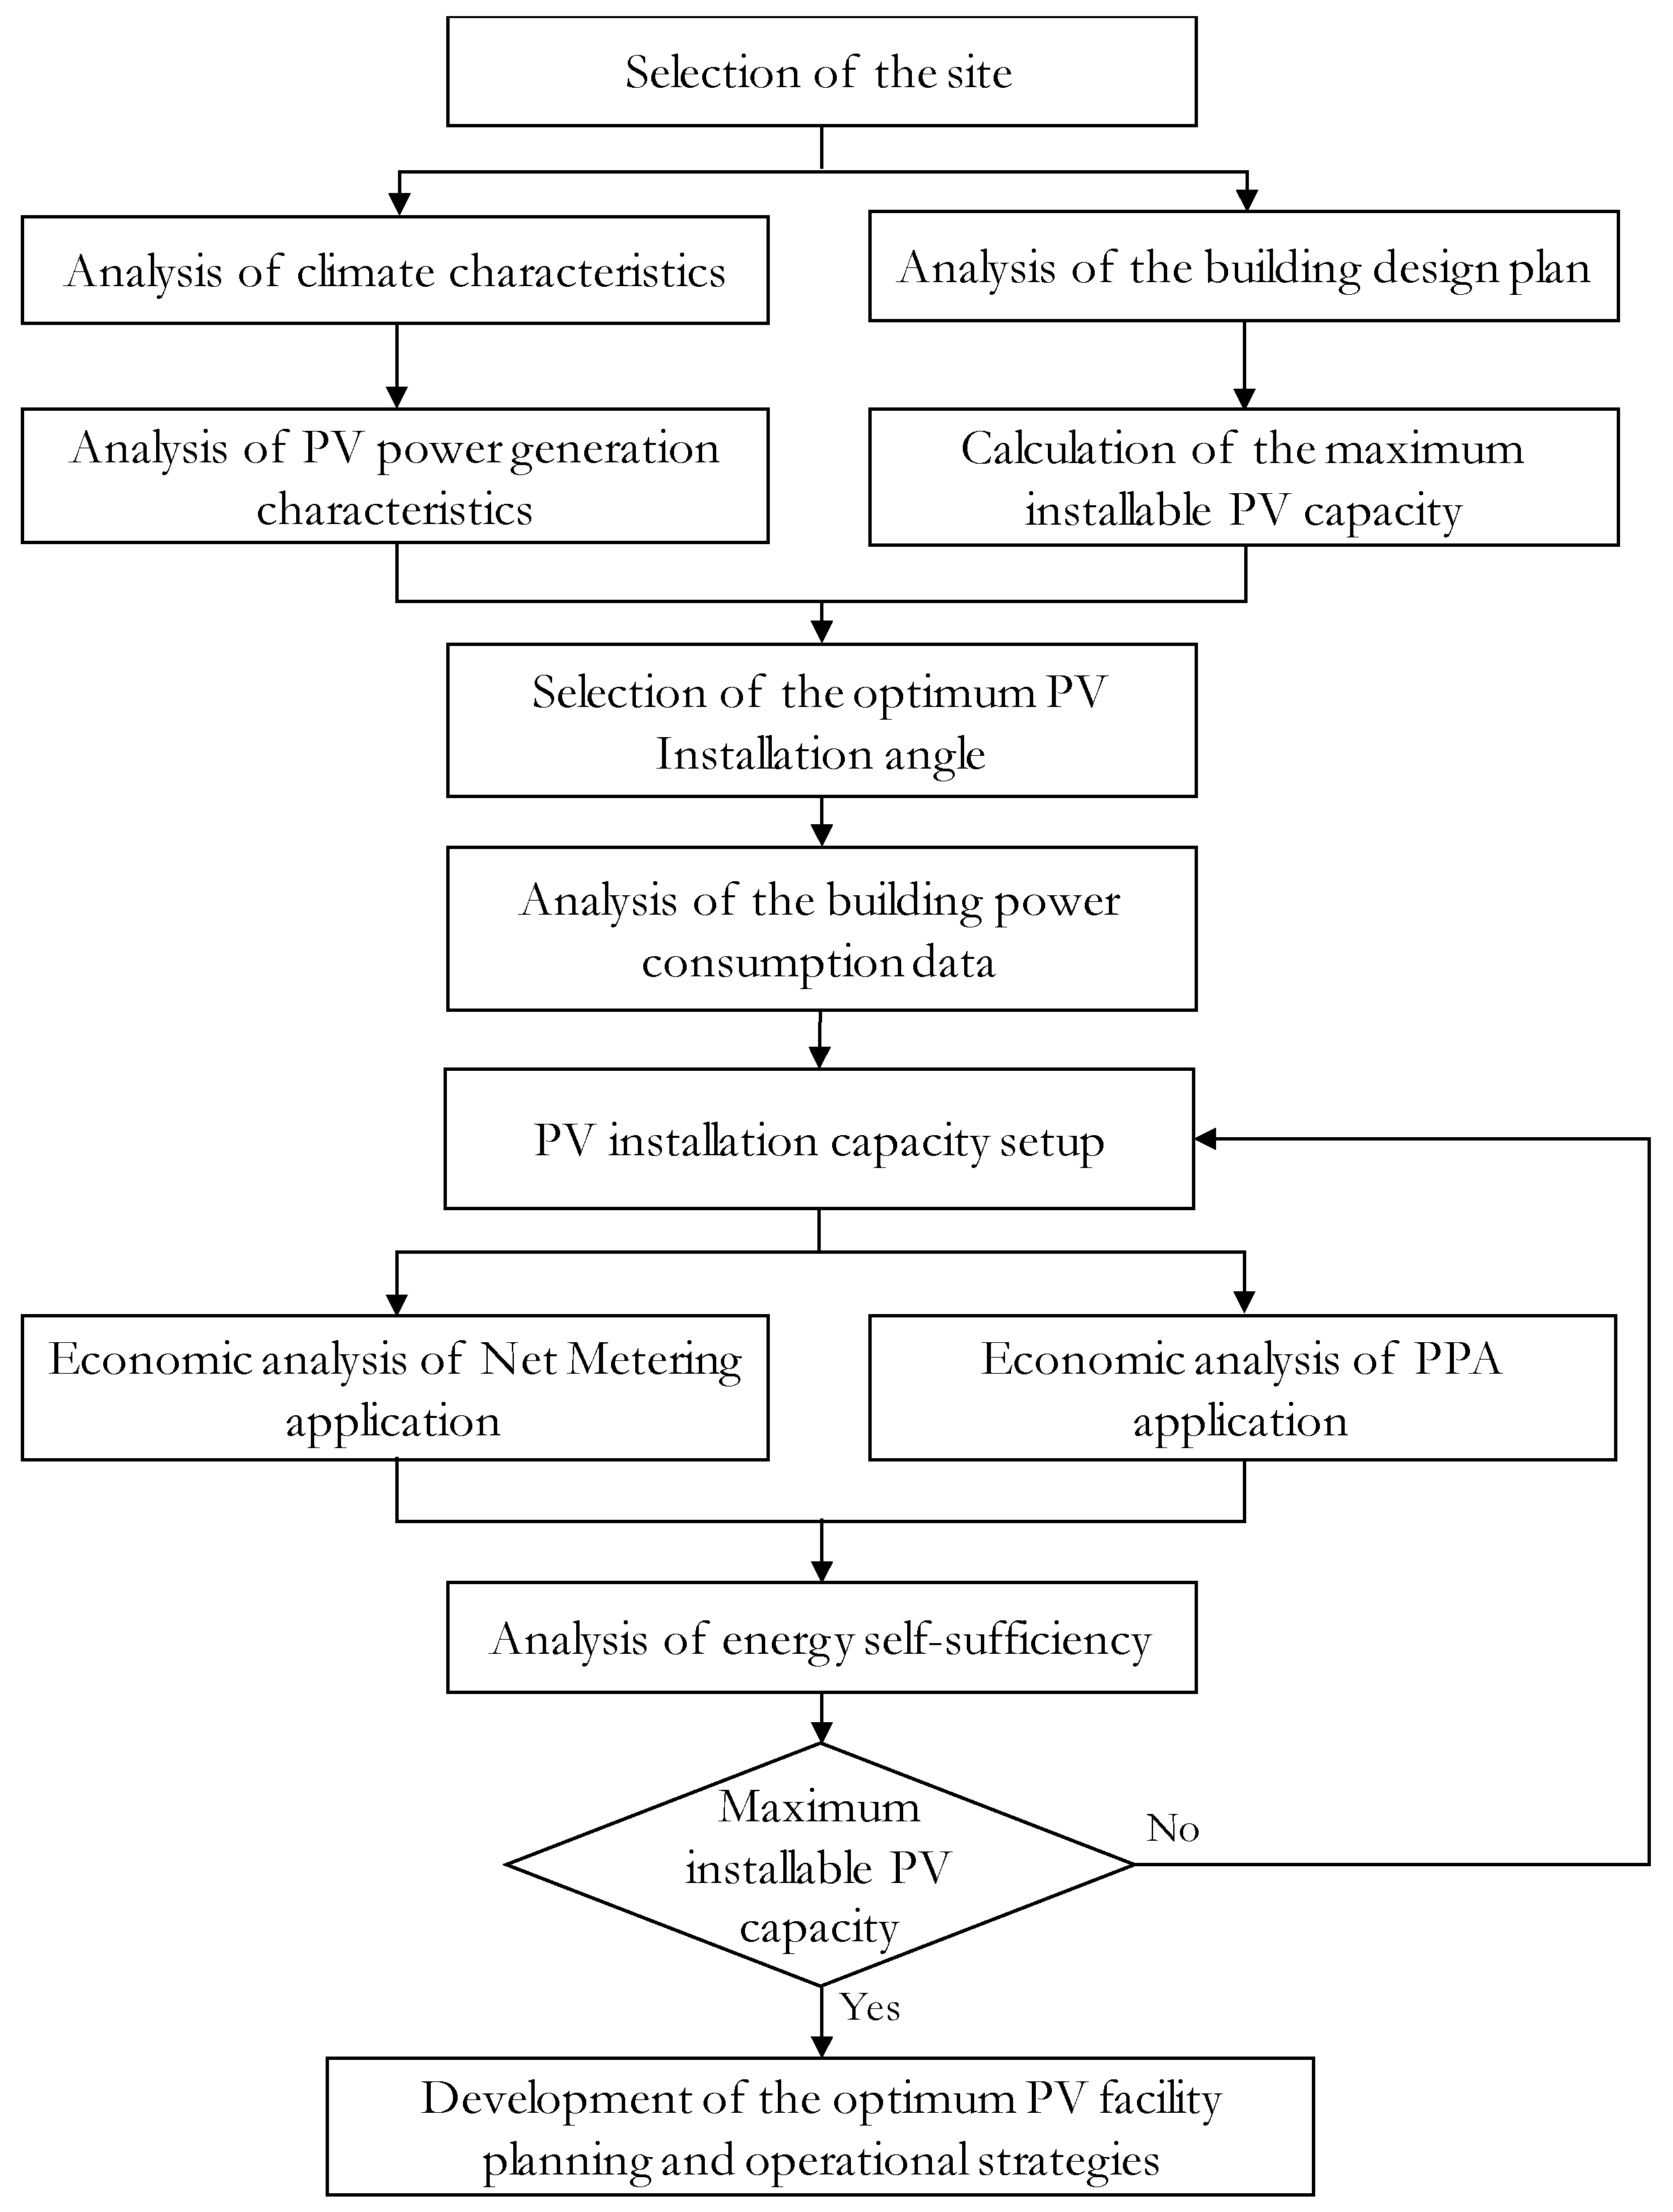
Figure 12.
Comprehensive analysis of types suitable for solar energy: (a) suitable site; (b) solar irradiance; (c) slope direction; and (d) appropriate spots for solar energy.
Figure 12.
Comprehensive analysis of types suitable for solar energy: (a) suitable site; (b) solar irradiance; (c) slope direction; and (d) appropriate spots for solar energy.

Figure 13.
Site.

Figure 14.
Principle of building arrangement and roof planning.

Figure 15.
Comparison of flat- and sloped-roof buildings.
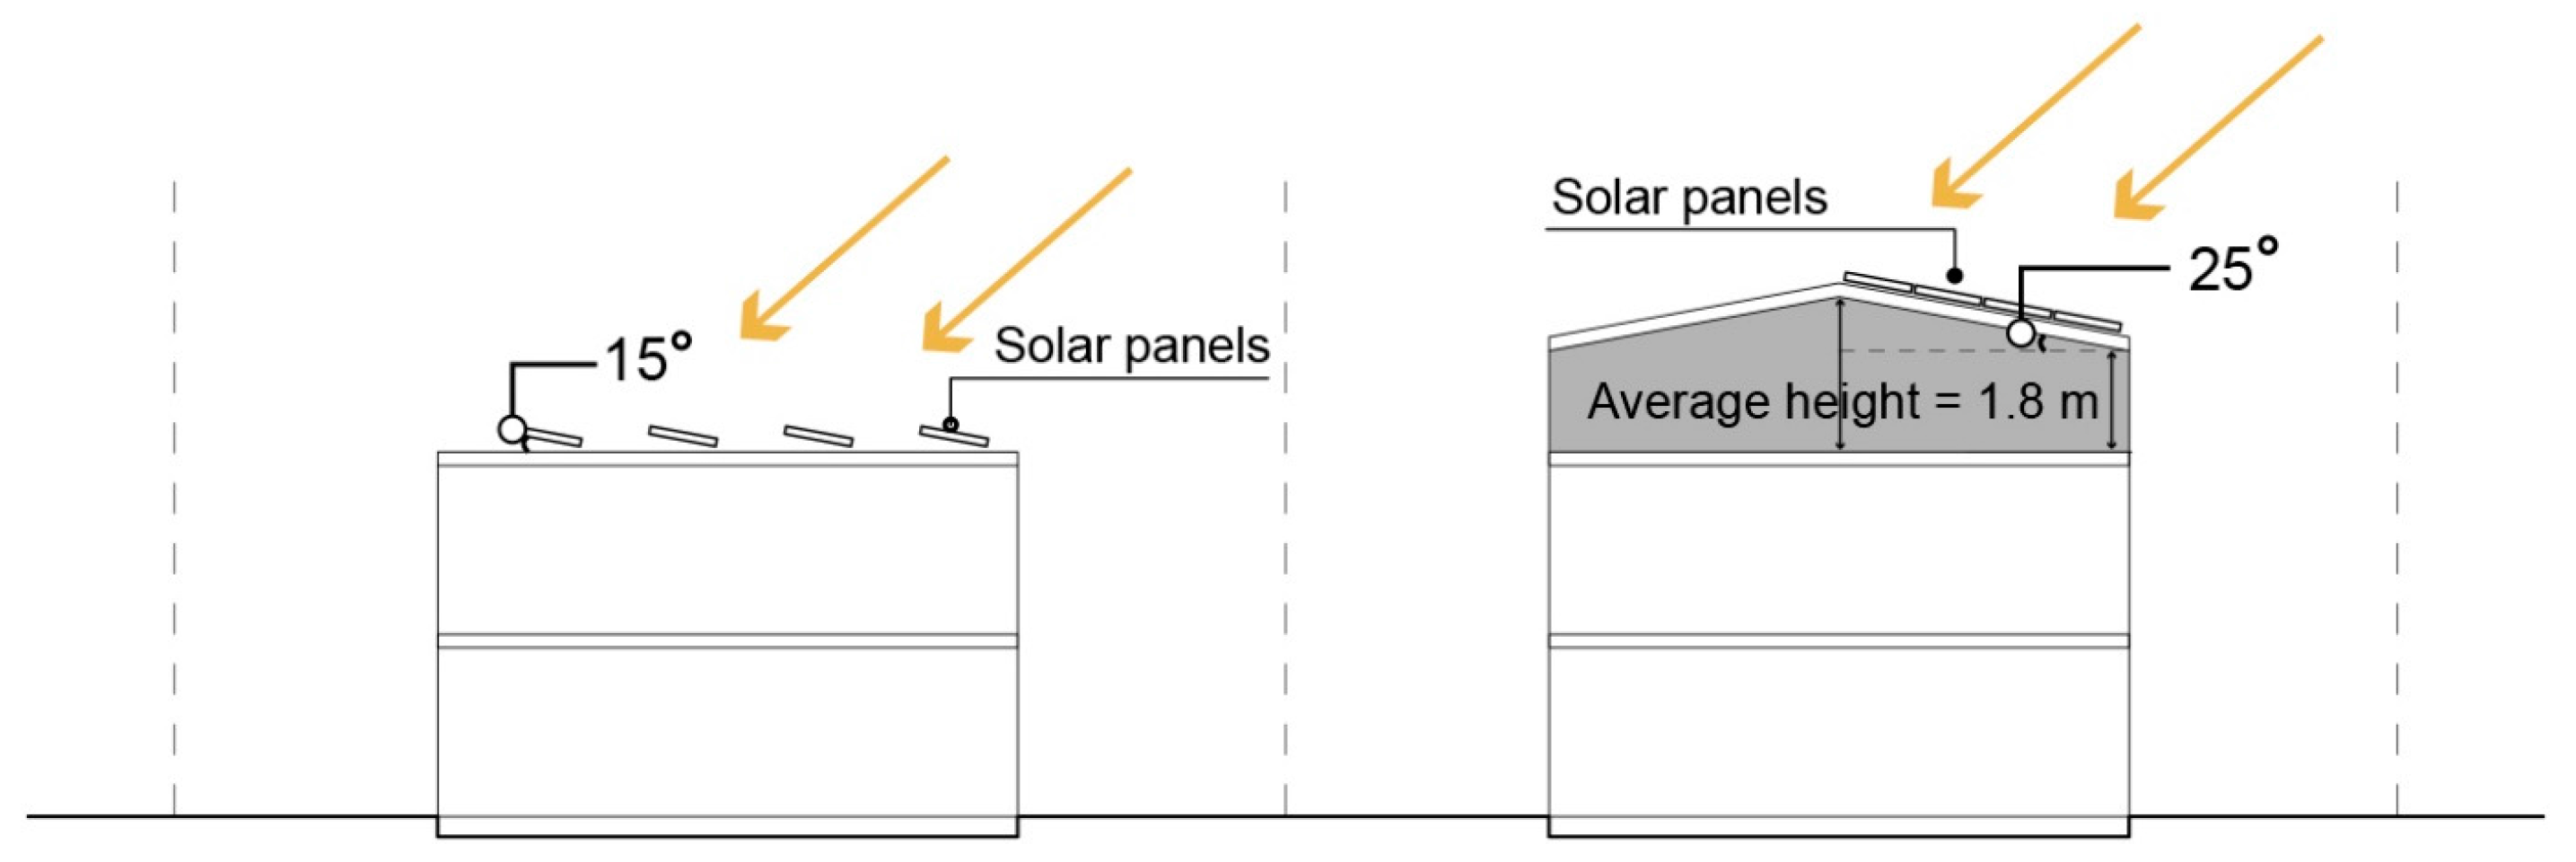
Figure 16.
Difference between monthly power demand and production in Zone A: (a) Case 1; (b) Case 2; (c) Case 3; and (d) Case 4.
Figure 16.
Difference between monthly power demand and production in Zone A: (a) Case 1; (b) Case 2; (c) Case 3; and (d) Case 4.

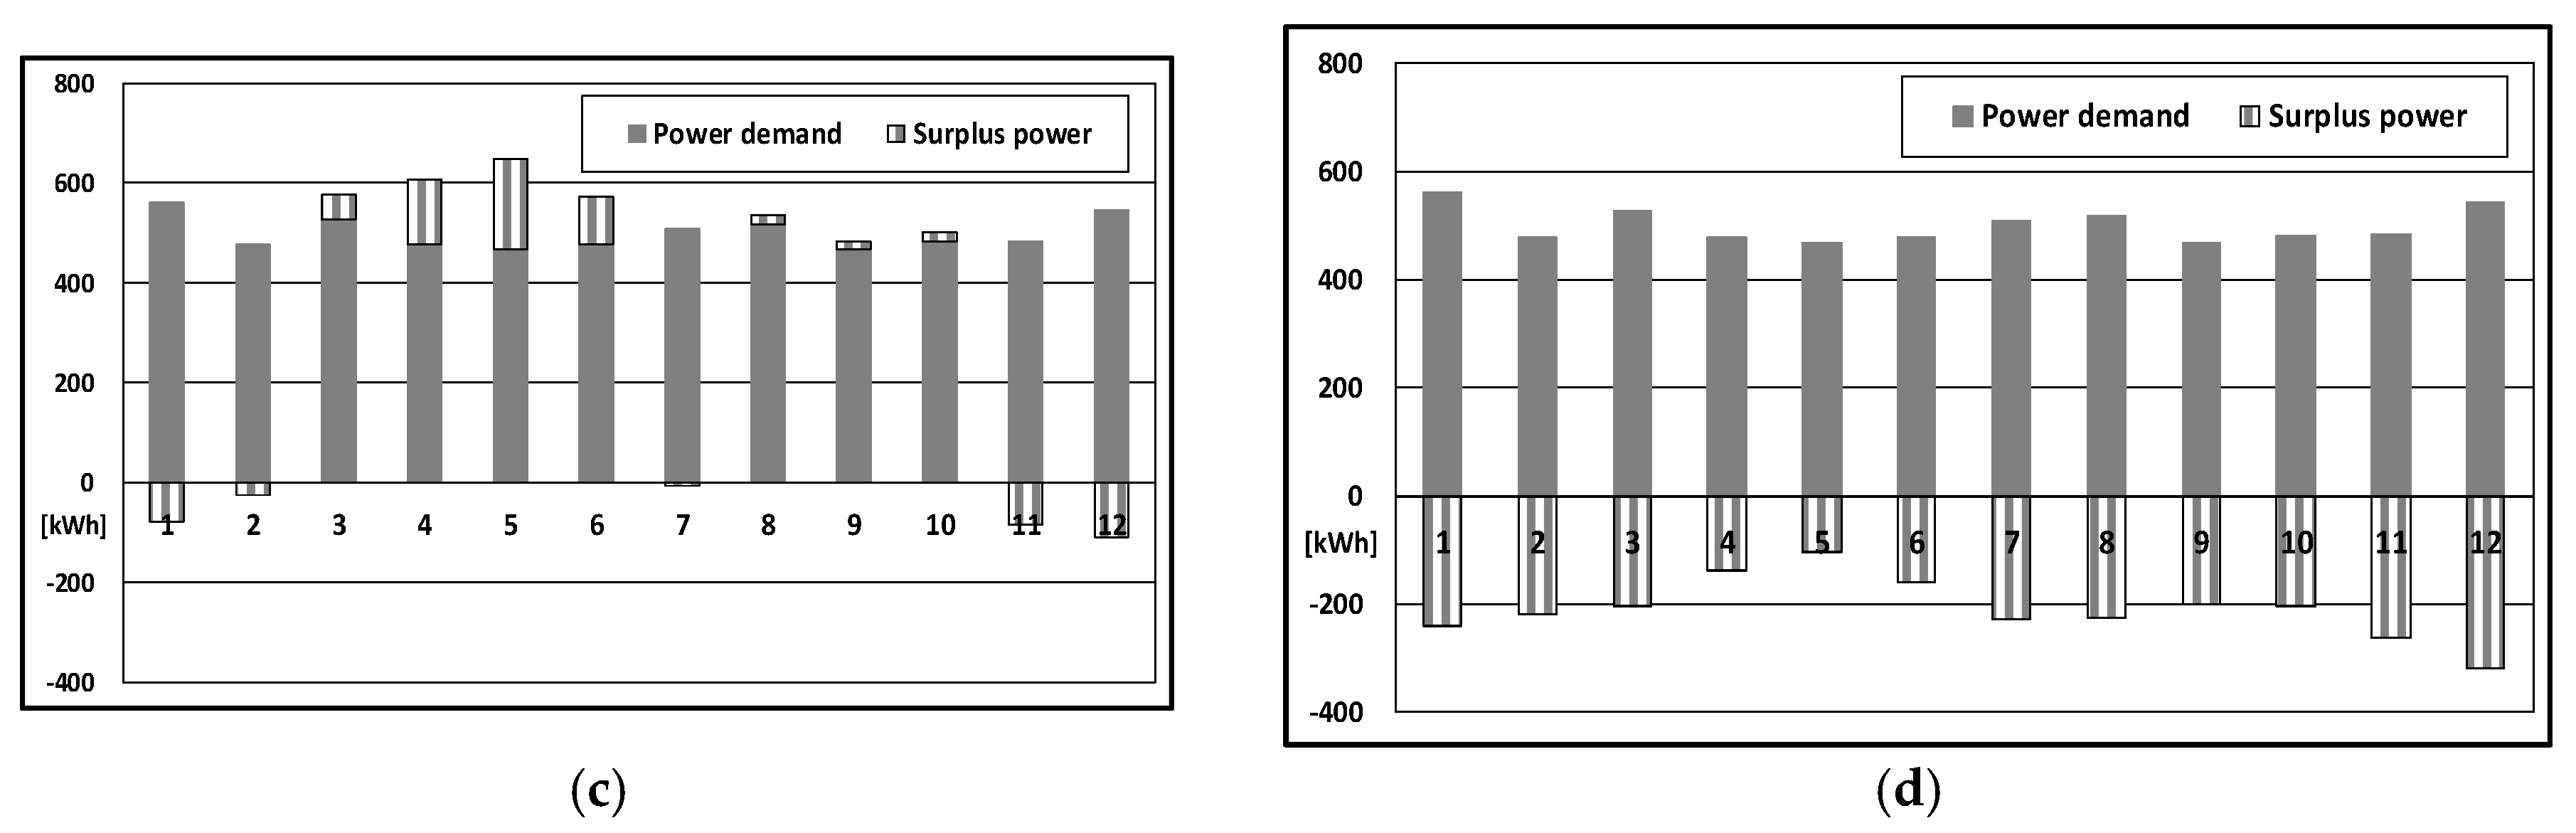
Figure 17.
Difference between monthly power demand and production in Zone B: (a) Case 1; (b) Case 2; (c) Case 3; and (d) Case 4.
Figure 17.
Difference between monthly power demand and production in Zone B: (a) Case 1; (b) Case 2; (c) Case 3; and (d) Case 4.


Table 1.
Exclusion and location conditions for the analysis of photovoltaic location conditions.
| Exclusion Conditions | Location Conditions | ||
|---|---|---|---|
| National environmental zoning map | Ranks 1 and 2 were excluded | Elevation | Within 100 m |
| Gradient | Within 10° | ||
| Distance from roads | 50 m or more | ||
| Ecological zoning map | Rank 1 and separate management areas were excluded | Distance from rivers | Excluding water environments |
| Solar irradiance | More than 4000 MJ/m2 | ||
| Slope direction | 112.5–247.5° (Southeast–southwest) | ||
Table 2.
Exclusion and location conditions for the analysis of photovoltaic location conditions.
| Location | Daegu | Ho Chi Minh | Kazakhstan | Shimane |
|---|---|---|---|---|
| South Korea | Vietnam | Uralsk | Japan | |
| Latitude | 37°33′ | 10°46′ | 42°35′ | 35°13′ |
| Longitude | 128°12′ | 106°41′ | 7°00′ | 133°03′ |
| Optimal Tilt (°) | 25 | 12 | 35 | 30 |
| Total AC Energy (MWh/year) | 1140.17 | 1433.21 | 1504.87 | 1171.17 |
Table 3.
Residential electricity rate by KEPCO.
| Basic Rate ($/Household) | Energy Charge ($/kWh) | ||
|---|---|---|---|
| 200 kWh or less | 0.910 | First 200 kWh | 0.093 |
| 201–400 kWh or less | 1.60 | Next 200 kWh | 0.188 |
| More than 400 kWh | 7.30 | After exceeding 400 kWh | 0.281 |
Table 4.
District unit planning Zones A and B.
| Zone | Number of Parcels | Main Purpose of Use | Urban Regulations (Maximum) | Building Height | Number of Households | Number of Inhabitants | Number of Inhabitants per Household |
|---|---|---|---|---|---|---|---|
| Zone A | 45 | Class 2 private housing | Coverage ratio: 60% Floor area ratio: 180% | 3 floors | 45 | 131 | 3 people/household |
| Zone B | 69 | Class 1 private housing (especially single houses) | Coverage ratio: 50% Floor area ratio: 100% | 2 floors | 69 | 200 | 3 people/household |
Table 5.
Analysis of energy and economic unit planning for Zones A and B.
| Category | Case 1 | Case 2 | Case 3 | Case 4 | |||||
|---|---|---|---|---|---|---|---|---|---|
| Rooftop (MAX) | Roof (MAX) | Roof (Zero Energy) | Roof (Subsidy) | ||||||
| Area | A | B | A | B | A | B | A | B | |
| Tilt | 15 | 25 | |||||||
| PV installation capacity (kW) | 11.925 | 10.335 | 5.30 | 4.77 | 2.915 | ||||
| Yearly | AC energy (kWh) | 13,387 | 13,429 | 11,784 | 11,832 | 6043 | 5461 | 3324 | 3338 |
| Power demand (kWh) | 5318 | 4653 | 5318 | 4653 | 5318 | 4653 | 5318 | 4653 | |
| Excess power (kWh) | 7537 | 8310 | 5934 | 6714 | 193 | 342 | −2476 | −1781 | |
| Warranty Period | PV installation costs ($) | 14,175 | 12,285 | 6300 | 5670 | 1511 | |||
| PV installation subsidy ($) | 0 | 1953 | |||||||
| Additional charges for power trading ($) | 80 | ||||||||
| Power saving ($) | 23,779 | 18,854 | 23,779 | 18,854 | 23,779 | 18,854 | 17,779 | 14,898 | |
| O&M cost ($) | 2835 | 2457 | 1260 | 1145 | 302 | ||||
| Net Present Value ($) | −1147 | −4069 | 877 | −2045 | 7978 | 4979 | 8856 | 7325 | |
© 2018 by the authors. Licensee MDPI, Basel, Switzerland. This article is an open access article distributed under the terms and conditions of the Creative Commons Attribution (CC BY) license (http://creativecommons.org/licenses/by/4.0/).
Share and Cite
MDPI and ACS Style
Kim, S.-Y.; Choi, H.-S.; Eum, J.-H. Energy-Independent Architectural Models for Residential Complex Plans through Solar Energy in Daegu Metropolitan City, South Korea. Sustainability 2018, 10, 482. https://doi.org/10.3390/su10020482
AMA Style
Kim S-Y, Choi H-S, Eum J-H. Energy-Independent Architectural Models for Residential Complex Plans through Solar Energy in Daegu Metropolitan City, South Korea. Sustainability. 2018; 10(2):482. https://doi.org/10.3390/su10020482
Chicago/Turabian StyleKim, Sung-Yul, Ho-Soon Choi, and Jeong-Hee Eum. 2018. "Energy-Independent Architectural Models for Residential Complex Plans through Solar Energy in Daegu Metropolitan City, South Korea" Sustainability 10, no. 2: 482. https://doi.org/10.3390/su10020482
Note that from the first issue of 2016, this journal uses article numbers instead of page numbers. See further details here.