What Is the Optimal and Sustainable Lifetime of a Mine?


1
Formerly Federal Institute for Geosciences and Natural Resources (BGR), Stilleweg 2, D-30655 Hannover, Germany
2
Department of Knowledge Management and Communication, Faculty of Business and Globalization, Danube University, 3500 Krems, Austria
3
Swiss Federal Institute of Technology (ETH), 8096 Zurich, Switzerland
4
Department of Physical Process Engineering, Fraunhofer Institute for Interfacial Engineering and Biotechnology (IGB), 70569 Stuttgart, Germany
*
Author to whom correspondence should be addressed.
†
Private address: Neue Sachlichkeit 32, D-30655 Hannover, Germany.
Sustainability 2018, 10(2), 480; https://doi.org/10.3390/su10020480
Submission received: 17 December 2017
/
Revised: 1 February 2018
/
Accepted: 2 February 2018
/
Published: 11 February 2018
(This article belongs to the Special Issue Phosphorus Circular Economy: Closing Loops through Sustainable Innovation)
Abstract
:The first stage of the circular economy, mining, is examined from the perspective of sustainability. The authors discuss how to maximize the use of phosphate rock, a primary commodity. To attract investment capital in a market economy system, a mine has to operate profitably, i.e., its lifetime must be optimized under economic conditions, for example, according to Taylor’s Rule. From a sustainability perspective, however, the lifetime should extend as long as possible and the grades mined be as low as possible. The authors examine methods for optimizing a mine’s lifetime under economic conditions according to practical experience and learning effects to optimize exploration and exploitation. With the condition of sustainability, a recently developed concept of cut-off grade for a layered phosphate deposit is examined and considerations for prolonging a mine’s lifetime are discussed. As there are big losses from the current and potential future value chains above and below the current cut-off grade, we argue that the losses and use efficiency of phosphorus are key parts of a circular economy.
1. Introduction
“Sustainable” and “sustainable development” are terms that are used today in an inflationary way and they always require a definition and explanation. The internationally and most widely accepted definition of sustainable development is that found in the 1987 United Nations Report of the World Commission on Environment and Development Our Common Future (the “Brundtland Report”): “a development that meets the needs of the present without compromising the ability of future generations to meet their own needs” [1]. This, however is an abstract, normative principle. It requires practical guidelines. In 1993 the German Federal Parliament established a study commission, the Enquete Commission for the Protection of Man and the Environment, to formulate rules [2]. One dealt with the use of non-renewable resources: “The consumption of non-renewable resources should not exceed the amount that can be substituted for by functionally equivalent renewable resource, or by attaining a higher efficiency in the use of renewable and non-renewable resources.” Yet this guideline is still fairly abstract. Wagner and Wellmer [3] attempted to develop more practical guidelines for the use of non-renewable resources and concluded that these guidelines could be observed by consistently finding solutions for functions required by society with resources of the geosphere and technosphere using the most important resource: human ingenuity and creativity. Instruments to achieve this goal are a circular economy, the optimization of substitution processes and the development of new technologies.
Like the nutrient elements nitrogen and potassium phosphorus is a bioessential element that cannot be substituted. As the lifetime of a mine can be linked to an increase of the extraction rate, the longevity [4] of access to phosphate rock is of interest from a sustainability perspective. Reflecting and improving future generations’ access to unsubstitutable mineral nutrients is an important issue. Consequently “A challenge of future sustainable resources management is to develop the proper knowledge to avoid bottlenecks of supply” [5]. This can be achieved only if the mineral supply is approached from a dynamic of sustainable mining. With respect to phosphorus (P) mining, for instance, we suggested the following: “We can define a sustainable P cycle if—in the long run—the economically mineable (primary and secondary) reserves of P increase higher than the losses (i.e., dissipation) to sinks which are not economically mineable.” [5]. This is in line with a systemic view of sustainability that conceives sustainable development as a proactive, ongoing inquiry on system-limit management (i.e., on preventing hard landings and collapses of valuable systems) in the framework of inter-and intragenerational justice [6]. With respect to phosphorus management the avenues to achieving the goal of sustainability, meaning supply security for the basic nutrient phosphorus for future generation, are a circular economy and the development of better technologies. Based on this, we suggest that for unsubstitutable, essential minerals (such as phosphorus), the sustainable lifetime of a mine must acknowledge the finiteness of the phosphate rock and include the recovery rate (i.e., how much of the phosphorus of the deposit is used; see Box 1, Part 1). In practice (see Section 3), this is managed via the cut-off grade. With respect to lifetime, this paper focuses only on the long-term supply security, although other issues such as environmental and societal impacts must be included in any comprehensive definition of the lifetime of a mine.
In a circular economy, mining is the first stage in the chain of value creation. Although the mining stage has no direct influence on the recycling stage, its efficiency influences the overall efficiency of the circular economy. Therefore, it is useful to study strategies of mineral economics and mine planning to maximize the recovery in the first stage of the circular economy, mining. How fast and at what cut-off grade a reserve is mined or a resource depleted is a question of efficiency and effectiveness- and these influence the lifetime and capacity of a mine [7]. We will examine methods and rules for determining the lifetime of both types of phosphate deposits: stratiform normally quite uniform sedimentary seam deposits that can be extrapolated over large distances and lens-like much more irregular magmatic deposits.
Standard procedure in mineral economics is to evaluate a deposit using dynamic evaluation methods [8]. These take into account the time value of money. The standard method is a discounted cash-flow method (DCF). Cash flow is the net amount of cash moving in and out of a business, in our case a mining operation, i.e., only true flows of money and no depreciation, for example, which is a financial method used only to calculate the tax base. The time value of money is based on the assumption that money can earn money (interest) over time; a dollar today is worth more than the same dollar tomorrow. For example, assuming a formerly normal 5% annual interest rate, 1000€ in a savings account would be worth 1050€ in a year. Conversely, you have to earn 1050€ in one year to have a value today, the present value of 1000€, whereas 1000€ in one year would have a value of only 952€ today. This means you have to discount future money streams, the cash flows. These are the reverse formulae for compound interest. The discounting factors are, given
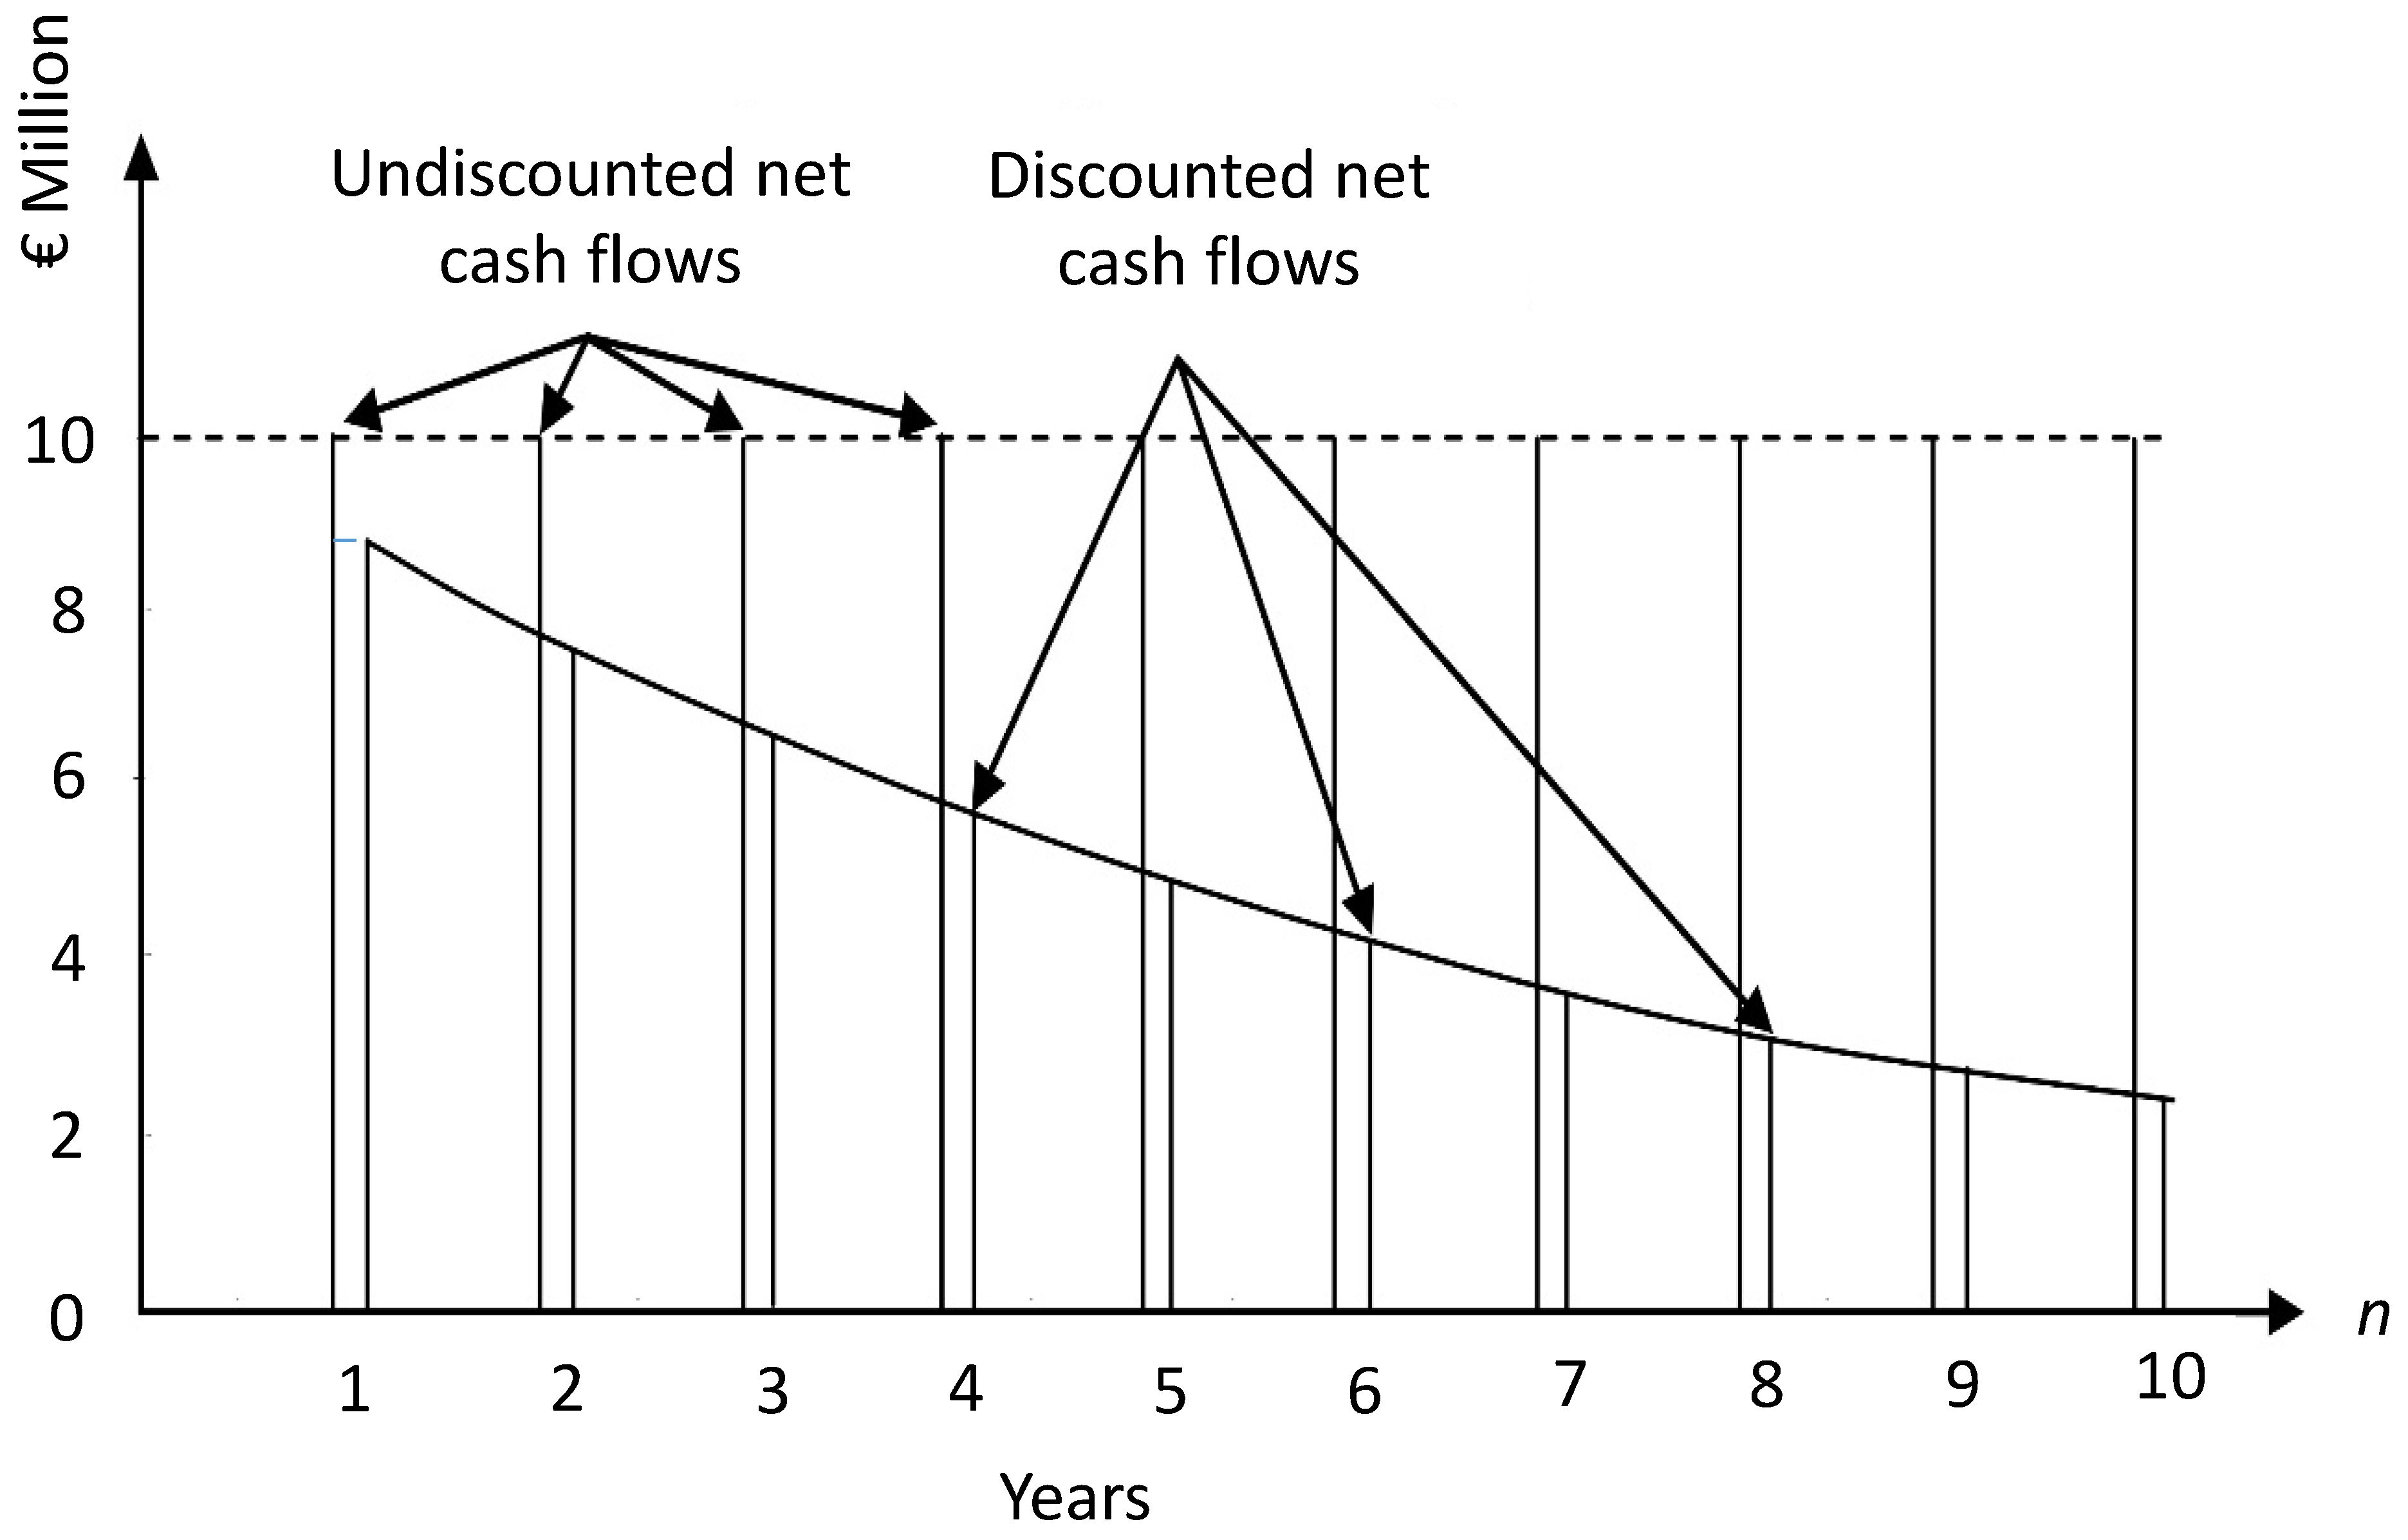
Hereby, is the chosen interest rate and the number of years. These discounting factors decrease rapidly with increasing years and they decrease more rapidly the higher the interest rates are. For example, a cash flow of 10 mio € in 10 years at a discounting rate of 10% has a present value of only 3.86 mio € but in 20 years, a value of only 1.49 mio €. If the interest rate is increased to 15%, the values are only 2.47 mio € in 10 years and 0.61 mio € in 20 years. The decrease of the value of the discounted cash flows for i = 15% for 10 years is shown in Figure 1.
Box 1. A rationale for assessing a sustainable lifetime.
Part 1: Characteristics of future and of sustainable mining
Sustainability
The sustainable mining of unsubstitutable mineral (mineral nutrients; see Section 1) demands
- Avoiding bottlenecks of supply
- ∘
- By prospective resilient planning (not subject of this paper)
- Providing long-term supply security for P from (terrestrial) deposits. This implies
- ∘
- Low and efficient use of P
- ∘
- Recycling (not subject of this paper)
- Producing to the extent possible phosphate from mining bodies which includes lowering the cut-off grade as much as possible
Assumptions on the future of (phosphate) mining
Ore grade will decline in the long run, therefore:
- Lower grades must be mined in the future
- Planning of multi-phase mining of the same ore body is meaningful
- What has previously been considered (uneconomic) waste may become reserves (the triaging of waste may be of interest)
Part 2: Optimal lifetime and principles of assessing sustainable lifetime for a case of open pit mining
- Optimal lifetime
- The business strategy of mining companies usually follows cut-off grades that lie between those which maximizes the return of the investment and covering operation costs
- In practice, the optimal lifetime is assessed according to Taylor’s Rule an empirically affirmed rule of thumb calculation based on the “total tonnage expected”
- A case of assessing the sustainable lifetime for open pit mining (see Section 3.4)Important aspects/steps of the case
- Think about multi-stage/-phase mining of an open-pit mine
- Phase 1: Increase the cut-off grade, decrease the amount of extraction and thereby, increase gains (used for higher operating costs)
- The additional gains are compounded
- Phase 2: The gains and investment costs for the second phase of Phase 2 have to be discounted
- Assess the break-even point between compounding of Phase 1- and discounting of Phase 2-gains/investments
- Prerequisites/assumptions of the presented case
- Interest rates for compounding and discounting are equal
- No subsidies, no changing tax rates
- Mining companies do not change their business strategies
- No economic reason to increase lifetime taking into account learning effects during the mining operation.
For evaluating a mining project and comparing different projects, two methods are mainly applied: the net present value method () and the internal rate of return method (). Given an interest rate, letting denote the cash flow at time , the net present value at time 0 is:
Hereby N is the entire period of N years for which the net present value is calculated and j is a specific year. The (in the following denoted as NPV) is the sum of all net cash flows () discounted with a predefined interest rate minus the initial investment (Equation (2)). The is the interest rate for which the discounted net cash flows equal the investment, , i.e., in Equation (2) the then equals zero.
A second term to be discussed in the introduction is “cut-off grade.” The cut-off grade under the noted economic definitions is the lowest grade that can be mined economically; therefore, the cut-off grade separates ore from waste. Taking into account the dynamics of future cash flows, cut-off grades can also become dynamic, as will be shown below.
It shall at least briefly be mentioned that the DCF method has been further advanced by the option pricing method. For every mine planning a prefeasibility or feasibility study, a structure for investment and operating costs must be developed to arrive at annual cash flows and a future commodity price has to be assumed. The option pricing method also attempts to take into account the cyclical nature of commodity prices and complements the evaluation with the variability of prices. This method was developed by Black and Scholes [9] and adapted to mineral properties by Brennan and Schwartz [10]. It is beyond the scope of this paper to discuss the method in detail; however, the aspect of price variability is one that can have an influence on the lifetime of a mine and is discussed briefly in Section 2.2.4.
2. Application in Mine Planning
2.1. Theoretical Approach
Taking into account the dynamics of the present value method, the consequence for mine planning is to maximize cash flow in the early years. This can be accomplished by mining an ore body as fast as possible and/or raising the cut-off grade in the beginning to increase the mill-head grade and lowering the cut-off grade of the mining operation over time (e.g., [11]). This approach would set the cut-off grade in such a way that the of an operation would be maximized. This problem has been studied in depth by Lane [12] and Rendu [13], who examined the interplay of various factors influencing the economic optimal cut-off grade.
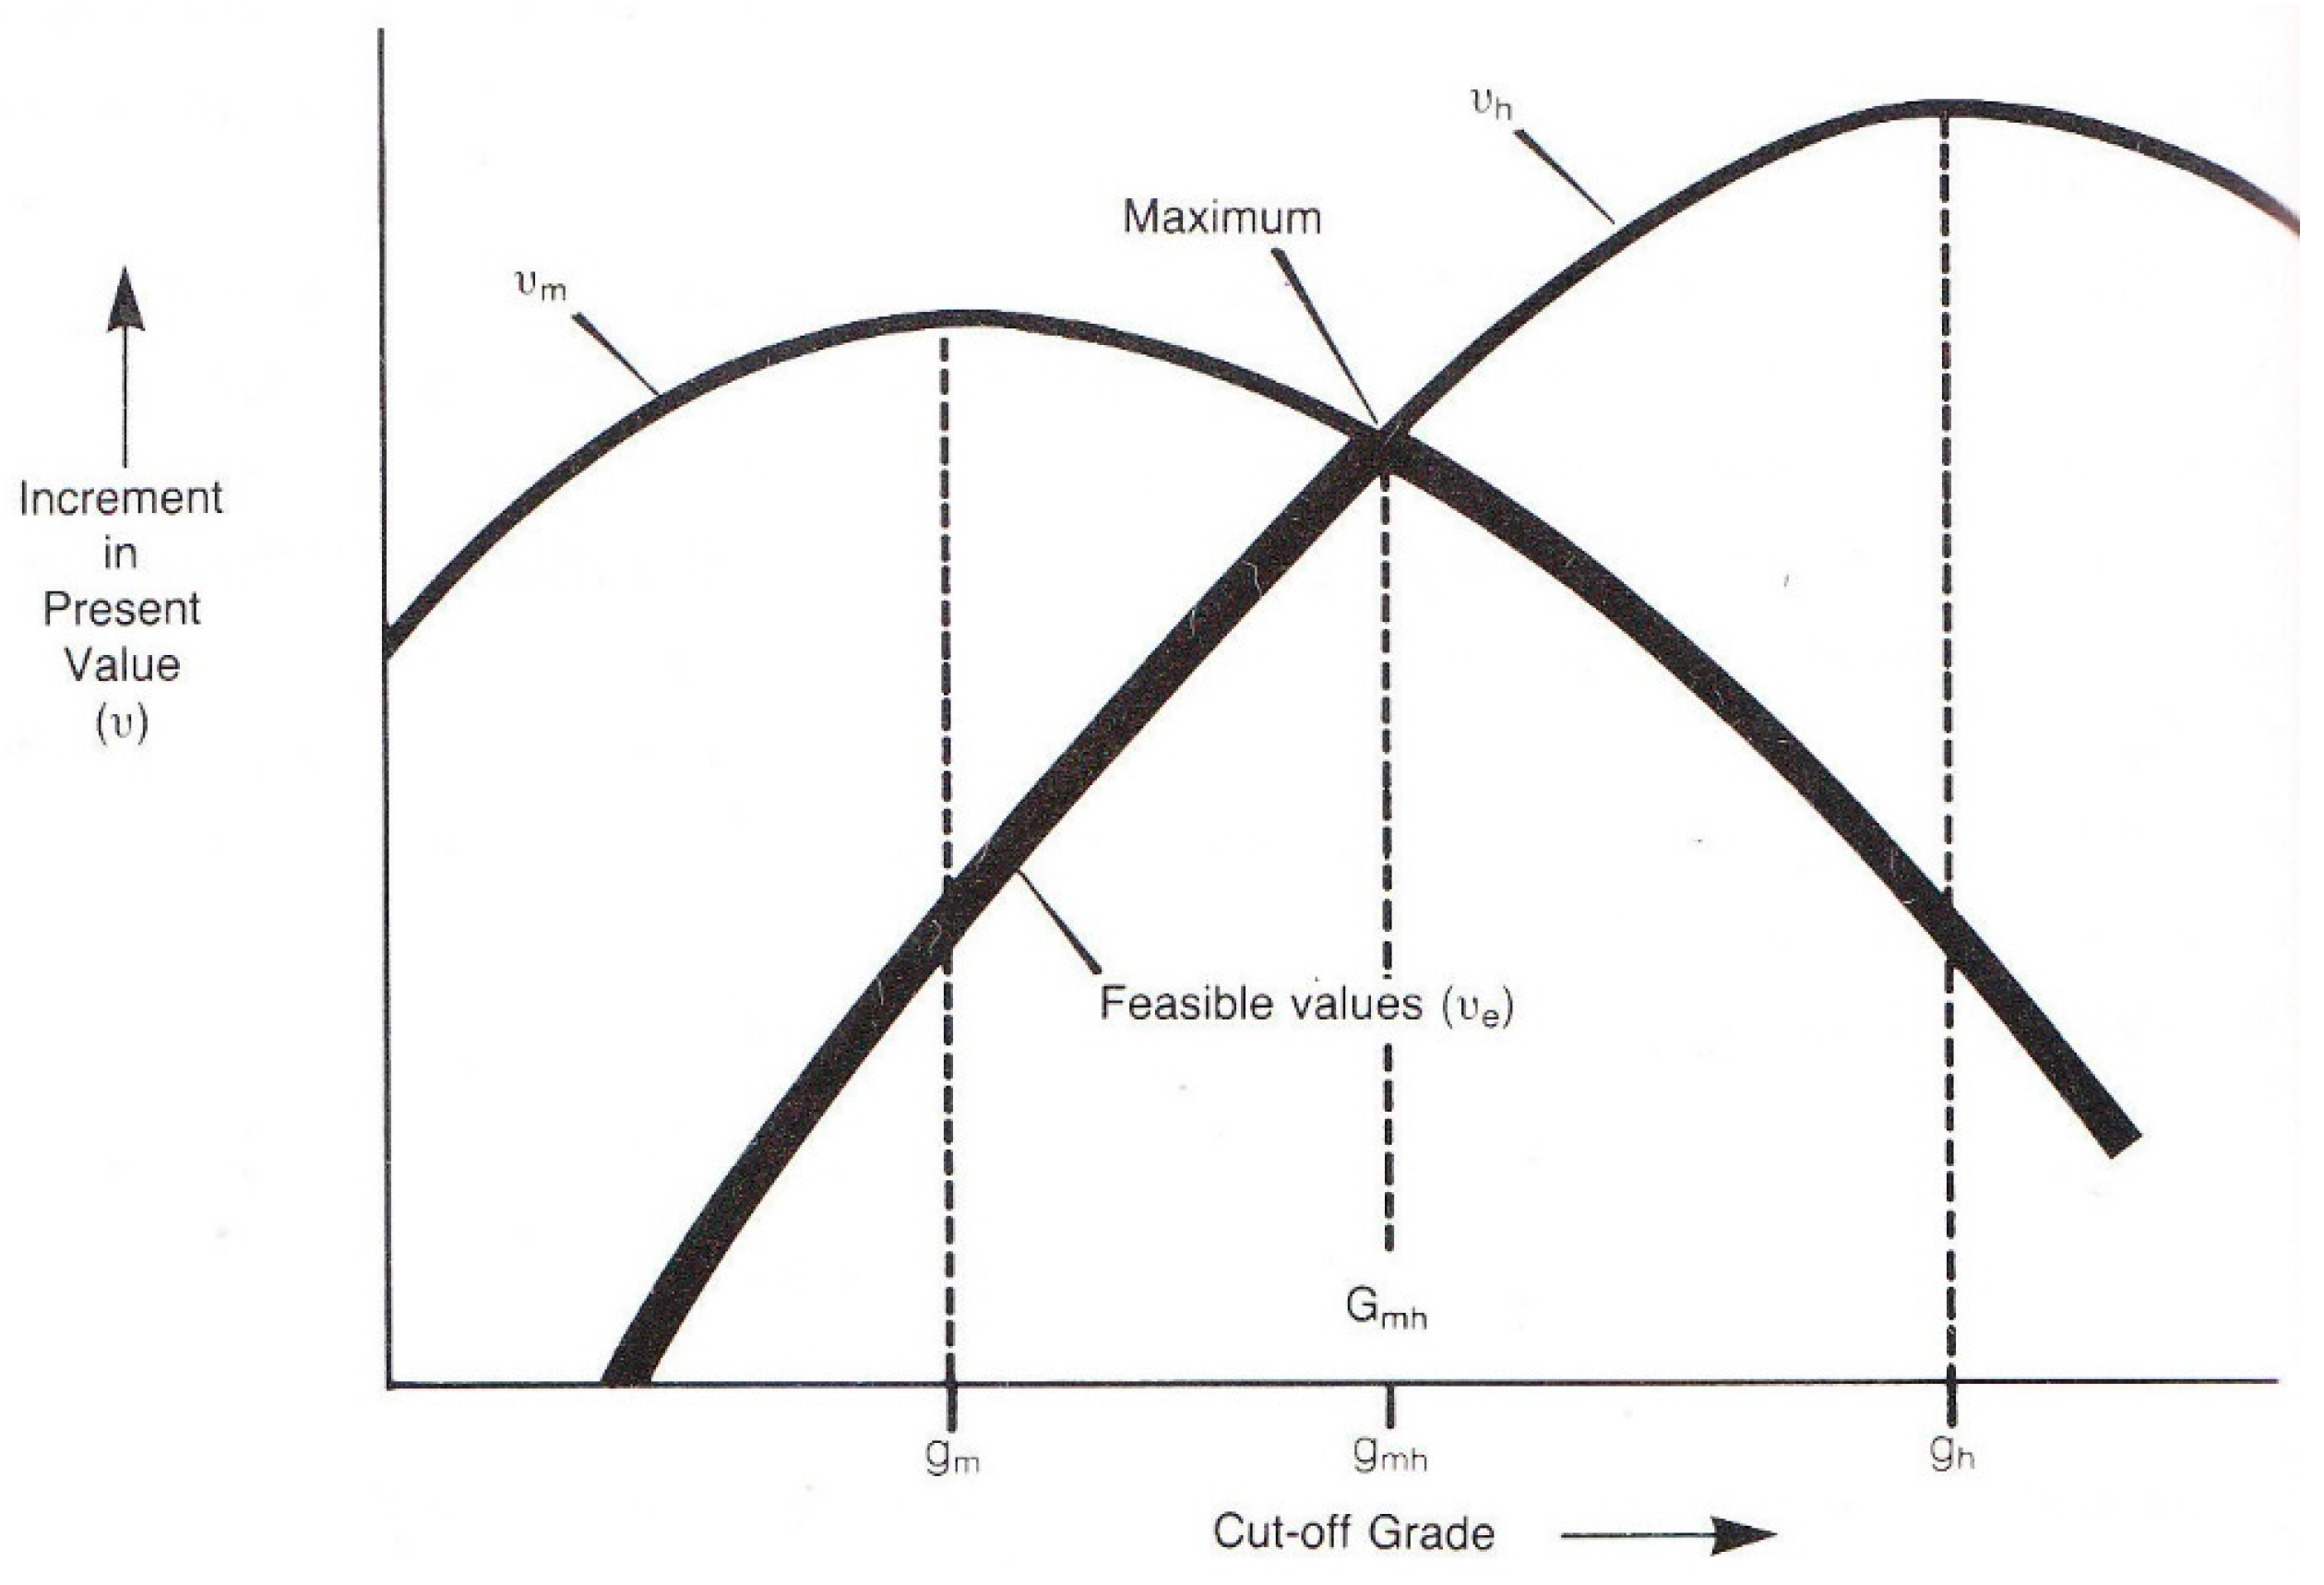
The cut-off grade influences not only the mill-head grade but also the tonnage. The higher the grade the lower the tonnage and vice versa. As will be described in Section 3.1 in general the tonnage of deposits increases non-linearly (disproportionately, above average) if the ore grade declines. The tonnage determines the capacity and, thereby, the investment and operating costs. Normally there is a decrease in specific investment costs and operating costs with an increase of throughput (economics of scale [8]). In parallel with the decrease of specific costs with higher tonnage, i.e., throughput, there is a decrease in revenues/tons of ore because of lower grades with the consequence that, normally, the cash flow, i.e., the difference between revenues and operating costs, also changes. If one—now in relation to varying cut-off grades—compares changing cash flows with changing investment costs in calculating NPV (see Equation (2)), one will find changing NPVs, respective to increments of NPVs as shown in Figure 2. Because the investment and operating cost structure of mining (m) and milling (h) differs, one will get a different curve for mining and milling and also different optima (Figure 2). Both curves intersect at which is the optimum. For cutoff grades less than the milling component is limiting and for cutoff grades above the mining component is limiting, resulting in the bold curve of feasible values shown in Figure 2.
To maximize the NPV is normally the goal in algorithms developed for optimal mine planning using methods of operations research and linear programming [14]. The orebody is discretized into a grid of blocks, which are characterized by grade, tonnage and other mineral properties, the value of the block which is the difference between the ore value and its extraction and processing costs and a geometric model i.e., the location of the blocks, determining the sequence of mining and haulage costs. For optimally estimating the grades of the blocks geostatistical methods like kriging are applied or more advanced methods like conditional geostatistical simulation of block compositions [15,16]. The developed algorithms are especially successful for optimizing block sequence decisions to design optimal open-pit limits. Algorithms have been developed to implement methods that account for geological uncertainty and simultaneously optimize the sequence of extraction of the mining blocks and the cut-off grade [17,18]. Case histories for phosphate open-pits have been described for example for open pit mines in the US and in Israel [19,20]. Similarly, for underground mines algorithms are available that find the optimum mining methods including cut-off grades again maximizing the NPV. Birch [21] gives an example to optimize cut-off grades for narrow tabular gold deposits in South Africa.
2.2. The Optimal Rate of Mining
2.2.1. Taylor’s Rule
Although theoretically it is advisable to mine an ore body as fast as possible to maximize return, there are constraints including technical conditions and market limitations. It has been observed that many such exercises based on the present value “show a bias towards high rates of working that are unachievable or undesirable in practice” [22].
In 1977, Taylor [22,23], a Canadian mining engineer, empirically developed formulae for an optimal lifetime (Formulas (3) and (4)):
where denotes ‘the lifetime in years’ and the ‘total reserve tonnage expected in units of [tonnes].’ This leads to an estimate of the daily production in tons per day (i.e., )
According to Taylor [23], this simple rule for a mine’s lifetime and, consequently, output is effective for many sizes and types of deposits down to a depth of 300–400 m, which includes all open pits. This means that the rule can be applied to phosphate deposits, open pits and underground mines of sedimentary and magmatic origin.
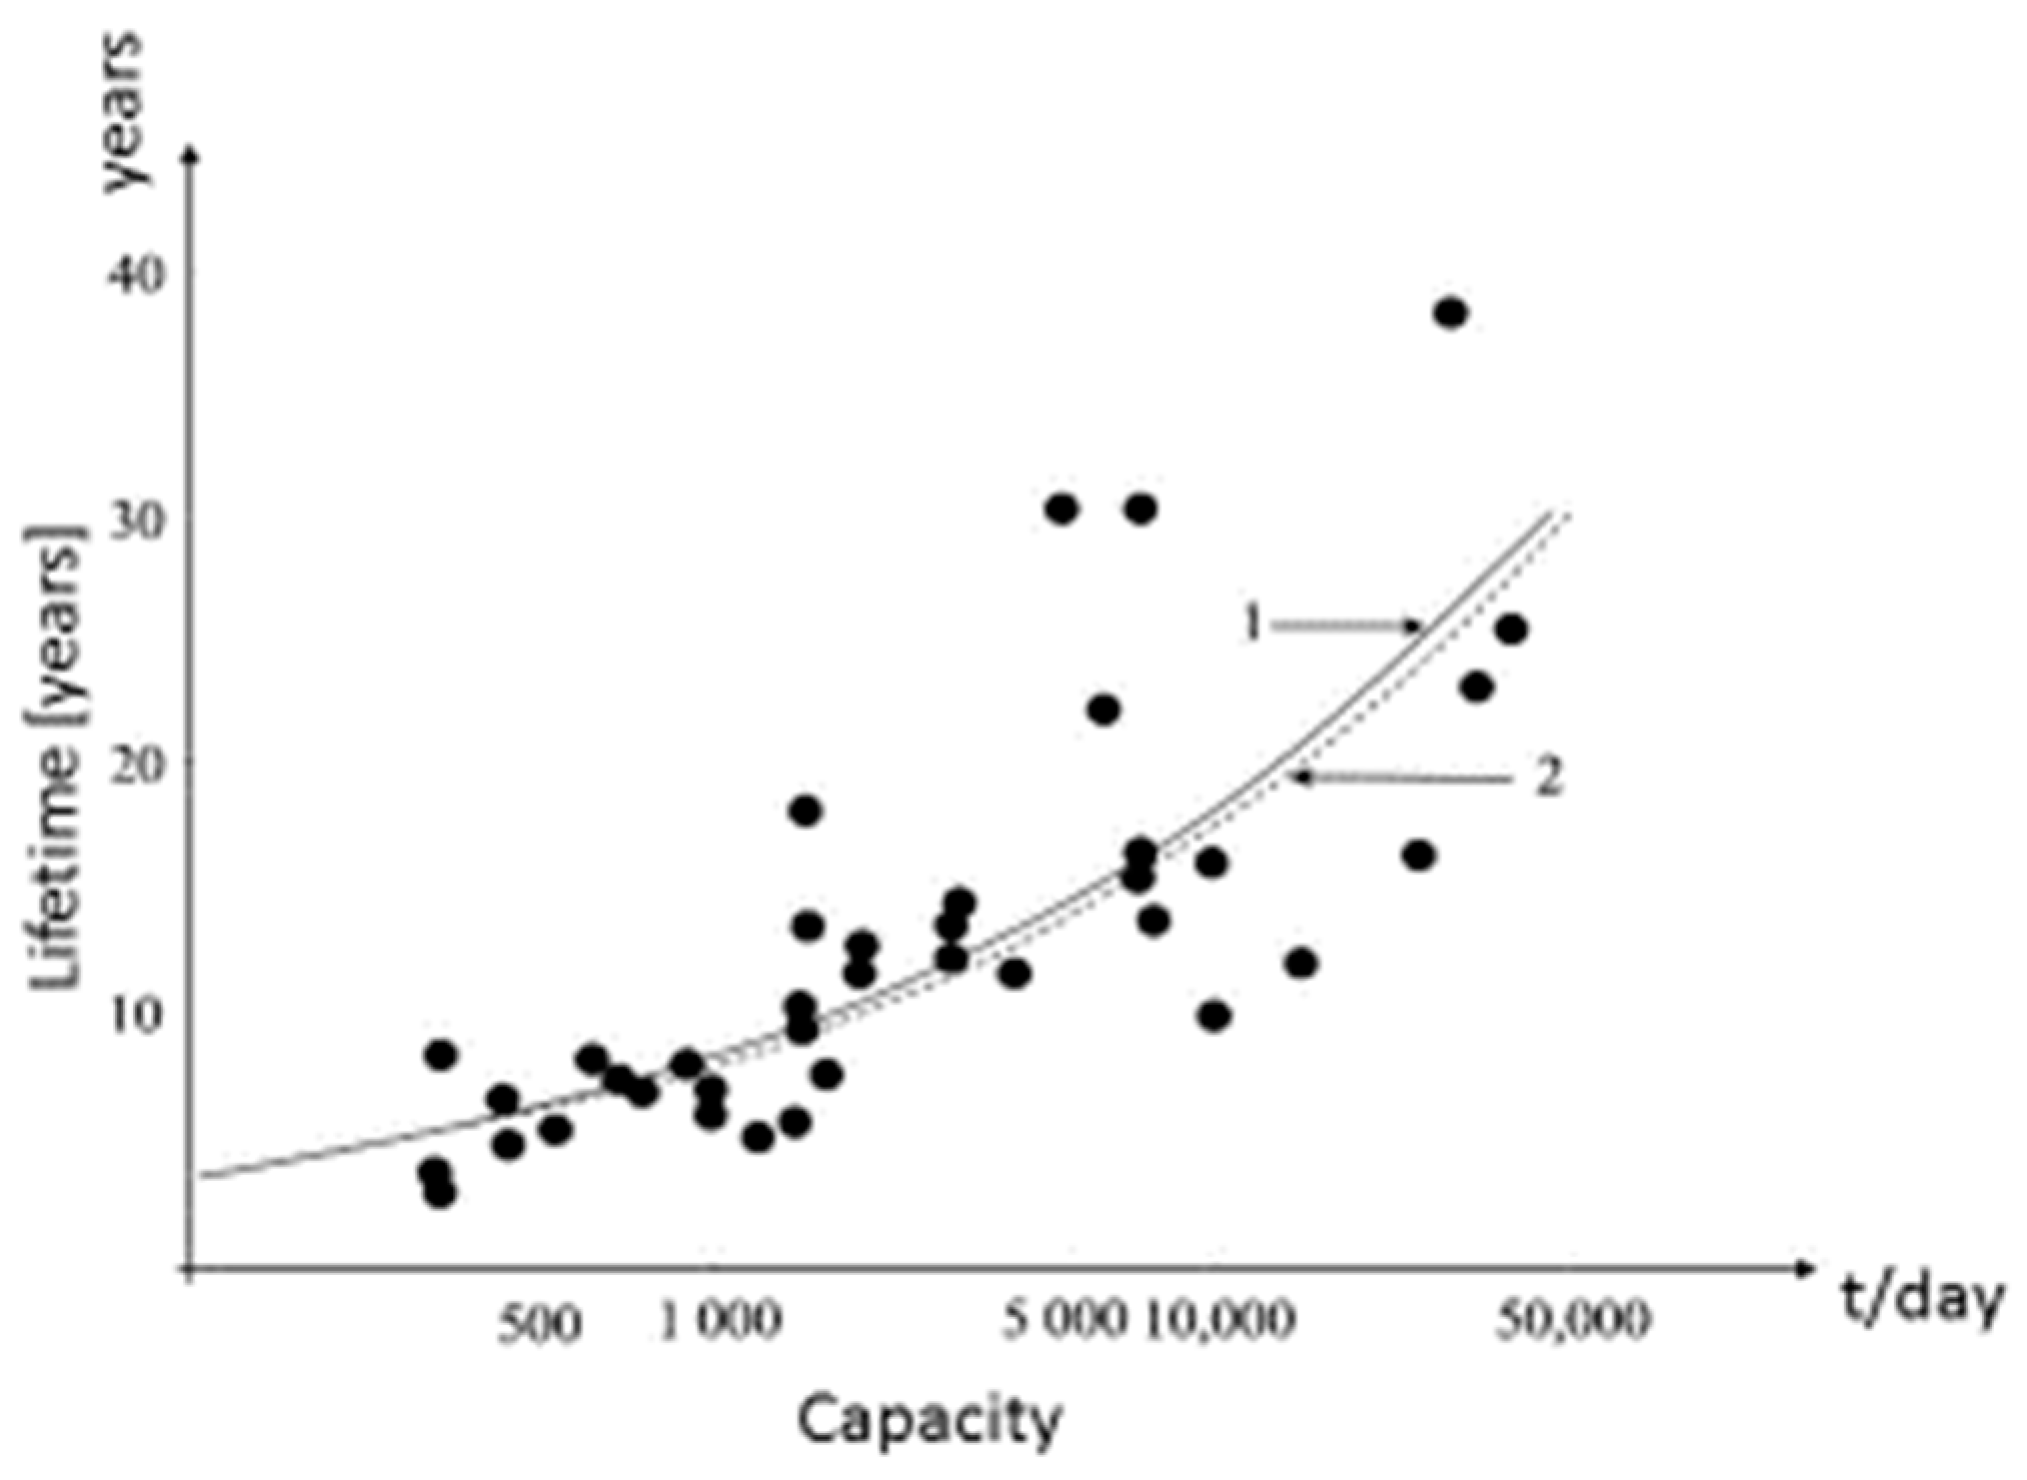
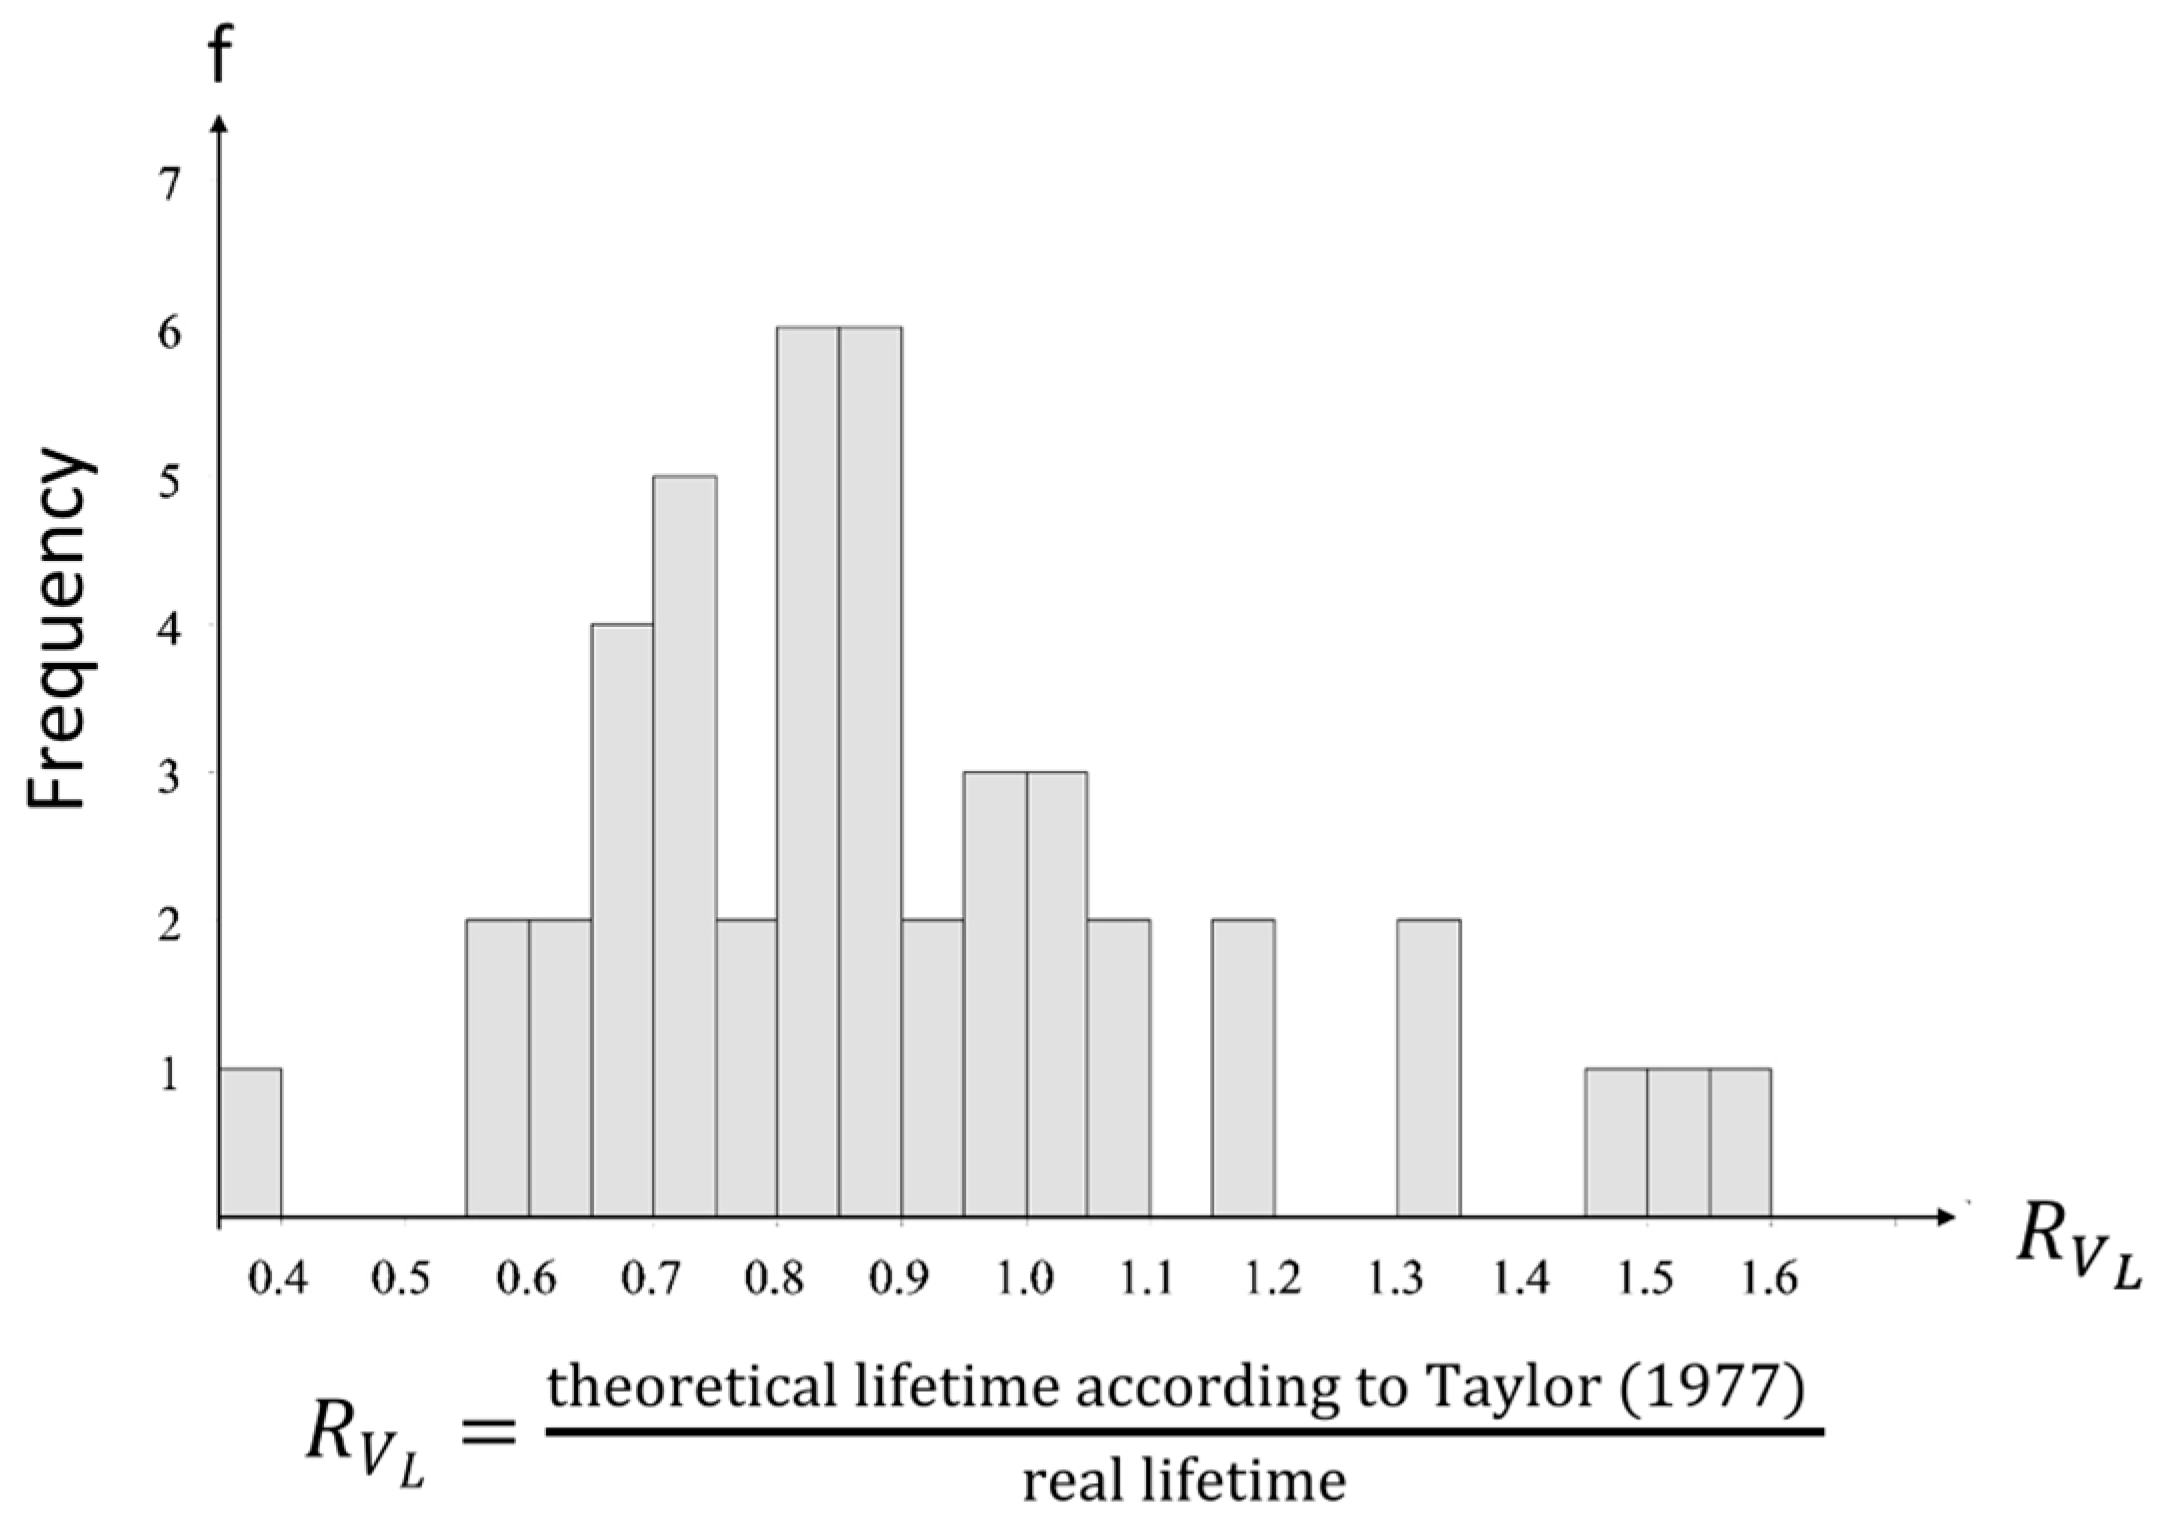
The theoretical formulae have been tested using actual mine data by various authors [24,25,26,27] who, on average, came to a general agreement but with many deviations due to special conditions in praxis. Wellmer [24,25] investigated Canadian base-metal mines at the stage of the investment decision (Figure 3); McSpadden and Schaap investigated porphyry copper deposits worldwide (Figure 4) [26]; and Long [27] provided a very large data set of 1195 mines of various commodities and ore-deposit types. For the Canadian base-metal mines, it was found that, although the data are widely scattered, there is, by and large, good agreement with the optimal production rates estimated by applying Taylor’s Formula (3) [22,23]. Figure 4 shows the porphyry copper data of McSpadden and Schaap [26]. On the x-axis in Figure 4 the ratio between the real lifetime and the theoretical lifetime according to Taylor [22] is plotted. In developing countries, the lifetimes follow the Taylor-rule less closely than in industrial countries [26]. It is suspected that in developing countries this is caused on the one hand by higher investment costs that require higher throughput as compensation and on the other hand by the desire of the investing mining companies to reduce the country risks with a shorter lifetime. Long’s [27,28] results were that Taylor’s three-quarter percent rule (Equation (4) above) was found to be too large in each instance, the proportional coefficient a being 0.65 for open pits and 0.56 for all other underground mines. He states, “The constancy of the coefficient over a range of commodities, deposit types, deposit sizes and time is consistent with Taylor’s intuition that physical factors limit mine capacity. Put simply, mine capacity can grow only about half to two-thirds of the rate of increase of reserves, which is significantly less than what mine planners, using net present value calculations, would likely choose”.
Concerning underground mines, which, in the case of phosphorus, would apply mainly to magmatic deposits, there is another rule of thumb based on practical experience. Operational experience shows that development work including shaft sinking should not exceed a certain percentage in comparison to the pure exploitation operating expenditures. The rate of depth penetration for larger mines should not exceed 30–40 m/year [8,22].
2.2.2. Should Learning Effects Influence Mine Capacity?
Whereas dynamic economic evaluation methods, as explained in Section 1, Introduction, favour short lifetimes, learning requires time. For deposits with limited extrapolability, like lenticular deposits, experience shows that during the course of mining, additional reserves are discovered. Cranstone [29] developed the concept of multiplicator factors and Wagner [30,31] examined the potential impact of future exploration success on the lifetime of a mine. He wanted to know whether any possible extensions to the lifetime of a mine due to future exploration successes should be taken into account at the planning stage (Figure 5).
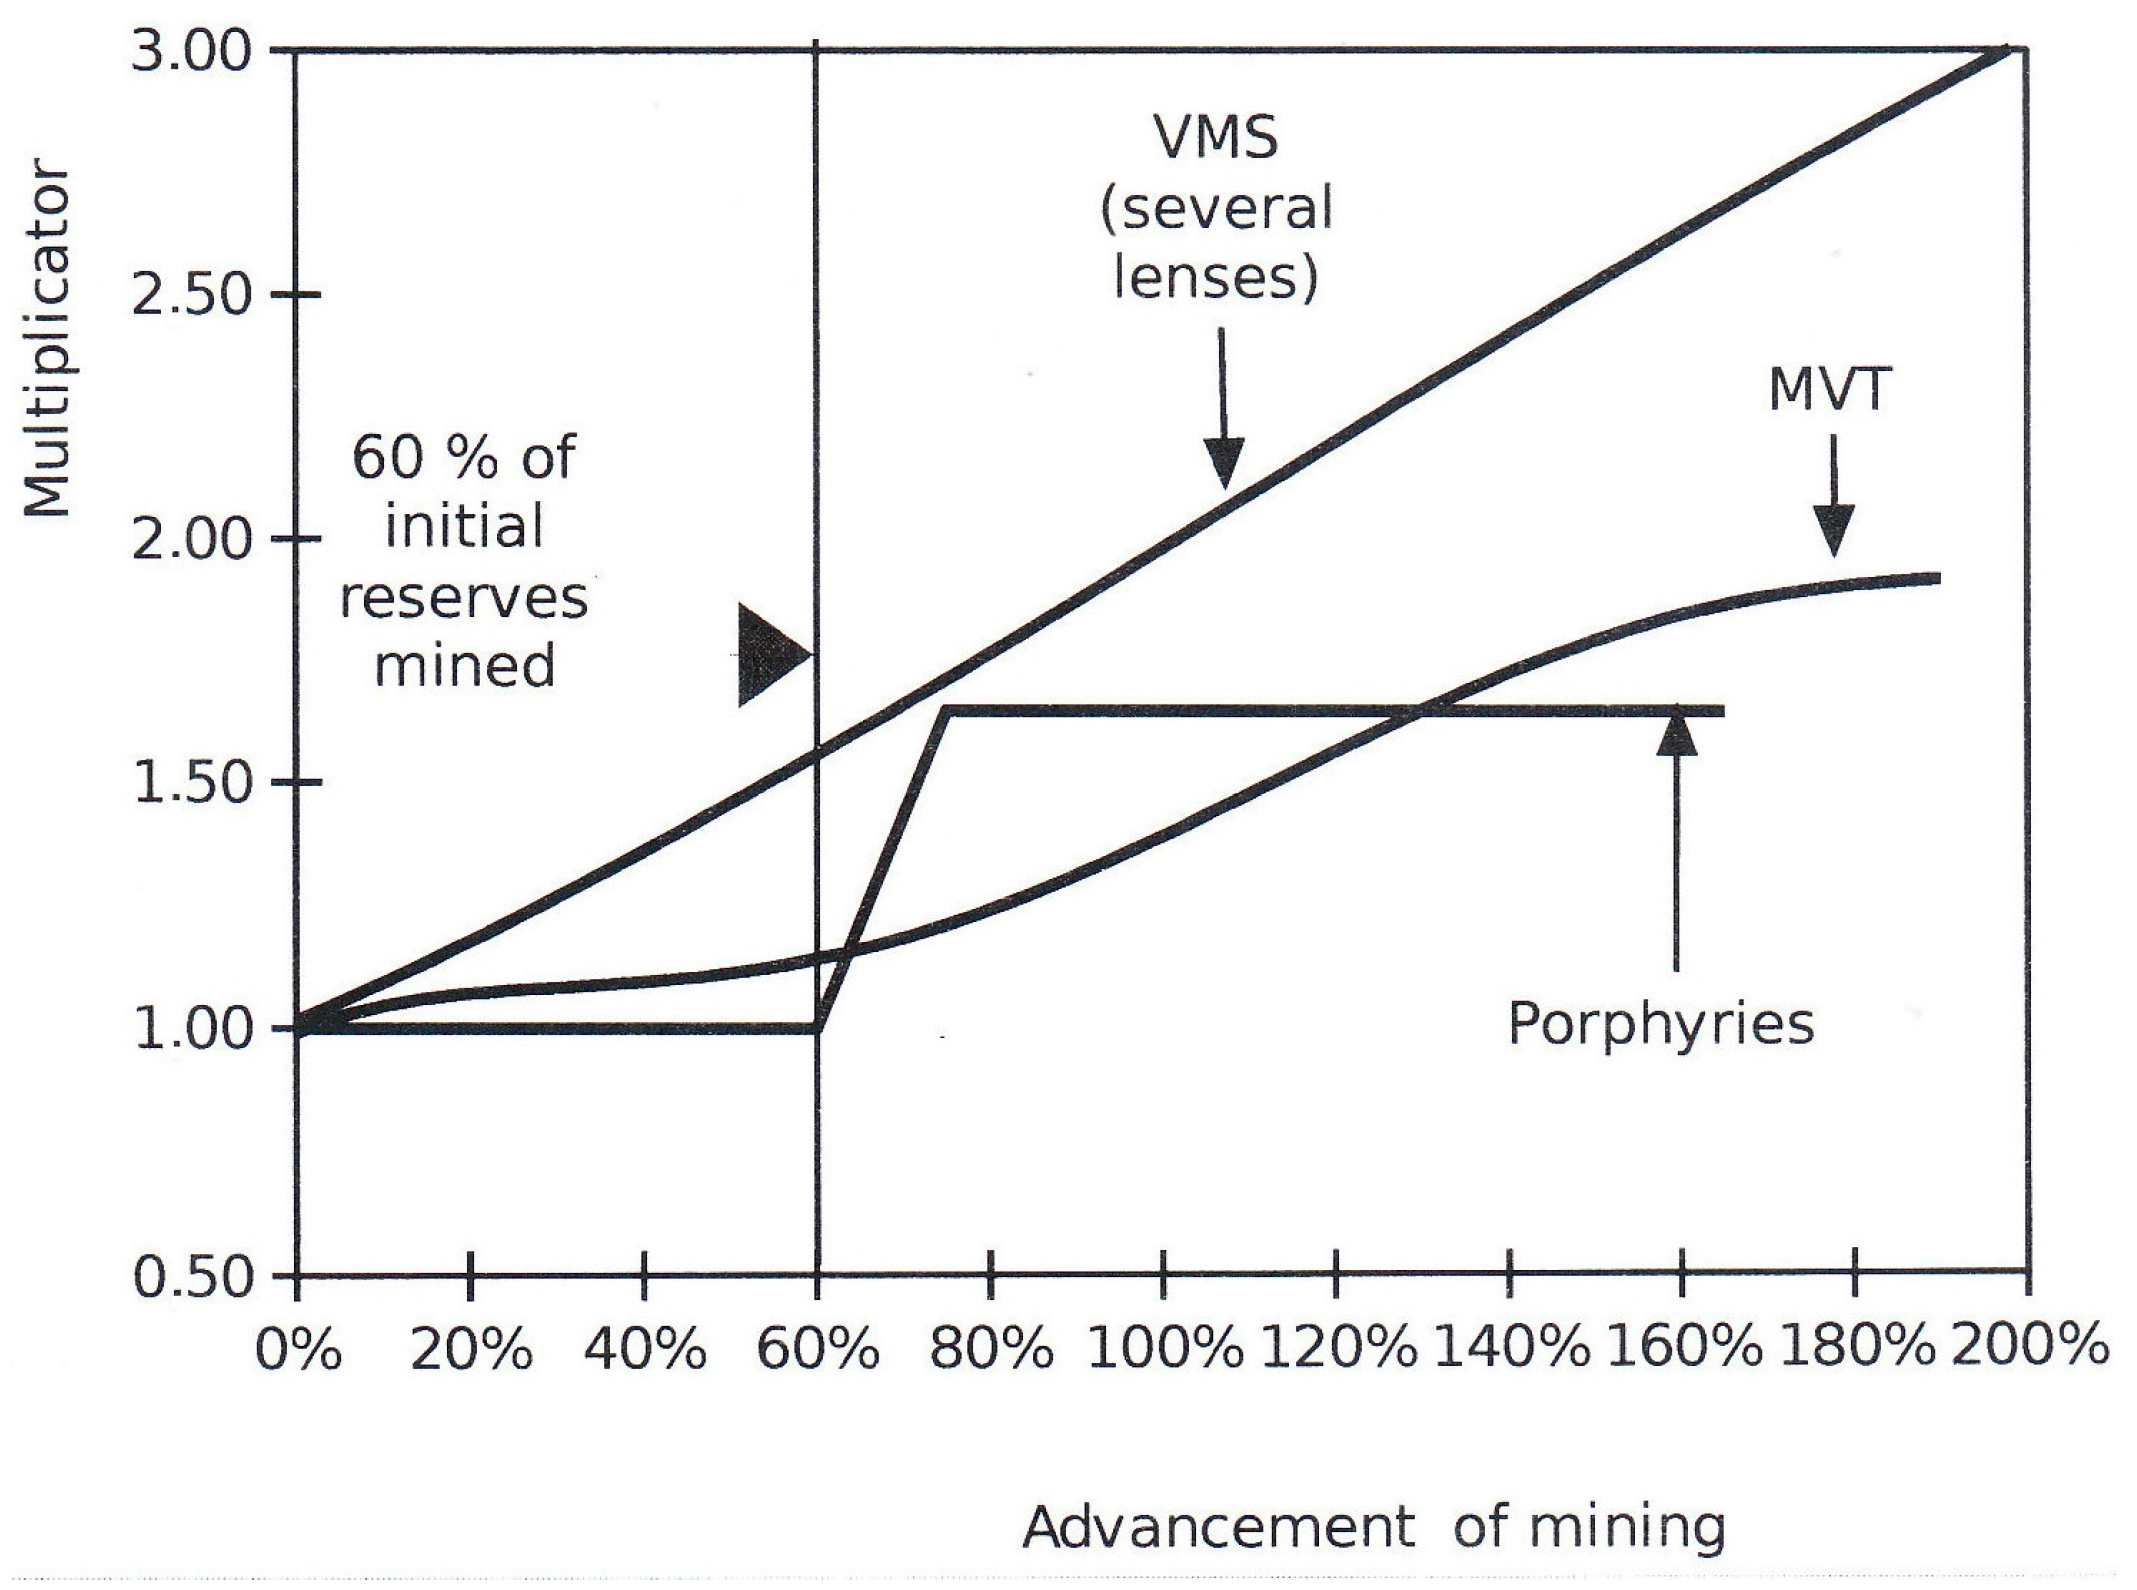
For all deposits that are not clearly defined over a whole concession area like coal seams but are irregular or lenticular, mining companies normally conduct exploration out of the cash flow of an ongoing mining operation to attempt to extend the mine’s lifetime as far as possible. During the course of mining and further exploration the understanding of an ore body increases, i.e., a learning effect occurs. The higher the mining company advances on the learning curve, the greater the chances of new discoveries. This presents a dilemma: Should one extend the operational life of the mining operation in the expectation of additional reserves, or speed up extraction from the start-up of the mine in the interest of economic efficiency? Wagner [30] studied the mining history and exploration successes in the course of the mining operations of a wide range of porphyry copper, Mississippi-Valley lead-zinc-ore- and polymetallic volcanogenic massive sulphide deposits. Figure 6 shows the average number of exploration successes expressed in multiplier factors against the reserves known at the investment decision, which ranges from 1.5 to 3 times the original reserves at the time of the investment decision. The factors developed by Cranstone [29] could be refined with information about the multiplicator development over time.
Although, thus far, phosphate deposits have not been studied, one aspect of learning most probably also applies to magmatic phosphate deposits with limited extrapolatibility. The learning, i.e., improving understanding about the ore body, must begin more or less immediately after the start of production and has to show results enlarging tonnage no later than when 60% of the initial (i.e., initially estimated) reserves have been mined (Figure 6), i.e., in order to have a chance to prolong the lifetime of the mine.
The conclusion of Wagner’s research [30,31] was that Taylor’s rule could still be applied in such cases: There is no economic justification for extending the lifetime of a mine by decreasing the economic optimal exploitation rate to gain a better chance for exploration successes. The learning effects of continued exploration during the mining operation have no influence on the optimal lifetime.
2.2.3. The Constraint of Marketing Possibilities
For sedimentary seam deposits of phosphate, which can be extrapolated over large distances and large concession areas, the constraints are often marketing possibilities for low-value commodities. For such deposits, rules of thumb from similar strata-bound sedimentary deposits can be used. Lütkehaus, a cement-industry expert, presented such figures from experience [32] and reported data in Wellmer et al. [8]. Typical lifetimes and figures for resources, which can provide an orientation for sedimentary phosphate deposits, are shown in Table 1. By applying “modifying factors” (mining, metallurgical, economic, marketing, legal, environmental, social and governmental factors) [33], these resources can be converted into reserves.
Although a phosphate deposit can be compared only in certain ways to limestone and gypsum deposits, one conclusion can be drawn: The lifetime for such a seam deposit with a large areal extent should be at least 25 years.
2.2.4. Should Price Fluctuations Influence the Planning of a Mine’s Lifetime?
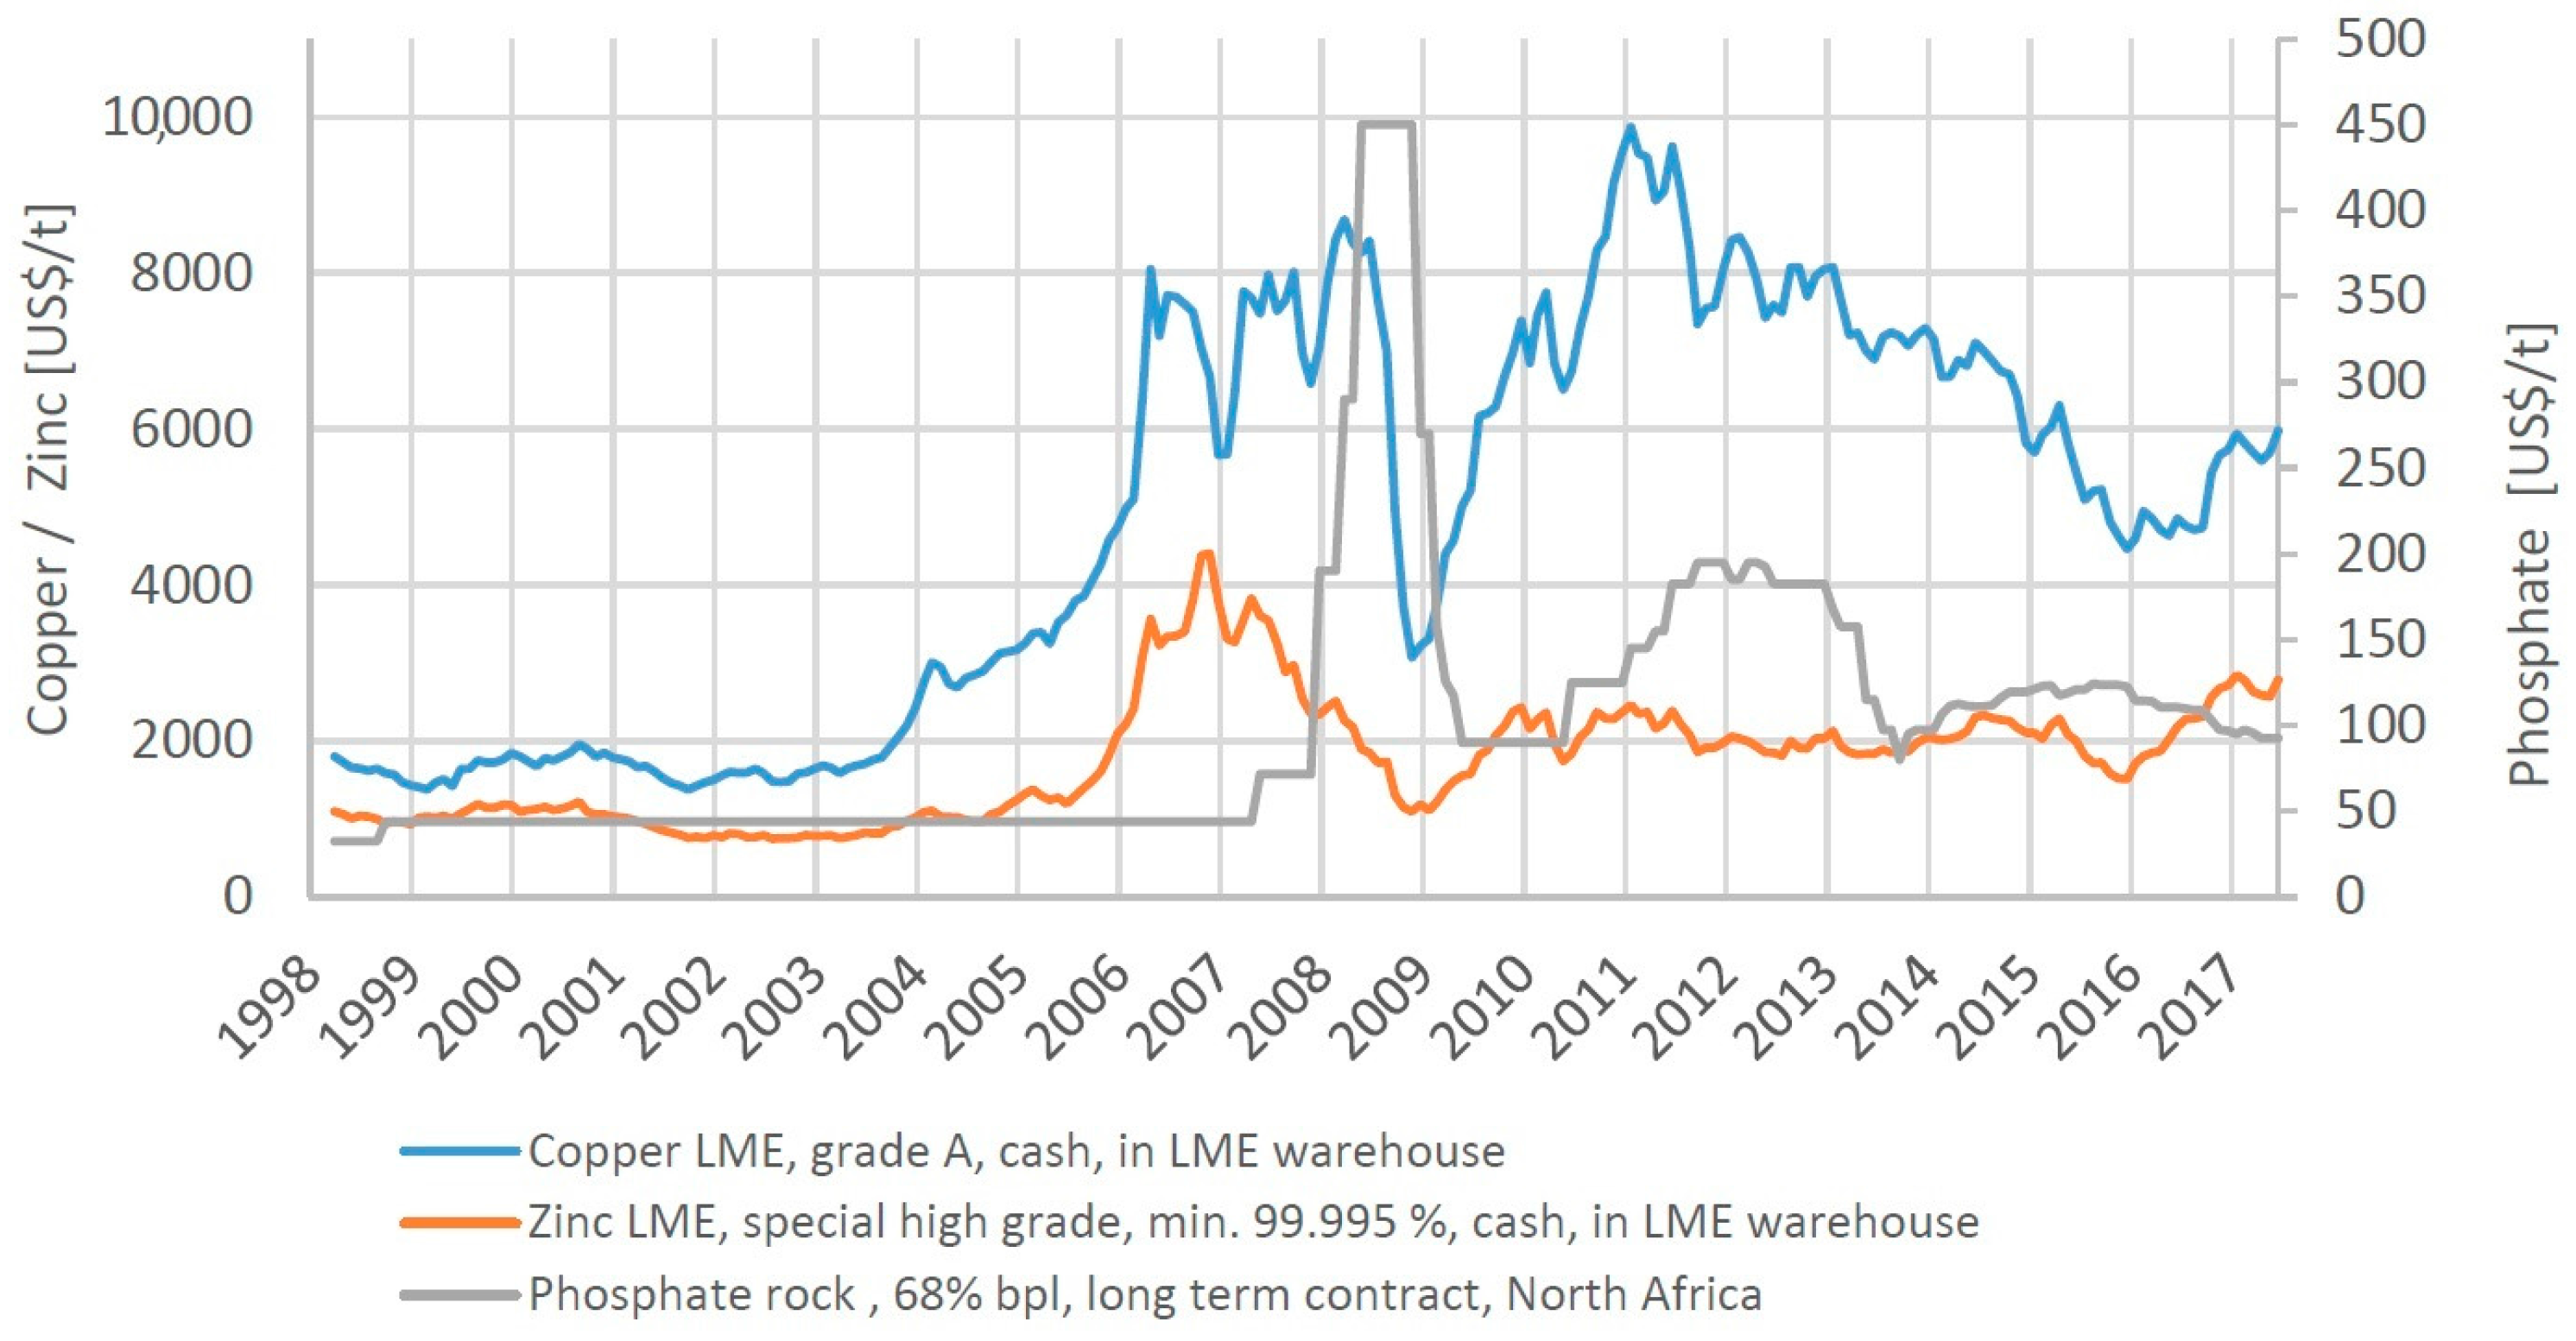
Raw material prices fluctuate. This is especially true for commodities traded on stock exchanges such as copper, zinc, or nickel on the London Metal Exchange (LME) (Figure 7). Phosphate is traded mainly on the basis of producer prices. Over longer periods, prices stay constant but they are influenced by demand and supply too and show price peaks (Figure 7).
One would assume fewer price variations for a commodity with producer prices than with exchange prices that fluctuate daily. However, the statistics for phosphate compared to copper and zinc show the opposite results for the last 20 years, with a coefficient of variation 50–60% higher for phosphate than for copper and zinc (Table 2). The coefficient of variation is
whereby is the standard variation and is the mean, in this case of the monthly price averages.
Although this is neither a direct aspect of supplying society with phosphate fertilizer or of sustainability, an operator of a phosphate mine might be tempted to extend a mine’s lifetime in the hope of benefiting from price increases, thereby potentially contributing to the sustainability aspect. However, at times of high prices, it would be tempting for any operator not to use low-grade stockpiles as suggested in [11] in regard to sustainability but to upgrade his or her operation in order to reap maximum benefits from a price peak.
As can be assumed from Figure 7, the higher variation coefficient is due partly to the 2008 price peak. This price peak is related to one around the same year that affected many commodities but particularly those related to the food market [34]. Specific factors of (Indian) trade and subsidies for the specific peak of phosphorus have recently been identified and analysed [35].
3. The Aspect of Sustainability for Defining the Lifetime of a Mine
3.1. Principal Considerations
As introduced in Section 1, the principle of intergenerational fairness is generally accepted as a starting point for achieving sustainable development, with the aim of ensuring that every future generation the privilege of being as well off as the preceding one [1,36]. We are looking far into the future, when investigating paths to the sustainable use of non-renewable mineral raw materials, because sustainability is a long-term concept that must be maintained over generations for as long as humans exist [37,38].
Regarding non-renewable resources, humankind has to recognize that there is only one Earth and that it has limits. In addition, it must be recognized that exploring new deposits is expensive. Therefore, once raw materials have been discovered, it makes sense to use them to the maximum extent [39].
In Section 2.2.2, we looked into the future and questioned whether future learning effects about reserve extensions should be considered when determining the lifetime of a mine. This examination of future aspects shall also be done for the cut-off grade determining ore and waste. The cut-off grade is an economic parameter, and, therefore, we have to consider future outlook for the economic parameters of price and cost.
It can be observed that, for most major commodities, real prices since the end of WW I did not increase but stayed more or less constant for 100 years (or even decreased, for example, in the case of aluminium), as shown in Figure 8 with the example of copper. For the real price, the inflation effect of nominal prices must be corrected by an inflation index, in this case, the US Consumer Price Index (CPI). This means, of course, that the nominal price increased over the span of a century. But despite constant price development, on average, over 100 years, the grade did not increase but decreased as shown in Figure 8. This means that, due to technological developments, the cost to mine lower and lower grade ore has decreased. In the last century, the average copper grade declined from about 2% to 1% without an increase in the Cu price in real terms [40,41]. One of the lowest grade successfully mined today is from the Aitik Mine in Sweden, with a head grade of 0.22% Cu [7]. However, it must be taken into account that normally copper mines have by-product credits. By-products for the Aitik mine are gold and silver, increasing revenues by 30 to 40%, estimated from the annual report [42]. Moreover, it should be stressed that the decrease was not caused by the need to mine lower-grade deposits but by technological capabilities enabling companies to mine such lower-grade deposits economically at constant prices in real terms, meaning a learning effect has occurred.
In practice, a rule of thumb frequently realized is that the cut-off grade is about half of the average ore grade [8], i.e., parallel to decreasing average ore grade, the cut-off grade also decreases. A subsequent effect is that tonnage increases. In general, the tonnages of deposits increase non-linearly (disproportionately, above average) if the ore grades decline.
It is possible to define the tonnage increase for mathematically defined grade distributions. For a log-normal distribution Samuel Lasky discovered a rule (“Lasky’s Law”) that the relationship between the cut-off grade and the average grade above cut-off is linear and that a linear decrease in grade is followed by a logarithmic increase in the cumulative tonnage of ore [45,46,47]. It can be observed that much geological and biological data are log-normally distributed [48]. Recent studies of more than 3000 well explored distributions of 17 metals show that less than 10% of all grade distributions “fail to be fit by the lognormal-distribution [49].” However, this might not apply to phosphate deposits. According to the authors’ knowledge, no study exists that examines how well phosphate grade distributions can be fitted to the log-normal distribution and, therefore, Lasky’s law is applicable. The main phosphorus mineral is apatite with a P2O5 content of 41 to 42.3% [50]. The grades of sedimentary phosphate deposits are usually higher than 50% of the theoretical upper grade. The probability, therefore, of a much-skewed grade distribution is not very high. For magmatic deposits with grades below 10%, this might be different [51].
Although we do not know the exact mechanism by which reserves increase by lowering the cut-off, we can draw conclusions for aspects of sustainability, i.e., maximizing resource efficiency. The more we can lower the cut-off grade, the more we can increase the reserves for the supply of phosphorus for mankind and the longer a mine’s lifetime can be extended. This also has economic impacts because it reduces replacement costs. The replacement costs for huge stratabound phosphate deposits, in Morocco, for example, might be quite low but this is not the case for magmatic phosphate deposits. We are not aware of published figures for phosphate deposits, however as a rule of thumb, replacement costs in the mining industry vary between 2% and 5% (e.g., for gold [52]).
3.2. Practical Applications for the Definition for Cut-Off Grades
In Section 2.1, we considered various cut-off grades, their influence on investment and operating costs and on NPV and how to optimize them. Looking at cut-off grades from the aspect of sustainability, the lowest possible cut-off grade should be chosen that still enables an economic operation but maximizes reserves. This is an operating cost cut-off, i.e., a cut-off grade that covers all operating costs but no capital costs, also called a break-even cut-off [13]. In practice, such a cut-off is frequently applied [8], thereby optimizing the lifetime of a mining operation under sustainability aspects.
Phosphate deposits are mined mostly in open-pit operations. Open-pit operating costs largely depend on the waste:ore ratio. The final depth of an open pit is often determined by an operating-cost cut-off, the so-called marginal stripping ratio, defined as the maximum allowable waste:ore ratio beyond which the operation becomes uneconomic. Hereby, we have to distinguish between a hanging-wall and a footwall cut-off [8]. For the definition of the hanging-wall cut-off, one must remember that, at any rate, the material, whether ore or waste, must be extracted, loaded and transported, i.e., mining costs will accrue regardless of whether ore or waste is mined. Therefore, an operating-cost cut-off takes into consideration only the additional costs, i.e., the beneficiation costs.
Extending the concept of maximizing reserves, taking into account price fluctuations as discussed in Section 2.2.4 and learning effects with regard to operating costs, one should operate with low-grade stockpiles that can be processed at economically favourable times, as suggested by [11]; doing so could also extend the lifetime of a mine. A totally different and even more forward-looking approach, is taken in the examples described below by the Anthropogenic Resources Working Group of the Expert Group on Resource Classification (EGRC) of the UN Economic Commission of Europe (UNECE) [53] and by Scholz and Wellmer [7].
3.3. Concept of the Anthropogenic Resources Working Group of the Expert Group on Resource Classification (EGRC) of the UN Economic Commission of Europe (UNECE)
Based on the UNECE definition for geothermal energy resources, the Anthropogenic Resources Working Group of the Expert Group on Resource Classification (EGRC) [53] defines project lifetime as follows:
The Project Lifetime will be the minimum of the economic limit ... The ‘economic limit’ is defined as the time at which the Project reaches a point beyond which the subsequent cumulative discounted net operating cash flows from the Project would be negative. For an Extraction Project, the economic limit may be the time when the expected extraction rate declines to a level that makes the Project uneconomic, or when it is uneconomic to invest in further extraction infrastructure such as additional recycling plants.
Although this definition stems from practically unlimited reserves but with declining quality (heat value), as in the case of geothermal energy and, regarding recycling, by more or less continuous replenishment of secondary material, one could extend the definition to mining under the aspects of sustainability.
Consider the following thought experiment: A high-grade deposit, , has been discovered with tonnage and grade , which can be mined economically. In addition, nearby there exists a low-grade deposit, , with tonnage c and grade . As a stand-alone operation, it is uneconomic. However, by blending ore from the uneconomic deposit, , with the high-grade deposit, A, one could still achieve a profitable operation but with a lower and . Is it justified? Not under purely economic conditions; however, under sustainability aspects and social aspects, prolonging the lifetime despite sacrificing a certain economic level can make sense. Indeed, once a company has invested in a mining operation as well as infrastructure—especially housing in remote areas such as those in Canada or Australia—the aim of a responsible mine manager is to maximize the mine’s lifetime, mainly for social reasons.
A useful example is the Nanisivik Mine at the northern end of Baffin Island in Canada, a lead–zinc mine in carbonates 750 km north of the Arctic Circle and Canada’s first mine in the high Arctic, as well as one of the most northerly mines in the world and located about 20 km from the Inuit village of Arctic Bay [54]. The Canadian government was interested in developing employment opportunities for the Inuit population and supported infrastructure, such as building an airport, with the condition that the mining operation would last at least 13 years. In the end, the operation lasted for 26 years, from 1976 to 2002.
3.4. Development of a Discounting Factor under Sustainability Aspects
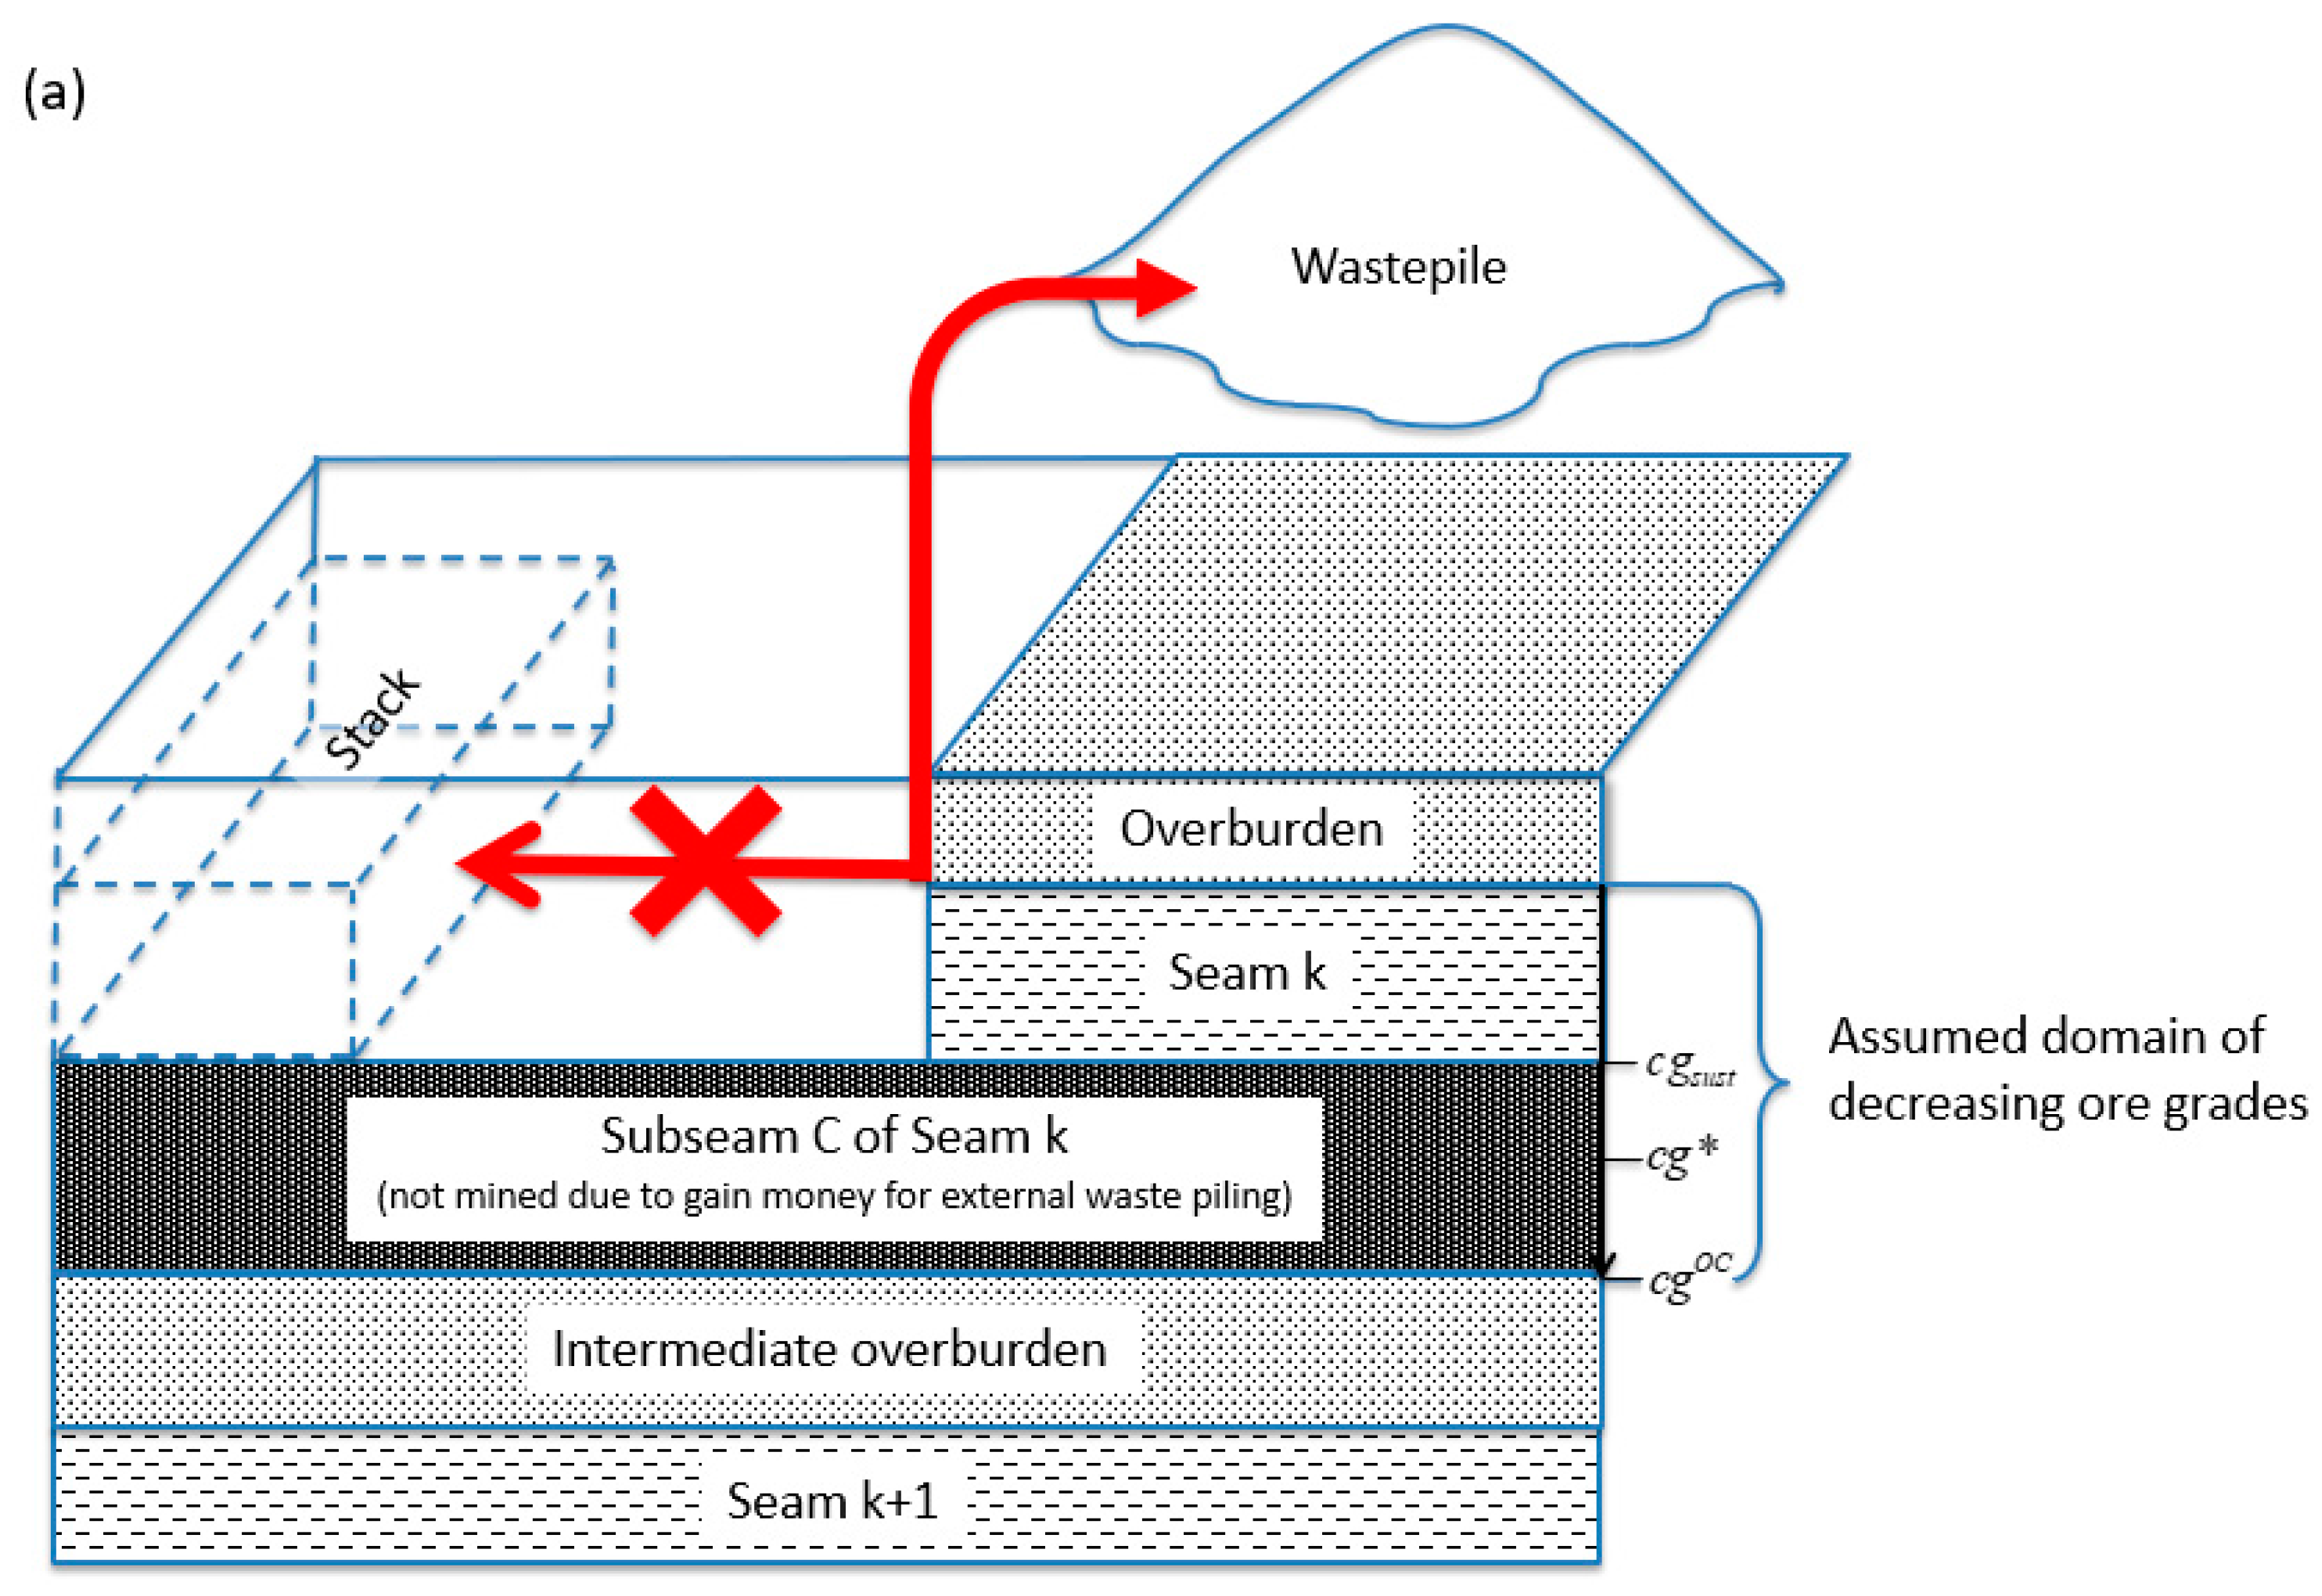
In Section 1, we discussed two dynamic economic evaluation methods, net present value () and internal rate of return (). In the method, a discounting factor is determined such that investment I equals the sum of the discounted annual net cash flows NC (Equation (2)). In this approach, only economic parameters based on costs and prices forecast for the lifetime of the mine influence the discounting factor. We will discuss an approach for developing a discounting factor with a thought experiment taking into account future sustainability aspects, with a phosphate seam model mine, an open-pit mine with multiple seams, more or less flat lying—and thereby extending the life of the mine (Figure 9a). This is similar to Rendu’s opportunity-cost cut-off approach [13]. These ideas were first presented by the authors in [7]. The reader may follow the second part of Box A in the Introduction.
We must stress that this is a model that in a real life situation would have to be adjusted to the then existing frame conditions. It requires for example space and the freedom to move overburden to far-off locations (which is the situation in arid or semiarid areas, e.g., many North African deposits), availability of equipment, and a legal framework allowing an open pit mine remaining open for an extended period. The lignite mining operations in the Cologne area of Germany might serve as an example of how this can be done. There overburden is removed to locations often farther away from the mining front. A populated area, many constraints have to be taken into account (villages, infrastructure like rail, roads or electric transmission lines) to reach practical solutions [55,56].
For running the mining operations, mining companies have to assess a cut-off grade that either maximizes the rate of return of the capital invested, Another common option is to define the cutoff grade based that covers the operating costs (index OC). This cut-off grade maximizes the mining rate. Naturally, as discussed above, also cut-off grades in between are meaningful. Let us consider a mining company which takes a very forward-looking perspective that takes an intergenerational equity approach. This is unusual in common practice. The mining company is supposed not only (i) to put lower-grade material on low-grade stockpiles in order to beneficiate later at times of higher prices if possible (see Section 3.2); The company is (ii) aiming to utilize deeper seams (e.g., Seam ) that are today below cutoff at some point in the future. The situation is that, with either of the cut-off grades, it can go to a certain depth but—when following an economic strategy—then the remaining phosphate seams stay in the ground. The company then may hope to mine these phosphate seams later when the technology has improved and/or higher prices are available on the market. If the company is able to mine these lower seams effectively and efficiently in the future without the costs for having to move the overburden material that has been removed during the first round of mining, there will be an increase the sustainable present cut-off grade. We denote this cut-off grade as .
The key idea of the presented case is: the mining company can increase the tolerable specific operating costs per ton of ore by increasing the cut-off grade to ,. This provides extra gains. Thus, higher operating costs can be covered and the mining company can remove all the overburden material and transport it to a distant area with no phosphate rock. This implies that the company is not burdening a future mining operation with old waste dumps. The follow up mining can be done with a reduced stripping ratio and lower costs for future operations. This has the consequence that the mining company has to apply another mining method. The dragline technology cannot be used, because it deposits the overburden close to its working area. Technologies must be used that remove the overburden to areas farther away like bucket wheel excavators and belt conveyors used in the German lignite open pit mines or even very large trucks like for example in copper open pit mines. This opens opportunities when prices might have improved or new cheaper technologies are available. The company can start again “with a clean slate”. Practically the company is in the same position as it was when it started the first round of mining to mine the virgin deposit. The average grade of the mineable deposit is the only difference. In the first round, it was above. In the second round, it is , which is below . whereas in the first round it was above .
For a second round of mining there is the advantage that any investment costs incurred for the infrastructure and the beneficiation plant were previously covered by the first round of mining. The only investment costs to consider are the foregone cash flow of the first round, applying the higher cut-off grade, , instead of or (or one in between) and any maintenance costs until the start of the second round of mining. These can be considered as investments for the company’s future mining operations, and we can model this case (see Figure 9b).
For this case, we may formally assess the sustainable mining rate by the rationales of compounding and discounting. Let us assume that the company must wait years for the technology and/or prices to improve in order to justify beginning its second round of mining. According to reports, Moroccan company OCP may already have used this strategy for one of its large beds of deposits [39]. Then, the second round will begin in year and continue to year . This means that the mining operation for the second round would last for ) years. The year can be taken as the reference year for compounding and discounting for deriving a sustainability interest factor. The investment, must be compounded to the year . The sum of the annual cash flows may serve for the second-round mining operation of a year discounted to year . Of course, in our case, for discounting and compounding, the interest rate is the same. We can label this the sustainability interest rate, . The equation can be shortened Thus, we have an equation for calculating (assuming remains consistent during each annual mining operation; for the calculation, we use Formula (2)).
Since is a monotonically decreasing sequence and we can write
The presented fictive case took the industrial business management perspective. The basic idea and rationale is the assessment of a break-even point between the compounding of today’s investments and the discounting of future gains. Naturally, this has to be done under certain assumptions and specific constraints from the perspective of a mining company and the deposit. In the given fictive case, a second round of mining becomes possible as the average cut-off grades in the different regions of the world are declining [57,58]. The case was presented in the frame of the normal constraints of economic mining.
Given the presented case, we may ask the following question: is it possible to generally answer whether from a long-term sustainable development perspective the mining ratio should be decreased by increasing the cut-off grade to the level of ? Clearly this question is beyond the common planning horizon of any company if long-term is interpreted in this place as more than 100 years. We think that such long-term thinking or projecting does not allow for quantitative but rather, if any at all, qualitative or semi-quantitative reasoning. Although similar questions could be posed for other properties of mines, let us restrict to the mining rate and assume (see above) that the cut-off grade in the future, , is lower than that optimal cut-off grade today, (i.e., ). We may argue in this place that a decrease in today’s mining rate would have the impact that the likelihood of secondary mining in the future would increase and there is a positive effect on resource conservation. Such a strategy would reduce the mining in other places. and would most likely be considered as a sustainable action. Naturally, such action would reduce the gains and thus not meet the rationale of a common mining company. For doing this, mining companies would request some proper legislative framework or governmental compensation. We may consider the latter as a new form of external costs. Yet, also the opposite argumentation can be applied. We may similarly argue that we should increase today’s cut-off grade. This would imply that the mine becomes less excavated. This was illustrated as for open pit mining in the above example. We may assume that this would increases the likelihood that future generations would mine the remaining phosphate rock with a more efficient method. Today, this would result in mining at other places with the consequence that more money has to be spent now to replace that part of the reserves saved for the future.
4. Discussion
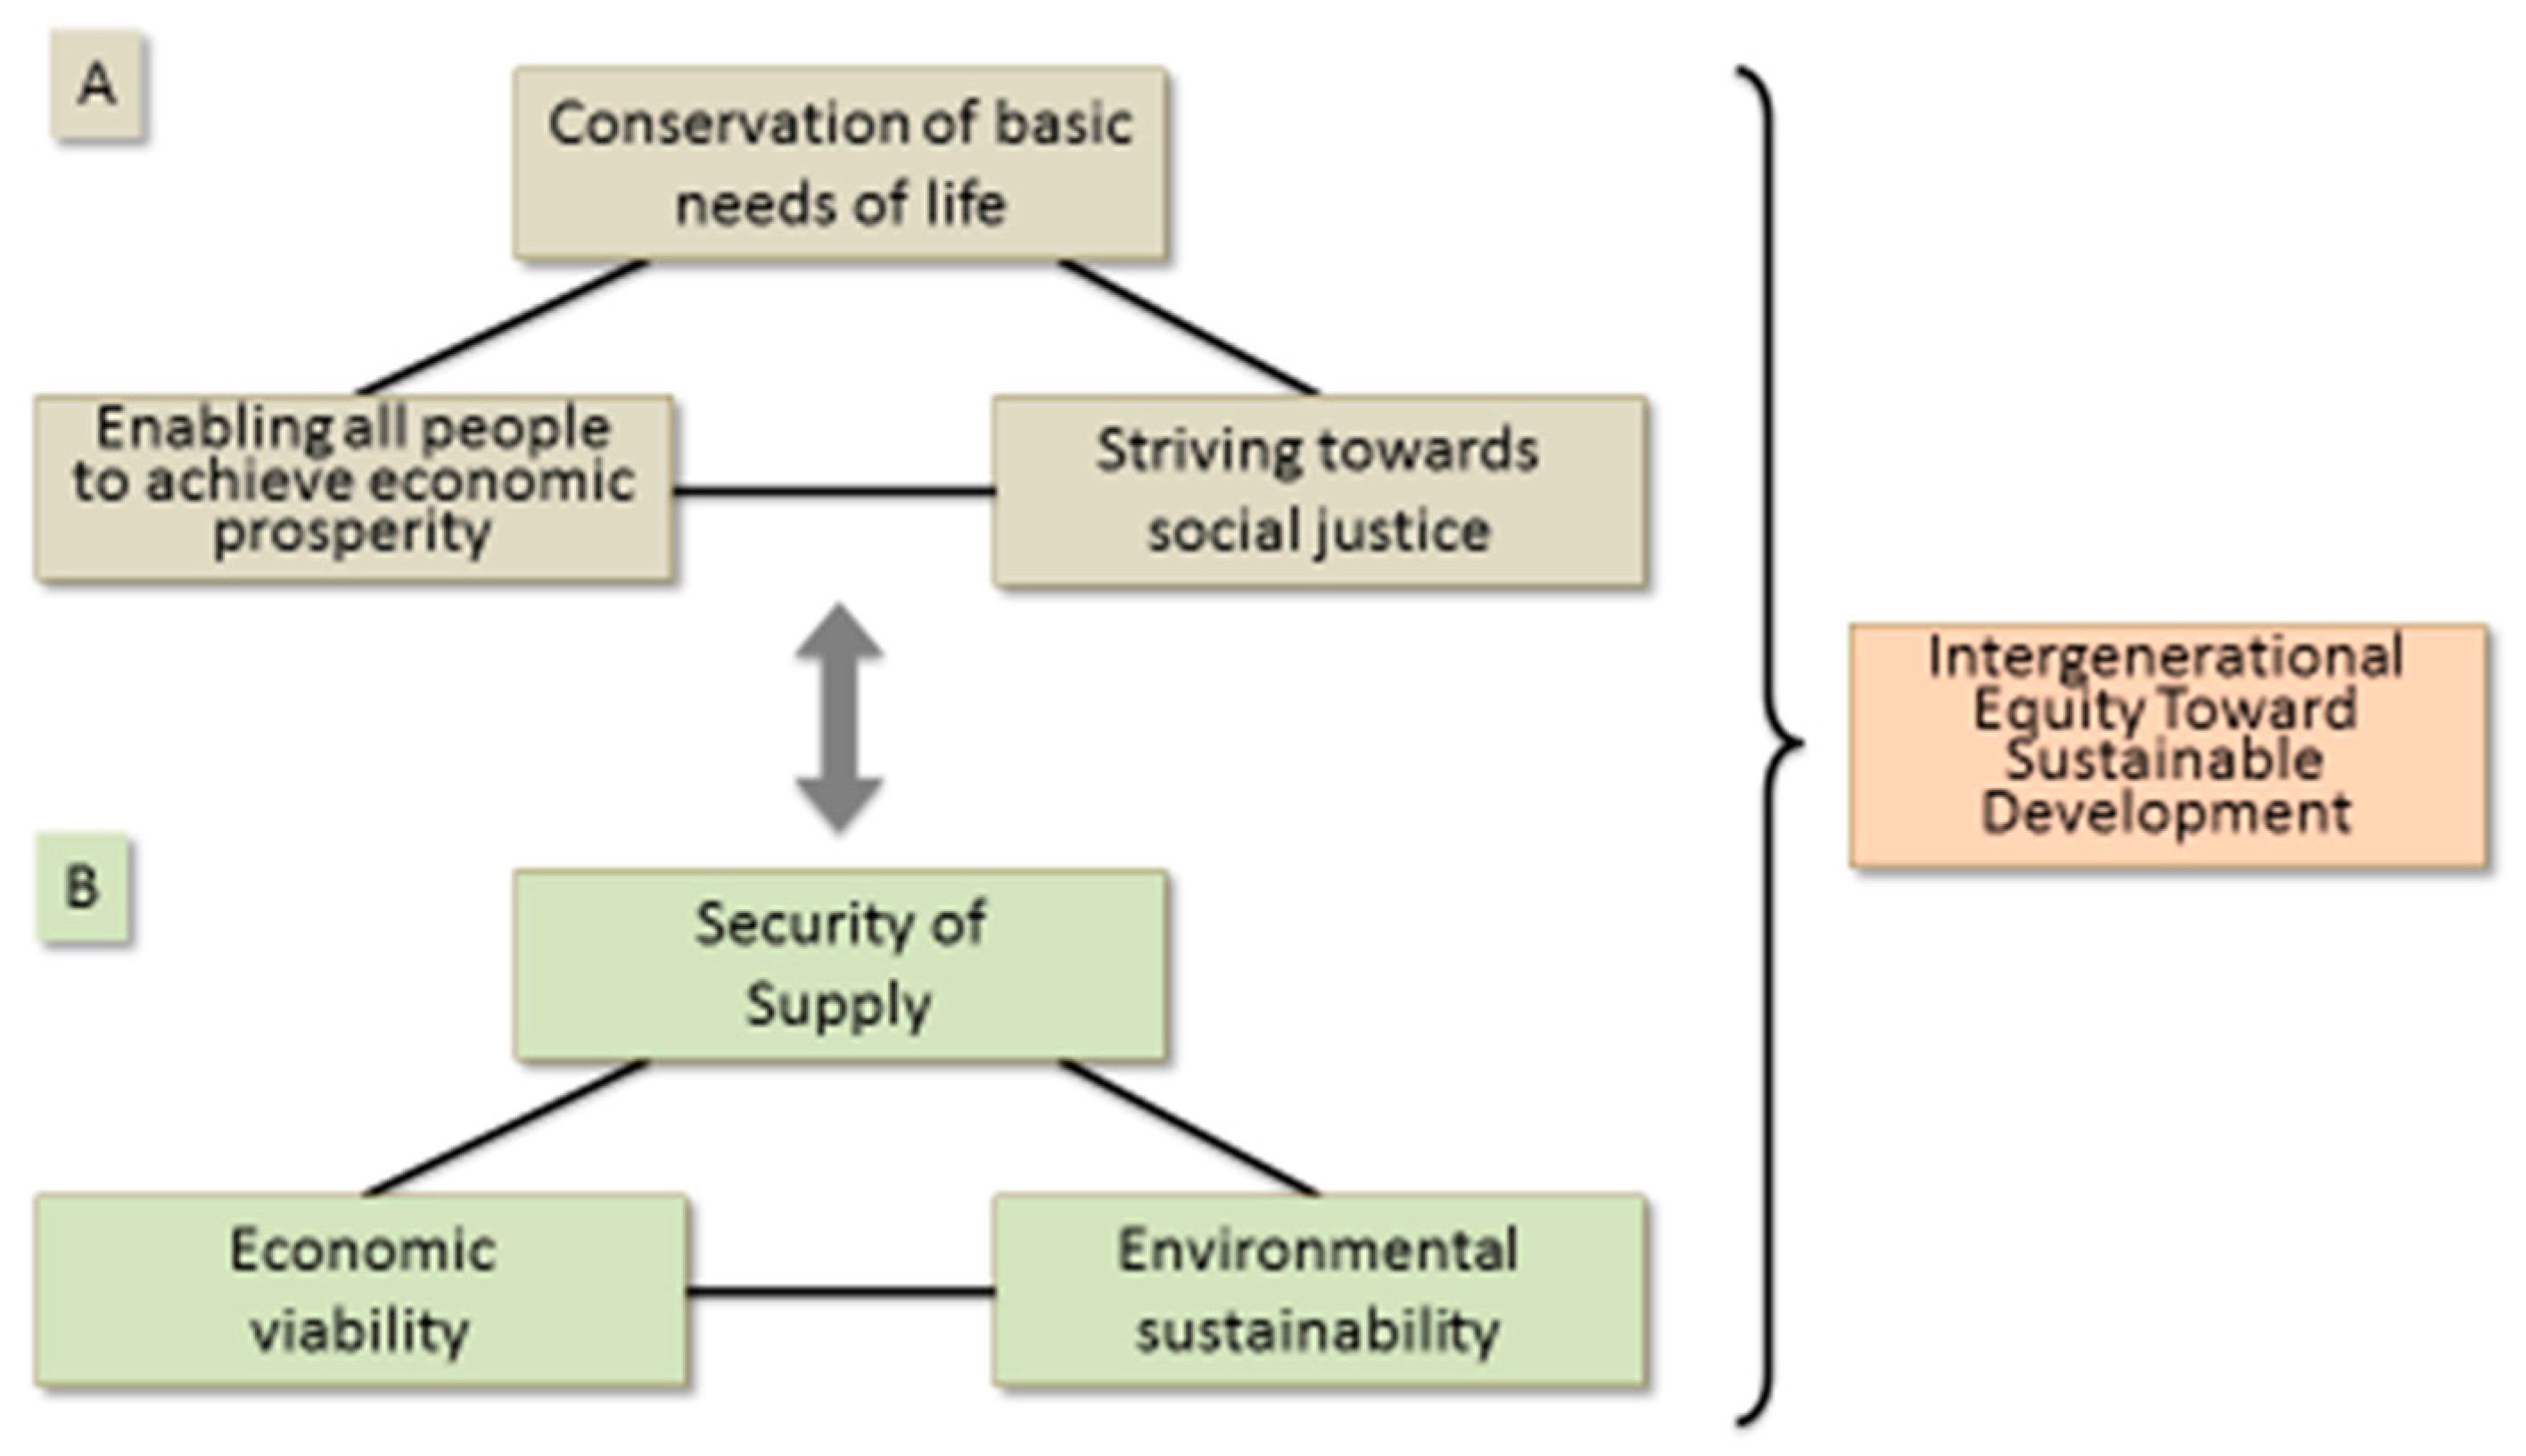
In Section 3.1, we introduced the principle of intergenerational fairness. This principle is taken as a starting point for sustainable development. A key normative aim is to allow every future generation of having the privilege of being as well off as preceding generations [20,21]. For sustainability, we have to add another element: intragenerational fairness. This has been defined in Agenda 21 [23] as a triangle or pillars of three humanitarian objectives. These are (1) to conserve the basic needs of life; (2) to enable all people to achieve economic prosperity; and (3) to strive toward and to establish social justice. These three universal goals have been globally accepted by the Rio Declaration at the UN Conference on Environment and Development in Rio de Janeiro in 1992. All three were initially assigned the same priority. To achieve these goals, humankind needs raw materials: energy and mineral resources for its technological and cultural evolution [38]. In the case of phosphate, we are faced with a special situation:
Phosphate is, by far, the most important raw material for phosphorus (P). P belongs to the family of macronutrients including potassium (K) and nitrogen (N). They are indispensably involved in all organisms’ metabolism or enzyme activation. They are essential and (practically) unsubstitutable elements for food production and life and as necessary as water and soil. For K and N, a future supply problem does not exist; given enough energy, seawater or air can provide a practically inexhaustible source. However, the same situation does not apply to P [5].
Therefore, a secure and sustainable supply of phosphorus is essential in order to achieve sustainable development, especially to conserve the basic needs of life and to strive for social justice, two angles of the triangle of intragenerational fairness. Under the aspect of securing supply, another triangle of goals must be considered (Figure 10): security of supply under the conditions of economic viability and environmental sustainability. As for the long-term challenge of intergenerational equity, its attainment depends on the security of supply of natural resources just as much as that of intragenerational equity, i.e., we have to combine the two triangles (Figure 10). Although phosphorus is not scarce, its net use resource efficiency is low at approximately 5% [5,7].
Therefore, endeavours are required to increase resource efficiency. These can be measures in the system of the circular economy such as recycling as well as measures to optimize the lifetime exploiting of primary resources. The circular economics of phosphorus, i.e., the increase in the number of times a phosphorus atom is used anthropogenically before becoming bound to marine sediments, is one element of sustainable phosphorus management. However, losses and efficiency are inextricably coupled. We also revealed in the above-mentioned losses and efficiency paper [7] that large amounts of phosphorus above and below the cut-off grade are lost in mining. This is a major disturbance factor of circular economics and part of the economic-use cycle that begins—within the perspective of this paper—with a phosphorus atom becoming the subject of economic action.
5. Conclusions
The most widely and internationally accepted definition of sustainable development: “a development that meets the needs of the present without compromising the ability of future generations to meet their own needs [1]” is an abstract, normative principle. For non-renewable resources, it can be made operational by consistently finding solutions for functions required by society with resources of the geosphere and technosphere by using the most important resource: human ingenuity and creativity. Instruments to achieve this goal are a circular economy, the optimization of substitution processes and the development of new technologies [3]. Like the nutrient elements nitrogen and potassium phosphorus is a bioessential element that cannot be substituted. Therefore, for phosphorus the only avenues are a circular economy and the development of new technologies. Generally it can be stated that a P cycle will become sustainable, if—in the long run—the economically mineable (primary and secondary) reserves of P increase to a level higher than the losses (i.e., dissipation) to sinks that are not economically mineable [5].
In a circular economy, mining is the first stage in the chain of value creation. Although the mining stage has no direct influence on the recycling stage, its efficiency influences the overall efficiency of the circular economy. As the lifetime of a mine can be linked to an increase of the extraction rate, the longevity [4] of access to phosphate rock is of interest from a sustainability perspective, i.e., the definition of the cut-off grade, defining ore and waste. Since in a market economy ore is defined as a mineral substance that can be exploited economically, mine planning and the definition of cut-off grades must be optimized, i.e., a dependent variable is needed, which normally is the net present value (NPV) of a mining operation. Practical experience shows, however, that theoretical optimal extraction rates can be achieved only rarely. Physical factors limit mine capacity which can grow only about half to two-thirds of the rate of increase of reserves [22,23]. This rule was developed by the experienced Canadian mining engineer, Taylor, who found as a reason that reserves are a three-dimensional volume function, however, the sustainable rate of extraction depends on the available working area, which is two-dimensional [22].
Whereas there are clear limitations to shortening the lifetime to maximize the NPV, obviously there are no economic limitations to prolong the lifetime as long as the operations remains profitable, i.e., the NPV is positive. The lowest cut-off-grade possible for a continuous operation is an operating cost cut-off grade [8,13]. Once certain economic parameters have been achieved, operations sometimes revert to strategies once certain economic parameters have been achieved to attempt to keep the mine operational as long as possible, e.g., by raising the cut-off grade in the starting phase to increase the mill-head grade and lowering the cut-off grade later or using low-grade stockpiles in the beginning that can be processed later [11] or triaging waste into various categories (low, middle and high grade waste that could become ore under changed economic conditions). Another forward-looking concept would be to create a situation where a mining operation creates the possibility once a certain depth of an open pit (the marginal pit) has been reached, to restart mining under conditions of higher prices and/or improved prices. This requires an investment in the first phase of mining in higher operating costs to transport overburden by belt conveyors to locations farther away so that the overburden does not impede a renewed mining operation.
These examples represent an appeal to mining operators to take into account the longevity of a phosphorus deposit. Thus, losses that occur in mining and the assessment of a mine’s optimal lifetime should become important factors of circular economies.
The message of this paper is that the lifetime of a mine is an issue of sustainable resource management. This holds particularly true for essential materials such as phosphorus. Given today’s agriculture, half of all food production depends on mineral fertilizers. Explorative studies on what a long-term food supply without phosphorus from minerals would mean have indicated that there would not be enough food for about a quarter of the human population [59]. As long-term supply from other sources (seawater or deep-sea mining, for example) with feasible costs seems to be highly unlikely, the physical losses of phosphorus from mines may become a concern from a future generation’s perspective.
Given our present knowledge about phosphorus reserves, the geopotential, mining technology, the price of phosphate rock and the dynamics of these entities, there will be no physical supply scarcity in the next several hundred or even in a thousand years or more. Yet this picture changes if a perspective under sustainability aspects for an even longer period is considered. Thus, future generations’ opportunity costs to access essential minerals is a matter of global resources and environmental policy. Increasing the lifetime of a mine is linked to reducing losses by decreasing cut-off grades, although the extraction rate can be increased by other means as well, such as carefully triaging waste into lower-, medium- and higher-grade waste that could become ore with better technology and/or higher prices. In European metal mines with a long history of mining, for example, materials from tailing dams have often been retreated successfully several times—each time with better technology.
Against this background, we may reflect on a new form of external costs that could motivate an increase in the extraction rate of an ore deposit’s commercial mineral or minerals. In the case of phosphorus, multiple fundamental uncertainties related to future mining technologies, agricultural demands, geopotential, etc. do not allow us to quantify these costs for a mid- and long-term perspective. Yet, as we have outlined, given the current market economy perspective, there are two strategies that call for closer attention in a short term. One is lowering cut-off grades in an economically feasible frame. Here, the mining companies’ orientations toward covering their operating costs instead of maximizing their return of investment is involved. The other is the idea of a “standby” option with explicit plans to reopen mines. We presented a fictive—but, as we know from the planning of North African mining companies, not far from reality—example including an economic rationale for an open-pit phosphorus mine for this purpose. This case included the somewhat counterintuitive means that, in the first phase of mining, the cut-off grade has to be increased to account for higher operating costs for removing waste to more-distant locations in order to economically enable a second phase of mining and the mostly (unforeseen) expenses involved in reopening a mine.
Although the volcanogenic cupriferous pyrite bodies in Cyprus are a different ore deposit type than the stratiform sedimentary phosphate deposit for which we developed our model, we think that the multiple operation of mines can be well illustrated by the history of Cyprus’s copper mines [60,61]. At least 4000 years ago, when melting processes were mastered, copper (Greek: kúpros) mining started in Cyprus. Wealth was generated by grossly satisfying the world’s copper demands during the time of the Romans but came to a first end. Modern pyrite mining with copper as a by-product restarted around 1921. In 1979, this mining became uneconomic, leading to mine closings. However, in the midst of the 1990s, mining was restarted using a new technology for exploiting the copper content, i.e., acid leaching of mined heaps that might utilize former uneconomically grades. What can be learned from this case history? Waste and, at times of first mining, sub economic mineral substances have to remain accessible for possible future exploitation, even if higher operating costs of mining are, at times, necessary. Under sustainability aspects, this is a justified investment for the future.
Globally, mining activities were begun by Homo erectus digging for flint some 400,000 years ago. They advanced in the Mesolithic era [62] and in the Industrial Age, mining developed exponentially [62]. Thus, the lifetime or chronicle of a mine extends far beyond the lifetime of a human individual or a mining company (although the oldest [copper] mining company, now known as Sumitomo, has been in existence for approximately 500 years). Today, science is on the cusp of understanding basic mechanisms of technology development and past and future resource management. This is of interest from the perspectives of future environmental, economic and social development. Thus, we believe that assessing the lifetime of a mine may become part of sustainability science.
Acknowledgments
Author Contributions
This paper emerges from the long-term cooperation of both authors and both have contributed to it equally. The authors jointly developed and wrote Section 1 and Section 3.4 onward. The first author provided the first draft of Section 2 and Section 3.1, Section 3.2 and Section 3.3.
Conflicts of Interest
The authors declare no conflict of interest.
References
- Brundtland, G.H. Our Common Future—Report of the Commission on Environment and Development; Oxford University Press: Oxford, UK, 1987. [Google Scholar]
- Enquete-Kommission Schutz des Menschen und der Umwelt. Verantwortung für die Zukunft—Wege zum Nachhaltigen Umgang Mit Stoff-und Materialströmen; Economica-Verlag: Bonn, Germany, 1993. [Google Scholar]
- Wagner, M.; Wellmer, F.-W. A Hierarchy of Natural Resources with Respect to Sustainable Development—A Basis for a Natural Resources Efficiency Indicator. In Mining, Society and a Sustainable World; Richards, J.P., Ed.; Springer: Heidelberg, Germany; Dordrecht, The Netherlands; London, UK; New York, NY, USA, 2009; pp. 91–121. [Google Scholar]
- Cordell, D.; Neset, T.-S.S. Phosphorus vulnerability: A qualitative framework for assessing the vulnerability of national and regional food systems to the multi-dimensional stressors of phosphorus scarcity. Glob. Environ. Chang. 2014, 24, 108–122. [Google Scholar] [CrossRef]
- Scholz, R.W.; Wellmer, F.-W. Approaching a dynamic view on the availability of mineral resources: What we may learn from the case of phosphorus? Glob. Environ. Chang. 2013, 23, 11–27. [Google Scholar] [CrossRef]
- Laws, D.; Scholz, R.W.; Shiroyama, H.; Susskind, L.; Suzuki, T.; Weber, O. Expert views on sustainability and technology implementation. Int. J. Sustain. Dev. World Ecol. 2004, 11, 247–261. [Google Scholar] [CrossRef]
- Scholz, R.W.; Wellmer, F.W. Losses and use efficiencies along the phophorus cycle. Part 1: Dilemmata and loses in the mines and other nodes of supply. Resour. Conserv. Recycl. 2015, 105, 216–234. [Google Scholar] [CrossRef]
- Wellmer, F.-W.; Dalheimer, M.; Wagner, M. Economic Evaluations in Exploration; Springer: Berlin/Heidelberg, Germany; New York, NY, USA, 2008. [Google Scholar]
- Black, F.; Scholes, M. The pricing of options and corporate liabilities. J. Polit. Econ. 1973, 81, 637–654. [Google Scholar] [CrossRef]
- Brennan, M.J.; Schwartz, E.S. Evaluating natural resource assets. J. Bus. 1985, 58, 135–157. [Google Scholar] [CrossRef]
- Asad, M.W.A.; Topal, E. Net present value maximization model for optimum cut-off grade policy of open pit mining operations. J. S. Afr. Inst. Min. Metall. 2011, 111, 741–750. [Google Scholar]
- Lane, K.F. The Economic Definition of Ore; Mining Journal Books Ltd.: London, UK, 1988. [Google Scholar]
- Rendu, J.M. An Introduction to Cut-Off Grade Estimation, 2nd ed.; Soc. Mining, Metallurgy and Exploration: Englewood, CO, USA, 2014. [Google Scholar]
- Newmann, A.M.; Rubio, E.; Caro, R.; Weintraub, A.; Eurek, K.A. Review of Oerations Research in Mineral Planning. Interfaces 2010, 40, 222–245. [Google Scholar] [CrossRef]
- Krige, D.G. Statistical applications in mine valuation. J. Inst. Mine Surveyors S. Afr. 1962, 12, 45–84 & 95–136. [Google Scholar]
- Tolosana-Delgado, R.; Mueller, U.; van den Boogaart, K.G.; Ward, C.; Gutzmer, J. Improving processing by adaptation to conditional geostatistical simulation of block compositions. J. S. Afr. Inst. Min. Metall. 2015, 115, 13–26. [Google Scholar] [CrossRef]
- Benndorf, J.; Dimitrakopoulos, R. Stochastic long-term production scheduling of iron ore deposits, integrating joint multi-element geological uncertainty. J. Min. Sci. 2013, 49, 68–81. [Google Scholar] [CrossRef]
- Montiel, L.; Dimitrakopoulos, R. A heuristic approach for the stochastic optimization of mine production schedules. J. Heuristics 2017, 23, 397–415. [Google Scholar] [CrossRef]
- Klingman, D.; Phillips, N. Integer Programming for Optimal Phosphate-Mining Strategies. J. Oper. Res. Soc. 1988, 39, 805–810. [Google Scholar] [CrossRef]
- Busnach, E.; Mehrez, A.; Sinuany-Stern, Z. A Production Problem in Phosphate Mining. J. Oper. Res. Soc. 1985, 36, 285–288. [Google Scholar] [CrossRef]
- Birch, C. Impact of discount rates on cut-off grades for narrow tabular gold deposits. J. S. Afr. Inst. Min. Metall. 2016, 116, 115–122. [Google Scholar] [CrossRef]
- Taylor, H.K. Rates of working of mines—A simple rule of thumb. Trans. Inst. Min. Metall. 1986, 95, A203–A204. [Google Scholar]
- Taylor, H.K. Mine valuation and feasibility studies. In Mineral Industry Costs; Northwest Mining Assoc.: Spokane, WA, USA, 1977; pp. 1–17. [Google Scholar]
- Wellmer, F.-W. Sind die Buntmetallagerstätten wirklich gewachsen? Erzmetall 1979, 32, 24–31. [Google Scholar]
- Wellmer, F.-W. Reserve/consumption ratios—How can they be interpreted? Bull. Can. Inst. Min. Metall. 1981, 74, 59–62. [Google Scholar]
- McSpadden, G.M.; Schaap, W. Technical note—A test and comment on Taylor’s rule of mine life. Proc. Aust. Inst. Min. Metall. 1984, 298, 217–220. [Google Scholar]
- Long, K.R. A Test and Re-Estimation of Taylor’s Empirical Capacity-Reserve Relationship. Nat. Resour. Res. 2009, 18, 57–63. [Google Scholar] [CrossRef]
- Long, K.R. Taylor’s Rule Revisited. In Proceedings of the Paper SME Annual Meeting, Phoenix, AZ, USA, 21–24 February 2016. [Google Scholar]
- Cranstone, D.A. The Canadian Mineral Discovery Experience since World War II. In World Mineral Exploration. Trends and Economic Issues. Resources for the Future; Tilton, J.E., Eggert, R.G., Landsberg, H.H., Eds.; RFF-Press: Washington, DC, USA, 1988; pp. 283–329. [Google Scholar]
- Wagner, M. Ökonomische Bewertung von Explorationserfolgen über Erfahrungskurven. Ph.D. Thesis, Technical University, Berlin, Germany, 1998. printed in Geol. Jahrbuch SH 12, Schweizerbart (Stuttgart, Germany) 1999, 225p. [Google Scholar]
- Wagner, M.; Wellmer, F.-W. The optimum lifetime of a mine taking into account the learning curve of exploration. In Proceedings of the 30th International Geological Congress, Beijing, China, 4–14 August 1996; Pei, Y., Ed.; Volume 9, pp. 257–262. [Google Scholar]
- Lütkehaus, M. Rohstofferkundung und Rohstoffsicherung im Bereich Zement/Kalk; Paper XXI; Symp. Prospection and Exploration, Technical University: Berlin, Germany, 1991. [Google Scholar]
- Joint Ore Reserves Committee. The JORC Code. Available online: http://www.jorc.org/aaa (accessed on 31 January 2017).
- Khabarov, N.; Obersteiner, M. Global Phosphorus Fertilizer Market and National Policies: A Case Study Revisiting the 2008 Price Peak. Front. Nutr. 2017, 4, 22. [Google Scholar] [CrossRef] [PubMed]
- Weber, O.; Delince, J.; Duan, Y.; Maene, L.; McDaniels, T.; Mew, M.; Steiner, G. Trade and finance as cross-cutting issues in the global phosphate and fertilizer market. In Sustainable Phosphorus Management: A Global Transdisciplinary Roadmap; Scholz, R.W., Roy, A.H., Brand, F.S., Hellums, D.T., Ulrich, A.E., Eds.; Springer: Berlin/Heidelberg, Germany; New York, NY, USA, 2014; pp. 275–294. [Google Scholar]
- Solow, R. An almost practical step towards sustainability. Resour. Policy 1993, 19, 162–172. [Google Scholar] [CrossRef]
- Ernst, W.G. Global equity and sustainable earth resource consumption requires super-efficient extraction-conservation-recycling and ubiquitous, inexpensive energy. Int. Geol. Rev. 2002, 44, 1072–1091. [Google Scholar] [CrossRef]
- Wellmer, F.-W.; Hagelüken, C. The Feedback Control Cycle of mineral Supply, Increase of Raw Material Efficiency, and Sustainable Development. Minerals 2015, 5, 815–836. [Google Scholar] [CrossRef]
- Wellmer, F.-W. Nachhaltigkeit und Rohstoffgewinnung—Ein Widerspruch? Inauguration Speech for the Presidentship of the Academy of Geosciences and Geotechnology, Hannover/Germany 23 January 2014. Available online: http://www.geoakademie.de/pdf/Wellmer_2014.pdf (accessed on 9 February 2018).
- Schodde, R.C. Recent trends in copper exploration—Are we finding enough? In Proceedings of the 34th International Geological Congress (IGC), Brisbane, Australia, 5–10 August 2012. [Google Scholar]
- Wellmer, F.-W. Wie lange reichen unsere Rohstoffvorräte—Was sind Reserven und Ressourcen? Umweltforschung uwf 2014, 22, 125–132. [Google Scholar] [CrossRef]
- New Boliden: Q4 Interim and Year End Report for 2016, 10. February 2017. Available online: https://vp217.alertir.com/afw/files/press/boliden/201702107068-1.pdf (accessed on 8 January 2018).
- Stuermer, M. 150 years of Boom and Bust: What drives Mineral Commodity Prices? Macroecon. Dyn. 2016. [Google Scholar] [CrossRef]
- Stuermer, M. Industrialization and the demand for mineral commodities. J. Int. Money Financ. 2017, 76, 16–27. [Google Scholar] [CrossRef]
- Lasky, S.G. How tonnage and grade relations help predict ore reserves. Eng. Min. J. 1950, 151, 81–85. [Google Scholar]
- David, M. Geostatistical Ore Reserve Estimation; Developments in Geomathematics 2; Elsevier: Amsterdam, The Netherlands; Oxford, UK; New York, NY, USA, 1977. [Google Scholar]
- DeYoung, J.H., Jr. The Lasky tonnage-grade relationship: A reexamination. Econ. Geol. 1981, 76, 1067–1080. [Google Scholar] [CrossRef]
- Limpert, E.; Stahel, W.A.; Abbt, M. Log-normal Distributions across the Sciences: Keys and Clues. BioScience 2001, 51, 341–352. [Google Scholar] [CrossRef]
- Singer, D.A. The lognormal distribution of metal resources in mineral deposits. Ore Geol. Rev. 2013, 55, 80–86. [Google Scholar] [CrossRef]
- Betechtin, A.G. Lehrbuch der Speziellen Mineralogie; VEB Verlag Technik: Berlin/München, Germany; Porta, Japan, 1957; 685p. [Google Scholar]
- Wellmer, F.-W.; Scholz, R.W. Peak Minerals: What can we learn from the history of mineral economics and the cases of gold and phosphorus? Miner. Econ. 2016, 30, 73–93. [Google Scholar] [CrossRef]
- Minerals Council of Australia: Australias’s Gold Industry—The Exploration Challenge, 2014. Available online: http://www.minerals.org.au/file_upload/files/resources/gold/The_exploration_challenge.pdf (accessed on 13 August 2017).
- EGRC (Expert Group on Resource Classification, Working Group on Anthropogen Resources). Draft Specifications for the Application of the United Nations Classification for Resources to Anthropogenic Resources. Available online: https://www.unece.org/fileadmin/DAM/energy/se/pdfs/UNFC/UNFC-Anthropogenic-Public-Comments/Draft_Anthropogenic_Resources_Specifications_for_public_comment.pdf (accessed on 11 September 2017).
- Wellmer, F.-W. Auslandsaktivitäten der Metallgesellschaft AG in Exploration und Bergbau—Bericht eines Zeitzeugen. Bergbau 2008, 4, 160–169. [Google Scholar]
- Kaltenbach, E.; Miloicic, G. Well-designed from start to finish. World Min. 2017, 3, 153–164. [Google Scholar]
- Kulik, L. Future alignment of lignite in harmony with Germany’s energy transition. World Min. 2017, 2, 79–88. [Google Scholar]
- Geissler, B.; Mew, M.; Weber, O.; Steiner, G. Comparative study on efficiency performance of the world’s leading corporations in phosphate rock mining. Resour. Conserv. Recycl. 2015, 105, 246–258. [Google Scholar] [CrossRef]
- Steiner, G.; Geissler, B.; Watson, I.; Mew, M.C. Efficiency developments in phosphate rock mining over the last three decades. Resour. Conserv. Recycl. 2015, 105, 235–245. [Google Scholar] [CrossRef]
- Obersteiner, M. Oral Communication, 2018; This Statement Is Based on Simulation Conducted at the International Institute for Applied Systems Analysis; IIASA: Laxenburg, Austria, 2018. [Google Scholar]
- Anastasiades, E. Mining History of Cyprus-Copper Mines. Available online: http://www.euromines.org/news/newsletters/2-2012/mining-history-cyprus-copper-mines (accessed on 7 February 2018).
- Kassianidou, V. Hellenistic and roman mining in Cyprus. In Proceedings of the Acts of the Third International Congress of Cypriot Studies, Nicosia, Cyprus, 16–20 April 2000. [Google Scholar]
- Hooke, R.L. On the history of humans as geomorphic agents. Geology 2000, 28, 843–846. [Google Scholar] [CrossRef]
Figure 1.
Discounted net cash flows at an interest rate of 15% (the second arrow at each year) in comparison to the actual (nominal) cash flow of 10 million € (the first arrow at each year), i.e., the amounts below the curved line are the monetary values remaining after discounting. The monetary amounts above the curved line up to the horizontal line of 10 million € are the “discounting losses”.

Figure 2.
The optimum cut-off maximizing the present value for two constraints: the optimum rate of mining () and the optimum rate of milling ( ), from [12] (with the kind permission of Mining Journal Books Ltd., London, UK).
Figure 2.
The optimum cut-off maximizing the present value for two constraints: the optimum rate of mining () and the optimum rate of milling ( ), from [12] (with the kind permission of Mining Journal Books Ltd., London, UK).

Figure 3.
Lifetime of Canadian base-metal mines at the time of production decision (1967–1977) [24,25]. 1: the relationship postulated by Taylor [22,23] 2: interpolation of the real data points (published from [8] with permission of the Springer Publishing Company, Berlin, Heidelberg, Germany, New York, NY, USA).

Figure 4.
Comparison of the ratio of theoretical lifetime as postulated by Taylor [6,7] and real lifetime of copper deposits [26]. (published from [8] with permission of the Springer Publishing Company, Berlin, Heidelberg, Germany, New York, NY, USA).

Figure 5.
Schematic diagram: What is the optimal lifetime of a mine, taking into account learning effects? The vertical bars represent the sizes of reserves and lifetimes at the start and end of a mining operation.
Figure 5.
Schematic diagram: What is the optimal lifetime of a mine, taking into account learning effects? The vertical bars represent the sizes of reserves and lifetimes at the start and end of a mining operation.
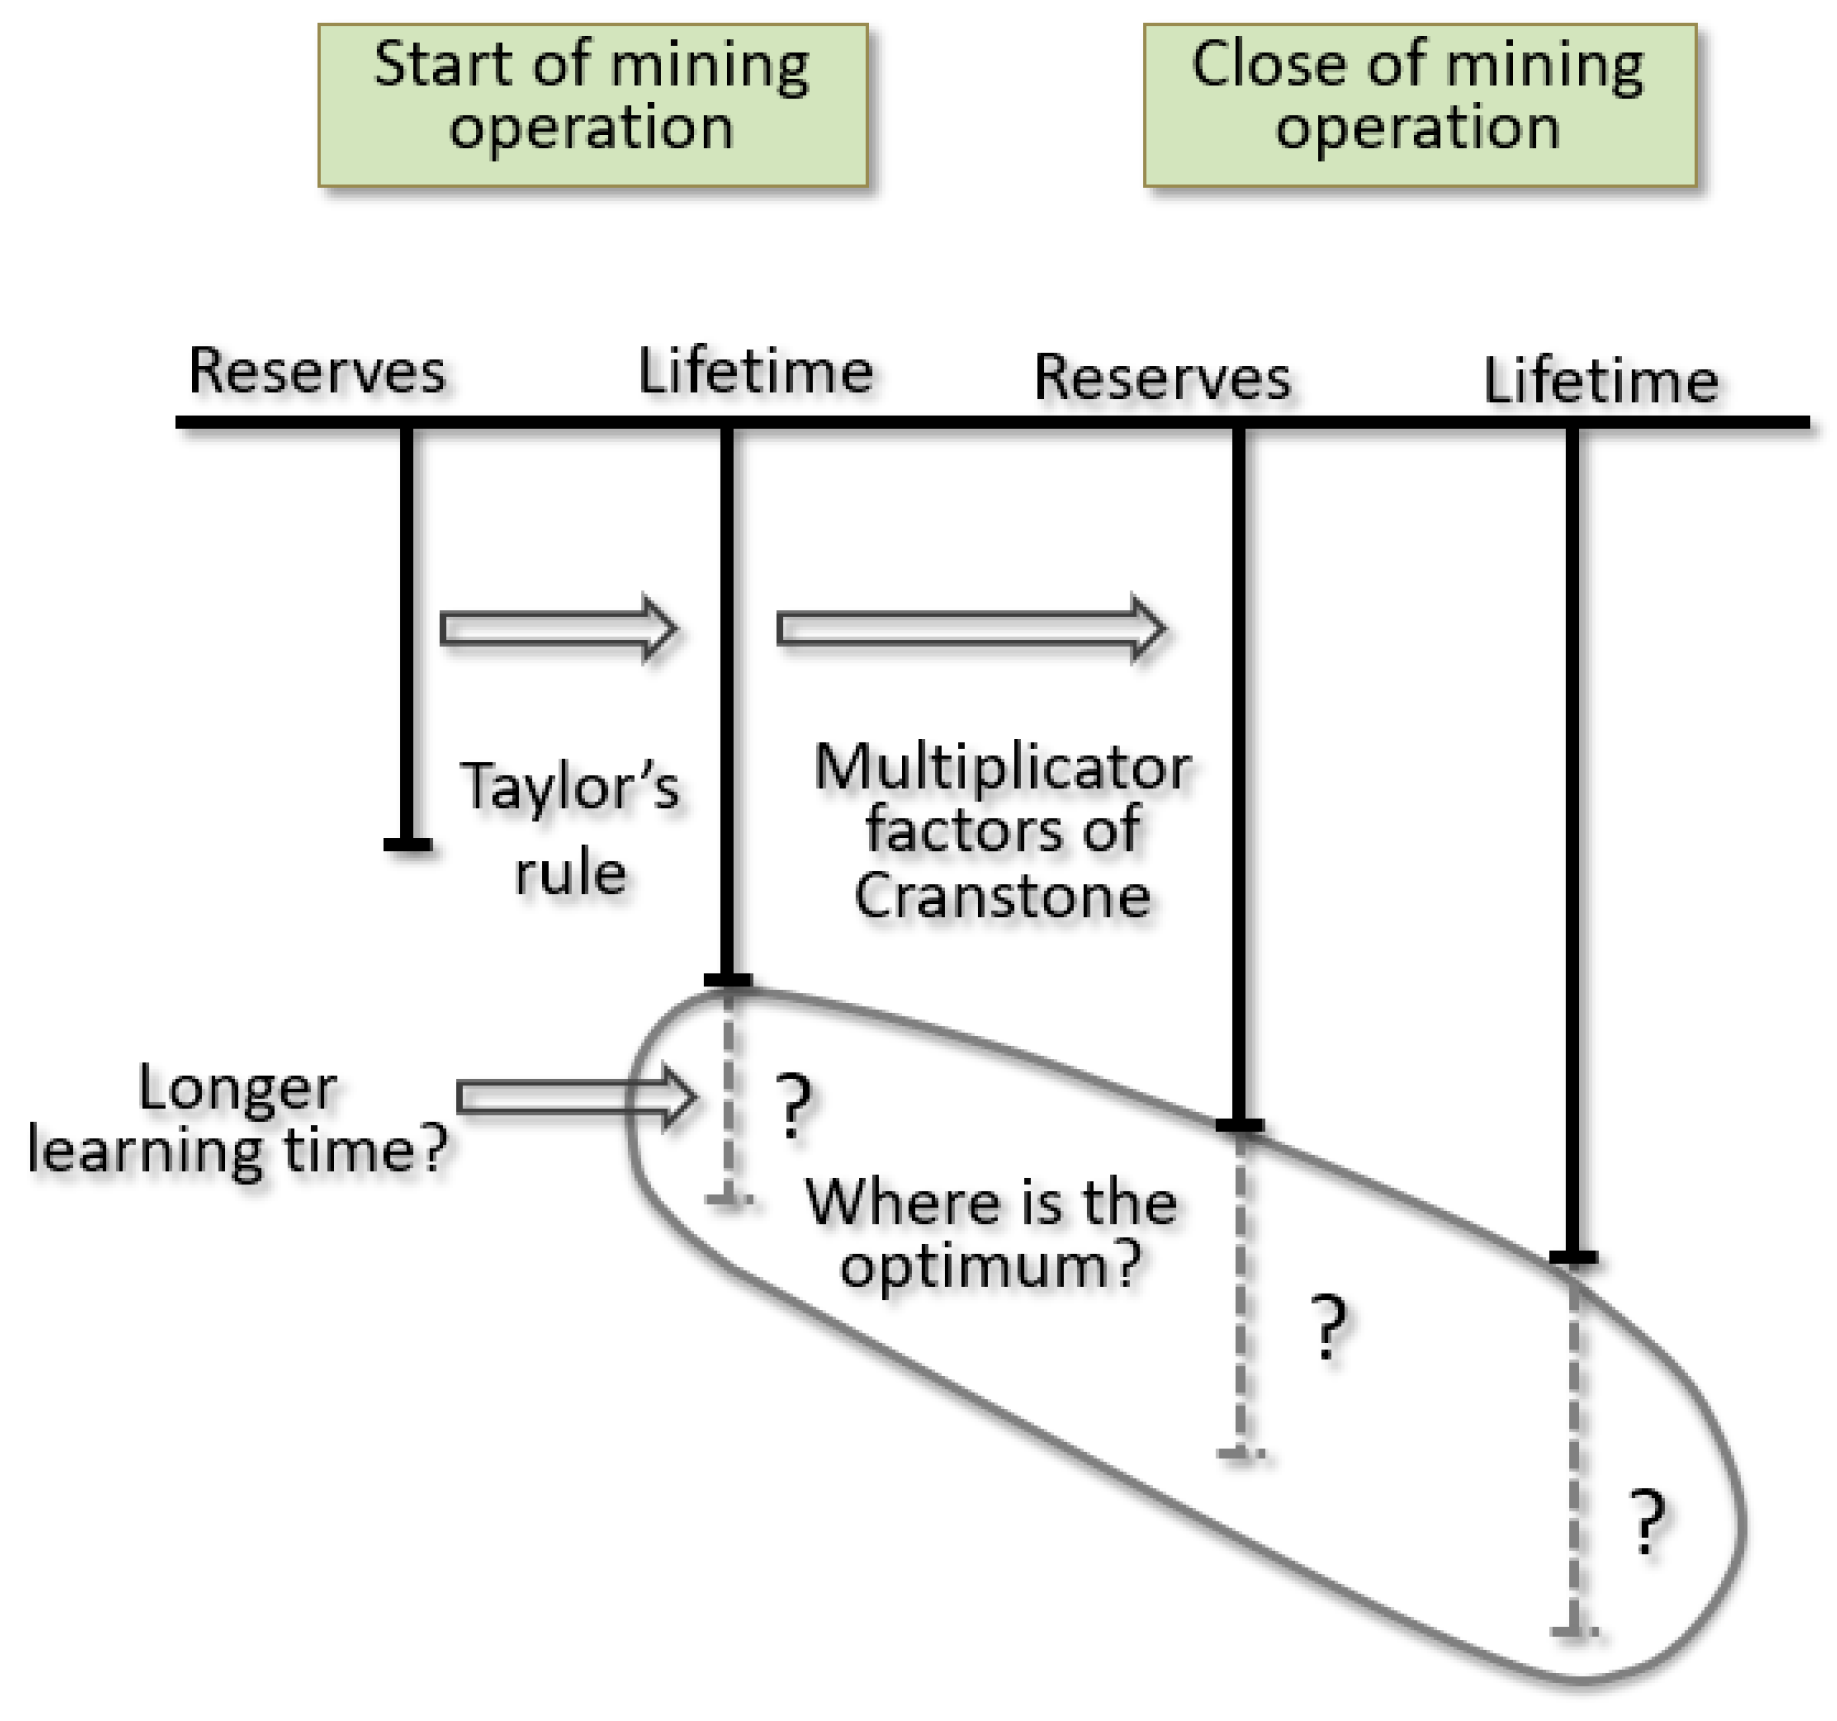
Figure 6.
Model showing how reserves grow during the lifetime of a mining operation, displayed by multiplicator factors against accumulated production for porphyry copper, Mississippi-Valley-type lead-zinc (MVT) and polymetallic volcanogenic massive sulphide deposits (VMS) [30]. On the x-axis 100% (for example) means that 100% of the reserves of the feasibility study have been mined (with kind permission of the author).

Figure 7.
Price variations from 1998–2017 for copper, zinc and phosphate (for phosphate, bpl means “bone phosphate of lime.” %bpl 0.4576 = % P2O5) (Source: BGR databank, with kind permission of the BGR).
Figure 7.
Price variations from 1998–2017 for copper, zinc and phosphate (for phosphate, bpl means “bone phosphate of lime.” %bpl 0.4576 = % P2O5) (Source: BGR databank, with kind permission of the BGR).

Figure 8.
Development of average mined copper grades worldwide [40] and real copper prices [7,41,43,44]. (The price data from 1865–1900 are not shown here, because no copper grade data for this period were available. However, the straight line shown in Figure 8 for the period 1865–1914 is based on all yearly data for this period [7]) (published from [41] with permission of the Springer Publishing Company, Berlin, Heidelberg, Germany, New York, NY, USA).
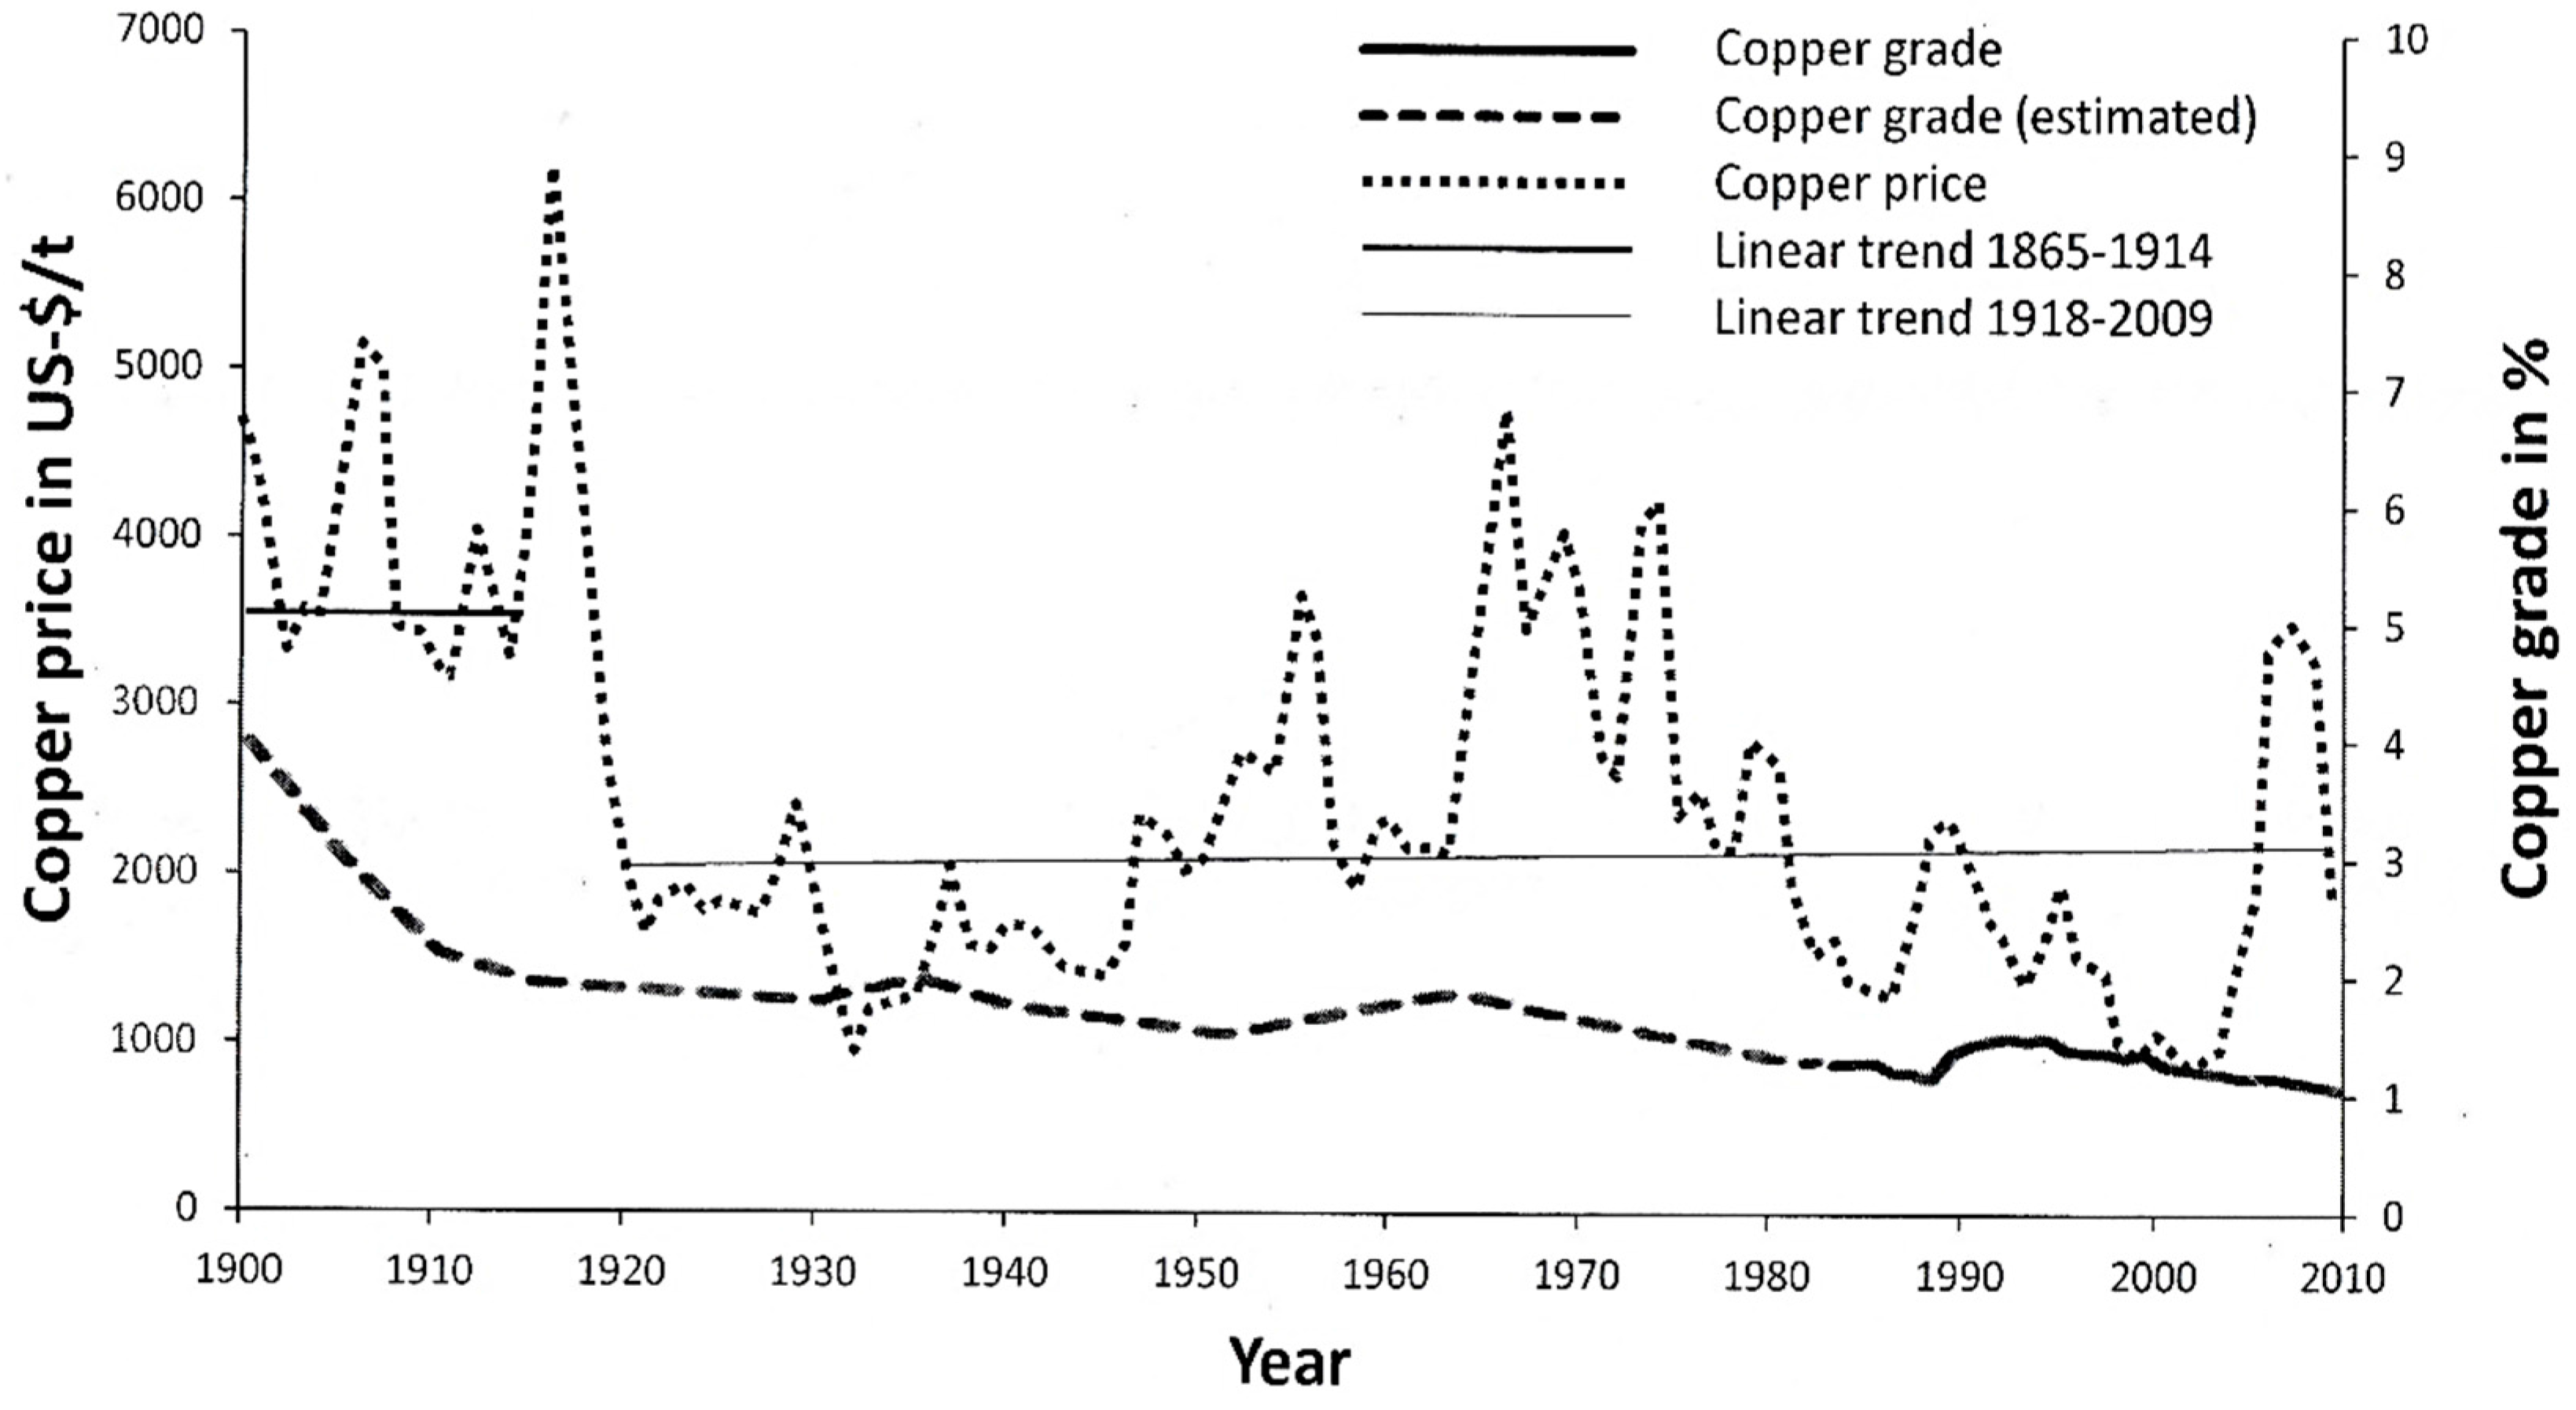
Figure 9.
(a) Simplified scheme of mining under sustainability aspects. Subseam C is part of Seam k, which cannot be mined due to the increased cut-off grade, . The foregone cash flow from this Subseam C is the investment for Phase 2 of mining (b) [7] (In reality, there is a cut-off boundary for the upper and lower boundaries of the seam. The upper boundary cut-off is normally lower than the lower boundary cut-off [8]). (b) Money flows of the simplified scheme of mining under sustainability aspects [1].

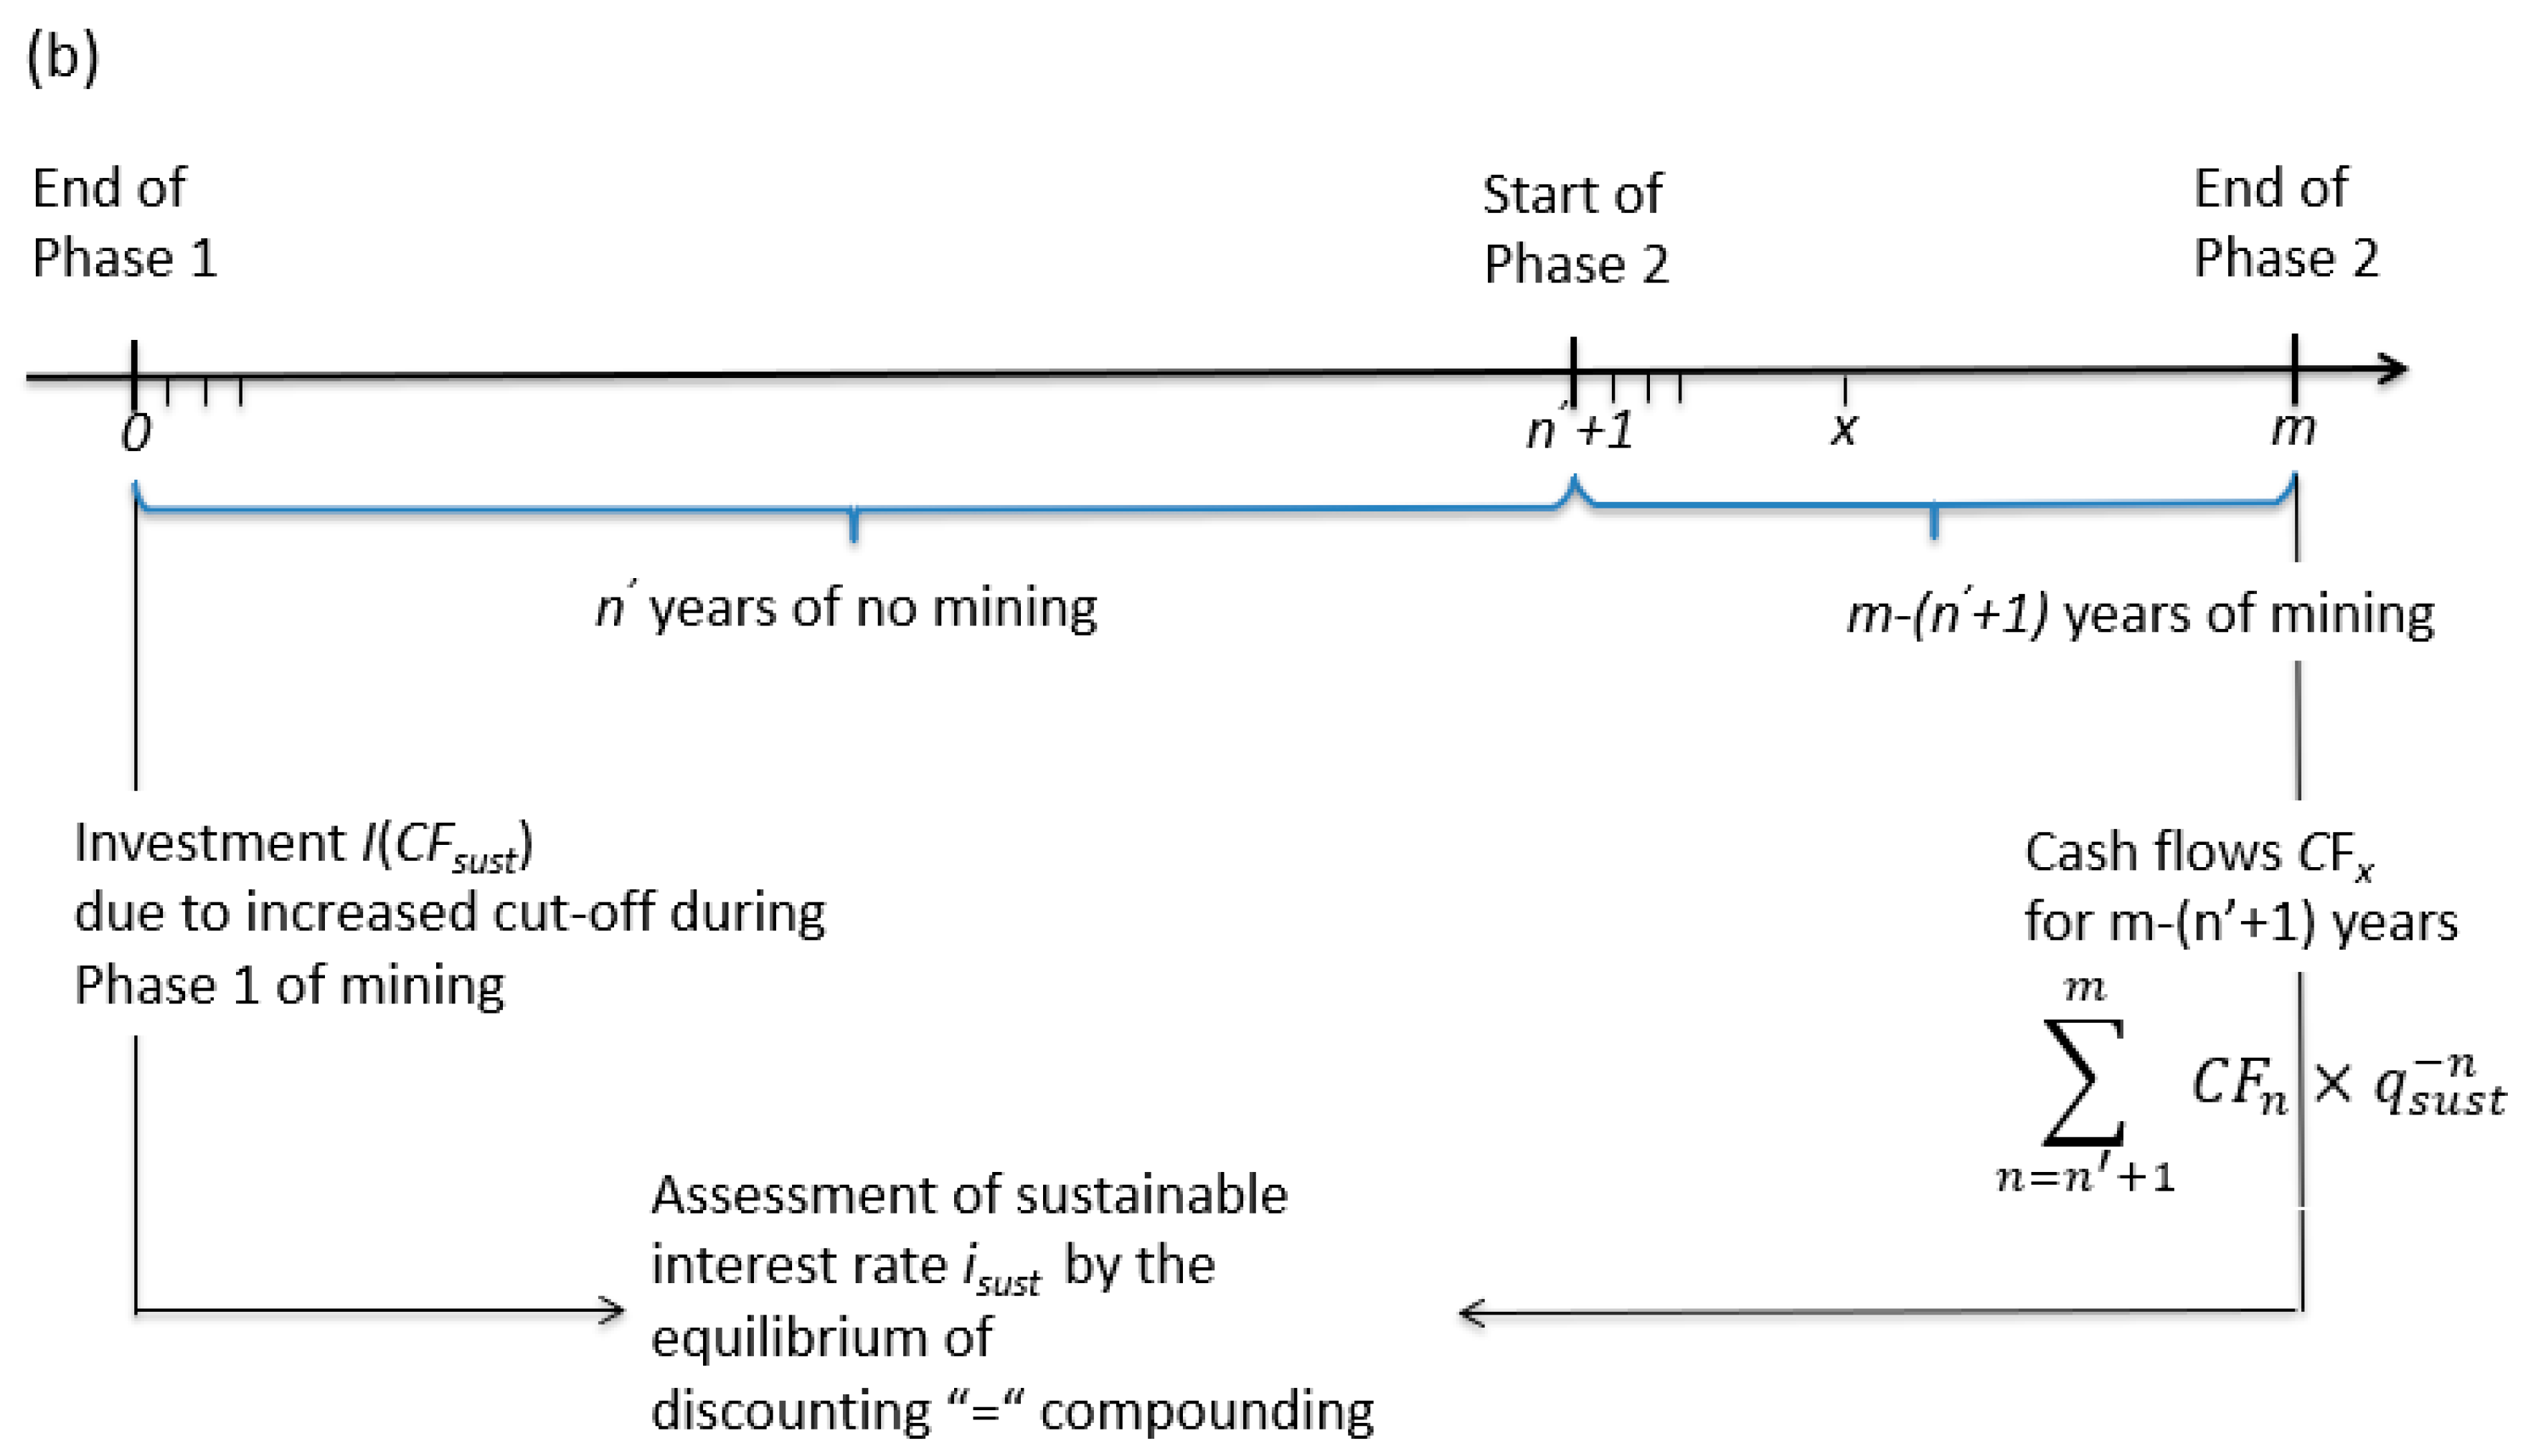
Figure 10.
Combination of the triangle of intragenerational fairness of the Rio Declaration (A) with the triangle of raw material supply (B) to achieve intergenerational fairness [38].
Figure 10.
Combination of the triangle of intragenerational fairness of the Rio Declaration (A) with the triangle of raw material supply (B) to achieve intergenerational fairness [38].

| Product | Minimum Required Lifetime (Years) | Required Resources Base (Million t) |
|---|---|---|
| Limestone and marl (about 80% CaCO3 for cement production | 50 | 80 |
| Limestone for lime production | 40 | 24 |
| Gypsum for construction | 25 | 2.5 |
| Gypsum for cement | 50 | 5 |
Table 2.
Price statistics: phosphate rock compared to LME metals copper and zinc for the period 1998–2017 (based on monthly averages).
Table 2.
Price statistics: phosphate rock compared to LME metals copper and zinc for the period 1998–2017 (based on monthly averages).
| Copper [US–$/t] | Zinc [US–$/t] | Phosphate Rock [US–$/t] | |
|---|---|---|---|
| Mean | 4874.83 | 1753.38 | 99.01 |
| Standard deviation | 2599.94 | 780.43 | 82.26 |
| Coefficient of variation | 0.53 | 0.45 | 0.83 |
© 2018 by the authors. Licensee MDPI, Basel, Switzerland. This article is an open access article distributed under the terms and conditions of the Creative Commons Attribution (CC BY) license (http://creativecommons.org/licenses/by/4.0/).
Share and Cite
MDPI and ACS Style
Wellmer, F.-W.; Scholz, R.W. What Is the Optimal and Sustainable Lifetime of a Mine? Sustainability 2018, 10, 480. https://doi.org/10.3390/su10020480
AMA Style
Wellmer F-W, Scholz RW. What Is the Optimal and Sustainable Lifetime of a Mine? Sustainability. 2018; 10(2):480. https://doi.org/10.3390/su10020480
Chicago/Turabian StyleWellmer, Friedrich-Wilhelm, and Roland W. Scholz. 2018. "What Is the Optimal and Sustainable Lifetime of a Mine?" Sustainability 10, no. 2: 480. https://doi.org/10.3390/su10020480
Note that from the first issue of 2016, this journal uses article numbers instead of page numbers. See further details here.