Environmental Orientation in Swedish Local Governments


1
Department of Accounting and Logistics, Linnaeus University, Box 451, 35106 Vaxjo, Sweden
2
Department of Accounting, University of Lodz, Faculty of Management, 22/26, 90-237 Lodz, Poland
*
Author to whom correspondence should be addressed.
†
Note: Affiliated: Department of Accounting and Logistics, Linnaeus University, Box 451, 35106 Vaxjo, Sweden
Sustainability 2018, 10(2), 459; https://doi.org/10.3390/su10020459
Submission received: 10 January 2018
/
Revised: 3 February 2018
/
Accepted: 6 February 2018
/
Published: 9 February 2018
(This article belongs to the Special Issue Leveraging Digitalization for Advanced Service Business Models: Challenges and Opportunities for Circular Economy)
Abstract
:This study explores the environmental orientation in Swedish local governments. Environmental concerns over potential risk factors have become more important and popular among public organizations and environmental improvement efforts are made to create a sustainable ecosystem for the actors doing business, living and working in the area. Prior research indicates that public organizations have started to become more environmentally oriented in order to take on more responsibilities for reducing their own environmental impact as well as influencing the citizens and local businesses in the direction of a more sustainable way of living and working. Through a survey of Swedish local governments we conclude that they are taking on a key role in developing a sustainable ecosystem through becoming more environmentally oriented. This includes developing a framework for setting environmental goals, identifying suitable environmental indicators and reporting to a wide range of stakeholders. A factor that explains the increasing environmental orientation in the public sector is the implementation of digitalized performance measurement systems. We find that the environmental performance measurements are used to motivate different internal and external stakeholders in the efforts to create a multi-actor ecosystem.
1. Introduction
Care for the environment has become increasingly important for both private and public organizations, since environmental risks are an integral dimension of contemporary organizational processes [1,2,3]. An integrated environmental risk management framework helps in considering the costs and benefits of risk prevention and mitigation strategies [4].
The emergence of digitalization and new technology has opened up the opportunities for creating a sustainable ecosystem, which has led to an active environmental orientation among different actors involved in producing and consuming goods and services and a framework to handle environmental risk factors. Signs of higher degrees of environmental concern, through reduced environmental impact, can be found in different sources (i.e., [5,6,7,8]). As a major economic player, the public sector (i.e., local government) faces increased expectations and responsibilities to reduce their environmental impact, and to influence other organizations to become more environmentally sustainable [9,10].
Environmental orientation can be defined according to [11] as the organization’s ability to generate, disseminate and respond to knowledge within the market and to focus on its stakeholders (see also [12,13,14,15]). When summarizing the environmental orientation, it is clear that it involves focus on the natural environment and has a role in the business landscape and it gives equal consideration to both primary and secondary stakeholders [16]. We use Stone and Wakefield’s [11] definition of environmental orientation: The organization-wide mission to: generate ecological intelligence pertaining to current and future societal environmental needs, disseminate this intelligence throughout organizational departments, and generate acceptance and responsiveness to these needs through the adaptation of internally developed programs which create and foster organizational and public perception of ecological concern [11] (p. 22).
As a consequence, several reasons for local governments to become more environmentally oriented has evolved and different actors are involved in these efforts. Firstly, increased internal pressure from the members of the organization to identify and manage their own environmental impact is obvious. Secondly, increasing demand from citizens to act responsibly and to increase the efficiency of a product or service supply. Thirdly, a reputation of being “green” is a way to attract new citizens to the region. Fourthly, being a role model for the business community and increasing transparency towards stakeholders [17,18]. Furthermore, local governments are responsible for public activities and have the opportunity to influence citizens and private businesses to control environmental impact and their environmental work [19]. Increased public awareness has put pressure on local governments to keep a “green” image [20]. Swedish local governments are powerful local entities and are responsible for a large part of the political decisions and decide on many affairs such as education, infrastructure, long-term care, emergency services, environmental issues, water and sewage [21,22,23].
Research in the field, of sustainability has shifted from questioning why organizations choose to work with sustainability issues to focus on how to work with it and how this work can be improved [24]. As a consequence, there has been an increased research focus on how sustainable processes are designed in an environmental and responsible way [24,25]. Sustainability issues are now seen as an important part of “being a responsible organization”, but also as a way to enhance or repair public confidence in public organizations [9]. In prior research (i.e., [9,17,26,27,28]) there is a call for further research in the field of the environmental orientation of the public sector.
Sustainability refers to the idea that, as a society, our actions will meet our current needs and not compromise the ability of future generations to meet their own needs [29]. The concept of sustainability performance is often used in a broad sense and includes activities that aim to secure long-term survival of the organization and one of the first goals of an eco-capability would be to minimize the organization’s ecological impact. Sustainability, as a concept, is often divided into financial, social and environmental performance and often referred to as the “triple bottom line” [30,31,32]. Although the understanding of the financial “bottom line” is well established, social and environmental “bottom line” performance is not that well known, but is gaining attention from several research strands (i.e., [32,33]). In this research we concentrate on the environmental performance indicators (EPI) in use within the municipal organizations.
According to international organizations like the United Nations (UN), European Union (EU) and Organisation for Economic Co-operation and Development (OECD), increased responsibility for the environment is becoming important for all citizens, and there is also a growing need for public organizations to pay attention to their environmental impact and to inform the public on their work [9]. Guidelines for how organizations can disclose their environmental impact are found in i.e., “The Global Reporting Initiative” [34] which has released several guidelines [9,27,35]. These guidelines aim to help organizations design informative accounts for its stakeholders and to report their environmental improvement work and what needs to be improved in the future [9].
In this research, we contribute to the existing literature with additional insight into the increasing environmental orientation in the public sector [24,36,37,38]. Most existing research and guidelines for environmental orientation primarily focuses on the private sector and not on the public sector. Several studies on the private sector demonstrate the benefits of using environmental performance indicators, which involve for example, risk reduction and performance improvement [39]. The purpose of this study is to examine to what extent and how Swedish local governments use environmental performance indicators.
Lodhia et al. [38] argue that public organizations have started to measure and report their environmental performance to a larger extent than before. According to this strand of research studies it is found that larger local governments are able to conduct more comprehensive reporting since they have more resources in terms of larger budgets and skilled staff [19]. Larger local governments also face greater pressure to show that they are taking responsibility for the environment in the geographical area which they are responsible for and are therefore more likely to report their environmental performance through different indicators [40].
Over the last decade, changes in the governance structure in local governments can be observed, according to Greco et al. [33], and the reason for this is that private sector management methods, which are named new public management (NPM), have been introduced. In a prior study of Växjö municipality, which claims to be the greenest municipality in Europe, Alpenberg and Wnuk-Pel [17] found that the use of environmental indicators as part of the overall performance measurement system increased in importance when NPM was introduced. These prior studies sparked our interest.
The potential role of specific environmental performance indicators and their connected control system in supporting environmental initiatives are addressed more frequently in the general management control literature (i.e., [41,42]). The aim with environmental indicators is to translate the environmental aspirations into improved environmental performance for the organization [43,44]. Studies indicate that environmental performance control systems play an important role in, for example, identifying emerging threats and opportunities, facilitate environmental decision-making and coordination within the organization and facilitate learning (i.e., [43,45,46,47]).
The rest of the paper is organized as follows: in the next section the literature review and hypotheses development is presented, which is followed by the research method in the third section. In section four we present the results from the study of Swedish local governments. Lastly, in the fifth section the discussion and conclusions are presented.
2. Literature Review and Hypotheses Development
The review of literature below is divided into two main sections, in order to derive the hypothesis. In the first section we present the strand of research in new public management, which constitutes the context for the study. The second section consists of prior research about environmental performance indicators when local governments are striving towards environmental orientation.
2.1. New Public Management
We draw from a strand of research called new public management (NPM), which show changes in how public organizations plan, operate, control and report their operations [8,33,48,49,50,51,52,53,54]. In essence, public organizations have become more like private sector organizations in how they run their operations. Lane [55] argues that the traditional approach to public management is gradually disappearing and is being replaced by methods diffusing from the private sector. Agevall [56] argues that NPM has added efficiency and better management of resources and should not be seen as a single model, but more like a mix of different ingredients that public organizations are using. The introduction of NPM has given local governments less detailed, rule-based control and instead increased the local autonomy in making decisions [54] and can be seen as a management-based reform.
Five common elements are affected by the introduction and use of NPM [8,52,53,57]: Firstly, governance and control—including retention and performance management, financial management with a tighter financial control and quality assurance systems. As a consequence, efficiency measures and quality are given more focus. Secondly, disaggregation (division), privatization and competition, which has led to increased focus on costing issues and competition between organizations, but also between individual sub-units. Internal markets between the units are developed, where the units are buying and selling to each other. According to Hood [52] the disaggregation of the public sector into smaller individual units, is a requirement for competition to arise. Management roles—the importance of an active and visible control from the people at the top of the hierarchy of the organization—are emphasized. The role of the management is multifaceted and Agevall [56] argues that more power should be in the hand of the politicians, which means increased centralization and coordination. On the other hand, managers in the administration have a much greater responsibility and autonomy compared to the political leadership, which is a sign of increased decentralization. For the individual municipality this duality makes it more difficult to operate the organization, especially when it comes to governance and management, and to use the models and methods from the private sector [56]. Citizens as customers—all citizens are seen as a customers and at the same time possess a greater influence on politicians and officials. The last element which can be observed is the use of a new terminology. When local governments start using new terminology, which are made for private companies, the concepts have to be adjusted to the public context. At the same time, local governments see themselves as a group with organizational profit centers which makes the use of the new terminology necessary [56] when providing municipal services and care.
In summary, the introduction of NPM in public organizations, i.e., local governments, has led to an increased focus on setting goals and introducing digitalized performance measurement systems [48,49] for different actors both within and outside the local government (multi-actor ecosystem). According to Greco et al. [33], local governments that have introduced NPM are using performance measurement systems and reporting to a larger extent than those that have not introduced NPM. Also, when local governments introduce NPM, more frequent use of environmental performance indicators, takes place. Hence, we hypothesize:
Hypothesis 1.
Increased NPM-maturity leads to increased use of general performance measurements.
Hypothesis 2.
Increased NPM-maturity leads to increased use of environmental performance indicators.
2.2. Environmental Performance Indicators
When local governments increase their environmental orientation, the use of environmental performance indicators seems to grow [18,58] and the interest in reporting the environmental performance within the municipality to various stakeholders increases. Prior research dealing with environmental performance indicators is quite diverse and a number of studies have been carried out with different focuses.
There are big differences in how local governments work with and report environmental efforts. Greiling et al. [27] found that information from the public sector is mainly of a descriptive nature and there is a lack of quantitative information regarding actual performance. Several studies show that environmental performance in the public sector is only in early stages [9,26,27] and the organizations present their sustainability efforts based on stakeholder requests [9]. Alcaraz-Quiles et al. [59] describe that the demographics in the local governments influence what information is published. Local governments with high unemployment prioritize social indicators instead of environmental indicators.
Furthermore, research indicates that the purpose of environmental performance indicators is primarily for internal use, but can also be reported and communicated externally [60]. The indicators used in the reporting convey information so that it is understood by a multitude of stakeholders, i.e., politicians, municipal staff, companies, engineers, economists, administrators and the general public [61]. The reporting provides an assessment of internal sustainability efforts and control [18,58]. Environmental performance indicators facilitate decision-making and management within the organization [18,46,58,61]. Selecting relevant indicators is also found to be one of the critical tasks [62] in organizations.
For local governments, accountability is an important reason for why they report the environmental performance in their municipality [9,26,63]. Garcia-Sanchez et al. [19] point out that the more transparent local governments are, the more funding they tend to receive from higher levels in the public sector. Since local governments handle tax money, both politicians and municipal staff are constantly challenged to demonstrate how they create value for money [30]. Additionally, local governments are responsible for the environment and for a lot of different municipal services, including maintenance of public recreational and natural areas and water plants, where environmental indicators are important to use [26,63]. Bellringer et al. [64] examined why five New Zealand local governments reported their environmental performance. The results indicate that local governments want to be the leader in sustainability reporting and want to encourage local companies and create awareness among residents and in this way to work on sustainability issues together in a multi-actor ecosystem. Additionally, local governments want to increase transparency, through environmental measurements and reporting, of how tax money is used in the effort to create a sustainable ecosystem. This has made it important for local governments to make environmental statements and indicators easily accessible for multiple stakeholders. Although the economic and practical advantages of reporting their work was important for the New Zealand local governments, they highlighted the savings made and that it was beneficial to be a “green” municipality from an investment standpoint [64].
Indicators linked to environmental orientation are often called environmental performance indicators (EPIs) [5,34]. The purpose of EPIs is to provide a set of indicators, including how to collect and analyze them [60]. Various indicators are used to evaluate, improve and report performance for sustainability and environmental orientation [18,58,62,65]. In a study by Mazzi et al. [62], EPIs in Italian local governments are described and the authors found great differences in what was measured. Among the 111 local governments in the study, 2085 different indicators were identified. Many indicators were used only in one municipality and those measured in 15% or more of local governments represented only 4% of the total indicators.
In a study by Ramos et al. [18], Portugal’s local governments and their work with their environmental performance indicators (EPIs) shows that the main motive for the environmental work was to prevent health risks and to check that environmental laws are followed. Pressure from policy makers and the public is nothing that the participating local governments in the study cited as motives for measuring the environmental work, which, as the authors point out, reflects the conditions and risks that this sector handles [18].
Dunn [40] studied three local governments in Australia that implemented sustainability thinking into their operations. The study demonstrates that many of the actions in the local governments did not meet the criteria designed in the conceptual framework. Local governments failed to focus on the areas that have the greatest impact on the environment and lacked both time and resources [40].
Krause et al. [66] studied the placement of sustainability (including the environment) initiatives in local governments. They examined local governments in the United States and whether it is beneficial to have a separate department that focuses on sustainability-related issues, or if the work is to be implemented in the central administration of the entire operation. According to Krause et al. [66] the sustainability work appears to have higher priority if it is implemented in the central administration of the municipality. However, as the authors argue, the decision might be affected by political changes. The problem with starting a separate unit for sustainability is the start-up costs. A separate unit led to additional costs, which not all local governments have the ability to afford because they do not have the economic resources. The study showed that local governments with greater resources and larger population have a more extensive focus on sustainability and also tend to have a specialized unit [66].
In the same stream of research, Keskitalo and Liljenfeldt [67] have studied the implementation of sustainability (including the environment) in eight local governments in Sweden. The study consists of two large local governments, Gothenburg and Botkyrka, and six smaller local governments in the region around Umeå, who worked together in the area of sustainability. Keskitalo and Liljenfeldt [67] found that small local governments benefited when they worked in partnership with neighboring local governments since sustainability work can be too extensive for a small municipality to implement. One difficulty identified in the study was the sustainability goals, as they often were expressed in broad and abstract terms, making it difficult to measure tangible success against the target. All of the local governments studied expressed difficulties in working with sustainability because of the limited resources in terms of time and money. The complexity of sustainability also discourages local governments from working with it and many attempts have been project-based and short-term. Keskitalo and Liljenfeldt [67] found the sustainability initiatives to be resource-intensive since the development of indicators and indicators as well as monitoring the system is cumbersome, especially with limited funding.
A study of Spanish local governments shows a positive link between the size of the municipality and sustainability efforts [19]. Larger local governments have more resources and opportunities for skilled personnel, which means that the municipality is in the better position to improve their sustainability activities and to develop indicators and report them.
Keskitalo and Liljenfeldt [67] argue that the design of new environmental indicators and targets are resource intensive. Environmental performance indicators can be difficult to implement for organizations that are used to working solely with financial figures [68]. Therefore, the use of general performance measurements and targets are an important factor influencing the development work of environmental goals and indicators for local authorities are working with an environmental orientation [19]. Hence, we hypothesize:
Hypothesis 3.
Increased use of general performance measurements lead to increased use of environmental performance indicators.
Based on the literature review and the hypotheses development above, the following research model was formulated (see Figure 1).
3. Methodology
This project started with a pilot study of the local government in Växjö Municipality, which is claimed to be the greenest city in Europe [17]. Växjö is located in the southern part of Sweden and has been known for decades for its environmental work and reporting. The pilot study was conducted to gain additional understanding for the field of interest and to develop the questions for the survey which was used for this study. Interviewees confirmed the validity of the questions and that they could answer them in its current design. The pilot study built on results reported in Alpenberg and Wnuk-Pel [17].
Based on the pilot study, an internet-based survey was sent out to all 290 Swedish local governments (the e-mail was sent to the contact center in each municipality, with the request to pass on the survey to the person in the local government responsible for environmental performance indicators). The e-mails, with a link to the survey and the request to fill out the internet questionnaire, was sent out in April, 2016 and two reminders were sent out to the local governments which had not responded. Out of the 290 possible respondents, 119 delivered completed questionnaires, which gave a response rate of 41% (the rest of the 171 respondents either did not respond at all or their responses were incomplete).
The questionnaire consisted of five parts:
- General municipality characteristics—containing basic information about the municipality and also about the respondent (education, experience, etc.);
- New public management—with data on the extent of use of NPM methods in the municipality;
- Key performance indicators—containing information about general Key Performance Indicators (KPIs) used (number and type of indicators, goal setting and use, etc.);
- Key performance indicators for environmental work—focusing on information about the environmental performance systems used (number and type of environmental indicators, setting and use of environmental goals, examples of environmental indicators used, etc.);
- Motives for the use of voluntary environmental reporting—with data on why a municipality is using environmental performance indicators, who is the user, and an indication whether any changes in these indicators are planned. Among those that answered, two sub-groups were created. One group consists of local governments that use environmental performance indicators, which were 80 local governments. The other group, consisting of those that do not use environmental performance indicators, was 39 local governments.
In order to secure the validity of the study, a failure analysis of 10 out of the 171 local governments that did not answer the questionnaire was conducted. No deviations were found between local governments that answered and that did not answer the questionnaire, so we should be able to generalize the results to the entire population (see Appendix for details).
Statistical analyses were performed on the two sub-groups, using Statistical Package for the Social Sciences (SPSS) to test the responses received for relevant connections and patterns. We used both univariate and bivariate analyses. Univariate analysis involves the analysis of one variable, and is made to provide frequency tables to get some measures of location (mean value and median) and some measures of dispersion (coefficient of variation for standard deviation and coefficient of variation for semi-interquartile range). These analyses provide an overview of the collected data. The bivariate analyses are done also with multiple variables from the suggested hypothesis to see how the dependent variables relate to an independent variable. The strength of the correlation can be tested in different ways depending on what kind of variables are to be tested [69]. In this study, nominal, ordinal, ratio, interval and dichotomous variables were used.
Spearman “rho” was used to examine the relationship between two ordinal variables. The correlation coefficient that describes the strength and the direction of the relationship between the variables is between −1 and 1, where −1 means a perfect negative correlation and 1 indicates a perfect positive correlation. Thus, the nearer the absolute value of the coefficient is to zero, the weaker the relationship between two variables [68].
To investigate the overall level of NPM-maturity in Swedish local governments, a NPM-maturity index was created (initially, this index was developed by Bystedt [70], who based the index on different areas from Blomberg [57], Hood [52,53] and Agevall [56]). It was calculated as a sum of answers of all 15 questions (all questions had equal weighting) concerning NPM and had a minimum value of 0 (meaning that the use of NPM is not well developed) and a maximum value of 90 (meaning that the use of NPM is well developed).
Langford [37] argues that the lack of uniformly-defined environmental performance indicators reduces comparability and use of the indicators, which as a consequence may diminish the reliability of a municipality’s environmental efforts. This observation may confirm the already specified need [24] for a general regulatory framework for environmental performance measurement, which could possibly increase comparability and thus the reliability of environmental efforts in municipalities. This regulatory framework could also serve as a guideline for municipalities to develop their own existing environmental performance measurement systems and also as a catalyst to build these systems in municipalities which do not use them.
In order to analyze the sophistication of general performance measurement systems and EPIs in local governments, two indexes were created—a general performance measurement index and an environmental PI index.
The general performance measurement index was created on the basis of answers to the questions concerning overall goal formulation (Table 4—goal setting in local governments) and the number of general performance indicators used (Table 5—number of general performance measurements used in local governments). Answers to questions concerning overall goal formulation were summed (all questions had equal weight) and divided by two and then added to the answer to the question on the number of general performance indicators (all questions had equal weight), also divided by two. Answers to questions on overall goal formulation were graded from 1–6, so the sum of the answers could be between four and 24, and when divided by two the sum should fall between two and 12. Answers to questions on the number of general performance indicators were graded from 1–7 and when divided by two the sum should fall between 0.5 and 3.5. In conclusion, the general performance measurement index value, after summing up the two elements, could have a value between 2.5 and 15.5.
An EPI index was created on the basis of answers to the questions concerning environmental goal formulation (Table 6—mean value for environmental goal setting in local governments) and the number of environmental performance indicators used (Table 7—number of EPIs used in local governments) in exactly the same way as the general PI index was prepared.
In the next sections of the paper the following abbreviations are used (except the ones which are commonly known):
4. Results
4.1. General Municipality Characteristics
The overall results presented in this section are based on the respondents that fully responded to the survey, which included 80 (67.23%) local governments that use environmental performance indicators and 39 (32.77%) that do not use any environmental performance indicators. The analysis of these groups will be kept separate in order to distinguish differences. The size of the local governments, represented by the number of inhabitants, is shown in Table 1, which proves that local governments not using any form of EPIs tend to be small and very small. The difference between local governments with/without EPIs is statistically significant at the level of α = 0.05 (U Mann–Whitney: Z = 4.2703; p-value = 0.000020).
4.2. New Public Management Maturity
The most important independent variable in the research model is NPM-maturity in the local governments analyzed. The questionnaire focused on 15 issues to assess the maturity of NPM in the local government. The group differences in NPM maturity between the local governments with environmental performance indicators and the ones without them were tested. The results are shown in Table 2.
From additional analysis it is clear that for all local governments, whether using environmental performance indicators or not, the scores reported are quite high (usually between 3.5 and 4.5) meaning that NPM-maturity is quite advanced in Swedish local governments. Additionally, the scores for local governments using EPI are higher than for those not using EPI (with exception of questions 1 and 15). For some of the questions the differences are statistically significant, whereas for the others they are not (see Table 2). The size of the municipality (measured by the number of inhabitants) does not drive the tested variables. The Kruskal–Wallis test by rank did not show statistically significant differences. On the basis of the NPM-maturity index described in methodology section, the NPM maturity of Swedish governments was examined. The results are shown in Table 3.
Analysis of Table 3 indicate that NPM-maturity is higher in local governments with environmental performance indicators than in local governments without them. It can be noted that the spread for both groups is quite substantial and also that for some local governments the reported NPM-maturity index was zero, meaning that respondents did not have any knowledge concerning NPM (this should not be surprising, since questionnaires were filled out mainly by employees involved in environmental issues, who did not necessarily have enough knowledge of NPM matters). The difference between local governments with/without environmental performance indicators is statistically significant at the level of α= 0.05 (U Mann–Whitney: Z = 2.246059; p-value = 0.024701 **).
4.3. General Performance Measurements
The overall sophistication of the performance measurement system is revealed by several questions regarding general performance measurements. According to Keskitalo and Liljenfeldt [67], appropriate indicators of performance in organizations require the breaking down of the overall goals of the organization into more specific goals which have a specific timeframe in which they are supposed to be reached. Keskitalo and Liljenfeldt [67] also argue that goals should be checked and reviewed regularly. From Table 4 it can be seen that local governments with environmental performance indicators in comparison to local governments without environmental performance indicators tend to more often use strategic goals, break down the strategic goals into more specific goals, have a specific timeframe in which they are supposed to reach the goals and also check the goals on the regular basis (the differences are statistically significant at the level of α = 0.05).
Another aspect that could indicate the level of sophistication of the general performance measurement of the local governments is the number of different measurements used in the system (the scale from one (meaning that no general performance measure is used) to seven (meaning that more than 50 general performance measures are used) was used). The mean value of 5.71 in the case of local governments with environmental indicators and of 3.77 in the case of local governments without environmental indicators, indicates that the overall performance measurement systems in local governments with EPI tend to be more detailed (with an average of close to 50 indicators) than in the case of local governments without EPI (with an average of less than 30 indicators). The difference between local governments with/without EPIs is statistically significant at the level of α = 0.05 (U Mann–Whitney: Z = 4.650914; p-value = 0.000003 **). The number of general performance measurements used in the local governments analyzed is shown in Table 5.
4.4. Environmental Orientation and Performance Indicators
4.4.1. Setting Goals for the Orientation
Of the local governments which use EPIs, the majority sett strategic environmental goals that they try to reach (MV = 5.27 in 1–6 scale). Some local governments for example indicated that they have set the goal to become fossil-free in 2030, which is a long-term ambition [17]. The mean value (see Table 6) decreases substantially, however, when breaking down environmental goals into more detailed goals, with a specific timeframe is concerned (MV = 4.04). The explanation for this phenomenon could be that setting a short timeframe for environmental goals could prove to be problematic as it can take years to see any progress on environmental issues. According to Keskitalo and Lijlenfeldt [67], the overall environmental goals should be broken down into more concrete and less subjective goals when the overall goals could be considered too vague to know what actions should be taken to reach them. Not all local governments are setting overall environmental goals and some do not break down their overall goals into more specific targets with a specified timeframe, which is in line with Epstein and Roy [71], who found that some municipal environmental orientations focused mainly on visions and policies and not on performance or specific goals. In this study we find indications of a gradual change in Swedish local governments over the years in this respect, since many of the respondents declared the use of more specific targets set in a certain timeframe [67].
The sophistication of EPIs could also be expressed by the number of different indicators used in the system (the scale from one (meaning that no EPIs are used) to seven (meaning that more than 50 environmental EPIs are used) was used). The mean value of 3.93 indicates that the EPIs in local governments are quite detailed, with close to 30 indicators (mean value). The number of EPIs used in local governments analyzed is shown in Table 7.
Table 7 shows that more than one out of four local governments use quite many indicators, meanwhile, others do not use a lot of indicators or do not use them at all. However, it should be stressed that even local governments that do not use any EPIs could still run environmental programs and perform actions to improve their environmental performance. Ramos [58], stress that it is important to limit the amount of indicators, otherwise it may create confusion and may pull managers away from concentrating on the most important issues. This could be especially problematic when an organization has many different indicators but no guidelines for which of them should be given priority [62]. In this case it can be difficult for local governments to identify areas where improvements are needed. When evaluating environmental actions by local governments, Dunn [40] found that they could focus on trivial areas rather than important ones where change could be achieved.
In Table 8, the environmental indicators that are used by the Swedish local governments are presented. The different indicators are in line with what was observed by Mazzi et al. [62] for the sample of Italian municipalities. The possible explanation for this phenomena is that municipalities are different with respect to localization (urban areas or rural areas), main environmental problems (air pollution, water pollution) or the general priorities of the municipality. Differences in environmental measurement systems could be seen as advantageous, showing that municipalities focus in their measurement systems on the problems which are most important for them.
Basic information on general and environmental EPI indexes (description of the indexes is in methodology section) are presented in Table 9.
It can be observed in Table 9, that the mean value for the general performance measurement-index is greater in the case of local governments with environmental performance indicators than in the case of local governments without environmental performance indicators. The difference is statistically significant at the level of α = 0.05 (U Mann–Whitney: Z = 3.826444; p-value = 0.000130 **). The mean value of the EPI index (this index was measured only in local governments with environmental performance indicators) was slightly lower (11.30) than in the case of the general PI index (12.41), which could mean that environmental performance indicators are included in general PIs.
4.4.2. Motivation for Environmental Orientation
A closer look at the underlying motivation for environmental orientation shows that the motives are primarily internal, with the highest mean value of “to achieve environmental goals” and “being able to make actions based on the results and improve environmental performance” (see Table 10). This is in line with what Ramos et al. [18] and Ramani et al. [61]. The mean value of the motive “to follow other organizations who report environmental performance” is relatively low, but it could mean that local governments focus on environmental orientation because they have seen other organizations do so. Local governments also want to “live up to the social expectations” (4.355) and to use EPIs as an opportunity to motivate the surrounding society to a more sustainable lifestyle (mean value of 4.344), which is in line with Garcia-Sanchez et al. [19] and Williams [63].
The internal focus of the environmental orientation was also confirmed by analysis of the target recipients of the system (see Table 11). In a majority of the cases, environmental information is targeted to many actors—politicians (they are seen as the main users) and managers in the local government and also municipality residents (multi-actor ecosystem). Garcia-Sanchez et al. [19] argue that the more transparent the local governments are, the greater their opportunities to get more funding from higher levels, mainly from national or international organizations. Our findings add to Garcia-Sanchez et al. [19], since we have not been able to observe a strong external focus towards national government, EU, UN and other international organizations.
Another issue of interest is why some Swedish municipalities do not have any environmental performance indicators. According to 74% of the respondents that do not use EPIs, the reason is primarily a lack of staff or resources and 31% of respondents stated that the reason was that there was not legal requirement for this. In local governments that are not measuring environmental performance, it should not be concluded that they are not taking responsibility or working for the improvement of the environment [9] it only means that some, mainly smaller municipalities, simply do not have the resources to do it when there is no legal obligation.
Among the respondents, 61% reported that there has not been any major changes in the environmental orientation over the last five years, whereas 39% stated that there has been a change.
4.5. Verification of the Research Model
To verify the hypotheses set at the beginning of the research, correlations between variables in the research model were calculated.
Hypothesis 1, stating that increased NPM-maturity lead to increased use of performance measurements, could be verified positively. The correlation is statistically significant at the 0.01 level (the value of the correlation Spearman coefficient is 0.441), which indicates correlation between NPM-maturity and general performance measurements. The correlation is not strong, however.
Hypothesis 2, stating that increased NPM-maturity lead to increased use of environmental performance indicators, could be verified positively. The correlation is statistically significant at the 0.01 level (the value of the correlation Spearman coefficient is 0.386), which indicates correlation between NPM-maturity and environmental PI use. The correlation is not strong, however. Many public sector organizations, including local governments, are using ideas and methods from the private sector which are broadly known as new public management. NPM requires setting goals and designing systems for the monitoring of the achievement of these goals, which is the essence of general PI use in organizations and of environmental PI use in particular [56]. Our finding supports Agevall’s [56] claim, but as the correlation is not strong it could be argued that NPM has an indirect impact on the development of EPIs. Thus, NPM-maturity could influence the sophistication of general performance measurement PIs in organizations [56], which in turn is linked with EPI use.
Hypothesis 3, stating that increased use of general performance measurements leads to increased use of environmental indicators, could be verified positively. The correlation is statistically significant at the 0.01 level (the value of the correlation Spearman coefficient is 0.628, which indicates modest correlation). This finding is consistent with Keskitalo and Lijlenfeldt [67], who state that use of general performance measurements is closely linked to the use of EPIs. They also observe that in local governments with existing general performance measurement systems it is easier to implement specific EPIs. The authors believe that the creation and maintenance of EPIs is resource intensive, so the process of EPI implementation could be facilitated if the municipality has experience with the use of targets, measures, data gathering and the interpretation of general performance measurements.
5. Discussion and Limitations
We examined how environmental orientation has become an integral part of the agenda for a sustainable ecosystem in Swedish local governments. Firstly, we found support for the existence of an environmental orientation among Swedish local governments in line with Stone and Wakefield’s [11] definition. The results show that the use of environmental goals, environmental indicators, and environmental reporting by the local governments, directed at various stakeholders, function as a support system for companies and other actors in their own efforts to become environmentally accountable. The main stakeholders that are targeted are politicians, companies, employees in the local governments and citizens. The environmental orientation we observed also functions as an environmental risk management framework that highlights the costs and benefits of risk prevention, which is in line with Carter and Rogers [4].
Secondly, we conclude that the environmental orientation is more comprehensive among the larger local governments, which also have the resources to maintain the necessary activities and involvements. In smaller local governments, with less than 50,000 inhabitants, the level of environmental orientation seems lower, at least when we compare the performance systems and the ambitions. Although, there are reasons to believe that in many of the smaller local governments, the environmental impact from companies and citizens may be lower, due to less environmental risk factors, and therefore the need for more advanced EPIs and performance measurement systems is lower.
Thirdly, we showed that increased NPM-maturity positively led to increased use of general performance measurements as well as increased environmental orientation and the use of EPIs. The level of NPM-maturity is overall higher among larger local governments. The results add granularity to prior studies about environmental orientation in the public sector [9,64,66], especially when it comes to the NPM-maturity for the development of environmental orientation.
Fourthly, as hypothesized, we found that increased use of general performance measurements led to increased use of environmental performance indicators (EPIs), which is consistent with Keskitalo and Lijlenfeldt [67], who concluded that use of general performance indicators is closely linked to the use of environmental indicators. Keskitalo and Liljenfeldt [67] also observed that local governments with an existing and well-developed performance measurement system also implement specific environmental indicators. Since the use of environmental performance indicators is voluntary in Swedish local governments, a wide range of indicators are used to report the environmental activities and initiatives. Overall, the use of environmental indicators in most local governments is well developed and quite detailed. The evidence shows that almost 25% of the local governments use over 50 environmental indicators, which also indicates that a lot of resources are put into this area. Among the remaining local governments, the majority of them use between 11–40 environmental indicators to measure and report their environmental orientation. In conclusion, this widespread use of indicators indicates an extensive environmental orientation and that the local governments are gradually moving towards a more sustainable ecosystem (compare [9,59,64,66]) and that also includes the involvement of and reporting to multiple stakeholders.
An interesting observation is that all of the indicators specified in the questionnaire, which were summarized from [18,34,62], were found to be used by Swedish local governments. Obviously, there are different uses of the indicators and they are measured in different ways. For some indicators there are no major differences in how they are measured, for example “pollutants and sewage sludge” is usually measured by the amount of various substances in different areas, “amount of household waste”, “recycling” and “hazardous waste” is most often measured by examining the collected amount. However, “renewable fuel” indicators differ substantially between local governments. The greatest spread of indicators was within the energy field, which was mainly linked to consumption measurement either in relation to the surface, to the entire municipality area, to municipality premises only or per capita. Finally, local governments also used other indicators which were not specified in the questionnaire, for example, bicycle use, wooden house buildings, residents disturbed by noise, energy smart houses, etc.
The overall use of EPIs in Swedish local governments supports prior results by Mazzi et al. [62] and the sample of Italian local governments. We find similar patterns among the local governments in their environmental orientations and how differences in localization (urban areas or rural areas), main environmental problem (air pollution, water pollution) or the general priorities of the local government determine the use of the EPIs.
The results have implications for research and practice in public organizations. Overall, the environmental orientation for the sustainable, multi-actor ecosystem that is observed regarding Swedish local governments, can serve as a framework or catalyst for environmental improvements among all the different stakeholders. Through the environmental orientation, radical improvements among citizens and companies can be accomplished and a long-term sustainable ecosystem can be achieved. The local governments seems to have an initiating effect on more lasting changes in the environmental area and are acting as role models for the citizens and for private companies. Our results also support Gabler et al. [16], in suggesting that innovative local governments not only have become pioneers of green technology, they also develop their green resources, making these resources part of their own identity and transferable to others. Just as innovativeness amplifies the influence of market orientation on firm performance [72], we find that eco-oriented local governments that are innovative, are best suited to develop and optimize the human, business, and technology resources necessary in the formation of a sustainable eco-system, and ultimately to achieve a competitive advantage in attracting new citizens and companies to a “green” region.
Local governments are actively working on their environmental orientation, through the use of digitalized performance measurements and EPIs, which also creates new opportunities for further collaborations between the private and public sector and potentially create more attractive places for people to live and work. Through transparency in eco-communication, local governments can provide integrated and well-accepted environmental risk prevention for the community.
Finally, we suggest that there is additional need for studies in this area. Further, research in the area of how voluntary environmental performance indicators are used in local governments among employees and politicians is needed, as well as motives as to why local governments measure and report environmental performance indicators. It would also be of interest to study how the environmental orientation in the local governments influences other stakeholders to develop their own efforts in this area.
Acknowledgments
This paper is part of a larger research initiative with focus on sustainability performance measurement in the public sector. Acknowledgements going to anonymous reviewers who have contributed with their suggestions to improve the quality of paper, to Academic Editor and to all people of the MDPI for their valuable work. We also would like to thank seminar participants at the 12th Asia-Pacific Management Accounting Association Annual Conference in Taipei, Taiwan, 5–7 October 2016 for valuable comments. The empirical data for this paper was gathered by Amanda Henebäck and Mikael Jernmo for their master thesis under the supervision of the co-authors.
Author Contributions
This paper is to be attributed in equal parts to the authors.
Conflicts of Interest
The authors declare no conflict of interest.
Abbreviations
| NPM | New Public Management |
| NPM maturity index | New Public Management maturity index |
| General PM index | general performance measurement index |
| EPI index | environmental performance measurement index |
| S | standard deviation |
| Vs | coefficient of variation |
| Me | median |
| Q | quartile deviation |
Appendix A
In order to secure the validity of the study, a failure-rate analysis was conducted. Out of the 171 local governments which did not answer the questionnaire, 10 were chosen randomly in proportion to their size (three with a population under 25,000, two with a population between 25,001 and 50,000 and one in each of the groups: 50,001–75,000, 75,001–100,000, 100,001–125,000, 125,001–150,000 and over 150,000). The identified respondents were contacted by phone and were asked control questions in order to find out if the answers significantly differed from the rest. Among all 10 local governments that were contacted, we found that five small local governments did not use voluntary environmental reporting and five big ones did have environmental reporting which was in accordance with our 119 response results. All 10 local governments in the failure analysis explained that lack of time was the reason to why they did not respond. We did not find any indication of deviations from the analysis we did from the main two sub-groups and, consequently, we should be able to generalize the results to the entire population (see Table A1).

Table A1.
Failure analysis.
| Municipality | Number of Citizens | Why did You not Respond to the Survey? | Are you Using Environmental PI and Reporting? | Why or Why not Do You Use Environmental PI and Reporting? |
|---|---|---|---|---|
| Municipality 1 | Under 25,000 | Lack of time. | Do not use environmental PI and reporting. | Lack of resources and employees. Limited time is used for strategic issues in general. |
| Municipality 2 | Under 25,000 | Lack of time and lack of competence. | Do not use environmental PI and reporting. | No inspection and control is done. |
| Municipality 3 | Under 25,000 | Lack of time. | Do not use environmental PI and reporting. | We lack employees for this task. |
| Municipality 4 | 25,001–50,000 | Lack of time. | Do not use environmental PI and reporting. | We lack employees for this task. |
| Municipality 5 | 25,001–50,000 | Lack of time. | Do not use environmental PI and reporting. | We lack employees for this task. |
| Municipality 6 | 50,001–75,000 | Lack of time. | Are using environmental PI and reporting. | It’s a condition for a long term welfare, economy and quality of life. |
| Municipality 7 | 75,001–100,000 | Lack of time. | Are using environmental PI and reporting. | |
| Municipality 8 | 100,001–125,000 | Lack of time. | Are using environmental PI and reporting. | |
| Municipality 9 | 125,001–150,000 | Lack of time. | Are using environmental PI and reporting. | More efficient planning and control in order to reach the environmental goals. |
| Municipality 10 | Over 150,000 | Lack of time. | Are using environmental PI and reporting. | More efficient planning and control in order to reach the environmental goals. |
References
- Gandy, M. Rethinking the ecological leviathan: Environmental regulation in an age of risk. Glob. Environ. Chang. 1999, 9, 59–69. [Google Scholar] [CrossRef]
- Gouldson, A.; Morton, A.; Pollard, S.J.T. Better environmental regulation—Contributions from risk-based decision-making. Sci. Total Environ. 2009, 407, 5283–5288. [Google Scholar] [CrossRef] [PubMed] [Green Version]
- Pearce, F.; Tombs, S. Hegemony, risk and governance: ‘Social regulation’ and the American chemical industry. Int. J. Hum. Resour. Manag. 1996, 25, 428–454. [Google Scholar] [CrossRef]
- Carter, C.R.; Rogers, D.S. A framework of sustainable supply chain management: Moving toward new theory. Int. J. Phys. Distrib. Logist. Manag. 2004, 38, 360–387. [Google Scholar] [CrossRef]
- Johnston, A.; Smith, A. The characteristics and features of corporate environmental performance indicators—A case study of the water industry of England and Wales. Eco-Manag. Audit. 2001, 1, 1–11. [Google Scholar] [CrossRef]
- The Millennium Development Goals Report 2008; United Nations: New York, NY, USA, 2008.
- Frostenson, M. Företaget och Hållbarheten. In Controllerhandboken; Nilsson, F., Olve, N.G., Eds.; Liber AB: Stockholm, Sweden, 2013; Volume 10, pp. 590–604. [Google Scholar]
- Dias, K.; Braga Junior, S. The use of reverse logistics for waste management in a Brazilian grocery retailer. Waste Manag. Res. 2015, 34, 22–29. [Google Scholar] [CrossRef] [PubMed]
- Navarro-Galera, A.; De los Ríos Berjillos, A.; Ruiz Lozano, M.; Tirado Valencia, P. Transparency of sustainability information in local governments: English-speaking and Nordic cross-country analysis. J. Clean. Prod. 2014, 64, 495–504. [Google Scholar] [CrossRef]
- Rodríguez Bolívar, M.P.; Navarro Galera, A.; Muñoz, L.A.; Lopez Subires, M.D. Analyzing forces to the financial contribution of local governments to sustainable development. Sustainability 2016, 8, 925. [Google Scholar] [CrossRef]
- Stone, G.W.; Wakefield, K.L. Eco-orientation: An extension of market orientation in an environmental context. J. Market. Theory Pract. 2000, 8, 21–31. [Google Scholar] [CrossRef]
- Kirca, A.H.; Jayachandran, S.; Bearden, W.O. Market orientation: A metaanalytic review and assessment of its antecedents and impact on performance. J. Market. 2005, 69, 24–41. [Google Scholar] [CrossRef]
- Kohli, A.K.; Jaworski, B.J. Market orientation: The construct, research, propositions, and managerial implications. J. Market. 1990, 54, 1–18. [Google Scholar] [CrossRef]
- Morgan, N.A.; Vorhies, D.W.; Mason, C.H. Market orientation, marketing capabilities, and firm performance. Strateg. Manag. J. 2009, 30, 909–920. [Google Scholar] [CrossRef]
- Greenley, G.E.; Hooley, G.J.; Rudd, J.M. Market orientation in a multiple stakeholder orientation context: Implications for marketing capabilities and assets. J. Bus. Res. 2005, 58, 1483–1494. [Google Scholar] [CrossRef]
- Gabler, C.B.; Richey, R.G.; Rapp, A. Developing an eco-capability through environmental orientation and organizational innovativeness. Ind. Market. Manag. 2015, 45, 151–161. [Google Scholar] [CrossRef]
- Alpenberg, J.; Wnuk-Pel, T. Performance indicators for sustainability strategy implementation in a Swedish municipality. Presented at the 11th Asia-Pacific Management Accounting Association Annual Conference, Denpasar, Indonesia, 26–29 October 2015. [Google Scholar]
- Ramos, T.B.; Alves, I.; Subtil, R.; de Melo, J.J. The state of environmental performance evaluation in the public sector: The case of the Portuguese defence sector. J. Clean. Prod. 2009, 17, 36–52. [Google Scholar] [CrossRef]
- García-Sánchez, I.; Frías-Aceituno, J.; Rodríguez-Domínguez, L. Determinants of corporate social disclosure in Spanish local governments. J. Clean. Prod. 2013, 39, 60–72. [Google Scholar] [CrossRef]
- Campos, L.M.S.; de Melo Heizen, D.A.; Verdinelli, M.A.; Cauchick, M.P.A. Environmental performance indicators: A study on ISO 14001 certified companies. J. Clean. Prod. 2015, 99, 286–296. [Google Scholar] [CrossRef]
- SOU2007:93. Den Kommunala Självstyrelsens Grundlagsskydd. Available online: http://www.regeringen.se/contentassets/9d5af7bef6f147f6978523531d50ecd1/den-kommunala-sjalvstyrelsens-grundlagsskydd-sou-200793 (accessed on 4 February 2016).
- Lindström, A. Kommunsystem i Europa. 2:a Upplaga; Liber AB: Malmö, Sweden, 2003. [Google Scholar]
- Kommunallagen (KL), Svensk författningssamling 2017:725; Riksdag: Stockholm, Sweden, 2017; Available online: https://www.riksdagen.se/sv/dokument-lagar/dokument/svensk-forfattningssamling/kommunallag-2017725_sfs-2017-725 (accessed on 3 January 2018).
- Searcy, C. Corporate sustainability performance measurement systems: A review and research agenda. J. Bus. Ethics 2012, 107, 239–253. [Google Scholar] [CrossRef]
- Ilinitch, A.Y.; Soderstrom, N.S.; Thomas, T.E. Measuring corporate environmental performance. J. Account. Public Policy 1998, 17, 383–408. [Google Scholar] [CrossRef]
- Williams, B.; Wilmshurst, T.; Clift, R. Sustainability reporting by local government in Australia: Current and future prospects. Account. Forum 2011, 35, 176–186. [Google Scholar] [CrossRef]
- Greiling, D.; Traxler, A.; Stötzer, S. Sustainability reporting in the Austrian, German and Swiss public sector. Int. J. Public Sect. Manag. 2015, 28, 404–428. [Google Scholar] [CrossRef]
- Henebäck, A.; Jernmo, M. Hållbarhetsarbete i Svenska Kommuner—En Studie om Kommuners Arbete med Miljönyckeltal och Miljöredovisning. Master’s Thesis, Linnaeus University, Växjö, Sweden, 2016. [Google Scholar]
- World Commission on Environment and Development. Our Common Future; Oxford University Press: Oxford, UK, 1987. [Google Scholar]
- Elkington, J. Partnerships from cannibals with forks: The triple bottom line of 21st-century business. Environ. Qual. Manag. 1998, 8, 37–51. [Google Scholar] [CrossRef]
- Milne, M.; Ball, A.; Gray, R. Wither ecology? The triple bottom line, the Global Reporting Initiative, and the institutionalization of corporate sustainability reporting. Presented at the AFAANZ/IAAER Conference, Sydney, Australia, 6–8 July 2008. [Google Scholar]
- Wilson, J. Three triple bottom line—Undertaking an economic, social and environmental retail sustainability strategy. Int. J. Retail Distrib. Manag. 2015, 43, 432–447. [Google Scholar] [CrossRef]
- Greco, G.; Sciulli, N.; D’Onza, G. The influence of stakeholder engagement on sustainability reporting: Evidence from Italian local councils. Public Manag. Rev. 2015, 17, 465–488. [Google Scholar] [CrossRef]
- Global Reporting Initiative Focal Point Australia. Integrating Sustainability into Reporting—An Australian Public Sector Perspective; GRI Focal: Sydney, Australia, 2012. [Google Scholar]
- Dumay, J.; Guthrie, J.; Farneti, F. GRI sustainability reporting guidelines for public and third sector organizations. Public Manag. Rev. 2010, 12, 531–548. [Google Scholar] [CrossRef]
- Lundqvist, L.J.; Biel, A. ‘From Kyoto to the Town Hall: Transforming National Strategies into Local and Individual Action’. In From Kyoto to Town Hall. Making International and National Climate Policy Work at the Local Level; Lundqvist, L.J., Biel, A., Eds.; Earthscan: London, UK, 2007. [Google Scholar]
- Langford, R. Evironmental and Other Sustainability Performance Indicators—Some Key Features of Recent UN, GRI and UK Proposals and the Assurance Implications; The Corporate Responsibility Research Conference: Dublin, UK, 2008. [Google Scholar]
- Lodhia, S.; Jacobs, K.; Park, Y.J. Driving public sector environmental reporting. Public Manag. Rev. 2012, 14, 631–647. [Google Scholar] [CrossRef]
- Brammer, S.; Walker, H. Sustainable procurement in the public sector: An international comparative study. Int. J. Oper. Prod. Manag. 2011, 31, 452–476. [Google Scholar] [CrossRef]
- Dunn, C.M. Council approaches to implementing sustainability: A case of rearranging deck chairs on the Titanic? Aust. Geogr. 2010, 41, 351–366. [Google Scholar] [CrossRef]
- Gond, J.; Grubnic, S.; Herzig, C.; Moon, J. Configuring management control systems: Theorizing the integration of strategy and sustainability. Manag. Account. Res. 2012, 23, 205–223. [Google Scholar] [CrossRef] [Green Version]
- Lisi, I.E. Translating environmental motivations into performance: The role of environmental performance measurement systems. Manag. Account. Res. 2015, 29, 27–44. [Google Scholar] [CrossRef]
- Hara, M.; Nagao, T.; Hannoe, S.; Nakamura, J. New key performance indicators for a smart sustainable city. Sustainability 2016, 8, 206. [Google Scholar] [CrossRef]
- Henri, J.F.; Journeault, M. Eco-control: The influence of management control systems on environmental and economic performance. Account. Organ. Soc. 2010, 35, 63–80. [Google Scholar] [CrossRef]
- Arjaliès, D.L.; Mundy, J. The use of management control systems to manage CSR strategy: A levers of control perspective. Manag. Account. Res. 2013, 24, 284–300. [Google Scholar] [CrossRef]
- Fregonara, E.; Giordano, R.; Ferrando, D.G.; Pattono, S. Economic-environmental indicators to support investment decisions: A focus on the buildings’ end-of-life stage. Sustainability 2017, 7, 65. [Google Scholar] [CrossRef]
- Virtanen, T.; Tuomaala, M.; Pentti, E. Energy efficiency complexities: A technical and managerial investigation. Manag. Account. Res. 2013, 24, 401–416. [Google Scholar] [CrossRef]
- Almqvist, R.M. Två decennier med ‘New Public Management’—Succé eller fiasko? Kommunal Ekonomi och Politik 2004, 8, 7–24. [Google Scholar]
- Almqvist, R.M. New Public Management: NPM: Om Konkurrensutsättning, Kontrakt och Kontroll; Liber: Malmö, Sweden, 2006; ISSN 9789147077205. [Google Scholar]
- Bringselius, L. New Public Management—Ett Enkelt Penseldrag som Förklarar det Mesta? Organ. Samh. 2015, 1, 1–4. Available online: http://bringselius.se/onewebmedia/2015-01%20Bringselius%20-%20Organisation%20o%20samhalle.pdf (accessed on 3 January 2018).
- Dickinson, D.; Leeson, R.; Ivers, J.; Karic, J. Sustainability Reporting by Public Agencies: International Uptake, Forms and Practice; The Centre for Public Agency Sustainability Reporting: Melbourne, Australia, 2005. [Google Scholar]
- Hood, C. A public management for all seasons? Public Adm. 1991, 69, 3–19. [Google Scholar] [CrossRef]
- Hood, C. The “New Public Management” in the 1980s: Variation on a theme. Account. Organ. Soc. 1995, 20, 93–109. [Google Scholar] [CrossRef]
- Karlsson, T.S. New Public Management—Ett Nyliberalt 90-Talsfenomen? Studentlitteratur AB: Lund, Sweden, 2017; ISBN 9789144112442. [Google Scholar]
- Lane, J.-E. New Public Management; Routledge: London, UK, 2000; ISBN 9780415231879. [Google Scholar]
- Agevall, L. Väfärdens Organisering och Demokratin: En Analys av New Public Management; Växjö University Press: Växjö, Sweden, 2005; ISBN 9789147077205. [Google Scholar]
- Blomberg, S. Specialiserad Biståndshandläggning Inom den Kommunala Äldreomsorgen. Genomförandet av en Organisationsreform och dess Praktik; Lund University Publications: Lund, Sweden, 2004. [Google Scholar]
- Ramos, T.B. Environmental Performance Indicators for the Public Sectors. The Encyclopedia of Earth. 2007. Available online: http://www.eoearth.org/view/article/152631/ (accessed on 14 April 2016).
- Alcaraz-Quiles, F.J.; Navarro-Galera, A.; Ortiz-Rodríguez, D. Factors influencing the transparency of sustainability information in regional governments: An empirical study. J. Clean. Prod. 2014, 82, 179–191. [Google Scholar] [CrossRef]
- Lundberg, K.; Balfors, B.; Folkeson, L. Framework for environmental performance measurement in a Swedish public sector organization. J. Clean. Prod. 2009, 17, 1017–1024. [Google Scholar] [CrossRef]
- Ramani, T.; Zietsman, J.; Knowles, W.; Quadrifoglio, L. Sustainability enhancement tool for state departments of transportation using performance measurement. J. Transp. Eng. 2011, 137, 404–415. [Google Scholar] [CrossRef]
- Mazzi, A.; Mason, C.; Mason, M.; Scipioni, A. Is it possible to compare environmental performance indicators reported by public administrations? Results from an Italian survey. Ecol. Indic. 2012, 23, 653–659. [Google Scholar] [CrossRef]
- Williams, B. The local government accountants’ perspective on sustainability. Sustain. Account. Manag. Policy J. 2015, 6, 267–287. [Google Scholar] [CrossRef]
- Bellringer, A.; Ball, A.; Craig, R. Reasons for sustainability reporting by New Zealand local governments. Sustain. Account. Manag. Policy J. 2011, 2, 126–138. [Google Scholar] [CrossRef]
- Mavragani, A.; Nikolaou, I.E.; Tsagarakis, K.P. Open Economy, Institutional Quality, and Environmental Performance: A Macroeconomic Approach. Sustainability 2016, 8, 601. [Google Scholar] [CrossRef]
- Krause, R.M.; Feiock, R.C.; Hawkins, C.V. The administrative organization of sustainability within local government. J. Public Adm. Res. Theory 2016, 26, 113–127. [Google Scholar] [CrossRef]
- Keskitalo, E.C.H.; Liljenfeldt, J. Working with sustainability: Experiences of sustainability processes in Swedish municipalities. Nat. Resour. Forum 2012, 36, 16–27. [Google Scholar] [CrossRef]
- Issa, I.; Pigosso, D.; McAloone, T.; Rozenfeld, H. Leading product-related environmental performance indicators: A selection guide and database. J. Clean. Prod. 2015, 10, 321–330. [Google Scholar] [CrossRef]
- Hair, J.F., Jr.; Anderson, R.E.; Tatham, R.L.; Black, W.C. Multivariate Data Analysis, 5th ed.; Prentice Hall: Upper Saddle River, NJ, USA, 1998; ISBN 13: 9780138948580. [Google Scholar]
- Bystedt, A. Anläggningsinvesteringar I Svenska Kommuner—En Studie om hur Investeringsbedömningen Genomförs. Master’s Thesis, Linnaeus University, Växjö, Sweden, 2015. [Google Scholar]
- Epstein, M.; Roy, M. Managing corporate environmental performance: A multinational perspective. Eur. Manag. J. 1998, 16, 284–296. [Google Scholar] [CrossRef]
- Menguc, B.; Auh, S. Creating a firm-level dynamic capability through capitalizing on market orientation and innovativeness. J. Acad. Market. Sci. 2006, 34, 63–73. [Google Scholar] [CrossRef]
Figure 1.
Research model.
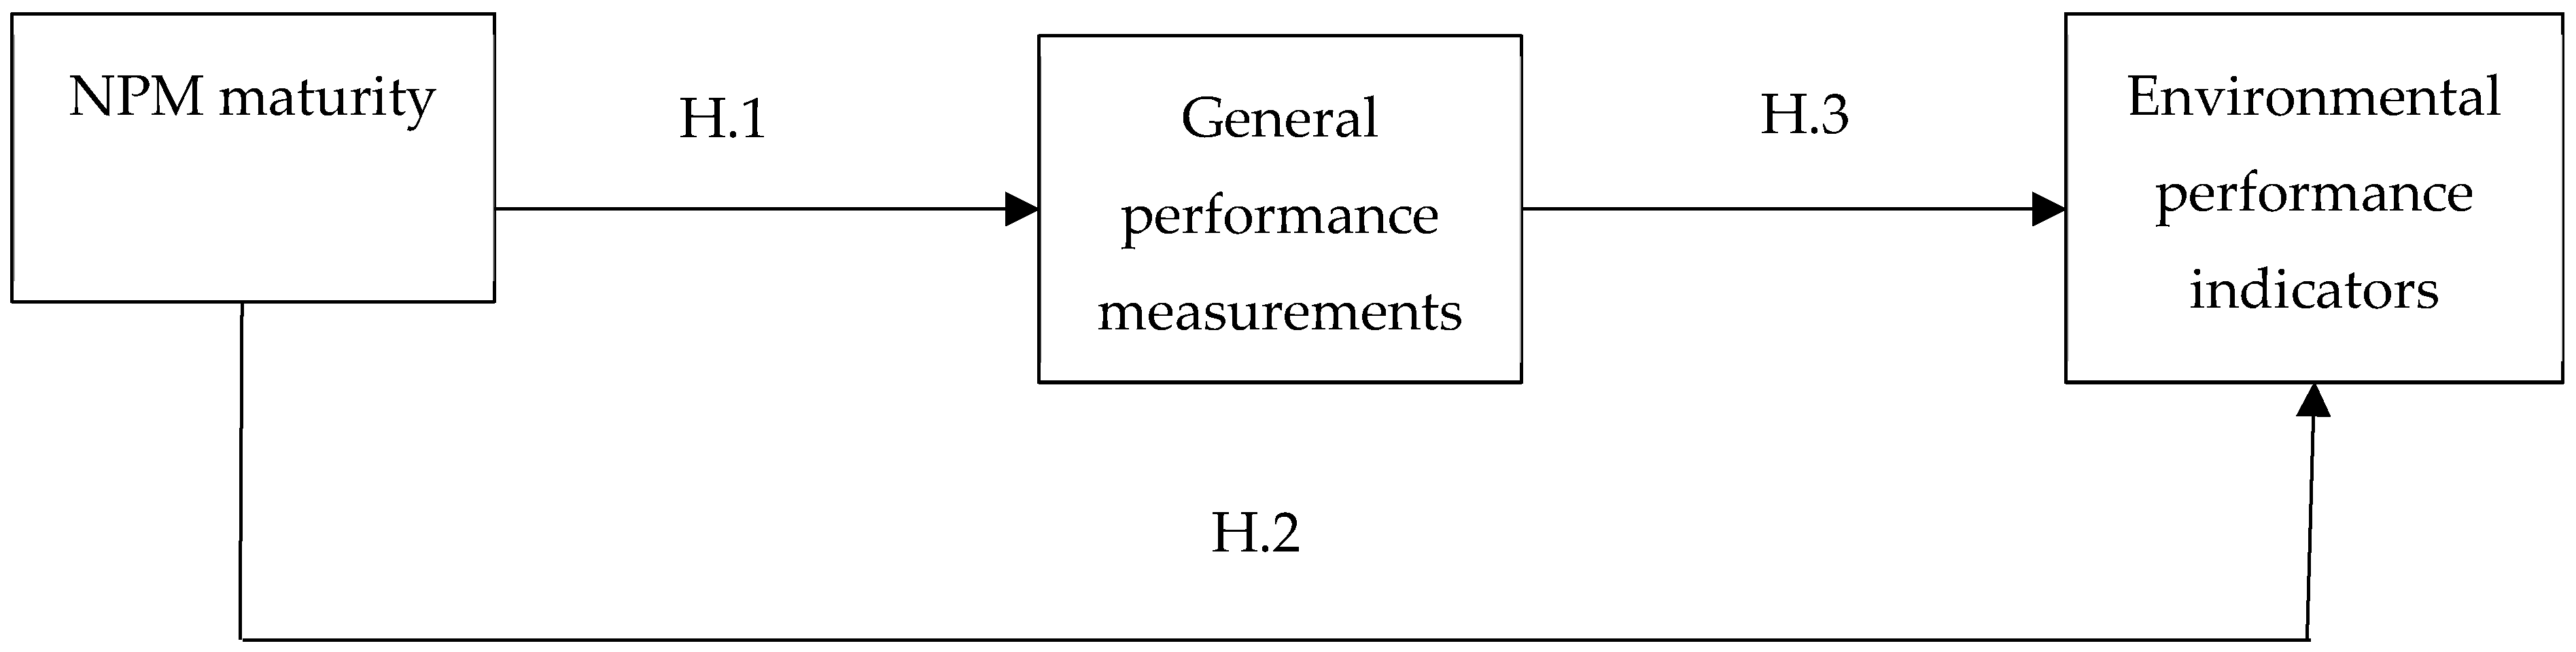
Table 1.
Size of the local governments (number of citizens).
| Number of Citizens | Local Governments with Environmental Performance Indicators | Local Governments without Environmental Performance Indicators | ||
|---|---|---|---|---|
| N | Percentage | N | Percentage | |
| <25,000 | 30 | 37.50% | 30 | 76.92% |
| 25,001–50,000 | 24 | 30.00% | 7 | 17.95% |
| 50,001–75,000 | 11 | 13.750% | 2 | 5.13% |
| 75,001–100,000 | 7 | 8.75% | 0 | 0.00% |
| 100,001–125,000 | 4 | 5.00% | 0 | 0.00% |
| 125,001–150,000 | 1 | 1.25% | 0 | 0.00% |
| >150,000 | 3 | 3.75% | 0 | 0.00% |
| Total | 80 | 100.00% | 39 | 100.00% |
Table 2.
Summary of the issues relating to NPM.
| Question | Me 1 | Me 2 | Mean Rank 1 (N = 80) | Mean Rank 2 (N = 39) | U | Z | p-Value of U Mann-Whitney Test |
|---|---|---|---|---|---|---|---|
| Is increased efficiency more important than increased societal benefits? | 2 | 3 | 58.78 | 62.50 | 1462.50 | −0.562065 | 0.574072 |
| Is the municipality presented as a group? | 2 | 2 | 62.86 | 54.13 | 1331.00 | 1.312929 | 0.189208 |
| Are the different entities in the municipality independent profit centers? | 5 | 4 | 62.59 | 54.68 | 1352.50 | 1.212351 | 0.225379 |
| Are profit and cost responsibilities decentralized to different subunits and councils? | 6 | 5 | 63.76 | 52.28 | 1259.00 | 1.823203 | 0.068274 |
| Are goals formulated for different operations (both within the municipality and for municipal companies)? | 5 | 5 | 61.41 | 57.12 | 1447.50 | 0.665331 | 0.505839 |
| Is the municipality outsourcing operations and projects to different companies? | 4 | 3 | 62.58 | 54.72 | 1354.00 | 1.184796 | 0.236099 |
| Are managers recruited externally? | 5 | 5 | 64.19 | 51.40 | 1224.50 | 1.969298 | 0.048920 ** |
| Is financial PI used for planning and control? | 5 | 3 | 64.36 | 51.05 | 1211.00 | 2.020737 | 0.043308 ** |
| Is there a focus on financial results? | 5 | 5 | 59.99 | 60.01 | 1559.50 | 0.000000 | 1.000000 |
| Is there a focus on operational effects? | 4 | 4 | 64.14 | 51.50 | 1228.50 | 1.919444 | 0.054929 |
| Is there a focus on process orientation? | 4 | 3 | 64.38 | 51.01 | 1209.50 | 2.014330 | 0.043976 ** |
| Is the municipality using centralized management groups? | 5 | 5 | 64.28 | 51.22 | 1217.50 | 2.008644 | 0.044576 ** |
| Is there a system for reviewing costs and quality? | 5 | 4 | 64.83 | 50.10 | 1174.00 | 2.227069 | 0.025943 ** |
| Is there a system for citizen complaints? | 5 | 4 | 66.18 | 47.32 | 1065.50 | 2.877164 | 0.004013 ** |
| Are the citizens viewed as customers? | 5 | 5 | 59.02 | 62.01 | 1481.50 | −0.453996 | 0.649832 |
1 = do not agree at all; 6 = do agree to a large extent. ** statistical significance at the level of α= 0.05, which means that there are differences between analyzed variables (statistically significant differences).
Table 3.
Basic descriptive statistics of NPM maturity index.
| Type of the Municipality | NPM Maturity Index | |||||||
|---|---|---|---|---|---|---|---|---|
| N | Vs | Me | Vq | min | max | S | ||
| Local governments with environmental performance indicators | 80 | 60.21 | 28.5 | 63.5 | 18.5 | 0 | 85 | 17.16 |
| Local governments without environmental performance indicators | 39 | 52.74 | 34.7 | 56.0 | 25 | 3 | 79 | 18.30 |
Table 4.
Goal setting in local governments.
| Statement | Me 1 | Me 2 | Mean Rank 1 (N = 80) | Mean Rank 2 (N = 39) | U | Z | p-Value of U-Mann Whitney Test |
|---|---|---|---|---|---|---|---|
| The municipality is using strategic goals which they try to reach | 6 | 5 | 68.04 | 43.51 | 917.00 | 3.903900 | 0.000095 ** |
| Strategic goals are broken down into more specific goals | 5 | 4 | 67.03 | 45.58 | 997.50 | 3.288696 | 0.001007 ** |
| Specific goals have a specific time period and are supposed to be reached within 1–2 years | 4 | 3 | 66.51 | 46.64 | 1039.00 | 2.997450 | 0.002723 ** |
| The goals are followed up on a regular basis with the help of the key performance indicators | 5 | 4 | 67.49 | 44.64 | 961.00 | 3.486032 | 0.000490 ** |
1 = do not agree at all; 6 = do agree to a large extent; ** the results are statistically significant at the level of α = 0.05, which means that there are differences between analyzed variables (statistically significant differences).
Table 5.
Number of general performance measurements used in local governments.
| Number of General Performance Measurements | Local Governments with Environmental Performance Indicators | Local Governments without Environmental Performance Indicators | ||
|---|---|---|---|---|
| N | Percentage | N | Percentage | |
| none | 2 | 2.50% | 4 | 10.25% |
| 1–10 | 6 | 7.50% | 7 | 17.95% |
| 11–20 | 4 | 5.00% | 12 | 30.77% |
| 21–30 | 11 | 13.75% | 5 | 12.82% |
| 31–40 | 5 | 6.25% | 2 | 5.13% |
| 41–50 | 2 | 2.50% | 0 | 0.00% |
| >50 | 50 | 62.50% | 9 | 23.08% |
| Total | 80 | 100% | 39 | 100.00% |
Table 6.
Mean value for environmental goal setting in local governments.
| Statements Concerning Goals | MV |
|---|---|
| The municipality is using strategic environmental goals which they try to reach | 5.27 |
| Strategic goals are broken down into more specific environmental goals | 4.72 |
| Specific environmental goals have a specific time period and are supposed to be reached within 1–2 years | 4.04 |
| The goals are followed up on a regular basis with the help of the key performance indicators for the environmental sustainability | 4.63 |
1 = do not agree at all; 6 = do agree to a large extent.
Table 7.
Number of EPIs used in local governments.
| Number of EPIs Used | N | Percentage |
|---|---|---|
| none | 1 | 1.39% |
| 1–10 | 18 | 25.00% |
| 11–20 | 24 | 33.33% |
| 21–30 | 6 | 8.33% |
| 31–40 | 5 | 6.94% |
| 41–50 | 1 | 1.39% |
| >50 | 17 | 23.62% |
| Total | 72 | 100.00% |
Table 8.
Environmental indicators used by Swedish local governments.
| Environmental Indicators with Focus on: | N | Percentage |
|---|---|---|
| Energy | 67 | 83.75% |
| Organic foods | 63 | 78.75% |
| Amount of household waste | 58 | 72.50% |
| Carbon dioxide emissions | 57 | 71.25% |
| Renewable fuels | 57 | 71.25% |
| Travel by public transport | 55 | 68.75% |
| Protected nature | 48 | 60.00% |
| Recycling | 45 | 56.25% |
| Environmentally certified schools and kindergartens | 43 | 53.75% |
| Hazardous waste | 42 | 52.50% |
| Pollutants in sewage sludge | 38 | 47.50% |
| Organic farming | 34 | 42.50% |
| Environmentally certified forestry | 34 | 42.50% |
| Pollution in urban air | 33 | 41.25% |
| Pollution in rivers | 32 | 40.00% |
| Other indicators | 31 | 38.75% |
| Water use | 27 | 33.75% |
| Biodiversity | 21 | 26.25% |
| Number of respondents | 80 | 100.00% |
Table 9.
General performance measurement index and EPI index.
| Type of the Municipality | General PM Index | |||||||
|---|---|---|---|---|---|---|---|---|
| N | Vs | Me | Vq | min | max | S | ||
| Local governments with environmental performance indicators | 80 | 12.41 | 22.13 | 13.25 | 3.5 | 2.5 | 15.5 | 2.75 |
| Local governments without environmental performance indicators | 39 | 9.58 | 31.75 | 10 | 5.5 | 3.0 | 14.5 | 3.04 |
| EPI Index | ||||||||
| Local governments with environmental performance indicators | 69 | 11.30 | 26.46 | 12 | 4.5 | 3.5 | 15.5 | 2.9 |
| Local governments without environmental performance indicators | - | - | - | - | - | - | - | - |
Table 10.
Reasons for the environmental orientation.
| Reasons for the Environmental Orientation | N | Min | max | S | Vs | Me | Q | ||
|---|---|---|---|---|---|---|---|---|---|
| To achieve environmental goals | 66 | 2 | 6 | 4.96 | 1.16 | 23.33 | 5 | 2 | 40.00 |
| Being able to make actions based on the results and improve environmental performance | 65 | 1 | 6 | 4.80 | 1.26 | 26.35 | 5 | 2 | 40.00 |
| Measuring performance | 63 | 1 | 6 | 4.44 | 1.35 | 30.45 | 5 | 2 | 40.00 |
| To live up to societal expectations | 62 | 2 | 6 | 4.36 | 1.24 | 28.53 | 4.5 | 2 | 44.44 |
| To motivate society to a more sustainable lifestyle | 64 | 1 | 6 | 4.34 | 1.24 | 28.48 | 5 | 1 | 20.00 |
| To control an activity or program | 61 | 1 | 6 | 4.33 | 1.47 | 33.94 | 5 | 3 | 60.00 |
| To comply with other organizations who report environmental work | 63 | 1 | 6 | 3.43 | 1.43 | 41.81 | 3 | 3 | 100.00 |
| Show that the municipality follows the prevailing laws | 63 | 1 | 6 | 3.27 | 1.53 | 46.67 | 3 | 2 | 66.67 |
| To reward staff | 60 | 1 | 6 | 2.40 | 1.22 | 51.00 | 2 | 2 | 100.00 |
1 = not at all; 6 = strongly motivated.
Table 11.
Targeted stakeholders for reporting.
| To Whom is the Municipality’s Environmental Report Directed? | Type of Player | n | min | max | S | Vs | Me | Q | ||
|---|---|---|---|---|---|---|---|---|---|---|
| Politicians | Internal | 66 | 2 | 6 | 5.44 | 0.9303 | 17.10 | 6 | 1 | 16.67 |
| Municipal department heads/CEOs | Internal | 64 | 1 | 6 | 4.98 | 1.2149 | 24.38 | 5 | 2 | 40.00 |
| The municipality’s residents | External | 65 | 2 | 6 | 4.85 | 1.1351 | 23.42 | 5 | 2 | 40.00 |
| Employees | Internal | 66 | 1 | 6 | 4.70 | 1.3355 | 28.43 | 5 | 2 | 40.00 |
| Municipal companies’ directors/CEOs | Internal | 62 | 1 | 6 | 4.55 | 1.4220 | 31.27 | 5 | 2 | 40.00 |
| Private companies | External | 64 | 1 | 6 | 3.39 | 1.4211 | 41.91 | 3 | 3 | 83.33 |
| Other municipalities | External | 63 | 1 | 6 | 2.98 | 1.3499 | 45.24 | 3 | 2 | 66.67 |
| National government | External | 63 | 1 | 5 | 2.18 | 1.1987 | 55.11 | 2 | 2 | 100.00 |
| EU, UN and other international organizations | External | 64 | 1 | 5 | 1.91 | 1.1915 | 62.51 | 1 | 2 | 200.00 |
1 = not at all; 6 = extremely frequent user.
© 2018 by the authors. Licensee MDPI, Basel, Switzerland. This article is an open access article distributed under the terms and conditions of the Creative Commons Attribution (CC BY) license (http://creativecommons.org/licenses/by/4.0/).
Share and Cite
MDPI and ACS Style
Alpenberg, J.; Wnuk-Pel, T.; Henebäck, A. Environmental Orientation in Swedish Local Governments. Sustainability 2018, 10, 459. https://doi.org/10.3390/su10020459
AMA Style
Alpenberg J, Wnuk-Pel T, Henebäck A. Environmental Orientation in Swedish Local Governments. Sustainability. 2018; 10(2):459. https://doi.org/10.3390/su10020459
Chicago/Turabian StyleAlpenberg, Jan, Tomasz Wnuk-Pel, and Amanda Henebäck. 2018. "Environmental Orientation in Swedish Local Governments" Sustainability 10, no. 2: 459. https://doi.org/10.3390/su10020459
Note that from the first issue of 2016, this journal uses article numbers instead of page numbers. See further details here.