Measuring Service Quality of Rural Accommodations

1
Department of Tourism and Hospitality Management, School of Business, Black Hills State University, Spearfish, SD 57799, USA
2
Department of Hospitality, Recreation and Tourism, California State University, East Bay, Hayward, CA 94542, USA
3
Department of Tourism Management, Daegu University, Gyeongsan 38453, Gyeongsangbuk-do, Korea
4
Department of Community Development, Kongju National University, Kongju 32439, Chungcheongnam, Korea
*
Author to whom correspondence should be addressed.
Sustainability 2018, 10(2), 443; https://doi.org/10.3390/su10020443
Submission received: 18 December 2017
/
Revised: 29 January 2018
/
Accepted: 6 February 2018
/
Published: 8 February 2018
(This article belongs to the Section Sustainable Urban and Rural Development)
Abstract
:The aim of this study is to examine the most important service quality factors for rural accommodations in rural tourism villages in South Korea by simultaneously utilizing Importance–Performance analysis (IPA) and gap analysis. The tabulated results were presented in a two-dimensional grid t showing the strengths and weaknesses of the tourism attributes being studied. Among the 18 items measuring the service quality of rural accommodations, there are no items identified for the concentrate quadrant. Ten items fall in the “Keep up the good work” quadrant, which indicates high performance and importance values. It also includes “the attitude of local residents”, “the attitude of the accommodation’s owner”, and “the expertise of the owner”. Management of rural accommodations in South Korea must make special efforts to maintain and improve service quality for these ten high performance and importance attributes. Gap analysis is used to illustrate how tourism operators can improve their service quality.
1. Introduction
Service quality has been considered as a main factor to differentiate service products and build a competitiveness in tourism. The issue of measuring service quality has received increasing attention in the tourism and recreation literature [1,2,3]. Service quality in the rural tourism industry has received increasing attention because the generation of income depends on how rural tourism operations provide quality service [4,5,6,7]. The profile of rural tourism operators often lacks required tourism service and management [4,5].
In South Korea, the demand for rural tourism has risen recently. According to the Rural Development Administration [8], 19% of urban people are familiar with rural tourism, and 23.4% have experienced rural tourism before. Furthermore, 70.4% are interested in having a rural tourism experience in the near future. The number of hospitality accommodation units available as tourist accommodation, according to the Rural Development Administration [8], was estimated to be about 13,000 rooms in 4400 farm-stay households. Rural tourism in South Korea is still at an introductory stage that most rural tourists are excursionists with a low rate of overnight stay and short stay.
Rural accommodations uniquely differ from traditional hotels, motels, and boarding houses located in the countryside. Rural accommodations have their own characteristics and harmonize with their surroundings and local cultures. Rural accommodations can be an important source of income for rural villages and destinations, especially if they provide more than just a bed for the night [5,7,9,10,11]. However, despite the vast amount of research done in the area of service quality, quality related issues in rural accommodations have received little research attention within the hospitality context. Good service quality provides a competitive advantage for rural tourism.
The two main research instruments are Importance–Performance Analysis (IPA) and SERVQUAL to investigate service quality of properties in the hospitality and tourism industry. Most of the previous studies have used and also modified SERVQUAL as the main measurement to examine service quality of various types of lodging properties [12,13,14]. However, these measurements are not appropriate for evaluating the service quality of rural accommodations because these do not contain specific service quality factors that represent rural accommodations [15].
Importance–Performance analysis (IPA) has been applied to different areas in the services industries [16,17,18,19,20,21]. IPA is a simple but effective tool because it can analyses service quality attributes on two dimensions: performance and importance [22]. It has been applied to the hotel industry [23,24], tourism policy [25], and tourist destinations [18,21]. And the combination of IPA and gap analysis helps maximize the validity of application [17,26,27,28]. Therefore, this research has utilized IPA and gap analysis simultaneously in order to improve and maximize the precision and validity of the application. It is because gap analysis helps provide more information on the differences between importance and performance after conducting an IPA. In this study, utilizing the IPA and gap analysis can be a helpful approach to find the key success service factors to provide better and more effective and efficient references and recommendations to rural accommodation operators in South Korea.
Rural tourism in South Korea suffers from two major problems which are inconsistent service quality and lack of appropriate service orientation. Product quality was traditionally linked to the technical specifications of goods, with the most definition of quality arising from the manufacturing sector. However, in the hospitality industry, many aspects of service quality do not lend themselves to standards. Quality aspects such as “friendliness”, “helpfulness” and “politeness” are likely to be interpreted differently by various tourists and assessed subjectively. Moreover, the environment in rural accommodations makes it different to provide consistent service quality. The study aims to investigate the differences between the importance (expectation) and performance (satisfaction) of tourists who have stayed in rural accommodations using IPA and gap analysis. This study will examine the importance and performance of tourists and analyze what lodging service qualities are the most important in terms of importance and performance. Furthermore, this study will investigate the differences between importance and performance among 18 items of service quality and divide the importance and performance of service quality into two categories to study the importance level and the performance level separately. Finally, this study will suggest effective strategies for improving the service quality of rural accommodations through identifying the characteristics of importance and performance of in service quality. The gap between importance and performance for tourism service will be analyzed and the marketing management implications will be discussed. This kind of information has practical implications for operators of rural tourism accommodation as they can direct their resources to improving weak service dimensions and to refining their marketing efforts so that customer expectations are met by the service delivered.
2. Literature Review
Rural accommodations uniquely differ from traditional hotels, motels, and boarding houses located in cities. Rural accommodations have their own characteristics and harmonize with their surroundings and local cultures. Rural accommodations can be an important source of income for rural villages and destinations, especially if they provide more than just a bed for the night [9]. By improving the quality of services delivered to customers, the wealth and income generated in rural areas can be increased and even bring greater satisfaction to tourists. Perceived service quality during a customer’s stay can bring return visitors. Excellent service leads to the loyalty of current customers, generates more income, and attracts new customers [29,30]. High quality services enable tourists to enjoy participating in the natural surroundings or the activities, customs, and lifestyles of local residents.
There are several issues in service quality in the previous literature. One of main issue is how the factors or dimensions are established in small size of tourism business such as rural accommodations. The initial study of service quality conducted by Grönroos [31] suggested three dimensions: technical quality, functional quality, and image. Parasuraman, Zeithaml, and Berry [13] initially established ten dimensions that were eventually combined into five [13] tangible elements, reliability, response capability, assurance, and empathy. Many other researchers have attempted to examine the dimensions, but no consensus exists. Babakus and Boller [32] found that the dimensions of service quality may differ based on type of service. Carman [33] claimed that the 10 dimensions suggested by Parasuraman et al. [13] were not applicable to every type of service and even discovered other dimensions, such as cost and convenience.
It can be argued that even all technical quality aspects are identical at all sites (e.g., size of the guest room or availability of toiletries in the quest bathroom), there could be major change in terms of functional quality (e.g., service provider’s attitude). In rural tourism, the functional quality is usually determined by only one or two individuals: the owners or operators [5].
There are other issues about instruments to measure service quality. The Importance–Performance Analysis and SERVQUAL are the two main research instruments that have been developed over the last several decades and those have been used to analyze the concepts of quality and consumer satisfaction in the service industry. The most widely used instrument is SERVQUAL, developed by Parasuraman et al. in 1988 and revised in 1991 [9]. In the tourism industry, SERVQUAL is the most widely used and accepted service quality measurement model [12,34] such as LODFSERV for service quality in hotels [35], LOGQUAL [36,37,38], and HOTELQUAL [39], DINESERV for restaurants [34], HISTOQUAL for historical houses [40] and ECOSERV for ecotourism [41], RURALQUAL [42,43,44,45]. In particular, RURALQUAL was introduced and designated by Loureiro [42] and was consisted of 22 items. RURALQUAL was made based on SERVQUAL model (Parasuraman et al. [13]). The different items used for the scale are based on the SERVQUAL scale, which is one before using the lodging (expectations) and another before leaving (perceptions).
IPA is a procedure that shows the relative importance of various attributes and the performance. One of the major benefits of using IPA is to identify areas for service quality improvements.
According to Deng [46], Taiwanese hot springs tourism case is presented to demonstrate the implementation of the proposed revised IPA. The effective and appropriate action direction for each satisfaction attribute acquired by applying the revised IPA thus enables business managers to achieve a competitive advantage. The revised IPA grid for dimension is only “empathy and assurance” dimension was identified in the “concentrate here” quadrant. And responsibility dimension was identified in the “low priority” quadrant.
According to Hudson and Shephard [18], by using the IPA technique, the study was to identify the attributes of a ski resort with focus groups and in-depth interviews. Final tabulated results were presented in a two-dimensional grid to show the strength and weaknesses of the tourism attributes being studied. The attributes appearing in the “concentrate here” quadrant were the majority of services on the slopes, comfortable beds, value for money in bars and restaurants and the prices in the ski shops.
Wade and Eagles [21] presented an application of the IPA technique to a sample of visitors to Tanzania’s National Parks. For Serengeti users, the concentrate here quadrant includes two attributes which are security for theft and low level of crowdedness. For Kilimanjaro National Park, the concentrate here quadrant includes five attributes which are low level of litter, security from theft, knowledge of guide, low level of crowdedness and accommodation.
Service quality will be judged on not only technical quality (outcome), but also on the process by which the service is functional quality (delivered). However, the intangible nature of most services suggests that it may often be difficult to identify objective performance indicators and, consequently, consumers may encounter difficulties in attempting to assess the quality of the service they receive.
Several measurements were newly developed and designed based on SERVEQUAL that are used in many previous researches since the original SERVQUAL is not proper to evaluate a small size of facilities in rural tourism. And those are RURALQUAL for a rural house in Portugal [42,43,44,45] and HISTOQUAL for historic house in U.K. [40,47]. Also, Reichel et al. [5] developed and utilized the new measurement based on SERVQUAL for rural accommodations in Israel and the number of items in the measurements has been decreased to better evaluate small size facilities in rural tourism. These measurements that examine the differences between expectation and satisfaction are all established on SERVQUAL. However, the limitation of the previous studies using the SERVQUAL-based measurements is that none of the previous studies were able to provide solutions on how to strategically improve each problematic item measuring service quality. On the other hand, IPA is an effective method of analysis since it measures and provides with clear results of what aspects of service quality of rural accommodations must be improved and/or maintained for service quality improvement strategies.
3. Methodology
3.1. Measurement
The majority of previous service quality studies have used SERVQUAL. However, SERVQUAL is most appropriate for large-sized accommodations and is not effective for evaluating small-sized accommodations like the rural accommodations. This is because SERVQUAL does not include several factors that must be considered when examining the service quality of small-sized accommodations [5,15].
In order to investigate the differences between the importance level and performance level of rural accommodations in South Korea, a total of 18 items of importance and performance for service quality were developed. Measurement for this study was developed based on Fleischer et al.’s measurement [15]. Because the measurement of Fleischer et al. [15] was rooted in SERVQUAL, the researchers modified the measurement in order to make them more suitable for rural accommodations. Fourteen of the 15 items from Fleisher et al. [15] were used for this study. Four items were added that addressed the specific characteristics of rural accommodations in South Korea. The 4 added questionnaires were “programs for adults”, “the cleanliness of food”, “the variety of excellent choices”, and “various opportunities in the village’s news and events”. The pilot study was conducted with rural tourists, and finally, a total of 18 items were selected and used.
The measurement for performance and importance was developed to have the same set of attributes (total 18 items) and the same scale (Likert 5-point scale), so that importance and performance can be directly compared for the same attributes via the IPA grid [48]. Responses to importance/performance were scored on a Likert five-point scale: 1 for “very low importance/performance”, 2 for “low importance/performance”, 3 for “neutral”, 4 for “high importance/performance”, and 5 for “very high importance/performance”.
3.2. Data Collection
The target population for this study was customers who visited rural villages and stayed at rural accommodations in South Korea. A random sampling method was used for the survey, and customers, who visited the villages and stayed at rural accommodations during the months of June to August 2014 were approached to participate in the survey.
This study investigated 54 rural tourism villages nation widely selected and promoted by the South Korean government for rural tourism village development projects. The regions were selected because they are distributed evenly nationwide across South Korea; Kangwon-do (15 villages), Gyeonggi-do (5), Chungcheongnam-do (9), Chungcheongbuk-do (5), Jeollabuk-do (4), Jeollanam-do (4), Gyeongsangbuk-do (5), Gyeongsangnam-do (4), and Jeju-do (3) (See Appendix A). The researchers visited the villages to explain the purpose of the study and receive permission to conduct a survey. The survey respondents filled out the intercept survey. A total of 500 questionnaires obtained; of these, 58 were not filled out completely and were unusable, so 442 visitors were used for this study.
3.3. Data Analysis
Identifying critical service attributes to improve overall quality under resource-limiting conditions has become absolutely necessary and IPA has been regarded as a simple and useful technique for rendering service quality. For this study, data analysis in the study has three folders. First of all, item reliability analysis was conducted to verify the reliability of the questionnaires used. Item analyses were conducted on a total of 36 items: 18 items for importance and 18 items for performance. Cronbach’s alpha (α) was used as the criterion. This scale performed well for both importance and performance. Cronbach’s α for importance was 0.952, and Cronbach’s α for performance was 0.957. The cut-off value of Cronbach’s α was 0.70 [49]. Therefore, the results indicate that both the importance scale and the performance scale used for this study have high internal consistency and show good reliability as scales.
Secondly, in order to obtain keen and detailed results and to assess the implications for management, IPA was performed. The grand means of the importance and performance scale were used as the crosshair point on the IPA grid. Then, the mean scores of the importance and performance of each service quality attribute were calculated and plotted on the IPA figure.
According to Chu and Choi [26], importance and performance are graphically displayed on an easily-interpreted, two-dimensional plot with importance on the vertical axis and performance on the horizontal axis [28]. Vertical and horizontal lines divide this plot into four quadrants, each of which represents different levels of importance and performance [50] and provide four different managerial recommendations [51]. The labels of the four quadrants refer to marketing efforts [52].
Interpretation of the IPA plot is straightforward [52]. Attributes that are important to customers, but that have fairly low-performance levels are classified into Quadrant 1, “Concentrate here”. Placement in this cell suggests that improvement efforts are necessary. Quadrant 2, “Keep up the good work”, displays attributes that are perceived to be very important to customers, and simultaneously, that the organization performs well. Some attributes may fall in Quadrant 3, “Low priority”, because both importance and performance ratings of the attributes are lower than the average. These items are likely to receive a low priority in resource allocation decisions. “Possible overkill” in Quadrant 4 specifies that the attributes falling in this area are relatively less important, but that the company performs well on these attributes.
Lastly, gap analysis provided simply in terms of a paired-sample t-test to test if significant gaps existed between the importance and performance. Gap analysis helps provide more information on the differences between importance and performance after conducting an IPA. Previous studies [53,54] have proved that an understanding of the gap between the expected service and the perceived service is necessary, and the combination of IPA and gap analysis helps maximize the validity of application [26,28].
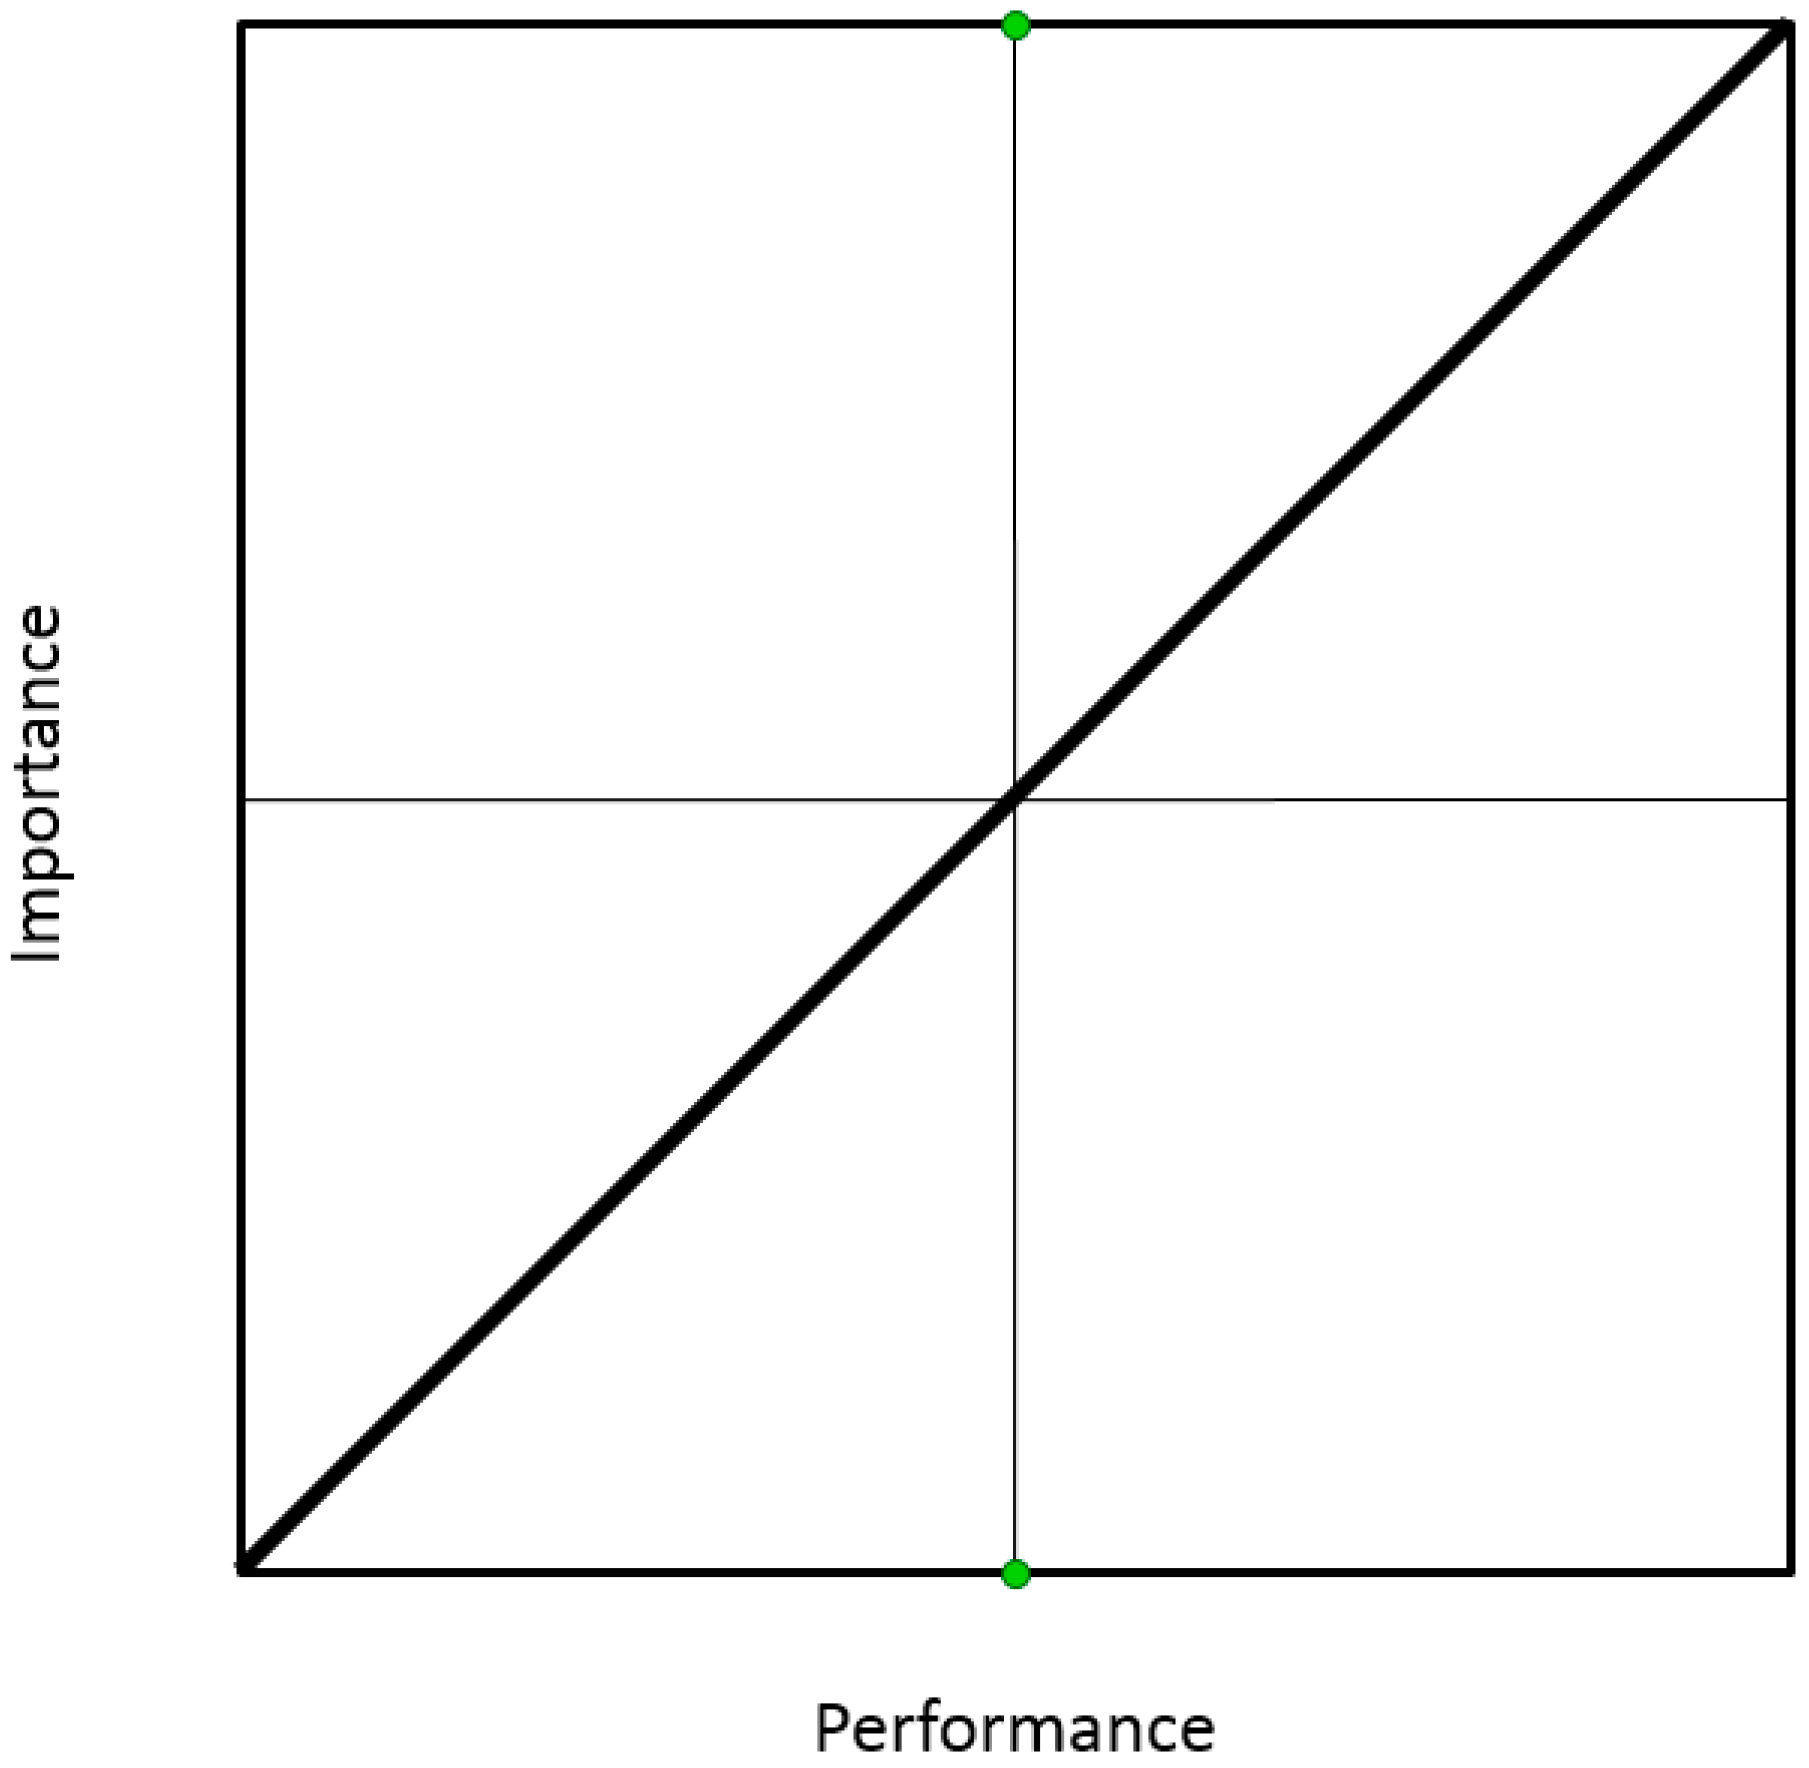
In Figure 1, a diagonal line is incorporated into the IPA grid. This line is called the iso-rating or iso-priority line and indicates where importance equals performance [48,55,56]. This line separates the graph into two areas. All negative gap points above the diagonal line indicate where management attention is required because importance exceeds performance. Positive gap points plotted below the line indicate that performance of an attribute exceeds the importance. This also means that there is already a high performance with relatively low importance, so no extra management attention is required. By plotting the importance-performance gap scores against the diagonal line, the gap analysis provides an indication of whether the focus and resources are being utilized adequately, insufficiently, or ineffectively [57].
4. Results
4.1. Respondent Profile
Table 1 shows the demographic profile of rural accommodation visitors. Among the 442 respondents, 43.7% were male and 56.3% were female. In terms of age, 35.1% of the respondents were 30–39 years old, 29.2% were 40–49 years old, 19.8% were 21–29 years old, and 11.3% were 50–59 years old. Only 3.1% were 20 years old or below, and 1.4% were above 60 years old. Regarding marital status, 68.5% of the respondents were married and 29.6% were single. Relatedly, rural tourists most likely to visit rural accommodation were those who visited with their families (52.2%), followed by with business colleagues (26.7%), and with friends (18.4%). Only 2.7% were alone when they visit rural accommodations. Also, 75.5% of families who visited had a child or children in their families. (See Table 1).
4.2. Importance–Performance Analysis
4.2.1. Perceived Importance and Performance of Rural Accommodations
Table 2 shows the IPA results. The sample size of each attribute (N) is displayed, and the importance means (I) performance means (P) of all the service quality attributes were analyzed and ranked in descending order. All 18 service quality attributes had importance means between 3.13 and 3.68, meaning that all respondents ranked the selected service attributes between “neutral” and “important”. The top five most important attributes for rural accommodations are “the attitude of the accommodation’s owner (M = 3.68)”, “the attitudes of local residents (M = 3.67)”, “the cleanliness of local food (M = 3.53)”. “The reservation system (M = 3.49)”, and “The room design and the surround landscape (M = 3.48)”. Rural tourists in South Korea perceived the attitude of the accommodation’s owners and local residents as the most important factor. This is understandable because a respect for life is based on Confucian ideas and has been valued in Korean culture for a long time. Also, “the cleanliness of local food” was considered as an important item. This may be due to respondents expecting to have healthy and neat food in rural areas, and also due to an increasing interest in the well-being and healthy lifestyles. People usually plan ahead before their trip or vacation, so convenient and easy reservation systems were also considered an important attribute of rural accommodations. Because location is always the number one factor for selecting lodging and the fact that room design is an important factor for choosing accommodations, “the room design and surrounding landscape” was also ranked as high.
Comparatively, the five least important service attributes were “the various offers of the rural village’s events and news (M = 3.13)”, “the programs with experience and convenience facilities (M = 3.13)”, “experiential activities for adults (M = 3.18)”, “experiential activities for children (M = 3.22)”, and “the guidebook for the local area and attractions (M = 3.23)”. Rural tourism visitors may not consider “the various offers of the rural village’s events and news” because the main reason for visiting rural areas is relaxation and recharging, as noted by previous literature. Since most rural tourism destinations in South Korea are small scale, tourists usually do not expect any experience or convenience facilities, various programs, and guidebooks (See Table 2).
4.2.2. IPA
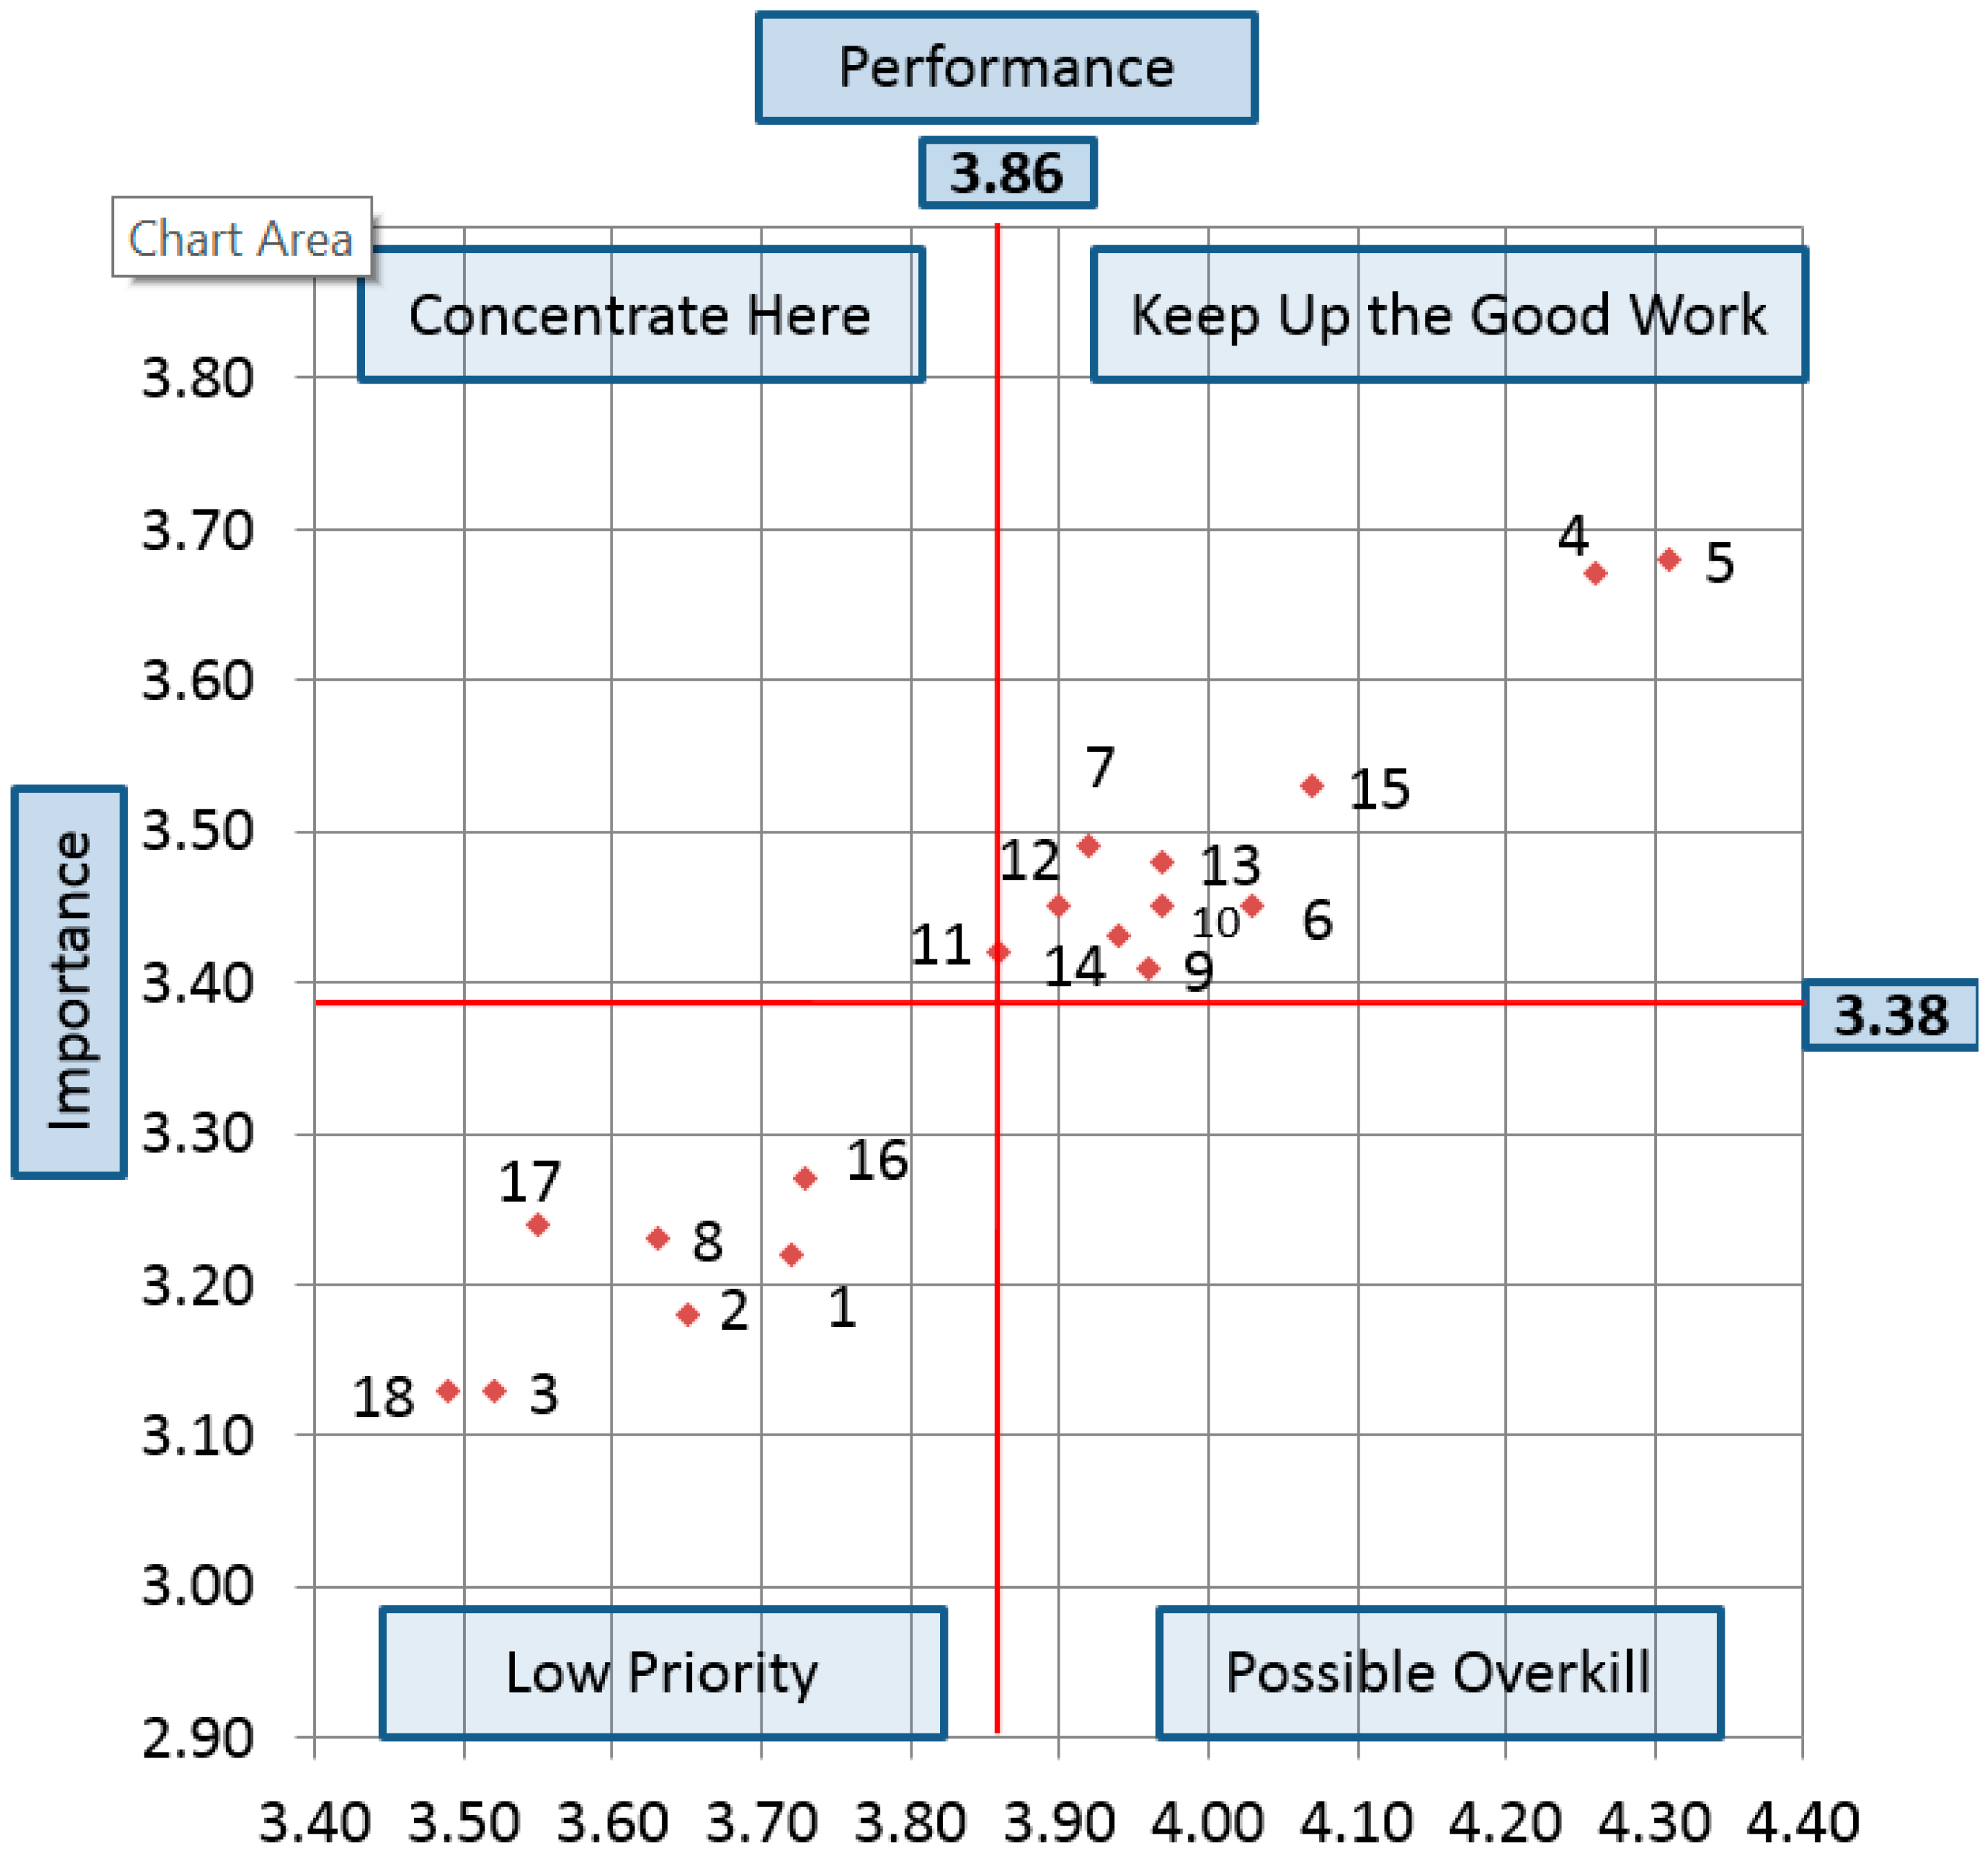
The IPA was applied to compare the importance and performance of rural accommodations in South Korea and also to provide suggestions to the management for future strategies to improve the service quality of rural accommodations. The IPA results are presented in Figure 2. The grand means for the importance and performance of the 18 items were used as a central point of the IPA grid [26]. The mean values of importance and performance are plotted in Figure 3 as based on the IPA results.
Among 18 rural accommodations’ service attributes, eleven were identified in the “Keep up the good work” area. These attributes were “4-the attitude of local residents”, “5-the attitude of the accommodation’s owner”, “6-the expertise of the owner”, “7-the reservation system”, “9-the size of the room in accommodation”, “10-the cleanliness of the room”, “12-the price level”, “13-the room design and the surrounding landscape”, “14-the restroom and bathroom condition”, and “15-the cleanliness of local food.” These ten attributes were perceived by customers as important and well performing. These results display the fact that overall, rural accommodations in South Korea have performed well in the above respects. However, only 4 attributes (4, 5, 6, and 15) have a high-performance value or a score above 4.0. The performance values of the other six attributes (7, 9, 10, 12, 13, and 14) are all less than 4.0, ranging from 3.90 to 3.97. Special efforts should be made to maintain and improve service quality for these six attributes, so they can eventually have high-performance values.
Interestingly, the attributes 5, 4, and 15 are ranked as the top three attributes in both importance and performance. These three attributes all fell into the “keep up the good work” quadrant and indicate that people perceived these attributes to be the most important and also highest performing in rural accommodations.
One attribute, “11-the air-conditioning system” had the performance value (3.86), which is the same as the grand mean of the performance value. This suggests that management made an effort with the air-conditioning system in order to move this attribute completely into the “Keep up the good work” area.
Seven attributes fell in the “Low priority” quadrant. These attributes included “1- experiential activities for children”, “2-experiential activities for adults”, “3-the programs with experience and convenience facilities”, “8-the guidebook the local area and local attractions”, “16-the furniture in the room”, “17-the variety of excellent choices”, and “18-the various offers of the rural village’s events and news.” These seven attributes are not perceived as important and did not perform well, so management is not likely to focus on these attributes as they should have low priority in resource allocation decisions.
4.2.3. Gap Values do not Always Equal Performance-Importance Exactly Due to Rounding
No attribute fell into the “Concentrate here” area, which is a positive result. Attributes in this area are considered as not important but performing well. This means that rural accommodations in South Korea are not wasting their resources on unimportant attributes. Also, no attribute fell into the “Possible overkill” area. Attributes in this quadrant are not perceived as important but perform well. The lack of attributes in this area indicates that rural accommodations in South Korea are performing well for the attributes considered salient.
4.2.4. Importance–Performance Gaps
Mapping the importance-performance values against the iso-rating line allows researchers to acquire a simple indication of whether the accommodation’s resources and focus are positioned properly or inadequately [9].
Table 3 contains the sample size (N), the mean performance (P), the mean importance (I), the mean gap (G), the t-value, and the statistical significance (sig) for each attribute. A diagonal line of a 45-degree angle where importance equals performance was added to the IPA grid. Rural accommodation visitors consistently rated the performance of rural accommodations higher than the importance. All of 18 attributes have a statistically significant positive gap value (p < 0.001), falling to the right of the diagonal line. Attributes plotted below the line indicate that performance exceeds importance, and attributes in this section are also considered “satisfactory.” On the contrary, positive gap scores might mean a possible waste of resources in areas where high performance already exists despite relatively low importance (See Table 3).
Interestingly, the top and bottom three attributes in the gap analysis are closely related to the results of IPA. The top three attributes that have the highest gap between Importance and Performance are “The attitude of the accommodation’s owner (1st/1st)”, “The attitudes of local residents (2nd/2nd)”, and “The expertise of the owner (7th/4th)”. The three attributes are in the upper ranks of IPA results. Furthermore, these are plotted in Quadrant 1 which is “Keep up the good work”. Meanwhile, the bottom three attributes are “The variety of excellent choices (13th/17th), “The various offers of the rural village’s events and news (18th/18th), and “The programs with experience and convenience facilities (17th/17th). The three attributes are in the lower ranks of IPA results. These are plotted in Quadrant 3 which is “Low priority”.
Although gap analysis provides simple and easily understood (or analyzed or applied) results for management action and resources allocation, it only provides a rough result and has one-dimensional implications [48]. The results of the gap model only deliver limited implications for the management of rural accommodations in South Korea since it only shows that all of the attributes were plotted below the iso-rating line [55], meaning that performance on an attribute exceeds the importance and also that there is already high performance with relatively low importance.
To gain keen and detailed results, and to assess the implications for management, the 45-degree diagonal line is added to the IPA grid. Figure 3 shows the combination of IPA and gap analysis. All of the importance-performance gap scores of the 18 attributes were plotted against the dotted line, which is the gap analysis’ iso-rating line [55]. By adding the IPA grid and the crosshair point that uses the average mean values of importance and performance, the results provide multidimensional information that helps to improve the precision of the resources distribution strategy [58] (See Figure 3).
5. Discussion and Conclusions
Rural accommodation operators may fail to understand market needs or fail to respond to the service expectations of their customers. Even though the traditional IPA model has been regarded as the most effective analytic technique for evaluating service quality and resources distribution, related research showed that there are limitations in using the traditional IPA model to carry out strategic analysis. These limitations cause a lower validity of practical application and lead to a misunderstanding of results. Therefore, this article further introduced the concept of a service quality gap model to correct the traditional IPA model. The combination of IPA and gap analysis described in this article mainly used the index function to first understand the service gap of service attributes supplied by current rural accommodations in South Korea, and to further respond to the strategic matrix.
On the whole, respondents rated performance higher than importance for all items. In general, service quality can be considered good when performance values exceed importance values. The result indicates that in most areas, generally, the performance of rural accommodations in South Korea is better than the customers’ perceptions of the selected service quality attributes as important factors.
Among the 18 service attributes, 11 service attributes are plotted in Quadrant 1, “Keep up the good work.” Quadrant 1 is composed of high performance and high importance attributes and indicates that the attributes located in the quadrant are the ones that are performing well and that tourists are more likely to emphasize. The majority of IPA research indicated that most attributes would be placed in this quadrant (keep up the good work) (e.g., [57]). In this research, most attributes were placed in this quadrant 1. Operators with rural accommodations in South Korea must keep an eye on those attributes and maintain the level of service that they are currently providing. We suggest that operators with rural accommodations even try to enhance and improve performance on those 11 service attributes. Among the 11 attributes, only 4 attributes received a performance value of higher than 4 (high performance). Operators should focus on higher levels of service with the other 7 attributes so they can receive higher performance. Since tourists focus more on these attributes, management must continuously attempt to provide high levels of service.
The other 7 attributes are plotted in Quadrant 3, “Low priority”. The attributes located in Quadrant 3 are the ones that tourists emphasize less and that had unsatisfactory performance levels. All of the seven attributes received higher performance values than importance values. It is a good that rural accommodations are doing a good job providing service attributes that tourists do not expect a lot from; however, even though the seven attributes in this area have importance values below average, management should not reduce their efforts for these services. Previous researchers have found that customers are extremely satisfied when service exceeds expectations [27]. Providing service beyond expectation can lead to customer loyalty behavior, such as re-visitation, positive word-of-mouth, and recommendations to others [59,60]. Without wasting too many resources on those marginal attributes, rural accommodations must maintain quality on that service attributes. Rural tourists do not expect various activities or programs, furniture in the room, excellent choices, and guidebooks from rural accommodations. There are two reasons. First, rural tourist understands that rural tourism in South Korea is in the initial stage. Therefore, the tourists already guess that accommodations in rural areas have backward facilities compared to other big scale facilities for the mass tourism. Secondly, because one of the most important motivations to visit the rural tourism is for a refreshment of relaxation [61], they do not care the factors what activities or programs could be provided from the accommodation and furniture in the room.
While it is relatively easy to define and assess product quality, the quality of service concept often constitutes a challenge in terms of definition and evaluation. The results of the gap analysis show that all of the 18 service attributes evaluated of rural accommodation in South Korea have positive gaps, indicating that most service attributes satisfy consumer expectations. Thus, from the viewpoint of a service quality gap model, no extra management effort is required for the attributes below the diagonal line. However, the researchers also recommend that operators of rural accommodations maintain their current performance level in order to attract more tourists and encourage tourists to have repeat visits. Also, once again, resources must be adequately distributed, not insufficiently or ineffectively [57].
It should be noted that the operators need to increase the demand for rural accommodation because most service attributes satisfy tourist expectation. By comparing tourists’ perception of importance and performance, the operators of rural accommodation are able to determine whether the service standard exceeds, meets, or falls below tourist perception of importance. In essence, satisfaction occurs whenever the difference between importance and performance tends to be small. Expected quality is determined by marketing communication, image, word-of-mouth and tourist needs. Experienced service quality is determined by technical and functional quality. It should be noted that technical gaps can be mitigated or even ignored if operators’ attitudes were perceived as highly supportive and positive.
Furthermore, there is one result from the combination of IPA and Gap Analysis. Interestingly, the top and bottom three attributes in the gap analysis are closely related to the results of IPA. These results can show that visitors have more satisfaction when they satisfied with the attributes that they perceive more important compared to the attributes that they perceive less important. Therefore, operators of rural accommodations need to focus on the attributes which have the larger differences between importance and performance.
There are several points that we must consider the results of this study. As the ranking of importance values shows, tourists want to receive respect and be treated well by local residents and the owners of rural accommodations. Once we understand that South Korea’s culture is based on Confucian ideas, and thus respect, this is understandable. In the fast-moving, stressful, and heartless society, tourists hope to receive respect from other people during their vacations. Tourists still want to feel this connection to human nature that they cannot feel at all in today’s hard-hearted society. The high-performance values related to the emotions and attitudes of accommodation owners and local residents demonstrate that rural tourists can experience traditional human nature in rural accommodations in South Korea. Rather than having various programs and activities, tourists visit rural villages and rural accommodations to rest and enjoy the experience of a life of leisure.
There are some limitations to the study. First, even though quantitative research is the most widely used and useful research tool, qualitative research might provide further information in order to better understand the behavior of rural tourists from different angles of perspectives. The quantitative research method can only provide limited information and results. Many researchers have strongly recommended qualitative research and mixed method research [62]. By conducting qualitative studies, researchers can gain detailed and deeper information on rural tourism, rural accommodations, and the behavior of rural tourists. Focus groups, interviews, case studies, and observations might be good ways to conduct future qualitative studies. Second, due to its simplicity, IPA as originally by Martilla and James [52], is probably the most widely used tool for identifying improvement opportunities in products and services. Despite its wide use, however, original IPA has limitations that must be considered to avoid decision errors. It does not consider the existence of nonlinear relationships between attributes performance and customer satisfaction [63]. And it does not know about the performance of its competitors’ products and services [64]. In order to overcome original IPA, the future study needs to hire the diagonal IPA.
Acknowledgments
This paper was supported by the Rural Development Administration of Republic of Korea (grant No. PJ907146)
Author Contributions
Hyunsuk Choi: paper concept, literature review, theory, discussions, conclusions, and writing of analysis. Seahya Ann: support for concept, methodology, and writing of analysis. Kwang-Woo Lee: support for concept, theory, and conclusions. Duk-Byeong Park: literature review, data collection, writing of analysis.
Conflicts of Interest
The authors declare no conflict of interest.
Appendix A

Table A1.
The list of selected rural villages in South Korea.
| Province | City/District | Villages | Province | City/District | Villages | ||
|---|---|---|---|---|---|---|---|
| 1. | Kangwon | Gangneung | Haesari | 28. | Chungnam | Taean | Byutgari |
| 2. | Goseong | Sottongryong | 29. | Taean | Jogaeburi | ||
| 3. | Yanggu | Omiri | 30. | Hongsung | Turtle | ||
| 4. | Cheorwon | Odaemi | 31. | Seocheon | Eseckchaeheom | ||
| 5. | Inje | Natgang | 32. | Seocheon | Dalgogaemoshi | ||
| 6. | Pyeongchang | Seolmaneowa | 33. | Seocheon | Flower | ||
| 7. | Goseong | Wangsangol | 34. | Dangjin | Sumi | ||
| 8. | Inje | Hwangtae | 35. | Boryeong | Gajae | ||
| 9. | Goseong | Haksanri | 36. | Asan | Oeam | ||
| 10. | Pyeongchang | Baram | 37. | Chungbuk | Cheongwon | Beollat Hanji | |
| 11. | Pyeongchang | Surim | 38. | Yeongdong | Keum River Mochi | ||
| 12. | Chuncheon | Bugwiri | 39. | Boeun | Gubyeong | ||
| 13. | Hwacheon | Sansokhosu | 40. | Cheongwon | Obacksa | ||
| 14. | Hwacheon | Paroho Ecological | 41. | Danyang | Handeumi | ||
| 15. | Hwacheon | Paroho Nuereup | 42. | Jeonbuk | Gunsan | Tteurareum | |
| 16. | Gyeonggi | Yangpyeong | Sinronri | 43. | Jinan | Neunggil | |
| 17. | Pocheon | Gyodong | 44. | Namwon | Daroreum | ||
| 18. | Yeoju | Sanghori | 45. | Muju | Jindo Environmental Agriculture | ||
| 19. | Yeoncheon | Saedungji | 46. | Gyeongbuk | Yeongdeok | Naragol Borimal | |
| 20. | Pocheon | Sutkkol | 47. | Gyeongju | Oksan Seasim | ||
| 21. | Jeju | Seogwipo | Aeomeongabang | 48. | Gimcheon | Yetnal Somssi | |
| 22. | Seogwipo | Yongwangnandeureu | 49. | Andong | Chamsari Gasong | ||
| 23. | Jeju | Aopkkut | 50. | Cheongsong | Chamsoseul | ||
| 24. | Gyeongnam | Uiryeong | Sancheollyeop | 51. | Jeonnam | Muan | Baengnyeonheukong |
| 25. | Namhae | Darangyi | 52. | Jangheung | Dung beetle | ||
| 26. | Namhae | Jijok | 53. | Gurye | Damurak | ||
| 27. | Sancheong | Yenamchon | 54. | Muan | Sooryeon |
References
- Augustyn, M.; Ho, S.K. Service quality and tourism. J. Travel Res. 1998, 37, 71–75. [Google Scholar] [CrossRef]
- Crompton, J.; MacKay, K.J.; Fesenmaier, D.R. Identifying dimensions of service quality in public recreation. J. Park Recreat. Adm. 1991, 9, 15–27. [Google Scholar]
- Crompton, J.; Love, J.L. The predictive validity of alternative approaches to evaluating quality of a festival. J. Travel Res. 1995, 34, 11–24. [Google Scholar] [CrossRef]
- Alexander, N.; McKenna, A. Rural tourism in England. International. J. Contemp. Hosp. Manag. 1998, 10, 203–207. [Google Scholar] [CrossRef]
- Reichel, A.; Lowengart, O.; Milman, A. Rural tourism in Israel: Service quality and orientation. Tour. Manag. 2000, 21, 451–459. [Google Scholar] [CrossRef]
- Rozman, C.; Potochik, M.; Pazek, K.; Borec, A.; Majkovic, D. A multi-criteria assessment of tourist farm service quality. Tour. Manag. 2009, 30, 629–637. [Google Scholar] [CrossRef]
- Sharpley, R. Rural tourism and the challenge of tourism diversification: The case of Cyprus. Tour. Manag. 2002, 23, 233–244. [Google Scholar] [CrossRef]
- Rural Development Administration. Annual Report on Rural Tourism in 2009; Rural Development Administration: Suwon, Korea, 2009. [Google Scholar]
- Albacete-Sáez, C.A.; Mar Fuentes-Fuentes, M.; Javier Lloréns-Montes, F. Service quality measurement in rural accommodation. Ann. Tour. Res. 2007, 34, 45–65. [Google Scholar] [CrossRef]
- Crouch, G.I.; Ritchie, J.R. Tourism, competitiveness, and societal prosperity. J. Bus. Res. 1999, 44, 137–152. [Google Scholar] [CrossRef]
- Goss-Turner, S. The accommodation sector. In Introduction to Hospitality Operations; Jones, P., Ed.; Cassell: London, UK, 1996; pp. 21–35. [Google Scholar]
- LeBlanc, G. Factors affecting customer evaluation of service quality in travel agencies: An investigation of customer perceptions. J. Travel Res. 1992, 30, 10–16. [Google Scholar] [CrossRef]
- Parasuraman, A.; Zeithaml, V.A.; Berry, L.L. A conceptual model of service quality and its implications for future research. J. Mark. 1985, 49, 41–50. [Google Scholar] [CrossRef]
- Saleh, F.; Ryan, C. Analysing service quality in the hospitality industry using the SERVQUAL model. Serv. Ind. J. 1991, 11, 324–345. [Google Scholar] [CrossRef]
- Fleischer, A.; Rotem, A.; Banin, T. New Directions in Recreation and Tourism Activities in the Rural Sector in Isreal: Demand and Supply Factors; Research Report; Development Study Center: Rehovot, Israel, 1993. [Google Scholar]
- Ennew, C.T.; Reed, G.V.; Binks, M.R. Importance-performance analysis and the measurement of service quality. Eur. J. Mark. 1993, 27, 59–70. [Google Scholar] [CrossRef]
- Hudson, S.; Hudson, P.; Miller, G.A. The measurement of service quality in the tour operating sector: A methodological comparison. J. Travel Res. 2004, 42, 305–312. [Google Scholar] [CrossRef] [Green Version]
- Hudson, S.; Shephard, G. Measuring service quality at tourist destinations: An application of importance-performance analysis to an Alpine Ski Resort. J. Travel Tour. Mark. 1998, 7, 61–77. [Google Scholar] [CrossRef]
- Ritchie, B. Visitor Attraction Satisfaction Benchmarking Project; CRC for Sustainable Tourism Pty Ltd.: Gold Coast, Queensland, Australia, 2008. [Google Scholar]
- Tsai, W.-H.; Hsu, W.; Chou, W.-C. A gap analysis model for improving airport service quality. Total Qual. Manag. Bus. Excell. 2011, 11, 1025–1040. [Google Scholar] [CrossRef]
- Wade, D.J.; Eagles, P.F.J. The use of importance-performance analysis and market segmentation for tourism management in parks and protected areas: An application to Tanzania’s National Park. J. Ecotour. 2003, 2, 196–212. [Google Scholar] [CrossRef]
- Lai, I.K.W.; Hitchcock, M. Importance-performance analyses in tourism: A framework for researchers. Tour. Manag. 2015, 48, 242–267. [Google Scholar] [CrossRef]
- Bush, R.P.; Ortinau, D.J. Discriminating first time and repeat patrons of a retail service hotel complex: A case study. Mark. Environ. Chang. Noviembre 1986, 281–285. [Google Scholar]
- Martin, D.W. An importance-performance analysis of service providers’ perception of service quality service in the hotel industry. J. Hosp. Leis. Mark. 1995, 3, 5–17. [Google Scholar] [CrossRef]
- Evans, M.R.; Chon, K. Formulating and evaluating tourism policy using importance-performance analysis. Hosp. Educ. Res. J. 1990, 14, 203–213. [Google Scholar]
- Chu, R.K.S.; Choi, T. An importance-performance analysis of hotel selection factors in the Hong Kong hotel industry: A comparison of business and leisure travelers. Tour. Manag. 2000, 21, 363–377. [Google Scholar] [CrossRef]
- Lin, S.; Chan, Y.; Tsai, M. A transformation function corresponding to IPA and gap analysis. Total Qual. Manag. 2009, 20, 829–846. [Google Scholar] [CrossRef]
- Taplin, R.H. Competitive importance-performance analysis of an Australian wildlife park. Tour. Manag. 2012, 33, 29–37. [Google Scholar] [CrossRef]
- Kozak, M. Repeaters’ behavior at two distinct destinations. Ann. Tour. Res. 2001, 28, 784–807. [Google Scholar] [CrossRef]
- Tian-Cole, S.; Crompton, J. A conceptualization of the relationships between service quality and visitor satisfaction, and their links to destination selection. Leis. Stud. 2003, 22, 65–80. [Google Scholar] [CrossRef]
- Grönroos, C. A service quality model and its marketing implications. Eur. J. Mark. 1984, 18, 36–44. [Google Scholar] [CrossRef]
- Babakus, E.; Boller, G.W. An empirical assessment of the SERVQUAL scale. J. Bus. Res. 1992, 24, 253–268. [Google Scholar] [CrossRef]
- Carman, J.M. Consumer perceptions of service quality: An assessment of the SERVQUAL dimensions. J. Retail. 1990, 66, 33–55. [Google Scholar]
- Stevens, P.; Knutson, B.; Patton, M. DINESERV: A tool for measuring service quality in restaurants. Cornell Hotel Restaur. Adm. Q. 1995, 36, 556–560. [Google Scholar] [CrossRef]
- Knutson, B.; Stevens, P.; Wullaert, C.; Patton, M.; Yokoyama, F. LODGSERV: A service quality index for the lodging industry. J. Hosp. Tour. Res. 1990, 14, 277–284. [Google Scholar] [CrossRef]
- Getty, J.M.; Thompson, K.N. A procedure for scaling perceptions of lodging quality. Hosp. Res. J. 1994, 18, 75. [Google Scholar]
- Patton, M.; Stevens, P.; Knutson, B.J. Internationalizing LODGSERV as a measurement tool: A pilot study. J. Hosp. Leis. Mark. 1994, 2, 39–55. [Google Scholar] [CrossRef]
- Suh, S.H.; Lee, Y.H.; Park, Y.; Shin, G.C. The impact of consumer involvement on the consumers' perception of service quality-focusing on the Korean hotel industry. J. Travel Tour. Mark. 1997, 6, 33–52. [Google Scholar] [CrossRef]
- Falces, C.; Sierra, B.; Becerra, A.B.P. HOTELQUAL: Una escala para medir calidad percibida en servicios de alojamiento. Estudios Turísticos 1999, 139, 95–110. [Google Scholar]
- Frochot, I.; Hughes, H. HISTOQUAL: The development of a historic houses assessment scale. Tour. Manag. 2000, 21, 157–167. [Google Scholar] [CrossRef]
- Khan, M. ECOSERV: Ecotourists’ quality expectations. Ann. Tour. Res. 2003, 30, 109–124. [Google Scholar] [CrossRef]
- Loureiro, S.M.C. Gestión de la Calidad en el Turismo Rural. Ph.D. Dissertation, University of Extremadura, Badajoz, Spain, TESEO and New University of Lisbon, Lisbon, Portugal, 28 June 2007. [Google Scholar]
- Loureiro, S.M.C.; González, F.J.M. The importance of quality, satisfaction, trust, and image in relation to rural tourist loyalty. J. Travel Tour. Mark. 2008, 25, 117–136. [Google Scholar] [CrossRef]
- Loureiro, S.M.C.; González, M.; Javier, F. Perceived quality in rural lodgings in Spain and Portugal: The ruralqual scale. Port. J. Manag. Stud. 2009, 14, 33–52. [Google Scholar]
- Loureiro, S.M.C.; Kastenholz, E. Corporate reputation, satisfaction, delight, and loyalty towards rural lodging units in Portugal. Int. J. Hosp. Manag. 2011, 30, 575–583. [Google Scholar] [CrossRef]
- Deng, W. Using a revised importance–performance analysis approach: The case of Taiwanese hot springs tourism. Tour. Manag. 2007, 28, 1274–1284. [Google Scholar] [CrossRef]
- Frochot, I. An investigation into the influence of the benefits sought by visitors on their quality evaluation of historic houses’ service provision. J. Vacat. Mark. 2003, 10, 223–239. [Google Scholar] [CrossRef]
- Dwyer, L.; Cvelbar, L.K.; Edwards, D.; Mihalic, T. Fashioning a destination tourism future: The case of Slovenia. Tour. Manag. 2012, 33, 305–316. [Google Scholar] [CrossRef]
- Nunnally, J. Psychometric Methods; McGraw-Hill: New York, NY, USA, 1978. [Google Scholar]
- Chang, Y.C.; Chen, C.F. Identifying mobility service needs for disabled air passengers. Tour. Manag. 2011, 32, 1214–1217. [Google Scholar] [CrossRef]
- Oh, H. Revisiting importance-performance analysis. Tour. Manag. 2001, 22, 617–627. [Google Scholar] [CrossRef]
- Martilla, J.; James, J.C. Important-performance analysis. J. Mark. 1977, 41, 13–17. [Google Scholar] [CrossRef]
- Fick, G.R.; Brent Ritchie, J.R. Measuring service quality in the travel and tourism industry. J. Travel Res. 1991, 30, 2–9. [Google Scholar] [CrossRef]
- Murphy, A.E. Illustrating the utility of a modified gap analysis as a regional tourism planning tool: Case study of potential Japanese and German travelers to the Cowichan region. J. Travel Res. 2003, 41, 400–409. [Google Scholar] [CrossRef]
- Bacon, D.R. A comparison of approaches to importance-performance analysis. Int. J. Mark. Res. 2003, 45, 55–71. [Google Scholar] [CrossRef]
- Slack, N. The importance-performance matrix as a determinant of improvement priority. Int. J. Oper. Prod. Manag. 1994, 14, 59–75. [Google Scholar] [CrossRef]
- Tongue, J.; Moore, S.A. Importance-satisfaction analysis for marine-park hinterlands: A Western Australia case study. Tour. Manag. 2007, 28, 768–776. [Google Scholar] [CrossRef]
- Chen, F.Y.; Chang, Y.H. Examining airline service quality from a process perspective. J. Air Transp. Manag. 2005, 11, 79–87. [Google Scholar] [CrossRef]
- Bruhn, M.; Grund, M.A. Theory, development and implementation of national customer satisfaction indices: The Swiss Index of Customer Satisfaction (SWICS). Total Qual. Manag. 2000, 11, 1017–1028. [Google Scholar] [CrossRef]
- Cassel, C.; Eklöf, J.A. Modelling customer satisfaction and loyalty on aggregate levels: Experience from the ECSI pilot study. Total Qual. Manag. 2001, 12, 834–841. [Google Scholar] [CrossRef]
- Park, D.B.; Yoon, Y.S. Segmentation by motivation in rural tourism: A Korean case study. Tour. Manag. 2009, 30, 99–108. [Google Scholar] [CrossRef]
- Creswell, J. Research Design: Qualitative, Quantitative, and Mixed Methods Approaches; SAGE Publications: New York, NY, USA, 2009. [Google Scholar]
- Kano, H.; Seraku, N.; Takahashi, S.; Tsuji, S. Attribute quality vs must be quality. J. Jpn. Soc. Qual. Control 1984, 14, 39–48. [Google Scholar]
- Tontini, G.; Picolo, J.D. Identifying the impact of incremental innovations on customer satisfaction using a fusion method between importance-performance analysis and Kano model. Int. J. Qual. Reliab. Manag. 2014, 31, 32–52. [Google Scholar] [CrossRef]
Figure 1.
The gap-diagonal line on Importance–Performance Analysis (IPA) grid.

Figure 2.
Importance–performance analysis for rural accommodations in South Korea.

Figure 3.
The combination of gap analysis and IPA analysis.
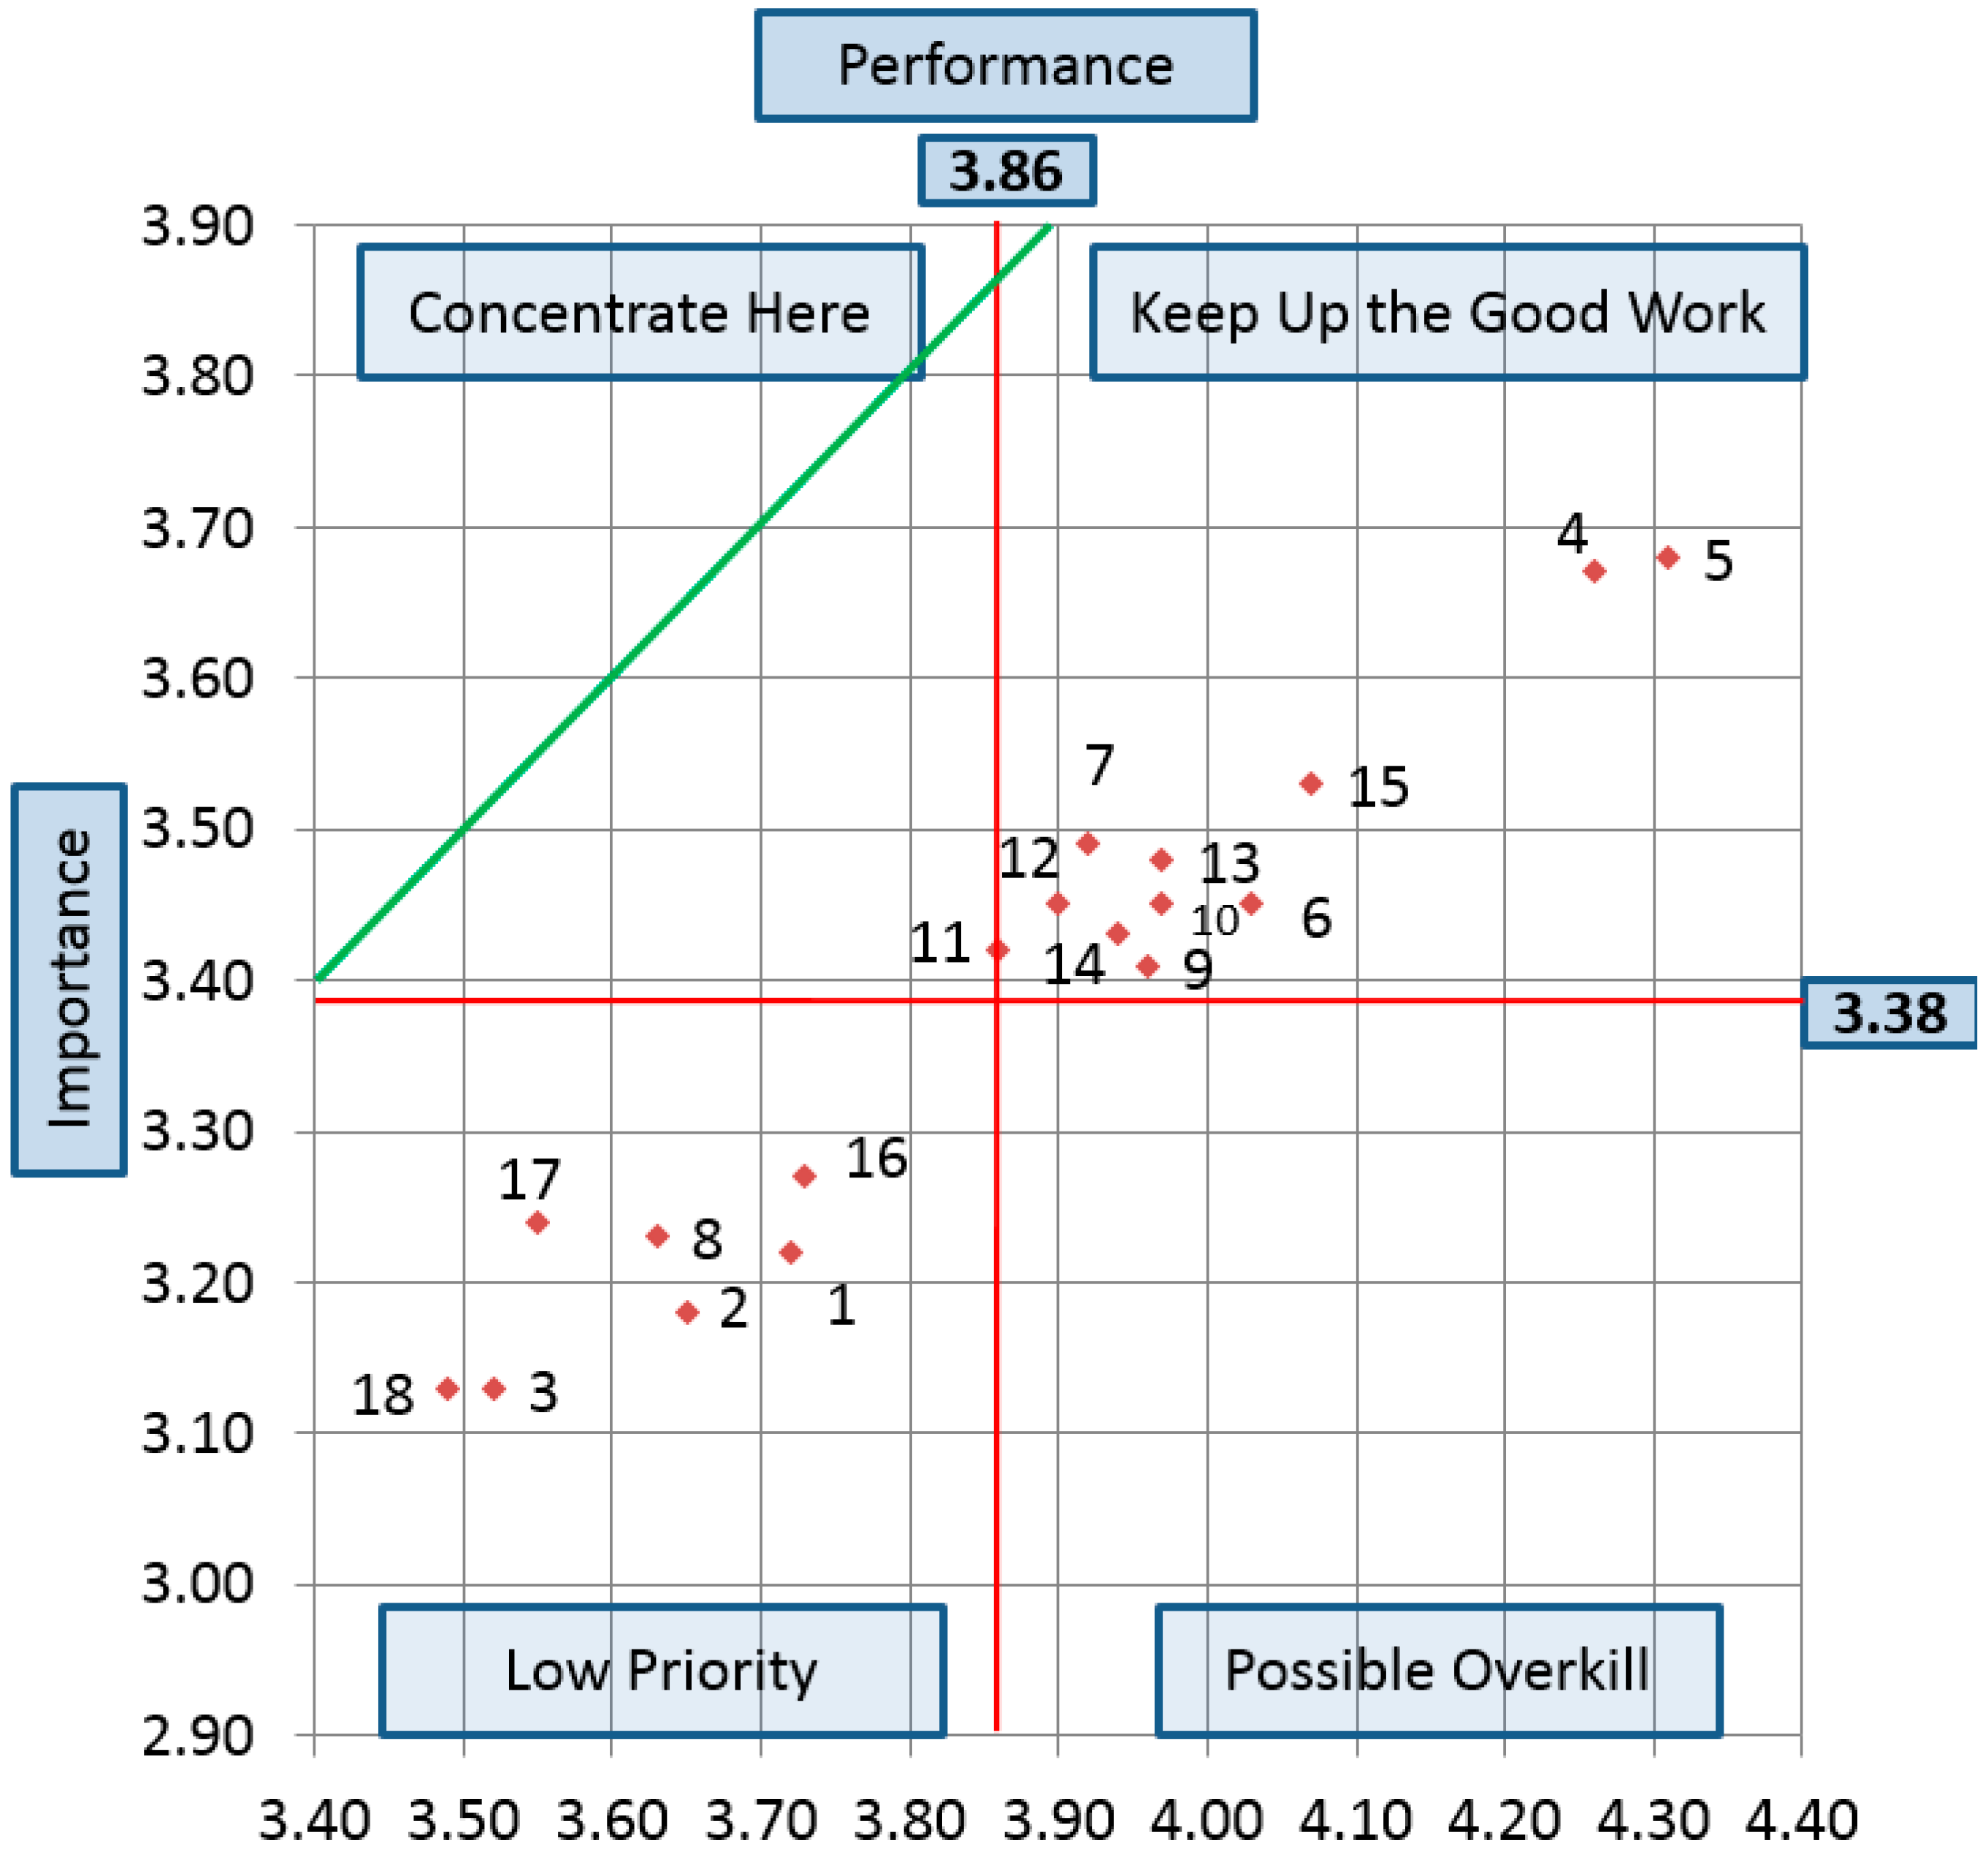
Table 1.
Demographic profile of respondents.
| Items | N | Valid % | Items | N | Valid % |
|---|---|---|---|---|---|
| Gender | 396 | Annual income | 420 | ||
| Male | 173 | 43.7 | Less than $15,000 | 58 | 13.8 |
| Female | 223 | 56.3 | $15,001–$30,000 | 119 | 28.3 |
| Age | 424 | $30,001–$45,000 | 92 | 21.9 | |
| 20 or below | 13 | 3.1 | $45,001–$60,000 | 71 | 16.9 |
| 21–29 | 84 | 19.8 | $60,001–$75,000 | 39 | 9.3 |
| 30–39 | 149 | 35.1 | More than $75,000 | 41 | 9.8 |
| 40–49 | 124 | 29.3 | Educational level | 423 | |
| 50–59 | 48 | 11.3 | Less than high school | 13 | 3.1 |
| Over 60 | 6 | 1.4 | High school | 129 | 30.5 |
| Occupation | 435 | Bachelor’s degree | 248 | 58.6 | |
| Professional work | 80 | 18.4 | Graduate degrees | 33 | 7.8 |
| Self-employed | 47 | 10.8 | Tourism companion | 441 | |
| Housewives | 79 | 18.2 | Alone | 12 | 2.7 |
| Technical post | 16 | 3.7 | Family (spouse, parents, relatives or children) | 230 | 52.2 |
| Office jobs | 112 | 25.7 | Friends | 81 | 18.4 |
| Students | 49 | 11.3 | Business colleagues | 118 | 26.7 |
| Service work | 20 | 4.6 | Children in the family | 436 | |
| Etc. | 32 | 7.4 | No child | 107 | 24.5 |
| Marital status | 429 | Children | 329 | 75.5 | |
| Single | 127 | 29.6 | |||
| Married | 294 | 68.5 | |||
| Etc. | 8 | 1.9 |
Table 2.
Importance–performance analysis (IPA) for rural tourism accommodations.
| Ranking | Importance Attributes | I (N) | Performance Attributes | P (N) |
|---|---|---|---|---|
| 1 | 5. The attitude of the accommodation’s owner | 3.68 (437) | 5. The attitude of the accommodation’s owner | 4.31 (439) |
| 2 | 4. The attitudes of local residents (Kindness, etc.) | 3.67 (433) | 4. The attitudes of local residents (Kindness, etc.) | 4.26 (434) |
| 3 | 15. The cleanliness of local food | 3.53 (423) | 15. The cleanliness of local food | 4.07 (421) |
| 4 | 7. The reservation system | 3.49 (431) | 6. The expertise of the owner | 4.03 (436) |
| 5 | 13. The room design and the surround landscape | 3.48 (437) | 10. The cleanliness of the room | 3.97 (437) |
| 6 | 12. The price level | 3.45 (429) | 13. The room design and the surround landscape | 3.97 (439) |
| 7 | 6. The expertise of the owner | 3.45 (434) | 9. The size of the room in accommodation | 3.96 (436) |
| 8 | 10. The cleanliness of the room | 3.45 (437) | 14. The restroom and bathroom condition | 3.94 (439) |
| 9 | 14. The restroom and bathroom condition | 3.43 (438) | 7. The reservation system | 3.92 (432) |
| 10 | 11. The air-condition system | 3.42 (431) | 12. The price level | 3.90 (430) |
| 11 | 9. The size of the room in accommodation | 3.41 (435) | 11. The air-condition system | 3.86 (429) |
| 12 | 16. The furniture in the room | 3.27 (437) | 16. The furniture in the room | 3.73 (439) |
| 13 | 17. The variety of excellent choices | 3.24 (427) | 1. The experiential activities for children | 3.72 (427) |
| 14 | 8. The guide book of the local area and the local attractions | 3.23 (433) | 2. The experiential activities for adults | 3.65 (431) |
| 15 | 1. The experiential activities for children | 3.22 (425) | 8. The guide book of the local area and the local attractions | 3.63 (434) |
| 16 | 2. The experiential activities for adults | 3.18 (432) | 17. The variety of excellent choices | 3.55 (424) |
| 17 | 3. The programs with experience and convenience facilities | 3.13 (430) | 3. The programs with experience and convenience facilities | 3.52 (428) |
| 18 | 18. The various offers of the rural village’s events and news | 3.13 (431) | 18. The various offers of the rural village’s events and news | 3.49 (426) |
Table 3.
Gap analysis for rural tourism accommodations.
| Rankings | Attributes | I | P | G | t-Value | Sig |
|---|---|---|---|---|---|---|
| 1 | 17. The variety of excellent choices (Q3) | 3.24 | 3.55 | 0.32 | 7.170 | 0.000 * |
| 2 | 18. The various offers of the rural village’s events and news (Q3) | 3.13 | 3.49 | 0.36 | 7.729 | 0.000 * |
| 3 | 3. The programs with experience and convenience facilities (Q3) | 3.13 | 3.52 | 0.38 | 6.963 | 0.000 * |
| 4 | 8. The guide book of the local area and the local attractions (Q3) | 3.23 | 3.63 | 0.40 | 8.037 | 0.000 * |
| 5 | 7. The reservation system (Q1) | 3.49 | 3.92 | 0.43 | 8.975 | 0.000 * |
| 6 | 11. The air-condition system (Q1) | 3.42 | 3.86 | 0.45 | 7.744 | 0.000 * |
| 7 | 12. The price level (Q1) | 3.45 | 3.90 | 0.45 | 9.092 | 0.000 * |
| 8 | 16. The furniture in the room (Q3) | 3.27 | 3.73 | 0.45 | 9.986 | 0.000 * |
| 9 | 2. The experiential activities for adults (Q3) | 3.18 | 3.65 | 0.47 | 9.542 | 0.000 * |
| 10 | 13. The room design and the surround landscape (Q1) | 3.48 | 3.97 | 0.48 | 9.150 | 0.000 * |
| 11 | 1. The experiential activities for children (Q3) | 3.22 | 3.72 | 0.49 | 9.230 | 0.000 * |
| 12 | 14. The restroom and bathroom condition (Q1) | 3.43 | 3.94 | 0.50 | 9.493 | 0.000 * |
| 13 | 15. The cleanliness of local food (Q1) | 3.53 | 4.07 | 0.52 | 11.293 | 0.000 * |
| 14 | 16. The cleanliness of the room (Q1) | 3.45 | 3.97 | 0.53 | 9.881 | 0.000 * |
| 15 | 9. The size of the room in accommodation(Q1) | 3.41 | 3.96 | 0.54 | 10.223 | 0.000 * |
| 16 | 6. The expertise of the owner (Q1) | 3.45 | 4.03 | 0.58 | 11.770 | 0.000 * |
| 17 | 4. The attitudes of local residents (Kindness, etc.) (Q1) | 3.67 | 4.26 | 0.59 | 11.394 | 0.000 * |
| 18 | 5. The attitude of the accommodation’s owner (Q1) | 3.68 | 4.31 | 0.63 | 13.162 | 0.000 * |
* Significant at p < 0.001.
© 2018 by the authors. Licensee MDPI, Basel, Switzerland. This article is an open access article distributed under the terms and conditions of the Creative Commons Attribution (CC BY) license (http://creativecommons.org/licenses/by/4.0/).
Share and Cite
MDPI and ACS Style
Choi, H.; Ann, S.; Lee, K.-W.; Park, D.-B. Measuring Service Quality of Rural Accommodations. Sustainability 2018, 10, 443. https://doi.org/10.3390/su10020443
AMA Style
Choi H, Ann S, Lee K-W, Park D-B. Measuring Service Quality of Rural Accommodations. Sustainability. 2018; 10(2):443. https://doi.org/10.3390/su10020443
Chicago/Turabian StyleChoi, Hyunsuk, Saehya Ann, Kwang-Woo Lee, and Duk-Byeong Park. 2018. "Measuring Service Quality of Rural Accommodations" Sustainability 10, no. 2: 443. https://doi.org/10.3390/su10020443
Note that from the first issue of 2016, this journal uses article numbers instead of page numbers. See further details here.