Article

Land Use Change under Biofuel Policies and a Tax on Meat and Dairy Products: Considering Complexity in Agricultural Production Chains Matters

Kiel Institute for the World Economy, Kiellinie 66, 24105 Kiel, Germany
*
Author to whom correspondence should be addressed.
Sustainability 2018, 10(2), 419; https://doi.org/10.3390/su10020419
Submission received: 22 December 2017 / Revised: 26 January 2018 / Accepted: 1 February 2018 / Published: 6 February 2018
(This article belongs to the Special Issue Land-Use Competition)

Abstract

:
Growing demand for meat and dairy products (MDP), biofuels, and scarcity of agricultural land are drivers of global land use competition. Impacts of policies targeting demand for MDP or biofuels have only been analysed separately. We use the computable general equilibrium model DART-BIO to investigate combined effects, since MDP and biofuel production are closely related via feestock use and co-production of animal feed. We implement four scenarios: (a) a baseline scenario; (b) halving MDP consumption in industrialised countries by a tax; (c) abolishing current biofuel policies; and (d) no exogenous land use change. We find that a MDP tax and exogenous land use change have larger effects on land use and food markets than biofuel policies. International trade is affected in all scenarios. With respect to combined effects of a MDP tax and biofuel policies, we find decreasing biodiesel but increasing bioethanol production. In addition, the MDP tax decreases the impact of biofuel policies on agricultural markets and land use. Our results highlight the importance of a detailed representation of different vegetable oils used in biodiesel production and related by-products. Finally, since the MDP tax increases the use of fossil fuels, the net climate mitigation potentials of such a tax should be investigated further.

1. Introduction

Under the current trends of global change, one of the key challenges is to deal with the rising competition for productive land resources [1,2]. A major driver of these trends is the combination of population growth, rising per capita incomes, and progressive urbanisation. This has triggered an unprecedented increase in demand for meat and dairy products (MDP) in developing countries, particularly in Asia [3]. This development gives rise to major opportunities and threats for mankind [3,4,5,6]. The so called ‘Livestock Revolution’ [3] is expected to continue triggering major parts of the projected increases in global demand for food by 70–110% [7,8,9]. At the same time, low emission pathways of the Intergovernmental Panel on Climate Change (IPCC) rely on exploiting the mitigation potential of the agriculture, forestry and other land use (AFOLU) sectors by (1) decreasing the emissions of the sectors itself (e.g., limiting land use expansion) and (2) by using biomass to substitute fossil fuels (e.g., by producing biofuels) [10,11]. For an evaluation of related policy measures such as biofuel quotas, instruments to decrease MDP consumption or avoiding cropland expansion it is key to understand the interconnected processes of these instruments, their impact on the scarce land resources as well as their impact on agricultural markets.
In the literature, these policy measures are analysed separately. The effects of global biofuel policies on agricultural markets and global land use have been widely studied by using general and partial equilibrium models (e.g., [12,13,14,15]). However, model results on the price changes caused by biofuel polices vary substantially due to the different contexts, scopes and methodologies of models [16]. Among others, the amount of other crops saved by the substitution with by-products as well as the relationship between land use intensification and land use expansion are identified as key model parameters influencing land use change caused by biofuel policies [17]. In a similar analysis, the authors highlight the role of restrictions in land supply and the treatment of by-products for results of forward looking models [18]. In particular, the authors of [15], by using the computable general equilibrium (CGE) model of the Global Trade Analysis Project (GTAP), and the authors of [12], by using a version of the Dynamic Applied Regional Trade CGE model (DART-BIO), show that incorporating by-products into the model specification of biofuel production sectors considerably dampens changes in land use and crop prices of biofuel policies compared to models without these specifications. In [19] the authors use the CGE model GTAP to explicitly analyse the impact of biofuel policies on the mix and location of global livestock production. They find larger absolute reductions in livestock production overseas than in the biofuel producing regions, following an international transmission of grains prices which is offset locally by the lower cost of by-products. They also show that most of the increases in crop areas following biofuel policies result from decreases in grazing areas. In terms of trade portfolios, results of [19] indicate increasing exports of processed feed materials and imports of oilseeds and vegetable oils and decreasing exports of coarse grains in biofuel-producing regions.
The effect of changes in the demand for MDPs on agricultural markets and global land use are not as well studied as for biofuel policies. There are different policy options to reach a reduction in demand. So far, changing preferences towards a less protein-based diet are found to be challenging without additional incentives [20]. This is supported by studies with CGE models by [21,22] who find only small effects on land use and agricultural markets following changes in dietary preferences. In addition, in [21] the authors analyse the impact of changes in MDP demand on the biofuel sector. They find an increase in the production of vegetable oils following a decrease in livestock demand and subsequently oilseed meals.
Implementing a pegouvian tax which internalises the environmental cost of meat consumption into consumers’ decisions has been found to be effective to reduce meat consumption [23,24]. For example, in [23] the authors show a substantial emission mitigation potential by a greenhouse gas (GHG) weighted consumption taxes on animal food products in the European Union (EU) based on a model of food consumption and the related land use and GHG emissions in the EU. In [24] the authors evaluate the environmental impacts of introducing an environmental tax on meat and dairy consumption in Sweden by using econometric estimates of the almost ideal demand system (AIDS) for meat and dairy products. Their results indicated relatively inelastic own price elasticities and high income elasticities for all meat products and slightly lower for dairy. However, neither [23] nor [24] include feedback effects through agricultural markets.
Such market feedbacks are considered in [25], where the CGE model LEITAP (Landbouw Economisch Institut Trade Analysis is used to analyse the effect of decreasing consumption of cattle, milk and other animal productsin different scenarios. In one set of scenarios, the author introduces a tariff rate in order to swap consumption in 2020 compared to 2010 by 10, 20 and 50% in the EU27. He finds that the resulting reduction of animal production in the EU27 has relatively large impacts on the global demand for crops, since production in the EU27 is relatively crop-intensive compared with the world average. In addition, the price of agricultural products and pressure on land decrease in the EU27. The reduction in prices leads to an increase in consumption of arable crop products, which decreases the overall reduction in arable crop production by the tariff. As a consequence, the land use effect is lower compared to the reduction in the consumption of livestock products. Also an increase in the demand for crops from the biofuel sector is highlighted as a result of decreasing prices of crop production. In addition, the author shows that if primary crop produced for animal feed is substituted with by-products, the reduction in crop demand following the tariff on consumption is lower. This is because by-production is not as easily reduced as crop production specifically grown for animal feeding [25].
In summary, this study shows the linkages between livestock and biofuel markets via the respective feedstuff. Policy measures implemented to substitute fossil fuels by biofuels, to reduce consumption of MDPs and to limit cropland expansion have not been studied simultaneously. Thus, there is a lack of knowledge with respect to the interlinkages between different policy measures. Our study therefore combines the analysis of three potential instruments by using the global CGE model DART-BIO. In particular, we analyse in subsequent scenarios the effects of: (1) an exogenous tax on private MDP consumption in industrialised countries; (2) of global biofuel policies; and (3) of restricting global land use to the currently managed areas. We focus our analysis on the changes of crop prices, amount of production, production area and consumption of different primary agricultural products and processed food products. The rest of the study is structured as follows: Section 2 introduces the DART-BIO model and the definition and implementation of scenarios; Section 3 presents the results of the scenarios and discusses their implications and relation to other studies; Section 4 concludes.

2. Materials and Methods

2.1. DART-BIO

DART-BIO is a version of the DART model with a detailed representation of the agricultural sector, land use and conventional biofuels. The DART model is a global multi-sectoral, multi-regional recursive-dynamic CGE model. It was developed at the Kiel Institute for the World Economy and has been widely applied to analyse international climate policies, (e.g., [26,27,28]), environmental policies [29], energy policies, (e.g., [30]), and biofuel policies, (e.g., [12]).

2.1.1. Model Structure and Theory

The economy in each region is modelled as a competitive economy. Flexible prices and market clearing are assumed. DART is a recursive-dynamic model, meaning that the evolution of the economies over time is described by a sequence of single-period static equilibria. These equilibria are connected through capital accumulation and changes in labour supply. Three factors determine the changes in labour supply and productivity: (1) changes in labour force; (2) the rate of labour productivity growth; and (3) the change in human capital accumulation. Effective labour can increase due to either growth of the human capital accumulated per physical unit of labour, total factor productivity, growth of the labour force or the sum of all. The growth rates of the labour force are taken from projections of participation rates taken from the PHOENIX model [31]. Both, the rate of labour productivity improvement and growth rates of human capital are assumed to be constant, but regionally different. The total factor productivity and characteristics of agricultural production functions determine the growth in agricultural productivity. More details on the model structure are available in [27].
The economic structure of DART is fully specified for each region and covers production, investment and final consumption by consumers and the government [12]. Consumer demand is modelled with non-unitary income elasticities by using the linear expenditure system (LES) approach [32], where a representative consumer is divided into two categories: a ‘subsistence consumer’ who spends fixed parts of thier income on a subsistence quantity for each commodity and a ‘surplus consumer’ who allocate their supernumerary income according to income elasticities of demand and relative price changes of consumption goods. The higher income elasticities of demand for a certain good are, the stronger is the demand for that good with rising incomes relative to demand for other goods. The income elasticities are taken from the GTAP database [33].

2.1.2. Sectors and Regions in DART-BIO

The version DART-BIO is calibrated based on the GTAP8.1 database [33] which represents the global economy in 2007. Data on agro-ecological zones (AEZs) were not yet available for the new GTAP9 database when we did the analysis. DART-BIO has 23 regions (see Table 1) subdivided into 18 AEZs.
To incorporate biofuels and their by-products in the DART model several sectors are split and added to the standard GTAP database, as explained in detail in [12]. As a result, DART-BIO contains 38 sectors, 45 products (see Table 2). Note that DART-BIO explicitly accounts for the by-products generated during the production process of biofuels. These by-products are used as feed stuff in livestock production. As illustrated in Table 2, the database includes four different types of bioethanol and four vegetable oil sectors including respective by-products that are used for biodiesel production. Since members of the European Union state explicit biofuel targets to substitute gasoline and diesel, DART-BIO includes separate sectors for motor gasoline and motor diesel.

2.1.3. Modelling Land Use Change

Land is one of the production factors for crops, livestock, and managed forest. The DART-BIO model incorporates the GTAP8.1 land use and land cover database that includes 18 GTAP-AEZs [34]. Note that the spatial shapes of AEZs do not change during the simulations: DART-BIO is an economic model and does not include, for example, climatic changes, which could lead to alterered AEZs. Within each AEZ and region, land is allocated to different uses (i.e., cropland, pasture and forest) via a constant elasticity of transformation (CET) structure. We apply a CET function that restricts the mobility of land from one of these land types to another economic use (see e.g., [13,35,36]). DART-BIO includes a three-level nesting where land is first allocated between land for agriculture and managed forest. Then, agricultural land is allocated between pasture and crops. In the next level, crop land is allocated between rice, palm, sugar cane/beet and annual crops (wheat, maize, rapeseed, soy beans, other grains, other oilseeds and other crops). At each level, the elasticity of transformation increases, reflecting that land is more mobile between crops than between forestry and agriculture. In addition, the total land endowment might be extended by converting unmanaged land into production land.

2.2. Implementation and Definition of Scenarios

We implement four scenarios into DART-BIO, a Baseline scenario (BL) and three other scenarios, in which assumptions are altered in terms of three factors: (1) a tax on MDP consumption in industrialised countries; (2) policies controlling biofuel demand; and (3) cropland expansion and/or contraction. Table 3 displays how scenarios are defined regarding whether or not a factor is altered in each scenario. The implementation of the factors into DART-BIO is summarised in Table 4.
The Baseline scenario (BL) continues current developments until 2030: Cropland area changes according to [39] by expanding into formerly unused areas in some regions and contracting in other regions (Figure 1); in the global mean cropland growth over time. Consumption of MDP is growing based on the data from GTAP8 (income elasticities) and DART-BIO´s exogenous drivers: population growth is taken from [40], growth rates in gross domestic product are calibrated to match [41]. The elasticities of substitution for the energy goods coal, gas, and crude oil are calibrated in such a way as to reproduce the emission projections of the RCP 8.5 scenario of IPCC [42]. Biofuel policies are implemented using the shares outlined in [37] and the national action plans of EU member states [38] (for details see Table 4). The resulting shares of biofuels on transport fuels are illustrated in Figure 2.
In the second scenario (MDP tax scenario) we implement an exogenous tax on MDP, which from 2018 on lowers private consumption of MDP in the industrialised countries. The starting and end values of this tax are displayed in Table A1. It follows a linear trend between 2018 and 2030. When compared to the Baseline scenario, the MDP tax scenario allows us to analyse the effects of such a tax.
In the third scenario (NoBFP scenario) we assume that no biofuel policies are pursued. With this scenario we aim to analyse the interplay of biofuels and livestock production, since by-products of biofuel production are used as fodder in livestock production. Note that we compare this scenario to the MDP tax scenario, not to the Baseline scenario, in order to analyse the additional effect of no biofuel policies with the MDP tax in place.
In the fourth scenario (NoLandExpCon scenario) we analyse the effect of not applying annual growth rates of land expansion/contraction as in the Baseline scenario. In this scenario, neither expansion into uncultivated areas nor reduction of cropland are assumed. Again, we compare this scenario to the NoBFP scenario rather than to the Baseline scenario.

3. Results and Discussion

In the following sections, results from the model simulations are described and discussed. First, trends in production, consumption, prices and land use under the Baseline scenario are presented. Second, we compare global and regional changes in consumption, prices, production and land use for each of the three scenarios in 2030 and discuss our finding against the background of the literature. Finally, we compare the impacts of the three policy scenarios in an aggregated manner. A brief overview on the main findings from each scenario is displayed in Table 5.

3.1. The Baseline Scenario: Temporal Development and Changes from 2007 to 2030

In the Baseline scenario, current trends and policies are carried forward (see Section 2.1.1 and Section 2.2 for details). 
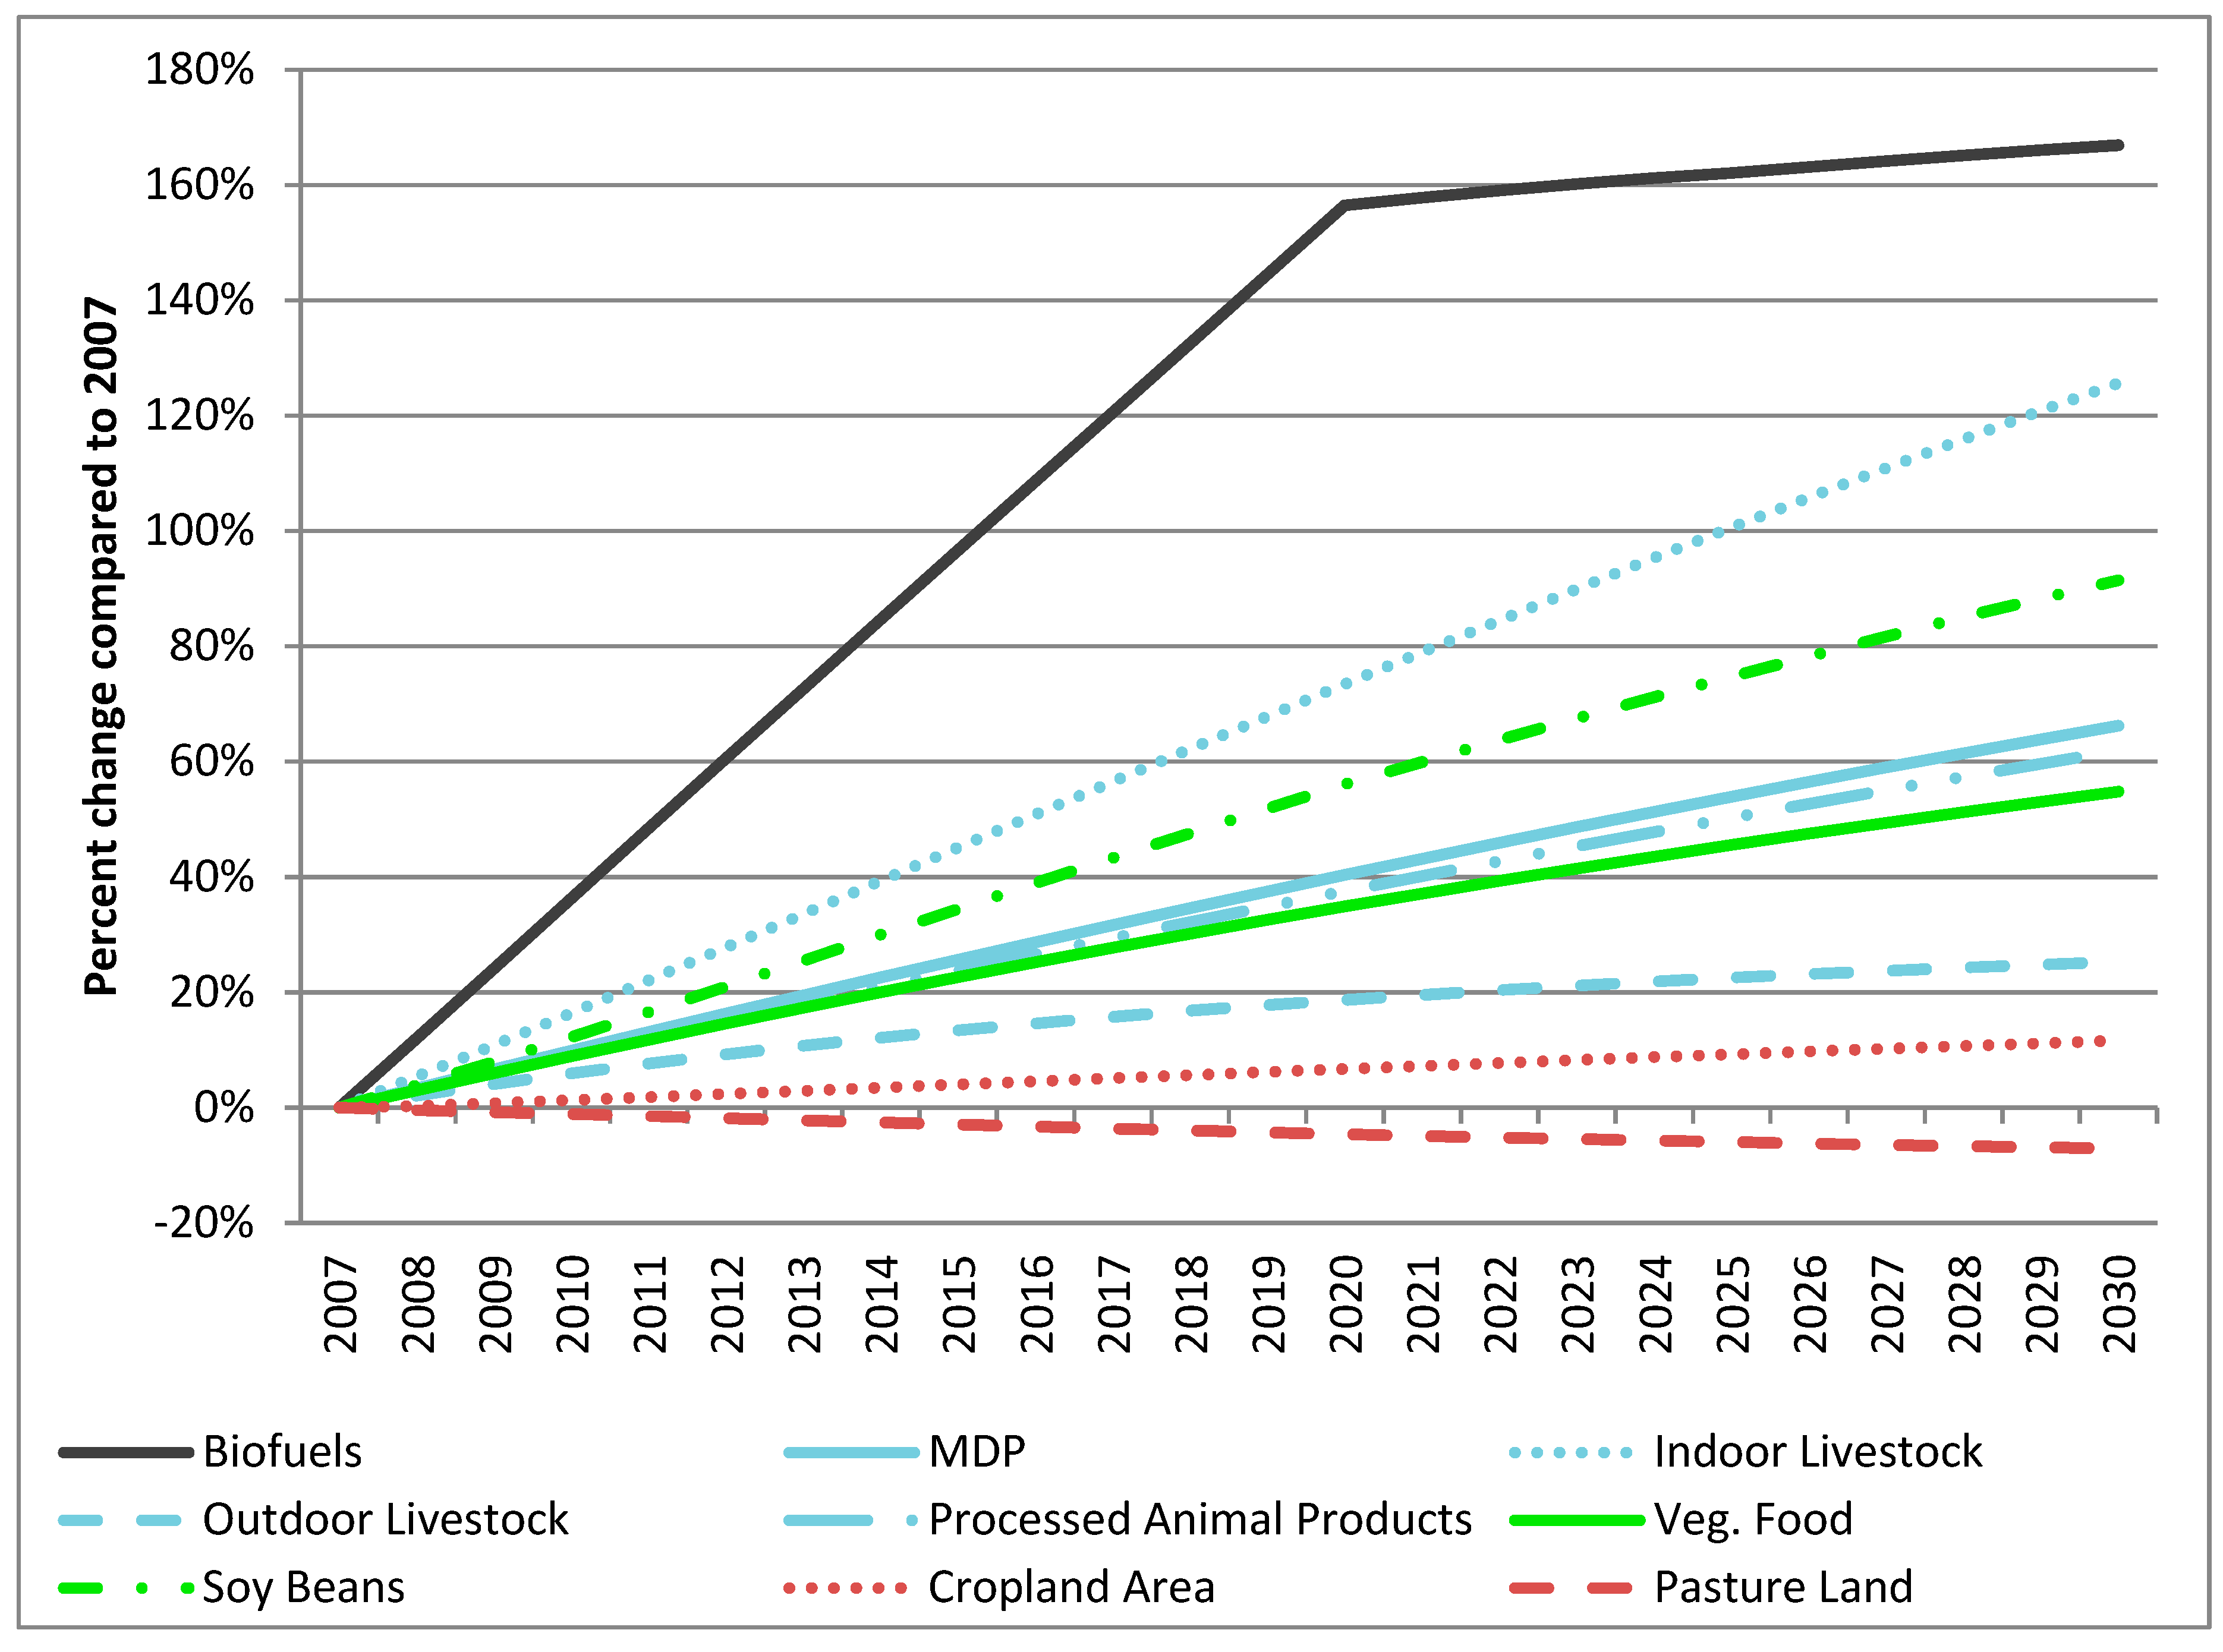
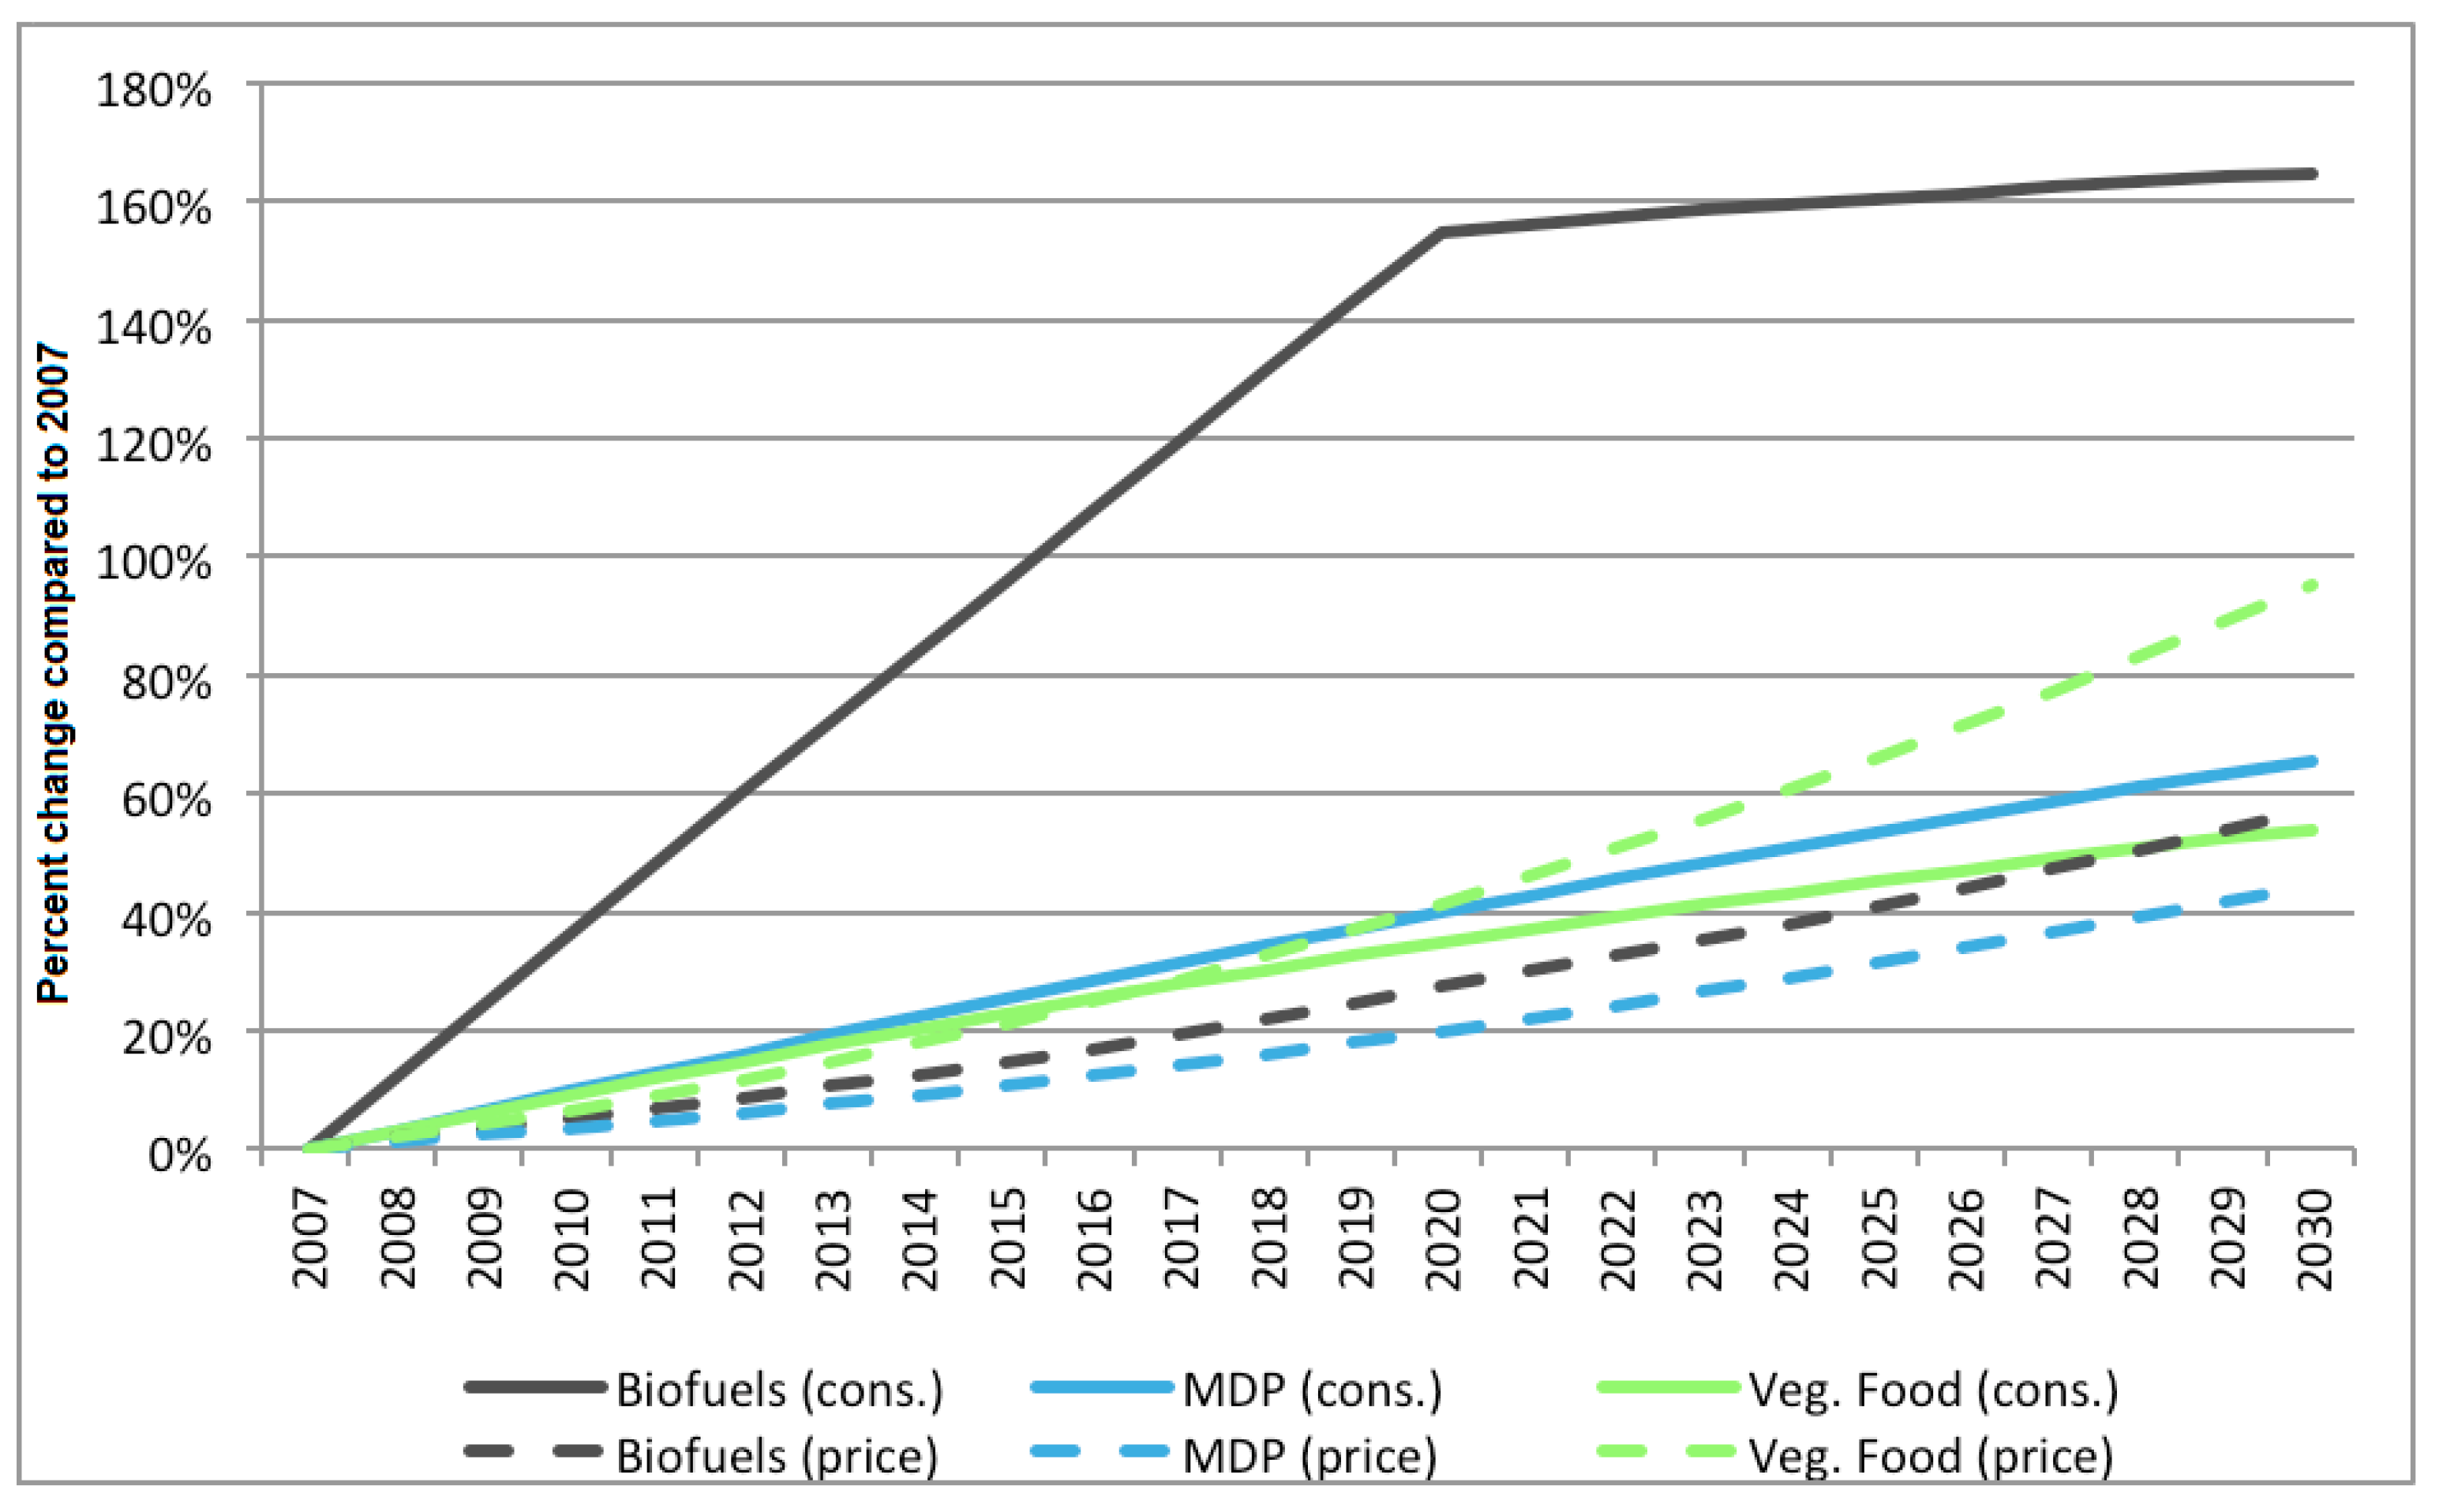
Figure 3 shows global trends in production of selected sectors from base year (2007) until the end of the modelled time period (2030) for the Baseline scenario. The temporal development is displayed as percentual change (compared to base year) of output. All sectors show a positive trend in production for the considered time, although to varying degrees.
The increase in production is strongest (+167%) for biofuels (see Table 2 for aggregations used in this section), which is driven by the implemented biofuel policies. Also after 2020, when the enforced share of biofuels remains unchanged, there is an increase in production. This is mainly due to the growing consumption of fossile fuels induced by economic growth: to keep the share of biofuels constant, the output needs to be increased. It is worth mentioning that the increase in biodiesel production is stronger (+368%) than in bioethanol production (+118%), mainly caused by high shares of biodiesel in the European Union as indicated in the national action plans.
Global food production also increases between 2007 and 2030, although not as strong as for biofuels. The increase is stronger in the aggregated MDP sector (+66%) than in the aggregated sector for vegetarian food (+51%). When disaggregating MDP, indoor livestock has the strongest increase (+126%), followed by processed animal products (+62%) and outdoor livestock (+25%). The pattern is similar for per-capita consumption: Here, the aggregated MDP sector increases by 30% (indoor livestock: 61%; processed animal products: 29%; outdoor livestock: −1%, vegetarian food by 18%). Trends of other studies are not fully comparable, since the time horizon, exogenous drivers and aggregation of products differ. The baseline of the LEITAP model in [25] for instance, includes an increase in the production volume of livestock of 55% between 2001 and 2030.
In Figure 3 also production of soy beans is displayed. It increases stronger (+91%) than total MDP production, but less than indoor livestock, for which it is a major fodder input. We explain this by the increase of Dried Distillers Grains with Solubles (DDGS) and oilseed meal, which are by-products in the production of bioethanol and biodiesel, respectively. As these by-products are increasingly produced as a result of the increasing amount of produced biofuels, they can be used ever more to replace crops such as soy beans as fodder in the production of indoor livestock.
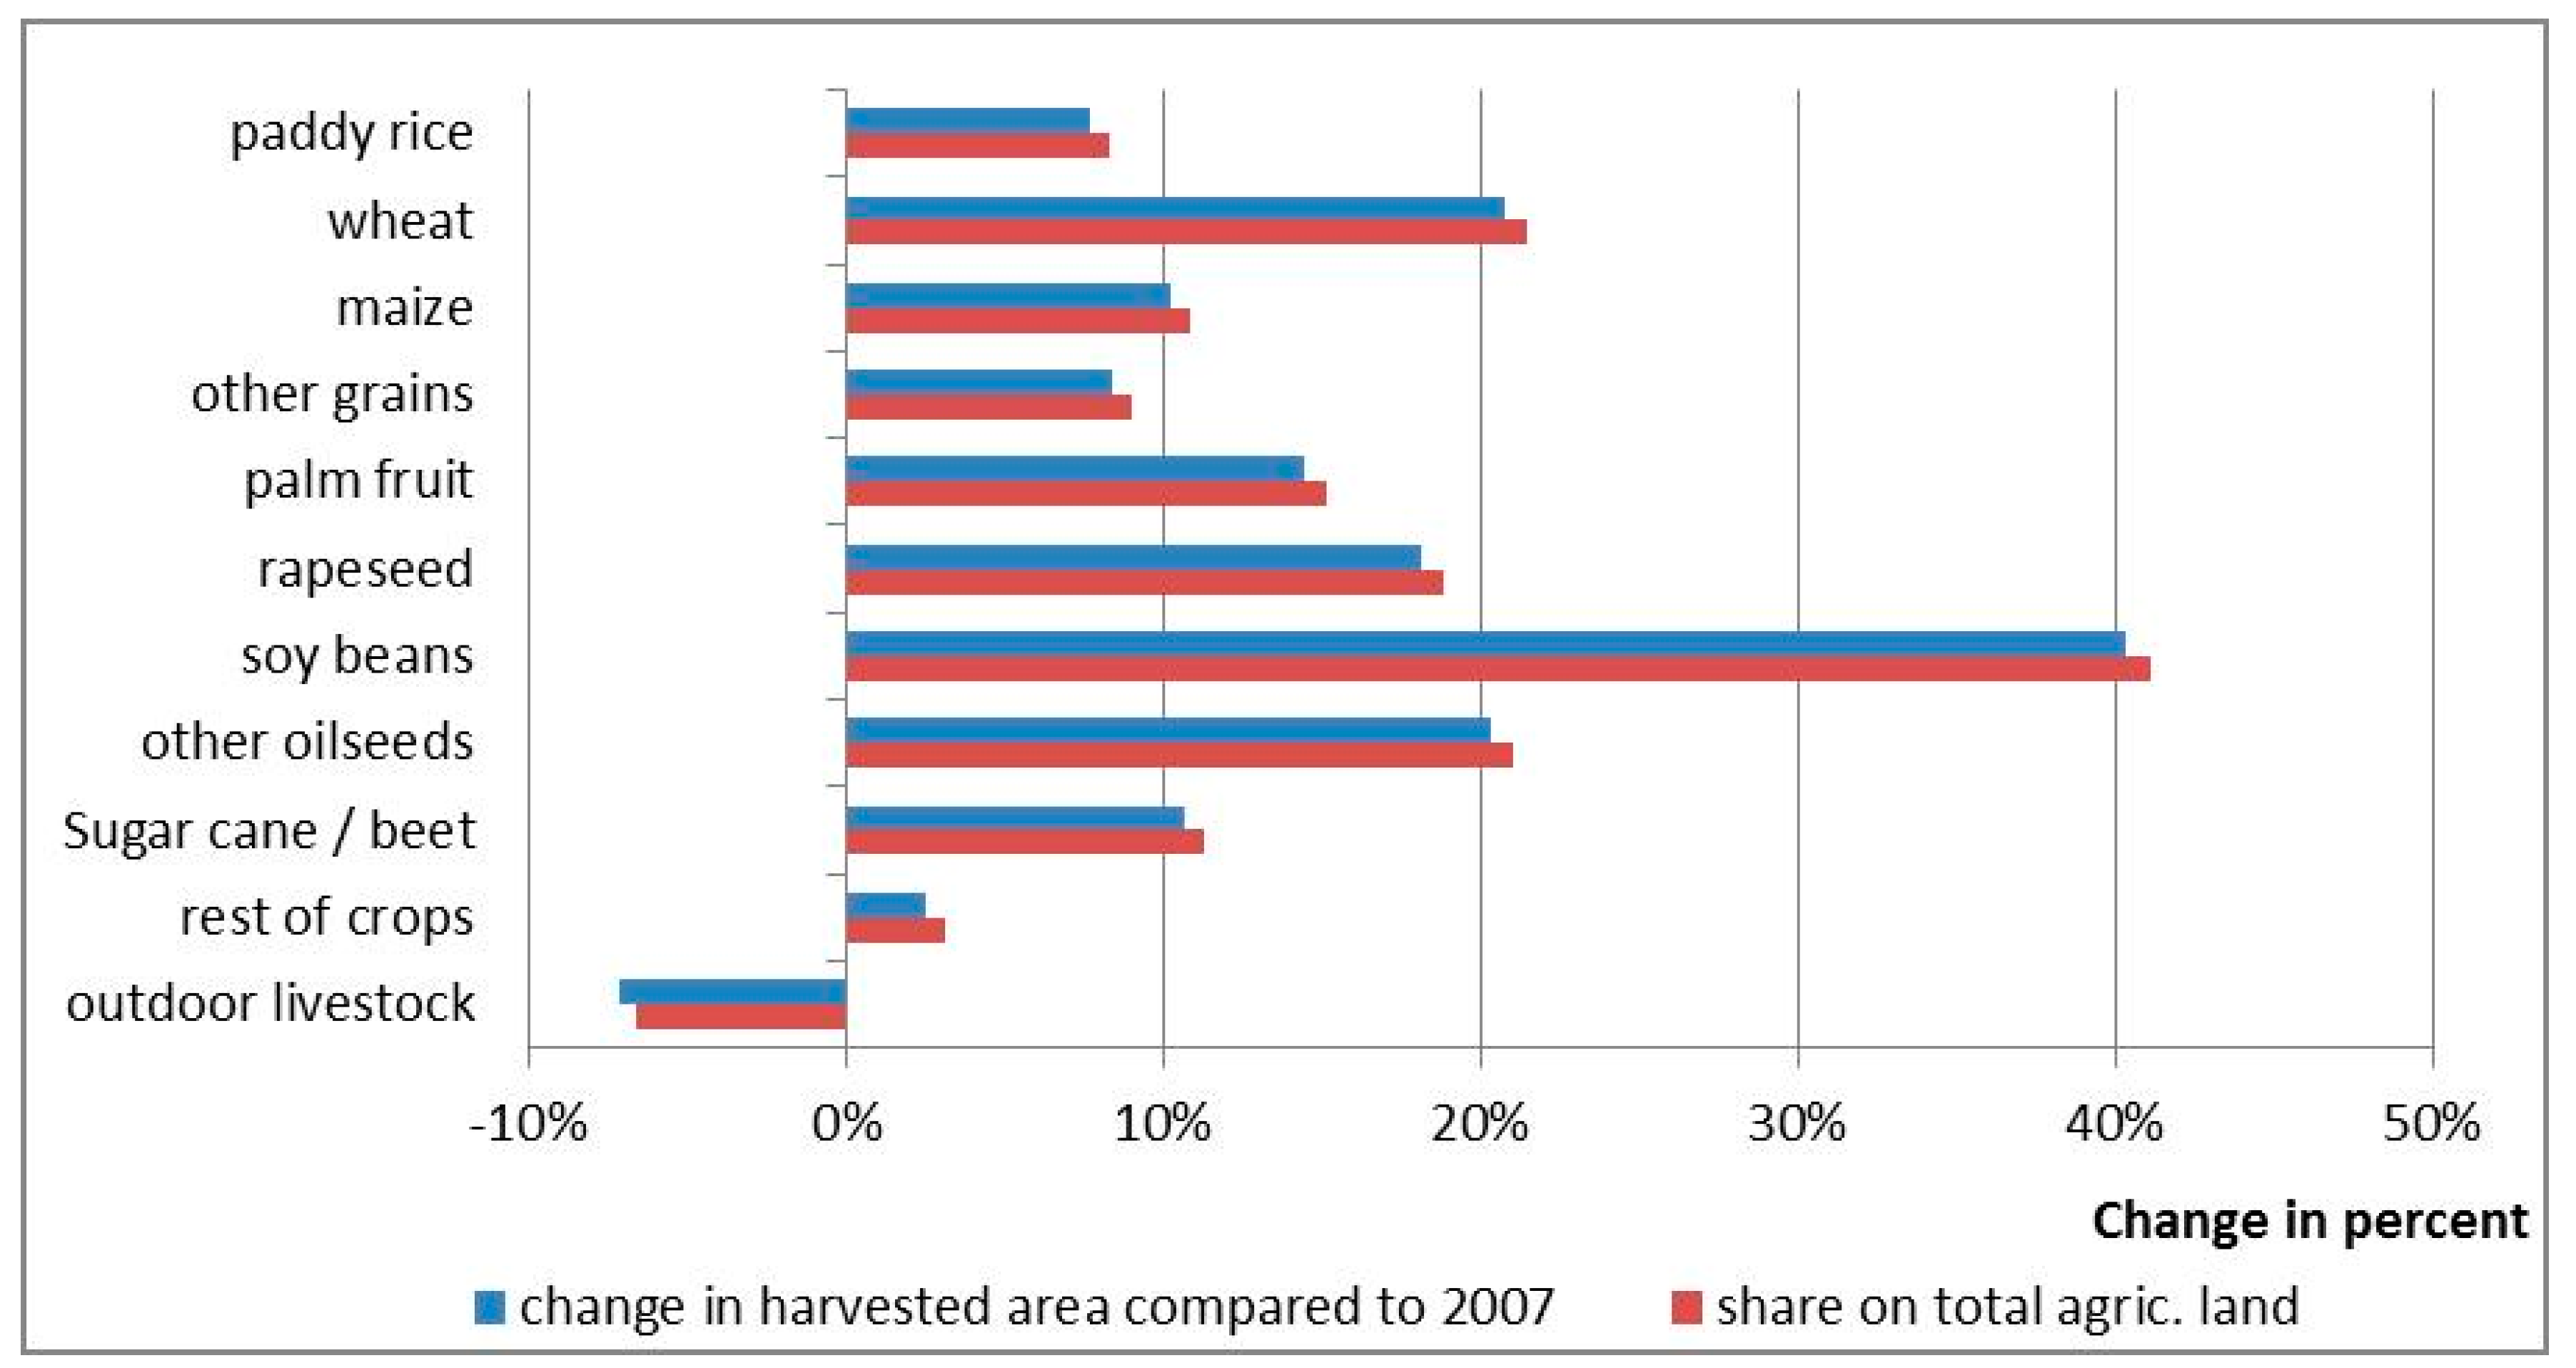
The trend between 2007 and 2030 shows an increase in cropland area by 12% which represents 152 mio. ha. This is due to the exogenous cropland expansion (see Figure 1) and because of conversion of pasture land. Compared to other studies that simulate an increase of 10–25% in cropland [43] our results are at the lower bound of this range. The additioal area is mainly used for soy beans and wheat production. They are important inputs for MDP and biofuel production. Interestingly, the global cropland area (input in production) increases to a much smaller degree than the outputs (crops and processed products) considered. This can be interpreted as an increasing efficiency in agricultural production, which is determined by the changes in total factor productivity over time and characteristics of agricultural production functions (Section 2.1.1). Pasture land is reduced in 2030 compared to 2007 (−7%); it is the only form of land use which decreases, even without a tax on MDP. Its share in total agricultural land area decreases from 65% in 2007 to 60% in 2030. Amongst crops, soy beans show the strongest increase, both in terms of expansion of harvested area and in terms of its share in total harvested area (Figure 4).
The temporal development of global private consumption nearly resembles that of production (see Figure 5). The latest projections of demand for agricultural products of the IMPACT (International Model for Policy Analysis of Agricultural Commodities and Trade) model of the International Food Policy Research Institute IFPRI show an increase in demand for meat, including beef, pork, poultry, sheep and goats, of 39% between 2010 and 2030 [44]. A comparison between our results and results generated by the IMPACT model is difficult, since the model structures differ (IMPACT as a partial equilibrium model is more detailed with respect to agricultural products, but does not take feedback effects with other sectors e.g., the energy sector into account). In addition, IMPACT takes different assumptions about the development of gross domestic product and population growth. If we now take a look at per capita consumption of MDP, it increases by 30% between 2007 and 2030 in our model, a number comparable to the 24.3% in per capita meat consumption calculated in [45] for the period 1990–2009 on the basis of [46].
Prices for biofuels, MDP and vegetarian food develop differently: They increase strongest for vegetarian food (+96% between 2007 and 2030), followed by biofuels (57%) and MDP (44%). This is due to increasing prices of cropland, which is required to produce vegetarian food. Since the preference of households for MDP is higher with rising incomes compared to vegetarian food, the scarcity of land causes prices for vegetarian food to increase stronger than for MDP and biofuels, which are fostered by the implemented policies. As production and consumption increase stronger in MDP and biofuels, so does the discrepancy between the respective prices.
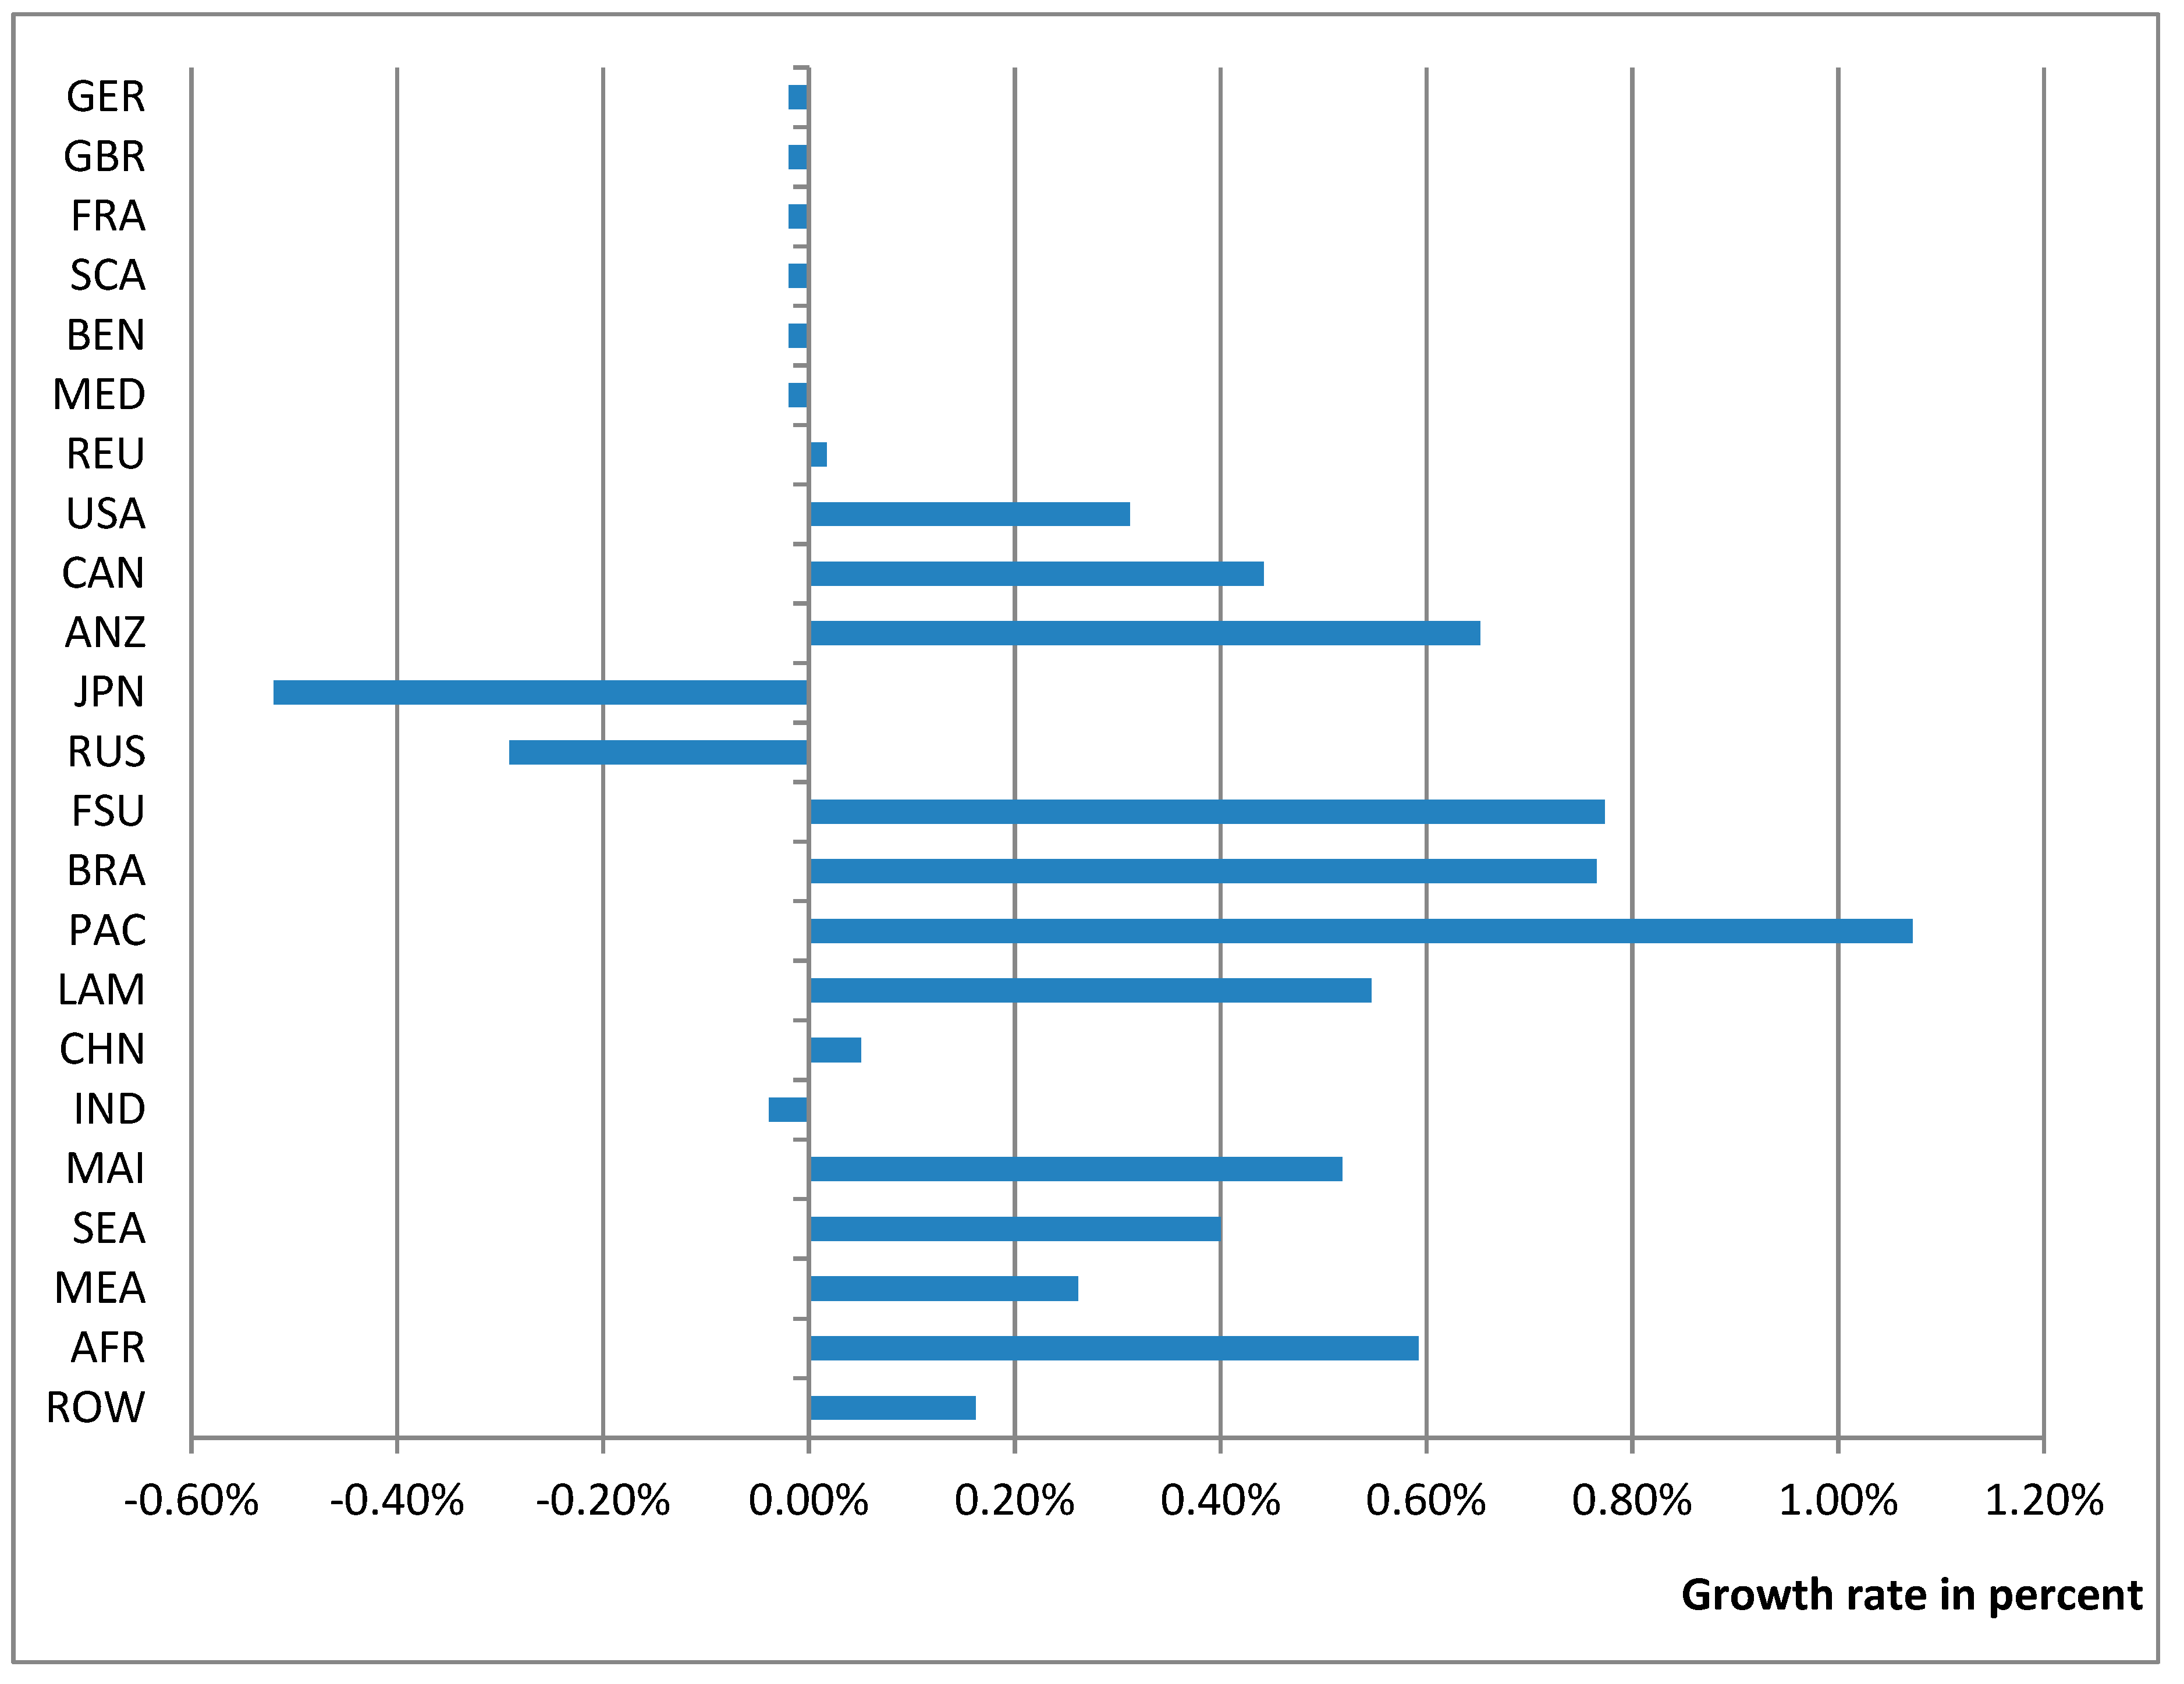
In USA, Australia/New Zealand, and the Middle- and South American regions, the consumption of biodiesel is higher than the implemented quota. In case of bioethanol, France, Australia/New Zealand, Malaysia/Indonesia and Middle-East and Northern Africa exceed their quota. In these regions, the price of fossil transport fuels increases stronger over time than prices for biofuels.

3.2. The MDP Tax Scenario: Changes in Global Average Prices, Production, Consumption And Harvested Area Compared to Baseline Scenario

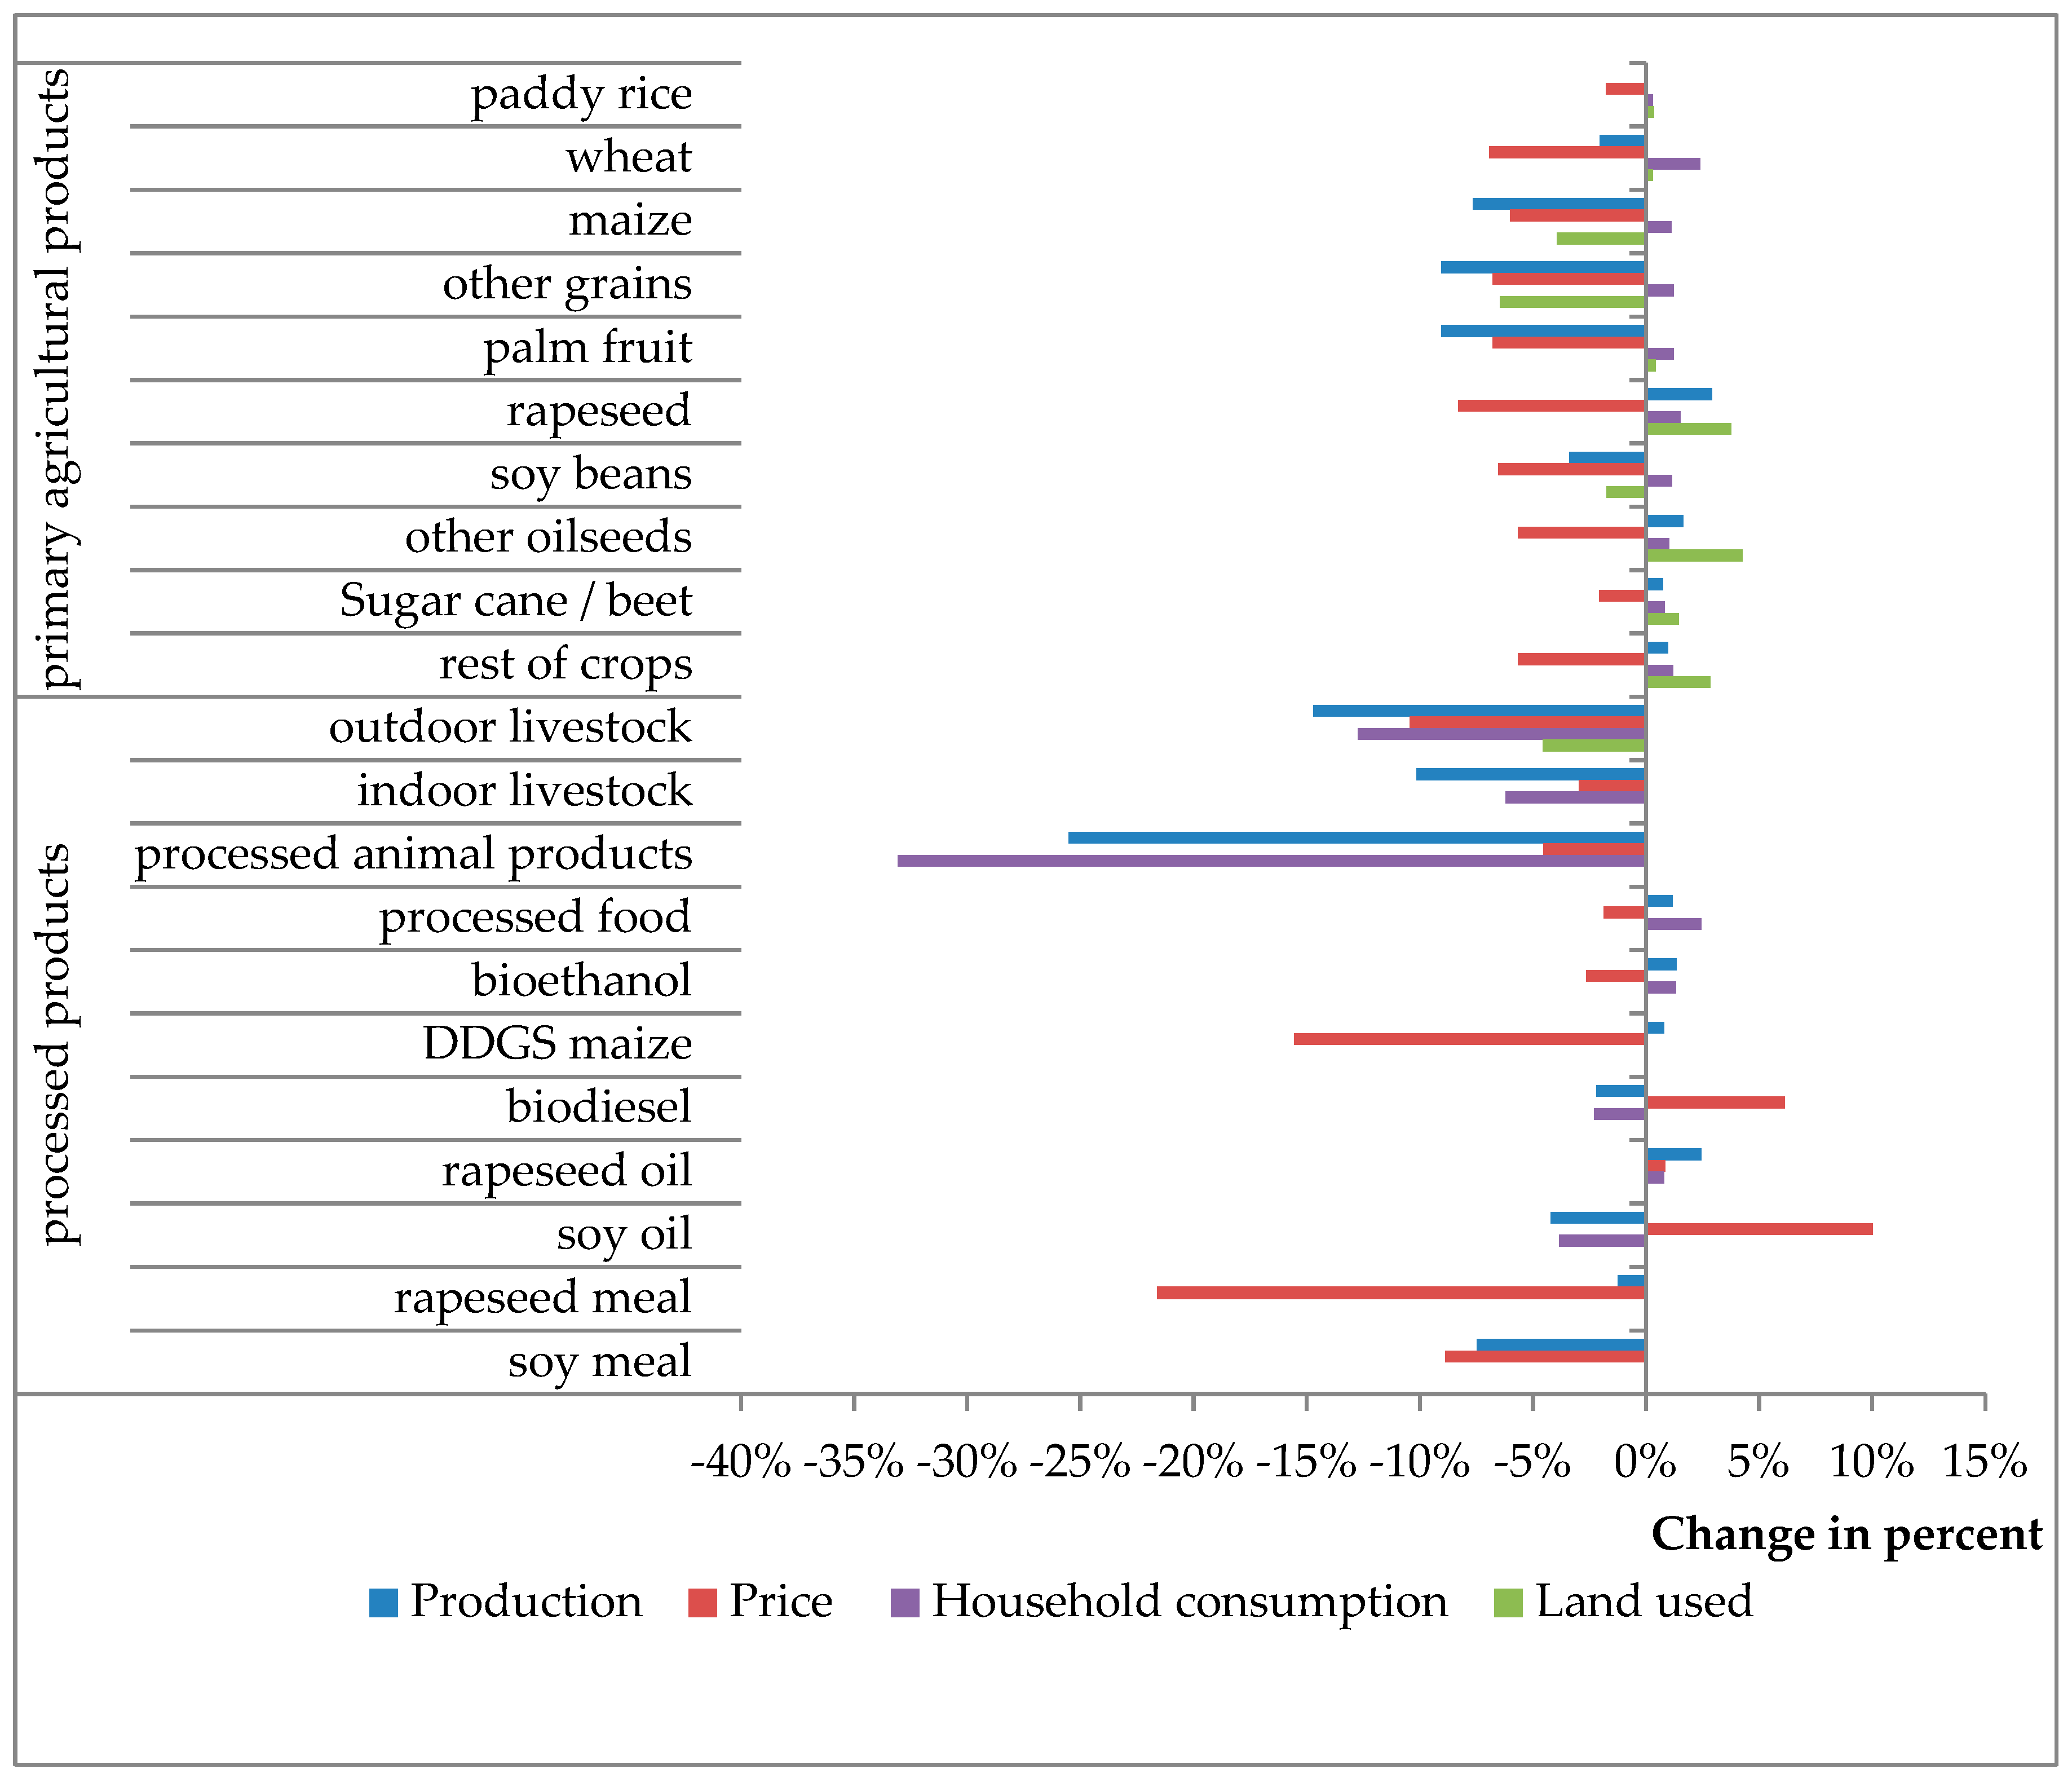
A tax on MDP consumption in industrialised countries causes global consumption of animal products to decline by 6–33% (see Figure 6). These effects are different for the three animal products sectors: Since in industrialised countries the highest share of consumed animal products is processed, we see the highest reduction in consumption in the sector “Processed animal products (PCM)”. As a consequence of the MDP tax, global production and prices of processed animal products decrease. The price change for processed animal products is five times (5% vs. 26%) smaller than that of production, indicating that the supply side is less elastic than demand. This also holds true for indoor livestock but to a limited degree.
In case of outdoor livestock, production only decreases by 15%, while the price decreases by 10%. We explain this by a strong decline in prices for the production factor land. Land prices decline for two reasons: first, compared to the Baseline scenario, less pasture land is used for production of MDP; second, less cropland is needed to produce animal fodder. While the total agricultural area remains at Baseline scenario levels, the MDP tax causes shifts in land use. The share of land allocated to fodder production in industrialised countries (mainly maize, other grains and soy beans) and pasture land (−5%) declines (see Figure 6), while managed forest areas increases. On global averages, the production of animals that are produced on pasture land (OLVS) uses less land per unit of output compared to the Baseline scenario implying that OLVS production is less land-intensive under a MDP tax.
Less demand for feedstuff for livestock production also has an impact on the vegetable oils and biofuel sectors. With less demand for vegetable meals (mainly rapeseed meal and soy meal), prices and production decline. Taking the soy industry as an example, production of meal drops by 7% and the price by 9%. Since meal and oils are produced jointly, the production of soy oils also decreases (−4%). With no exogenous decrease in demand for oil compared to the meal, the soy oil price increases (10%). This impacts on biodiesel production and prices: higher inputs costs (vegetable oils) cause biodiesel prices to rise and production to drop. The decrease in production and consumption is possible because in several regions the biofuel policy implemented is overachieved in the Baseline scenario. Technically speaking, the quota on biodiesel demand is not binding in some regions.
In case of bioethanol, the impact of the MDP tax is different. Again, the quota for bioethanol is not binding in the Baseline scenario in some regions (see Section 3.1), but these countries are only minor producers. In the major production/consumption regions USA and Brazil, the MDP tax causes the consumption of bioethanol to increase (USA: 1%; Brazil: 3%). In the USA, DDGS, the by-product from bioethanol production, has an input share of only 2% in livestock production. In comparison, soy meals, the by-product from biodiesel production, have a share of 18% in livestock production. Consequently, the feedback effect between a tax on MDP and bioethanol is less pronounced than between a MDP tax and biodiesel. In addition, the increase in global bioethanol production is influenced by the second biggest producer, Brazil. The main feedstock to produce bioethanol in Brazil is sugar cane. Since the by-product of bioethanol production from sugar cane is not used for livestock production, there is no feedback from a tax on MDP via by-products. However, with prices of crops decreasing under lower demand for feedstuff, the Brazilian production of bioethanol increases by 2% compared to the Baseline scenario.
In the industrialised countries, we observe an increase in per capita consumption of fossil fuels in transportation in the MDP tax scenario compared to the Baseline scenario. This is caused by relatively high income elasticities of demand for fossil fuel products compared to other goods, while the fixed budget share (subsistence consumers, see Section 2.1.1) is small. This implies that consumers in industrialised countries react strongly to changes on prices, and reallocate the budget they spent accordingly. Overall, prices, production and consumption of fossil energy products increase globally (Figure 7). The MDP tax leaves private consumers, which now consume less of costly processed animal products, with more money to spend on other products, for example, fuels or fuel intensive products from other sectors. Also in [25] the author finds an increase in fossil energy consumption following a reduction in MDP consumption in the EU27 for the same reasons.
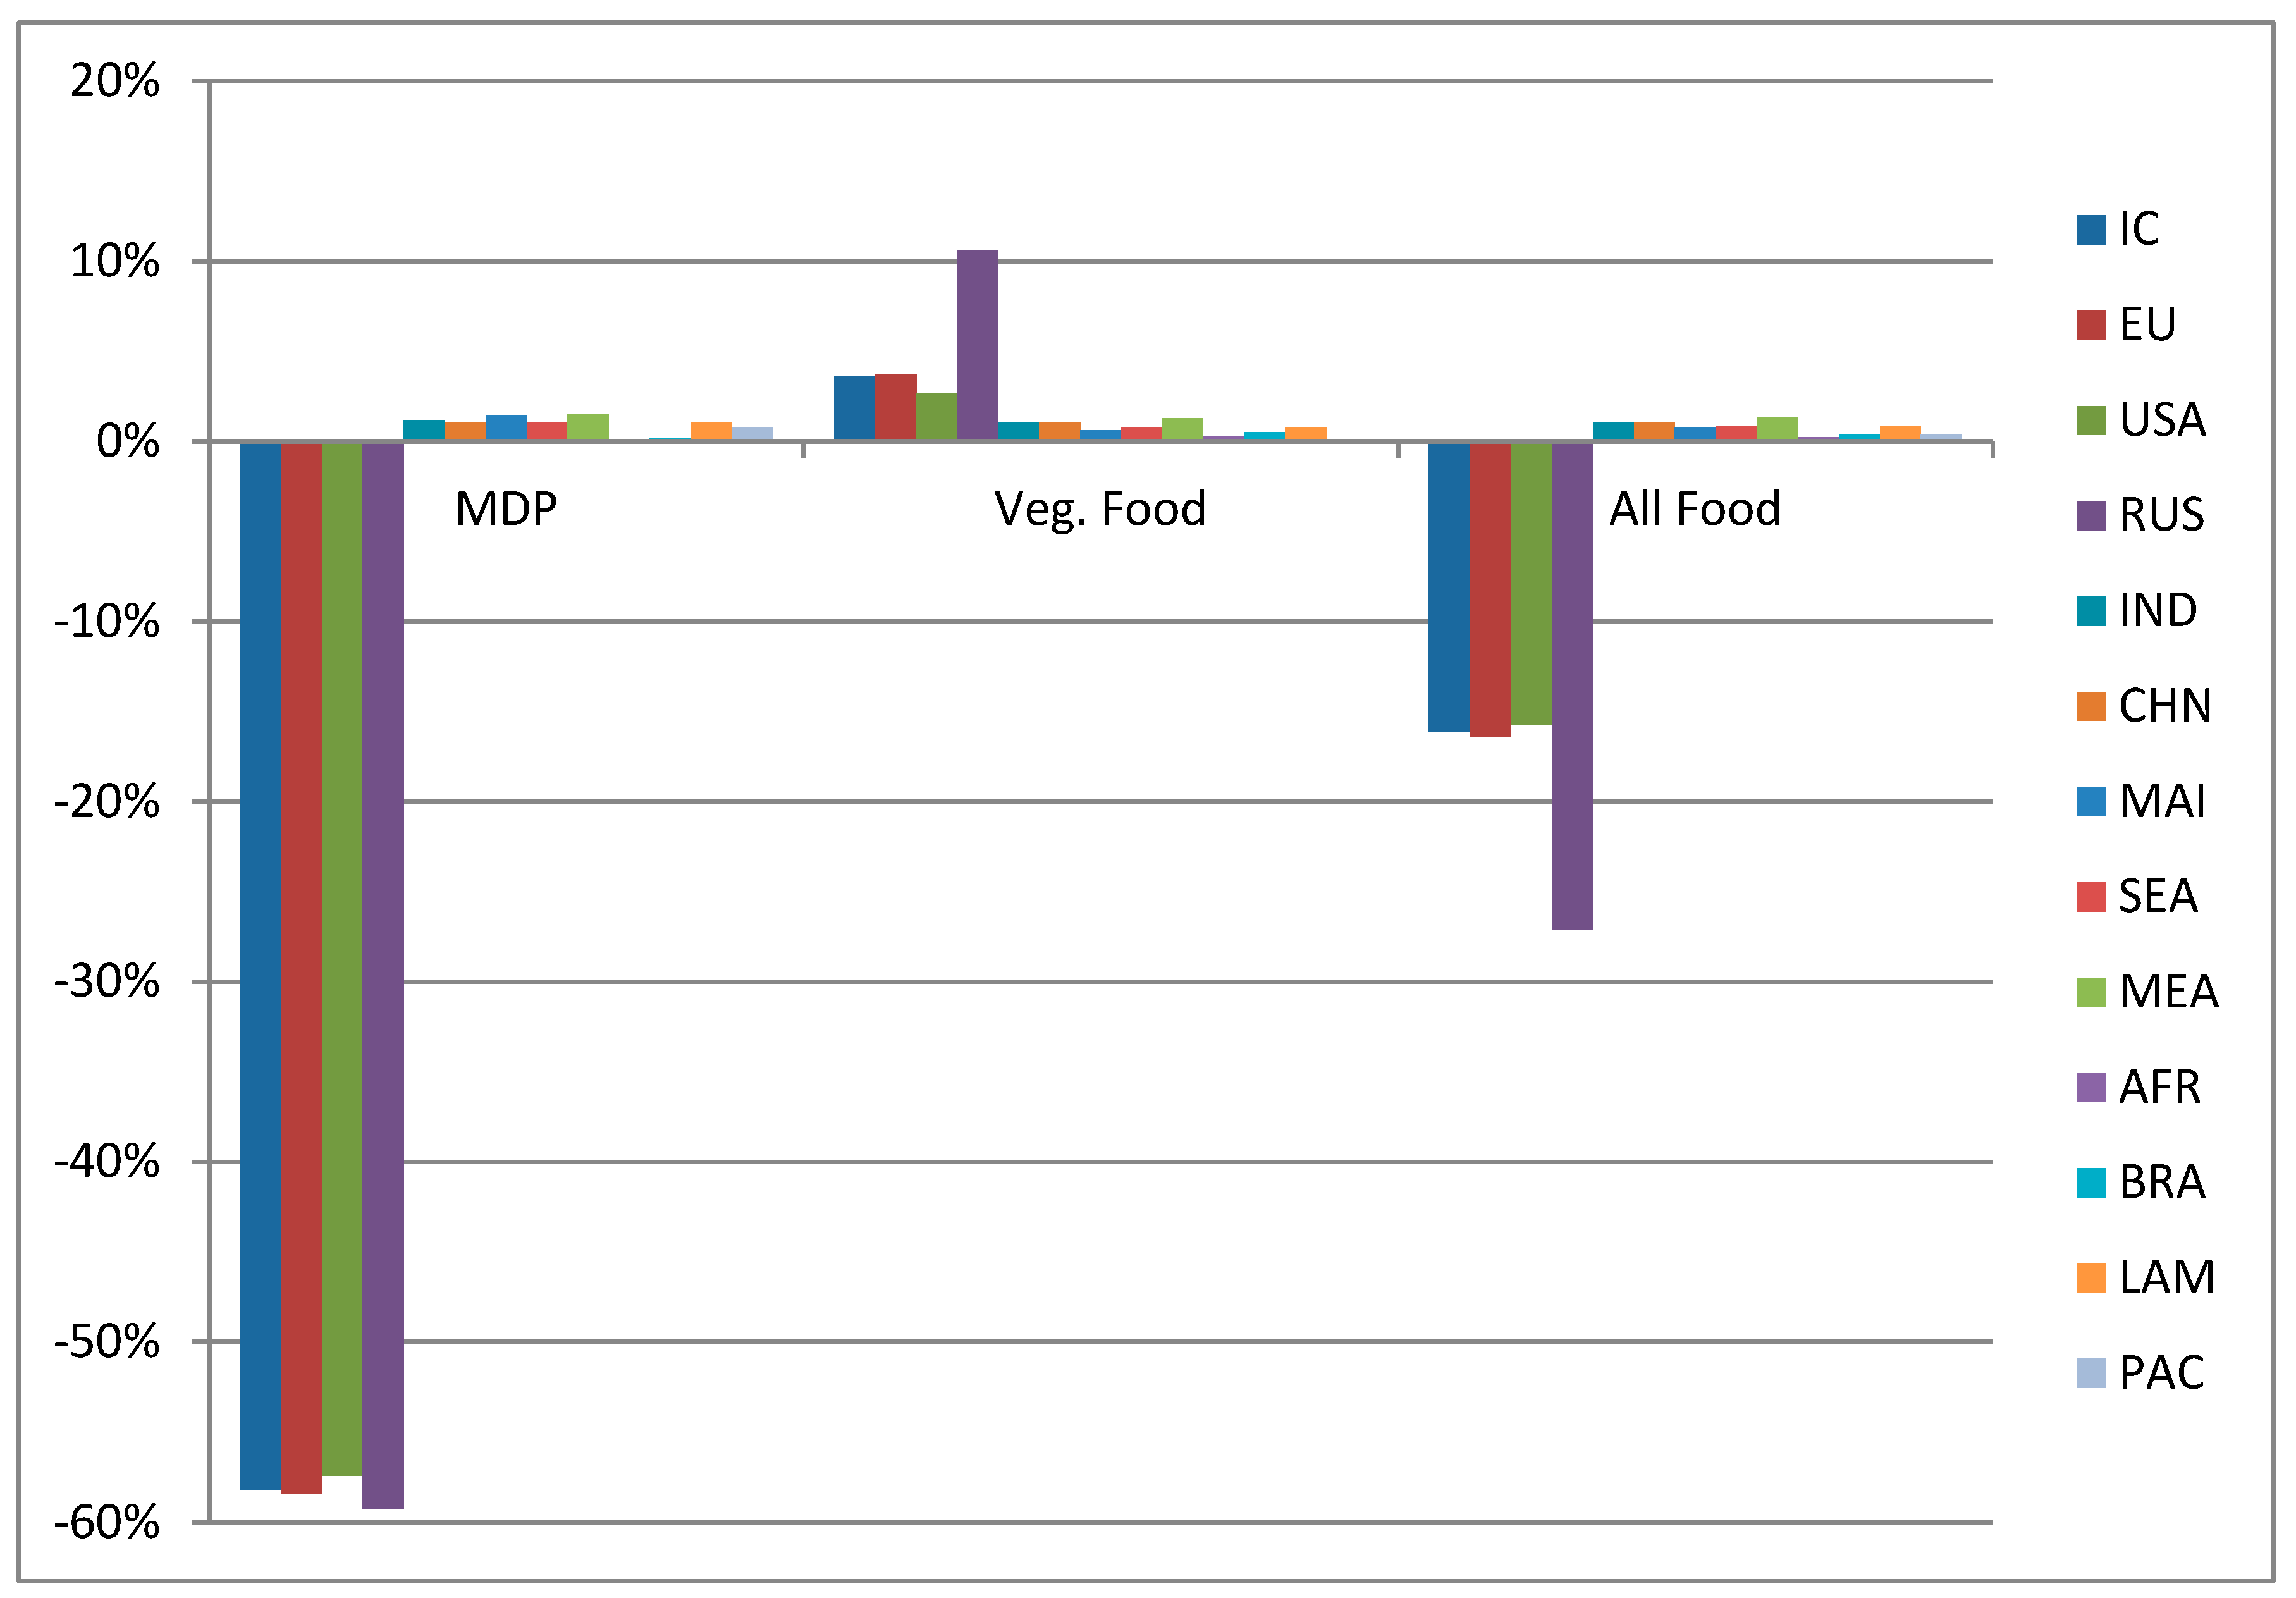
On the global average, total food consumption drops by 7% in this scenario, but regional impacts of the MDP tax differ (see Figure 8). In industrialised countries, the MDP tax causes consumption of MDP to decrease by about 58%, while it increases consumption of vegetarian food by 4–10%. Total food consumption in these countries drops by 16–27%. The tax has the strongest impact on Russia, since the share of MDP in total food consumption is high in Russia (54% in the Baseline scenario, compared to e.g., 19% in Germany) and total food consumption is low in Russia. At the same time, in Russia income elasticities of demand are lower for vegetarian food (e.g., for AGR: 0.2, processed food 0.72 ) than for many other goods (e.g., for COL: 1.09, OTH 1.14). As a consequence of these three factors, the MDP tax has a large influence on Russia, causing a reduction of overall food consumption of 27%. Regions without the MDP tax benefit from decreasing prices of food such that consumption of both MDP and vegetarian food increases by up to 1.3%. The smallest increases in food consumption are simulated for Sub-Saharan Africa and South American regions. Since they are net-exporters of food products, consumers profit less from lower world market prices. At the same time, producers are faced with lower export prices such that real gross domestic product (GDP; price differences are adjusted) decreases by 0.1–0.7% in these regions.
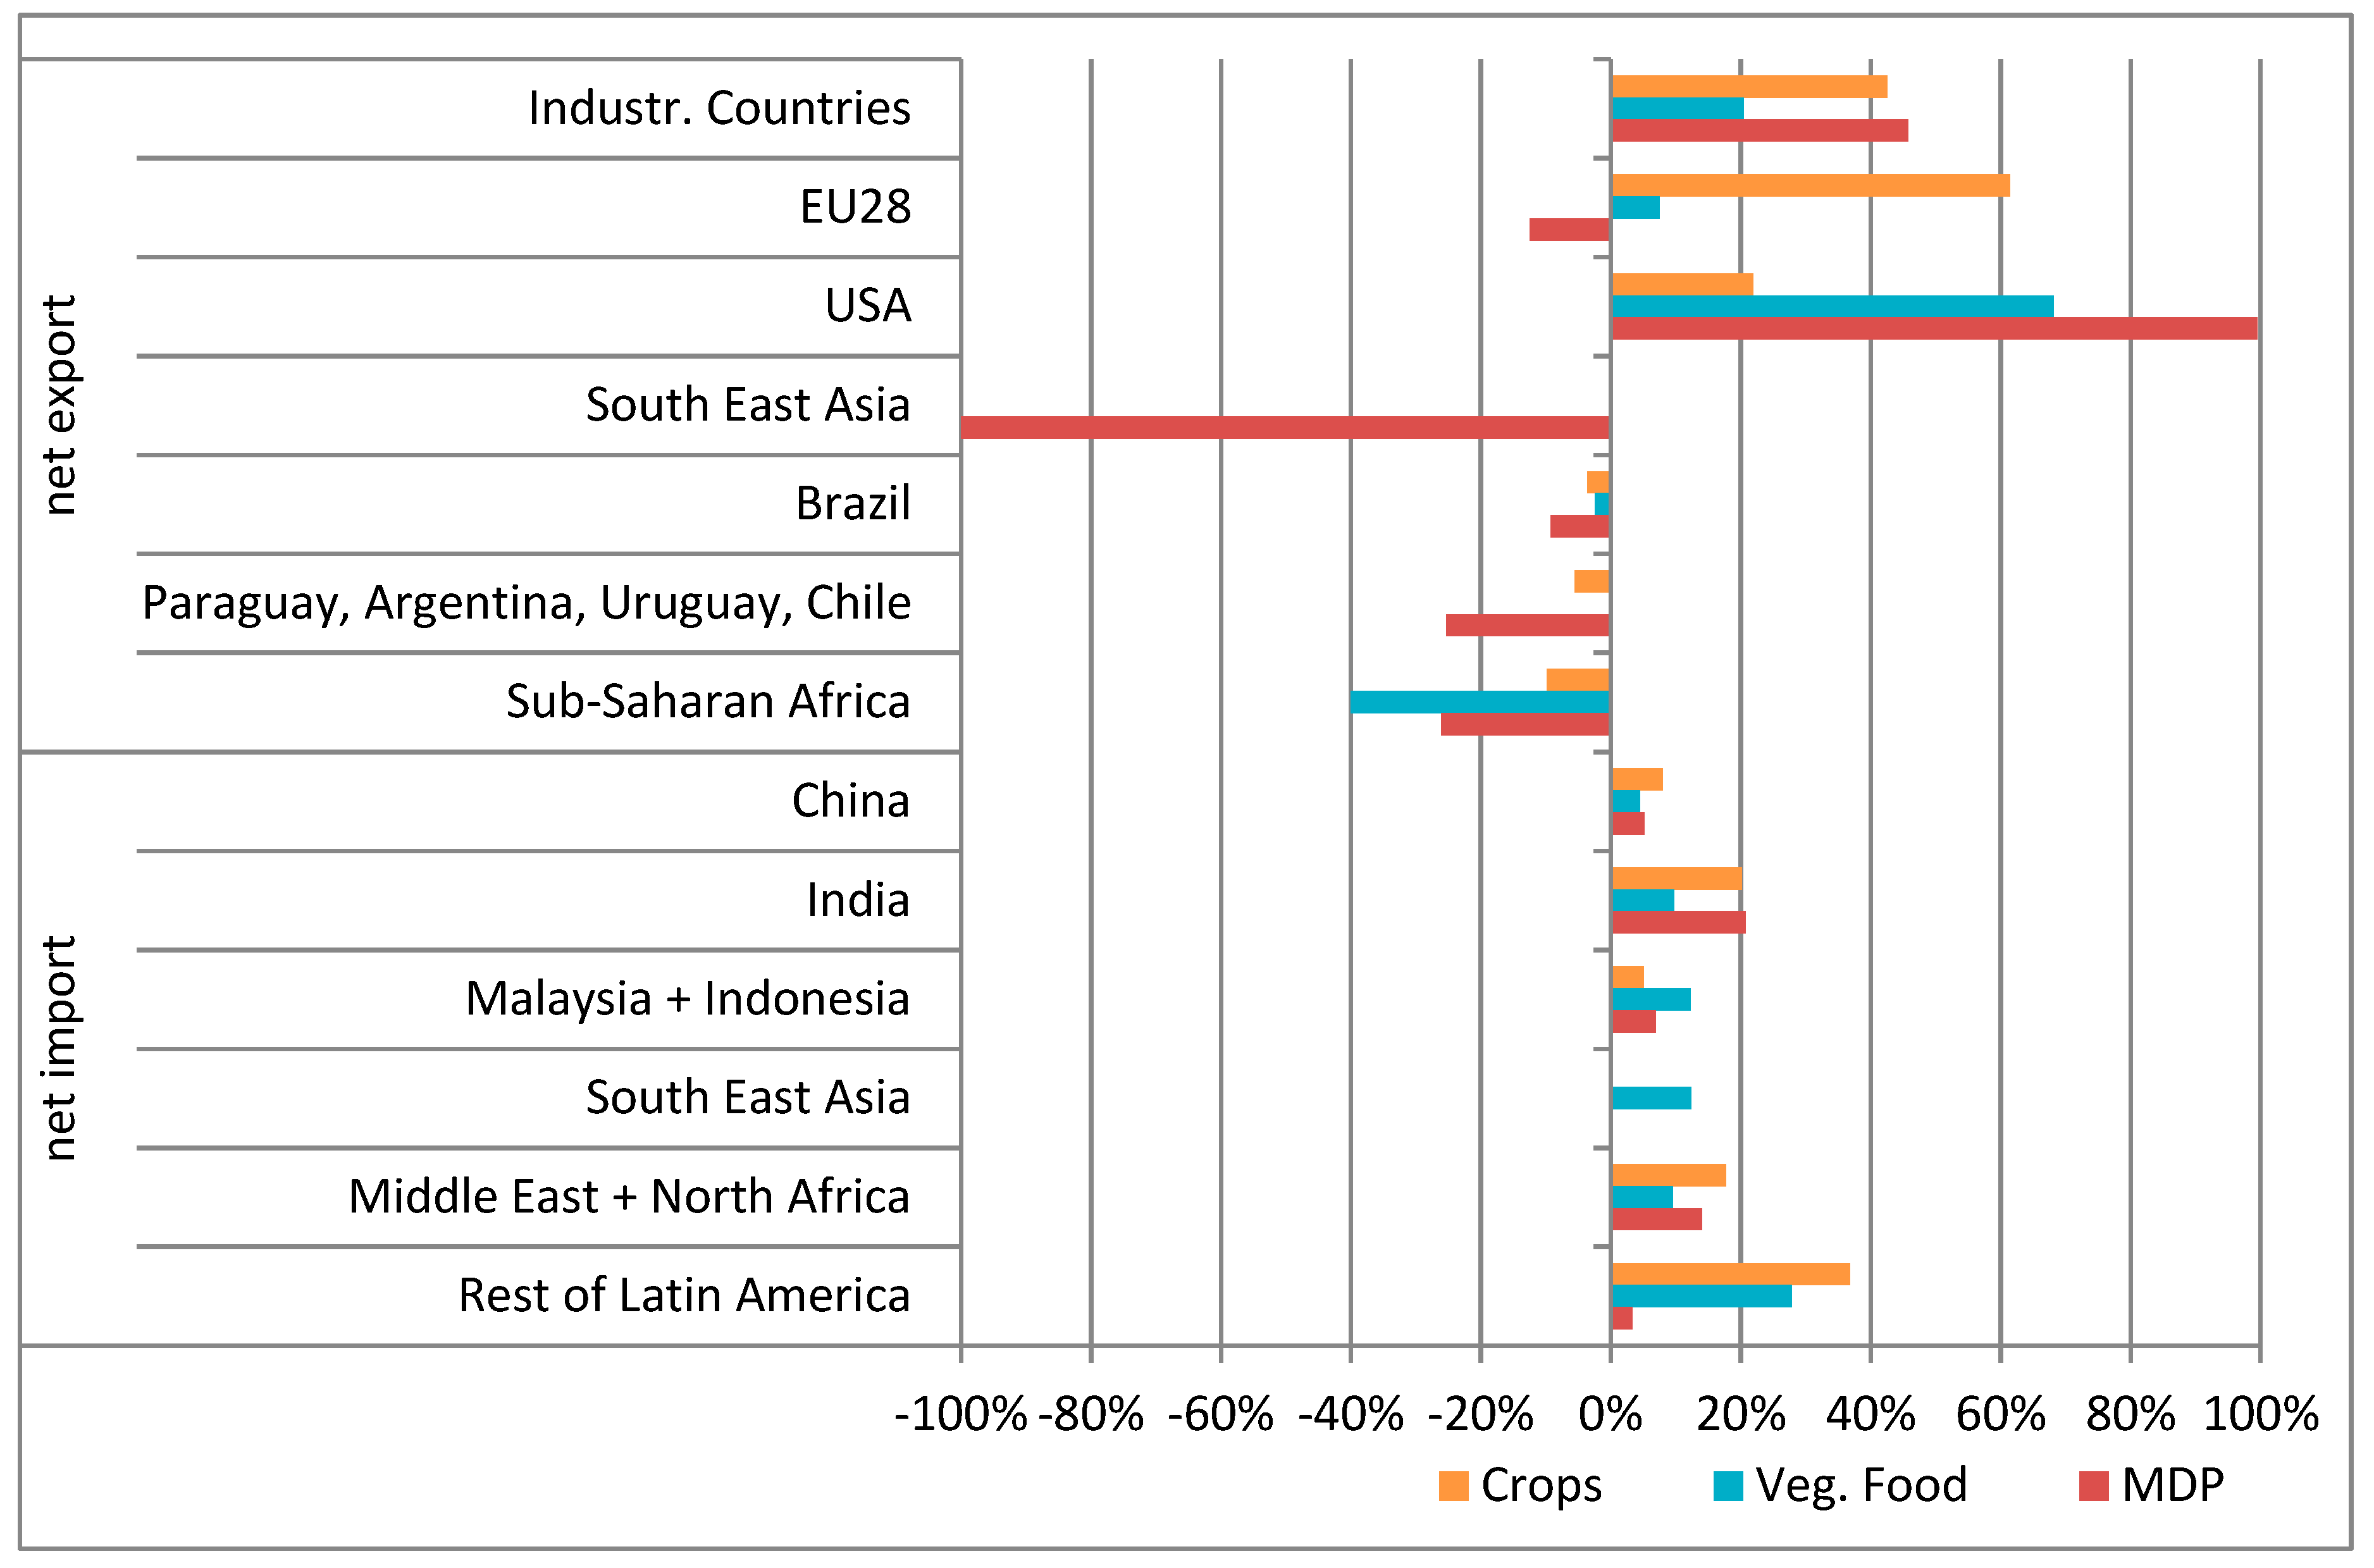
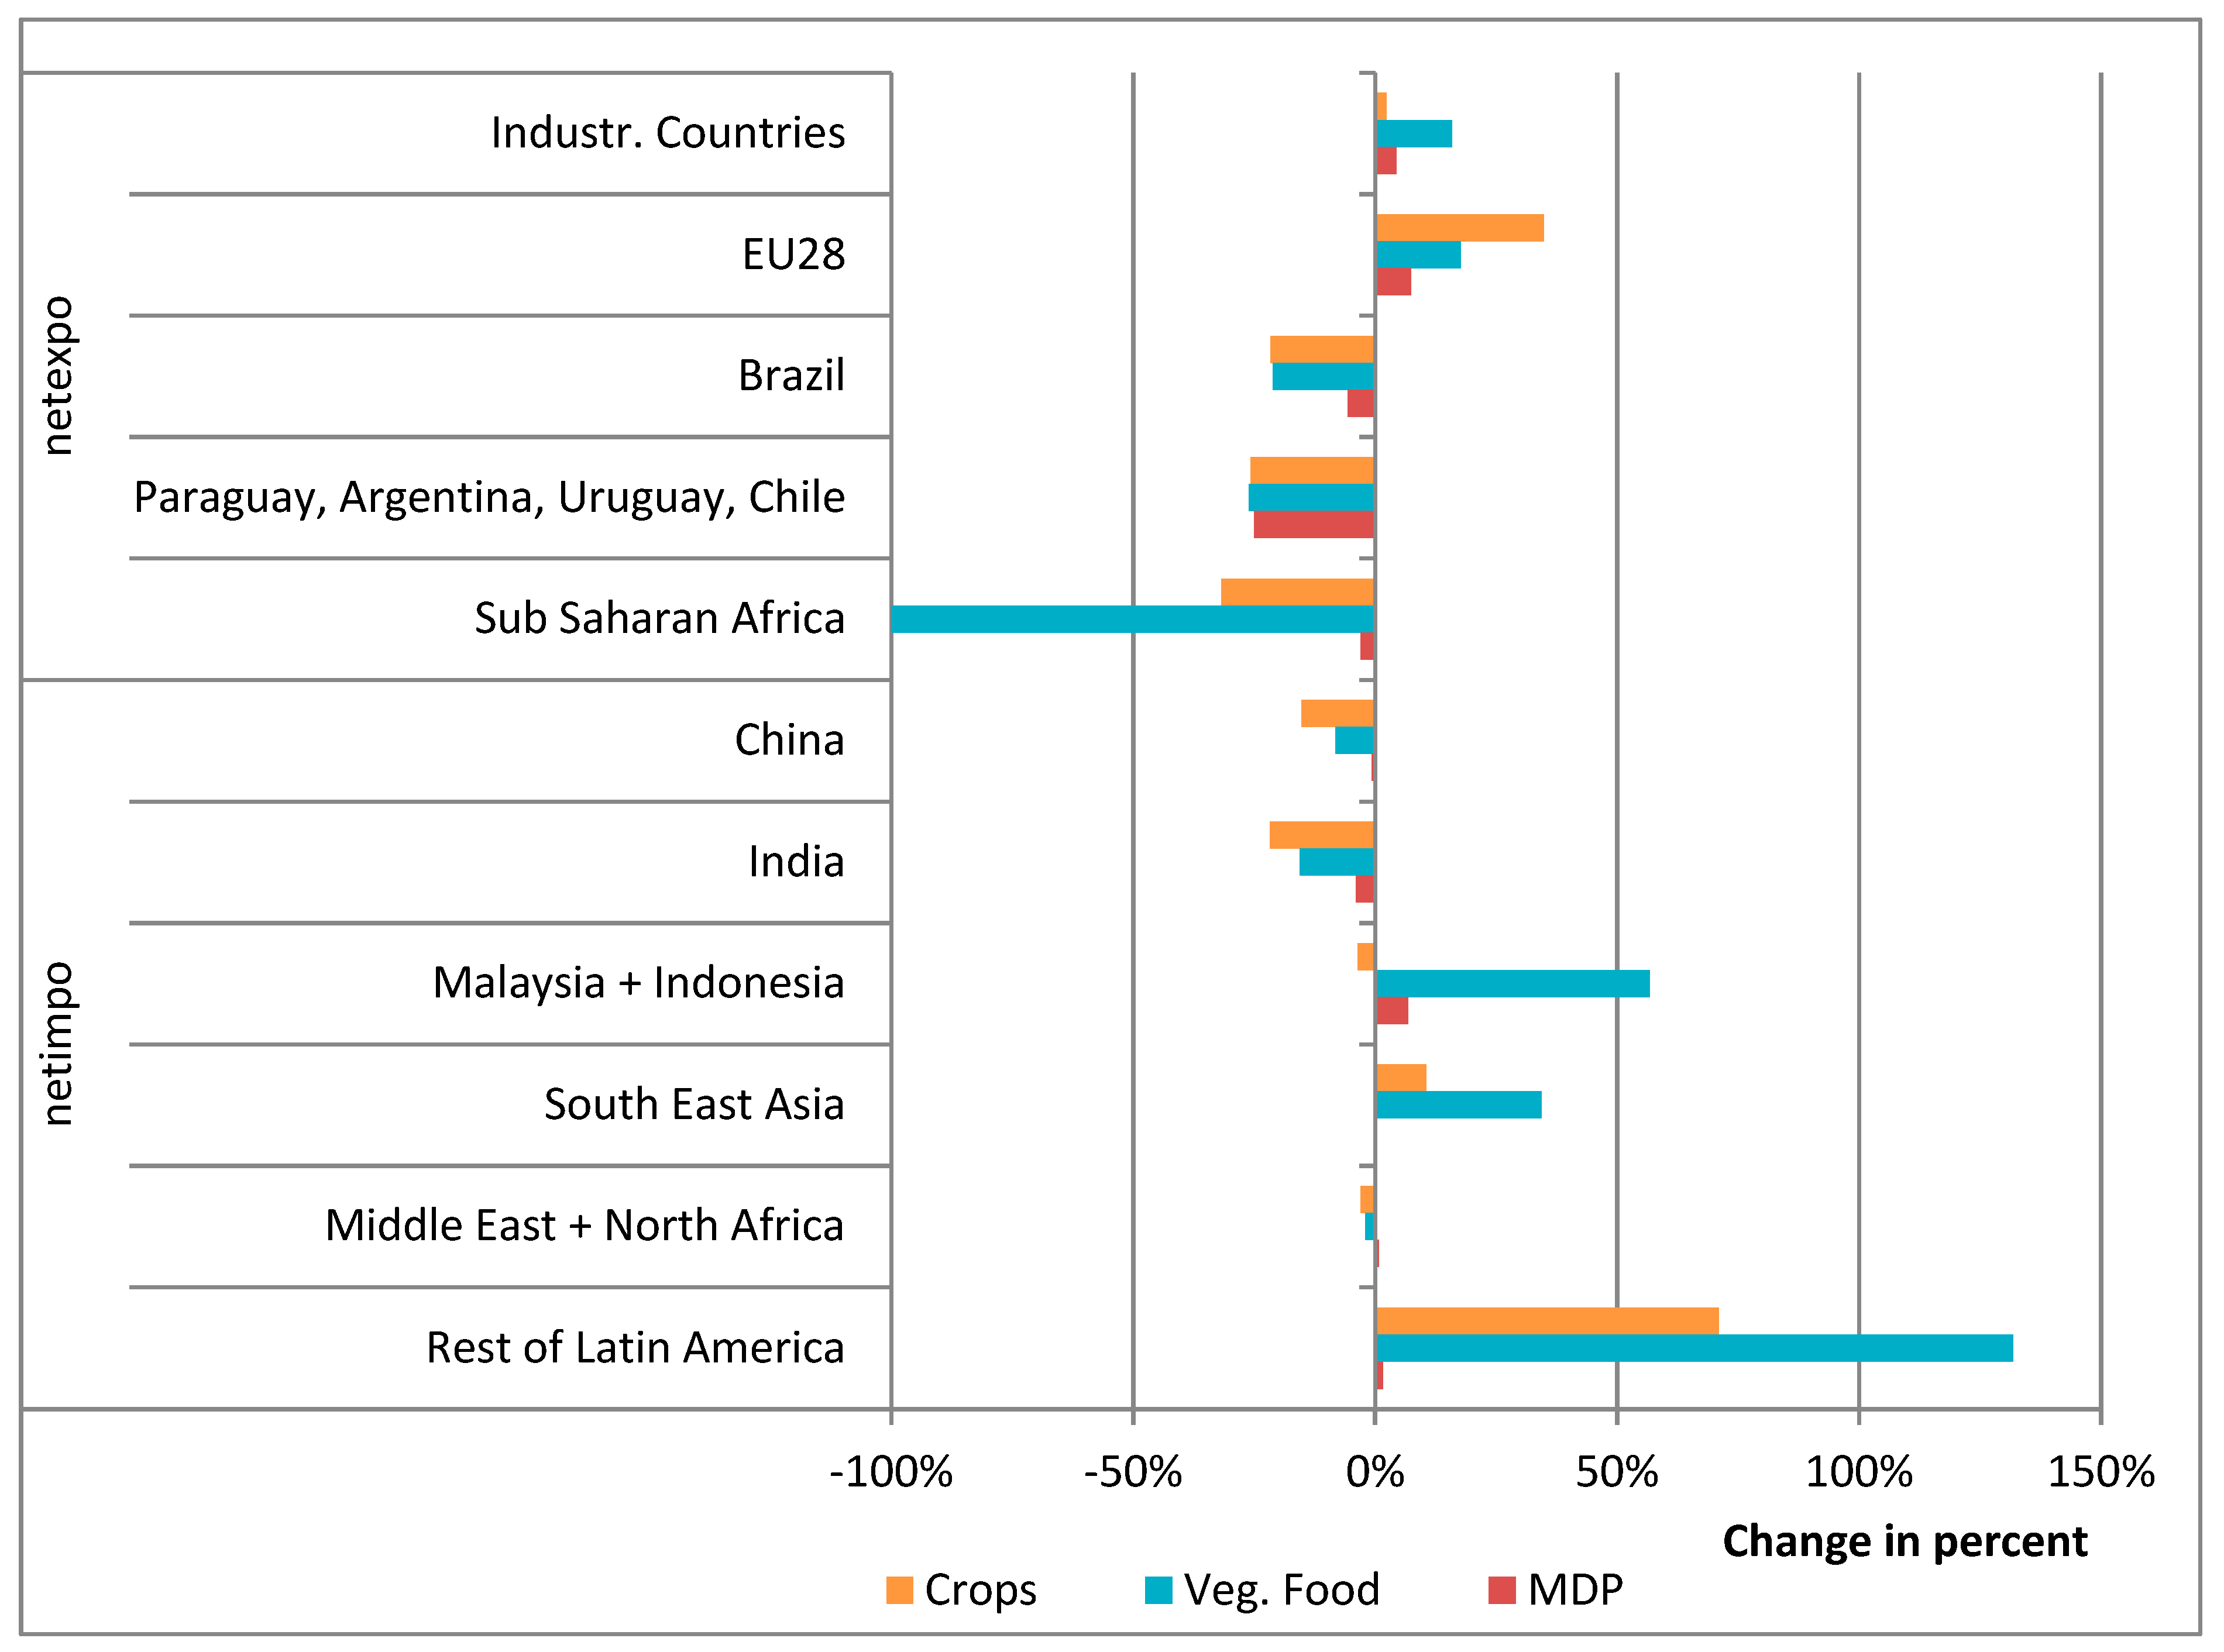
The resulting changes in net trade are illustrated in Figure 9. With the tax on MDP consumption implemented, industrialised countries increase net-exports by about 40% in case of crops and processed animal products, but also of processed vegetarian food (Veg. Food: 20%). However, there are regional differences. The EU, on the one hand, increases mainly its net-exports of crops (61%), while those of vegetarian food increase only slightly (8%) and of MDP even decrease. This counter-intuitive result can be explained by the strong reduction of EU-exports to other industrialised countries, mainly Russia and the USA. On the other hand, the USA increase its net-exports of crops by 22% and those of vegetarian food by 68%, while they nearly double their net-exports of MDP. The USA’s main trading partners of MDP are China, Middle-and South American countries, and Canada. Interestingly, in the USA both exports and imports of MDP are smaller in the MDP tax scenario than they are in the Baseline scenario; however, imports decline less than exports, so net-exports increase.
The industrialised countries increase their net-exports at the expense of all other net-exporting regions. Net-exports of processed animal products from South American regions (Brazil and Paraguay, Argentina, Uruguay, Chile) decline by 9% and 25%, respectively. Net-exports of MDP products in South-East Asia (SEA) are reduced by almost 100%. We can explain this quite extreme result by taking a look at the trading partners. South-East Asia exports target the USA, Europe and Japan. Since these regions have strong reductions in MDP consumption under this scenario, net-exports of South-East Asia drop so drastically. For the South-East Asian economic the drop in net-exports of MDP products is negligible since the net-exports only have a share of 0.2% on MDP production. With lower world market prices of crops, processed food and processed animal products, also net-exports from Sub-Saharan Africa are reduced by up to 40% compared to the Baseline scenario. Net importers such as India and China benefit from a tax on MDP consumption in industrialised countries: Lower world market prices cause net-imports of processed animal products, and also of crops and vegetarian products to rise.
Another effect of the MDP tax is a decrease in exports of processed animal products to industrialised countries. Brazil, for instance, exports 26% of its net-exports of processed animal products to Russia and 32% to Middle-East and Northern Africa (MEA) under the Baseline scenario. With the MDP tax implemented, the share of its net-exports of processed animal products targeting Russia is reduced to 8%, while those to MEA rise by 10 percent points to 42%.
In summary, our results of the MDP tax scenario show a decrease in pasture land and less land used per unit of OLVS compared to the Baseline scenario in 2030. At the same time, the total cropland area does not change, while the share of land allocated to fodder production (mainly maize, other grains and soy beans) increases. In addidtion, we find an increase in bioethanol production and a decrease in biodiesel production.
Comparing our results with other studies, such as [25], is difficult since macroeconomic drivers such as population growth, gross domestic product, as well as parameters such as elasticities are different. In fact, even after harmonising macroeconomic parameter choices and external drivers, important differences remain across models [47]. Nevertheless we can compare the overall direction of results. Similar to the MDP tax in this study, in [25] the author targets consumption of cattle, other animal products and milk by using a tariff rate in order to decrease consumption in 2020 compared to 2010 by 10, 20 and 50% in the EU27. Comparable to our study, the results are a global decrease in consumption and production of MDPs which is partly compensated by an increase in consumption of grains and other food products in EU27. Following price decreases, he also finds increases in total food consumption in the regions without a tariff or taxes. As a major difference to our results, in [25] the author finds an increase in biofuel production as a result of the tariff on MDPs which he explains by the reduction in prices for crops. We have a similar effect in case of bioethanol, but an opposite effect for biodiesel. We explain this by the differences in the representation of biofuels and related by-products in the two models: DART-BIO takes into account different vegetable oils, since in the joint production of vegetable oils and meals, the respective output ratios of oils and meals differ across oil seeds. For instance, when using soy beans 41% of the output is oil and 59% is meal, while for palm fruit 98% is oil and 2% is meal (this is based on monetary terms, for an overview on different oilseeds see Table 3 in [12]). Independent of the oilseed, in [25] the author assumes a share of 20% of by-products and 80% of the value of vegetable oil as outputs.

3.3. The “No Biofuel Policy Scenario”: Changes in Global Average Prices, Production, Consumption and Harvested Area Compared to MDP Tax Scenario

The Baseline scenario and the MDP tax scenario include current biofuel policies. With this scenario (noBFP scenario), in which biofuel policies are abolished, we aim to analyse the interplay of biofuels and livestock production, since by-products of biofuel production are used as fodder in livestock production. To analyse the additional effect of no biofuel policies, we compare this scenario to the MDP tax scenario.
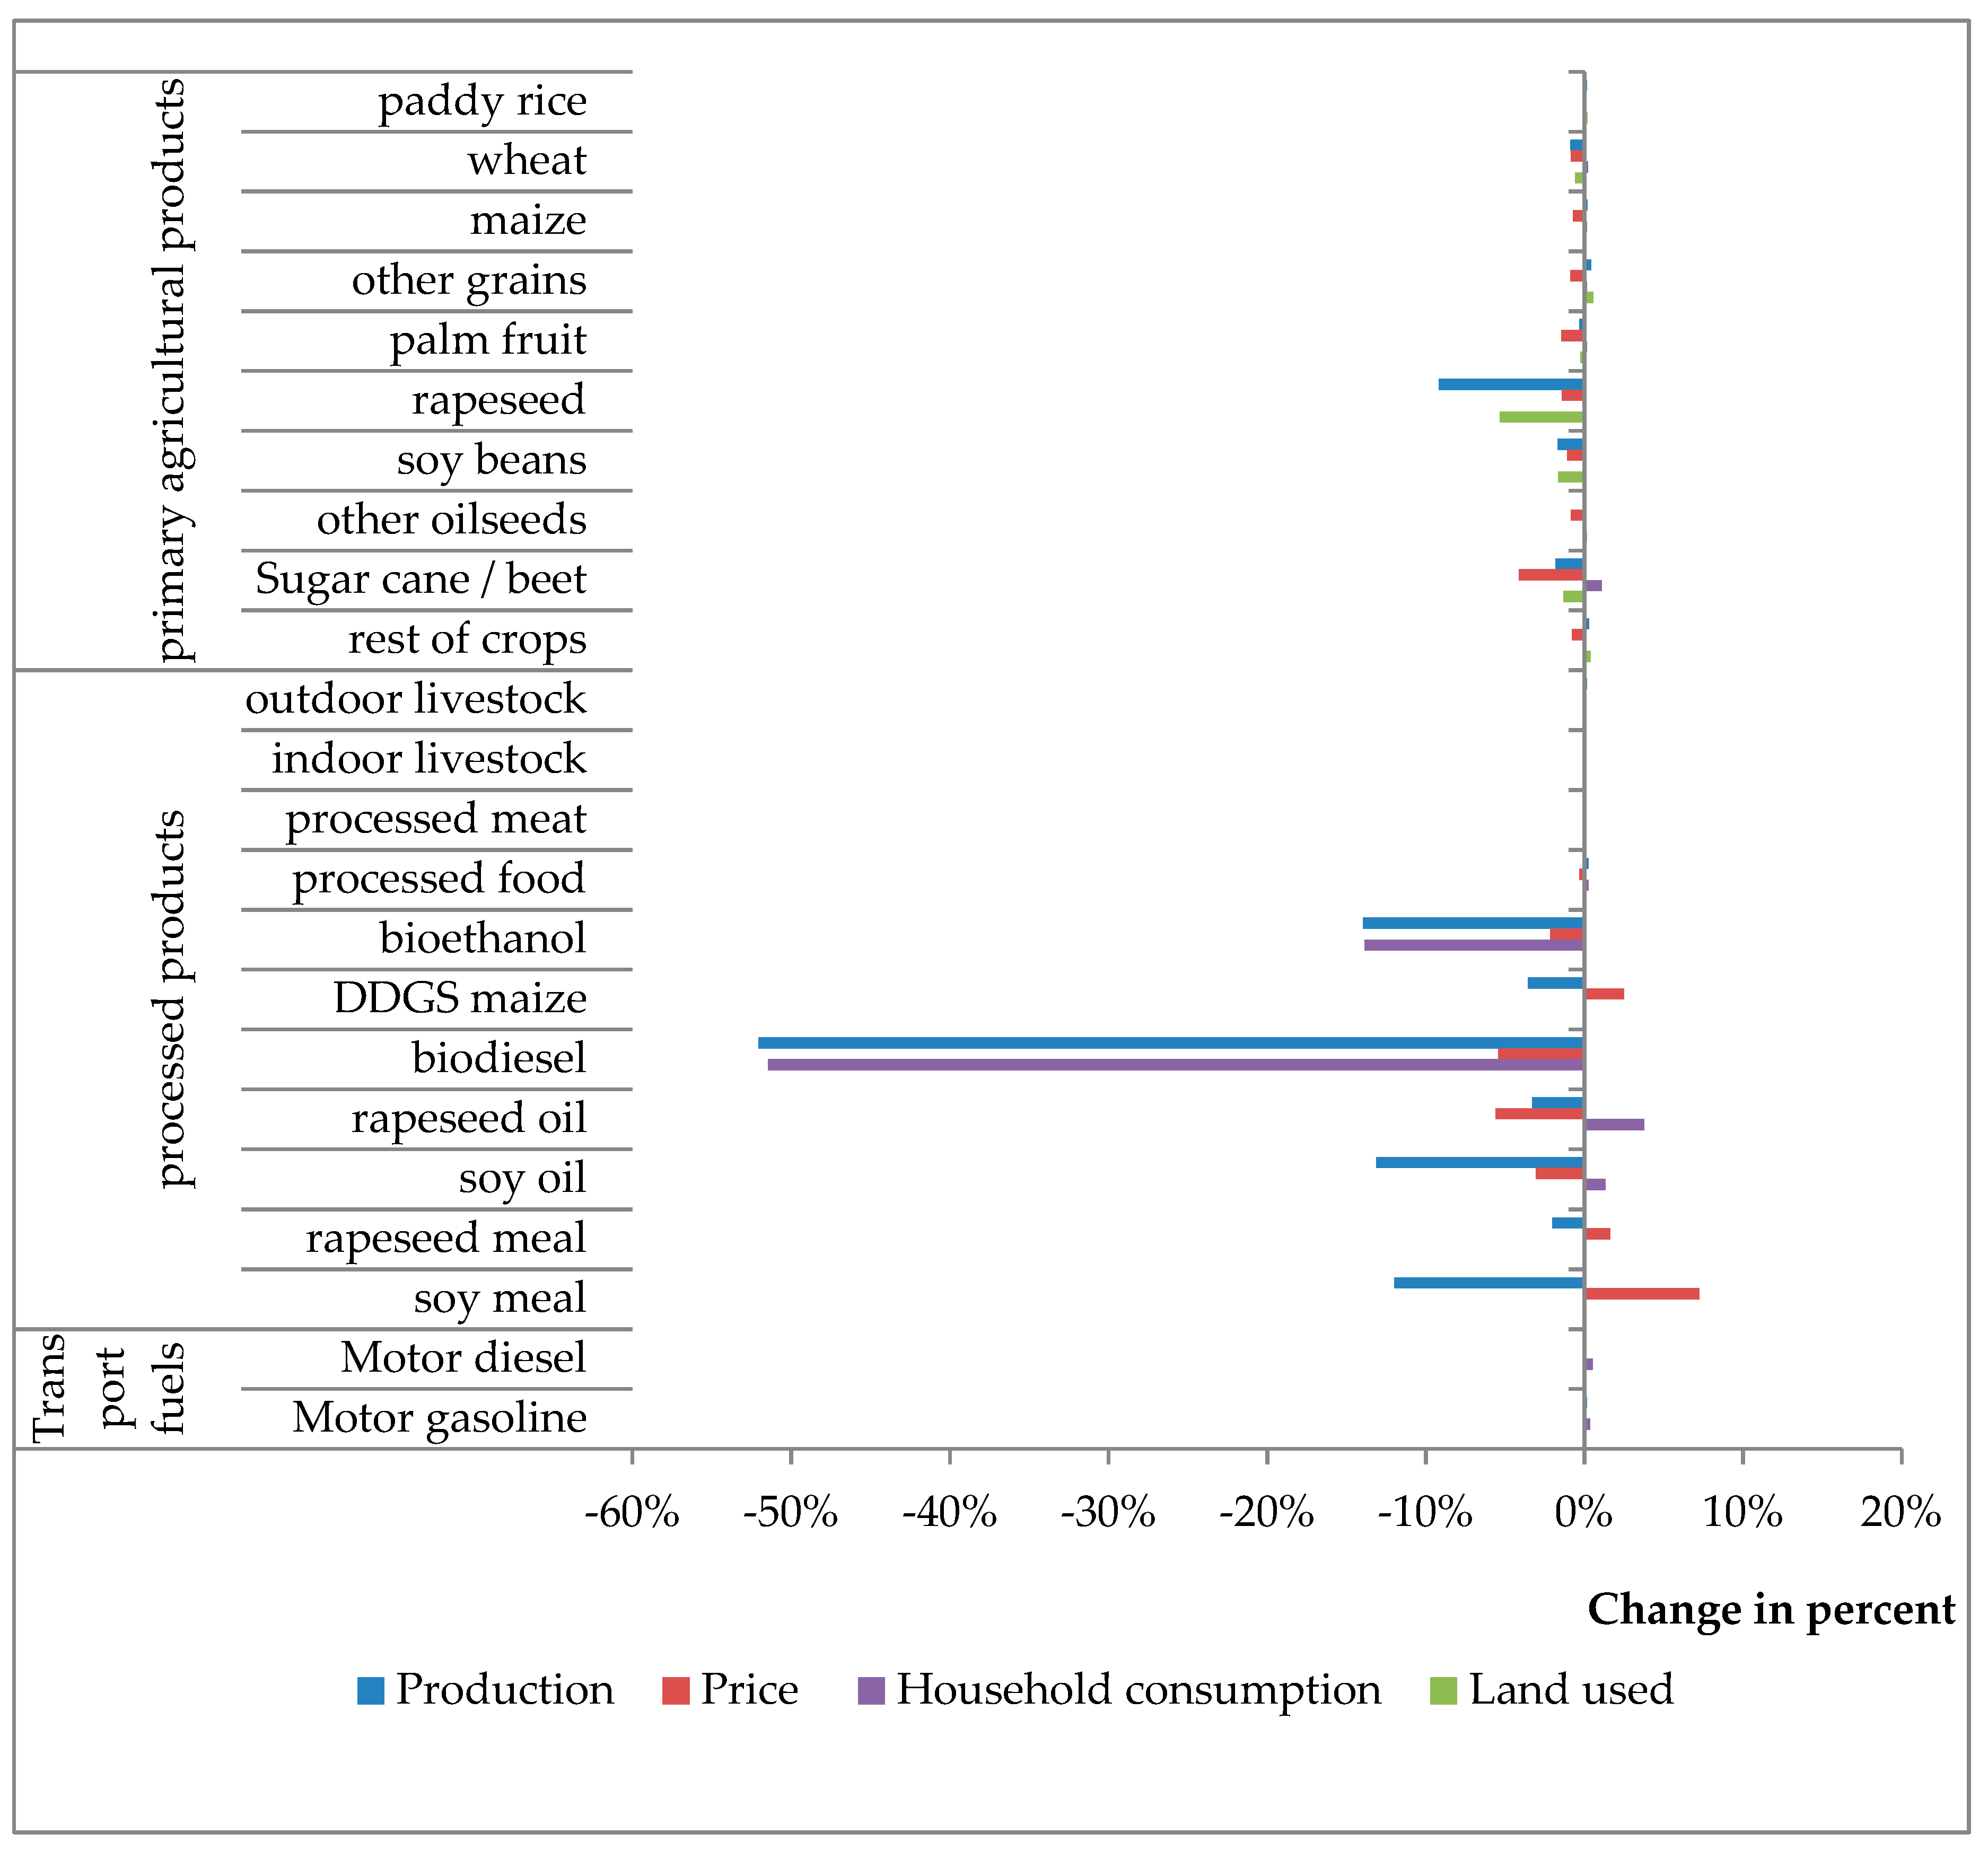
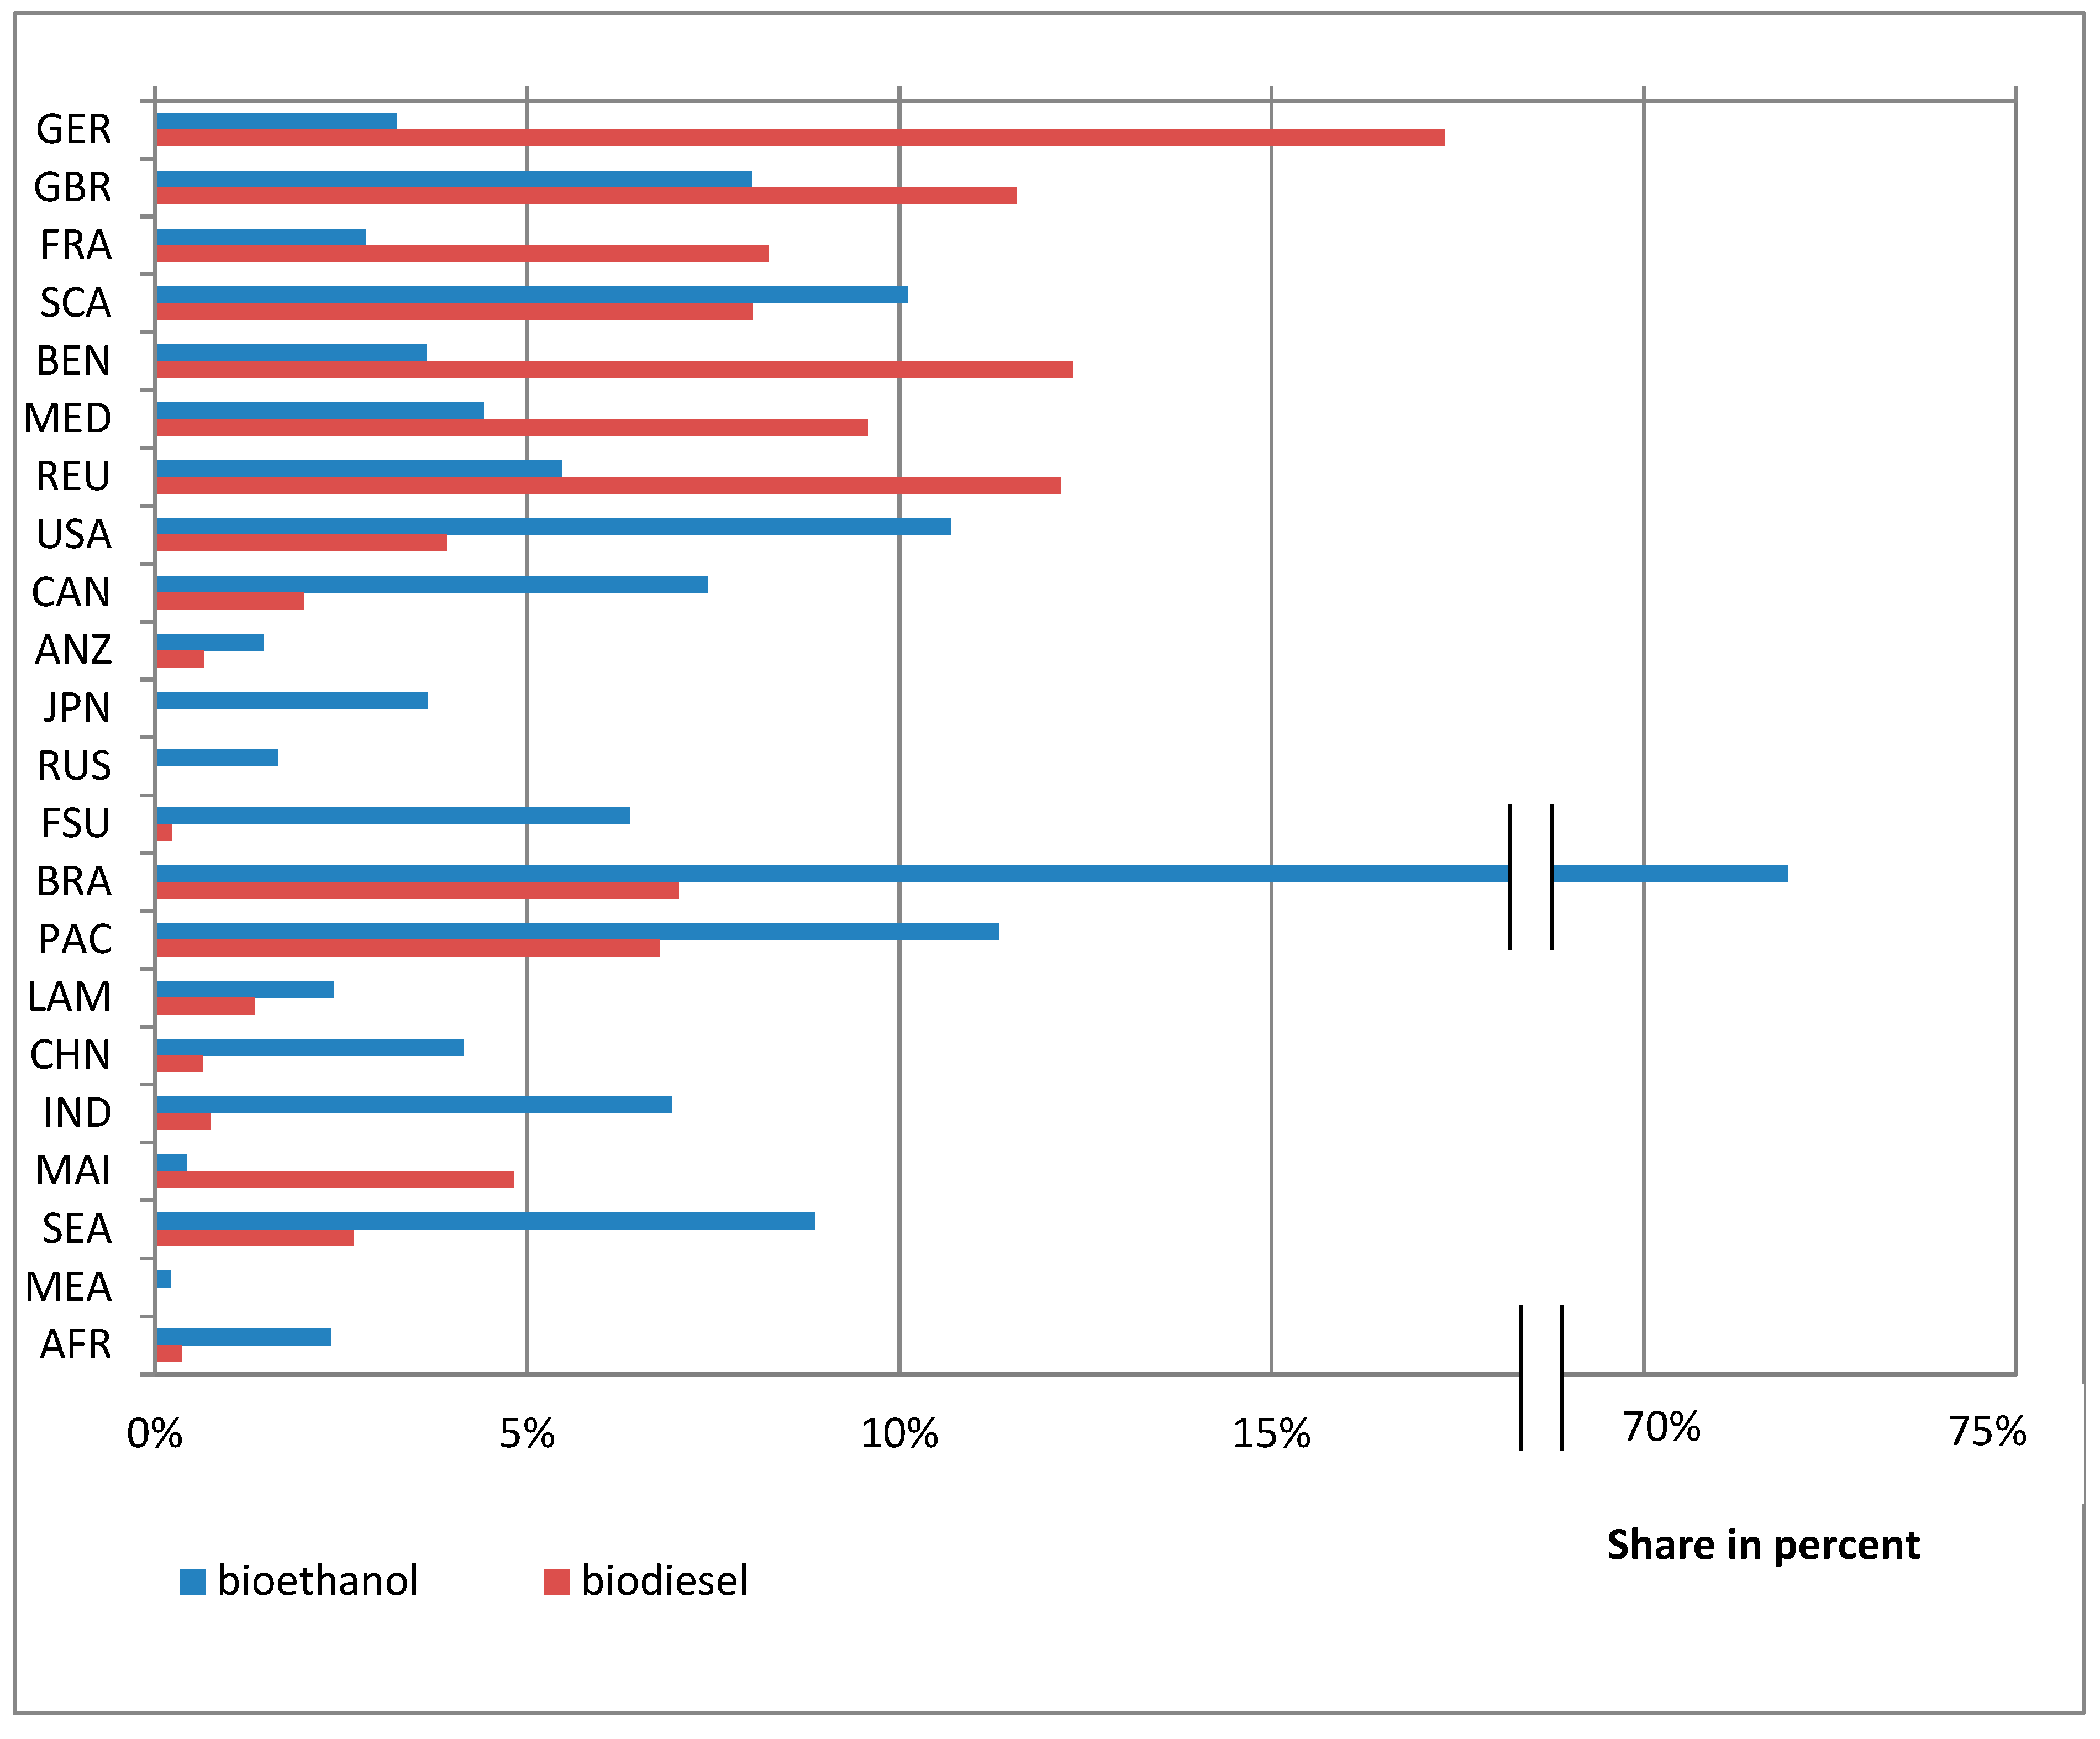
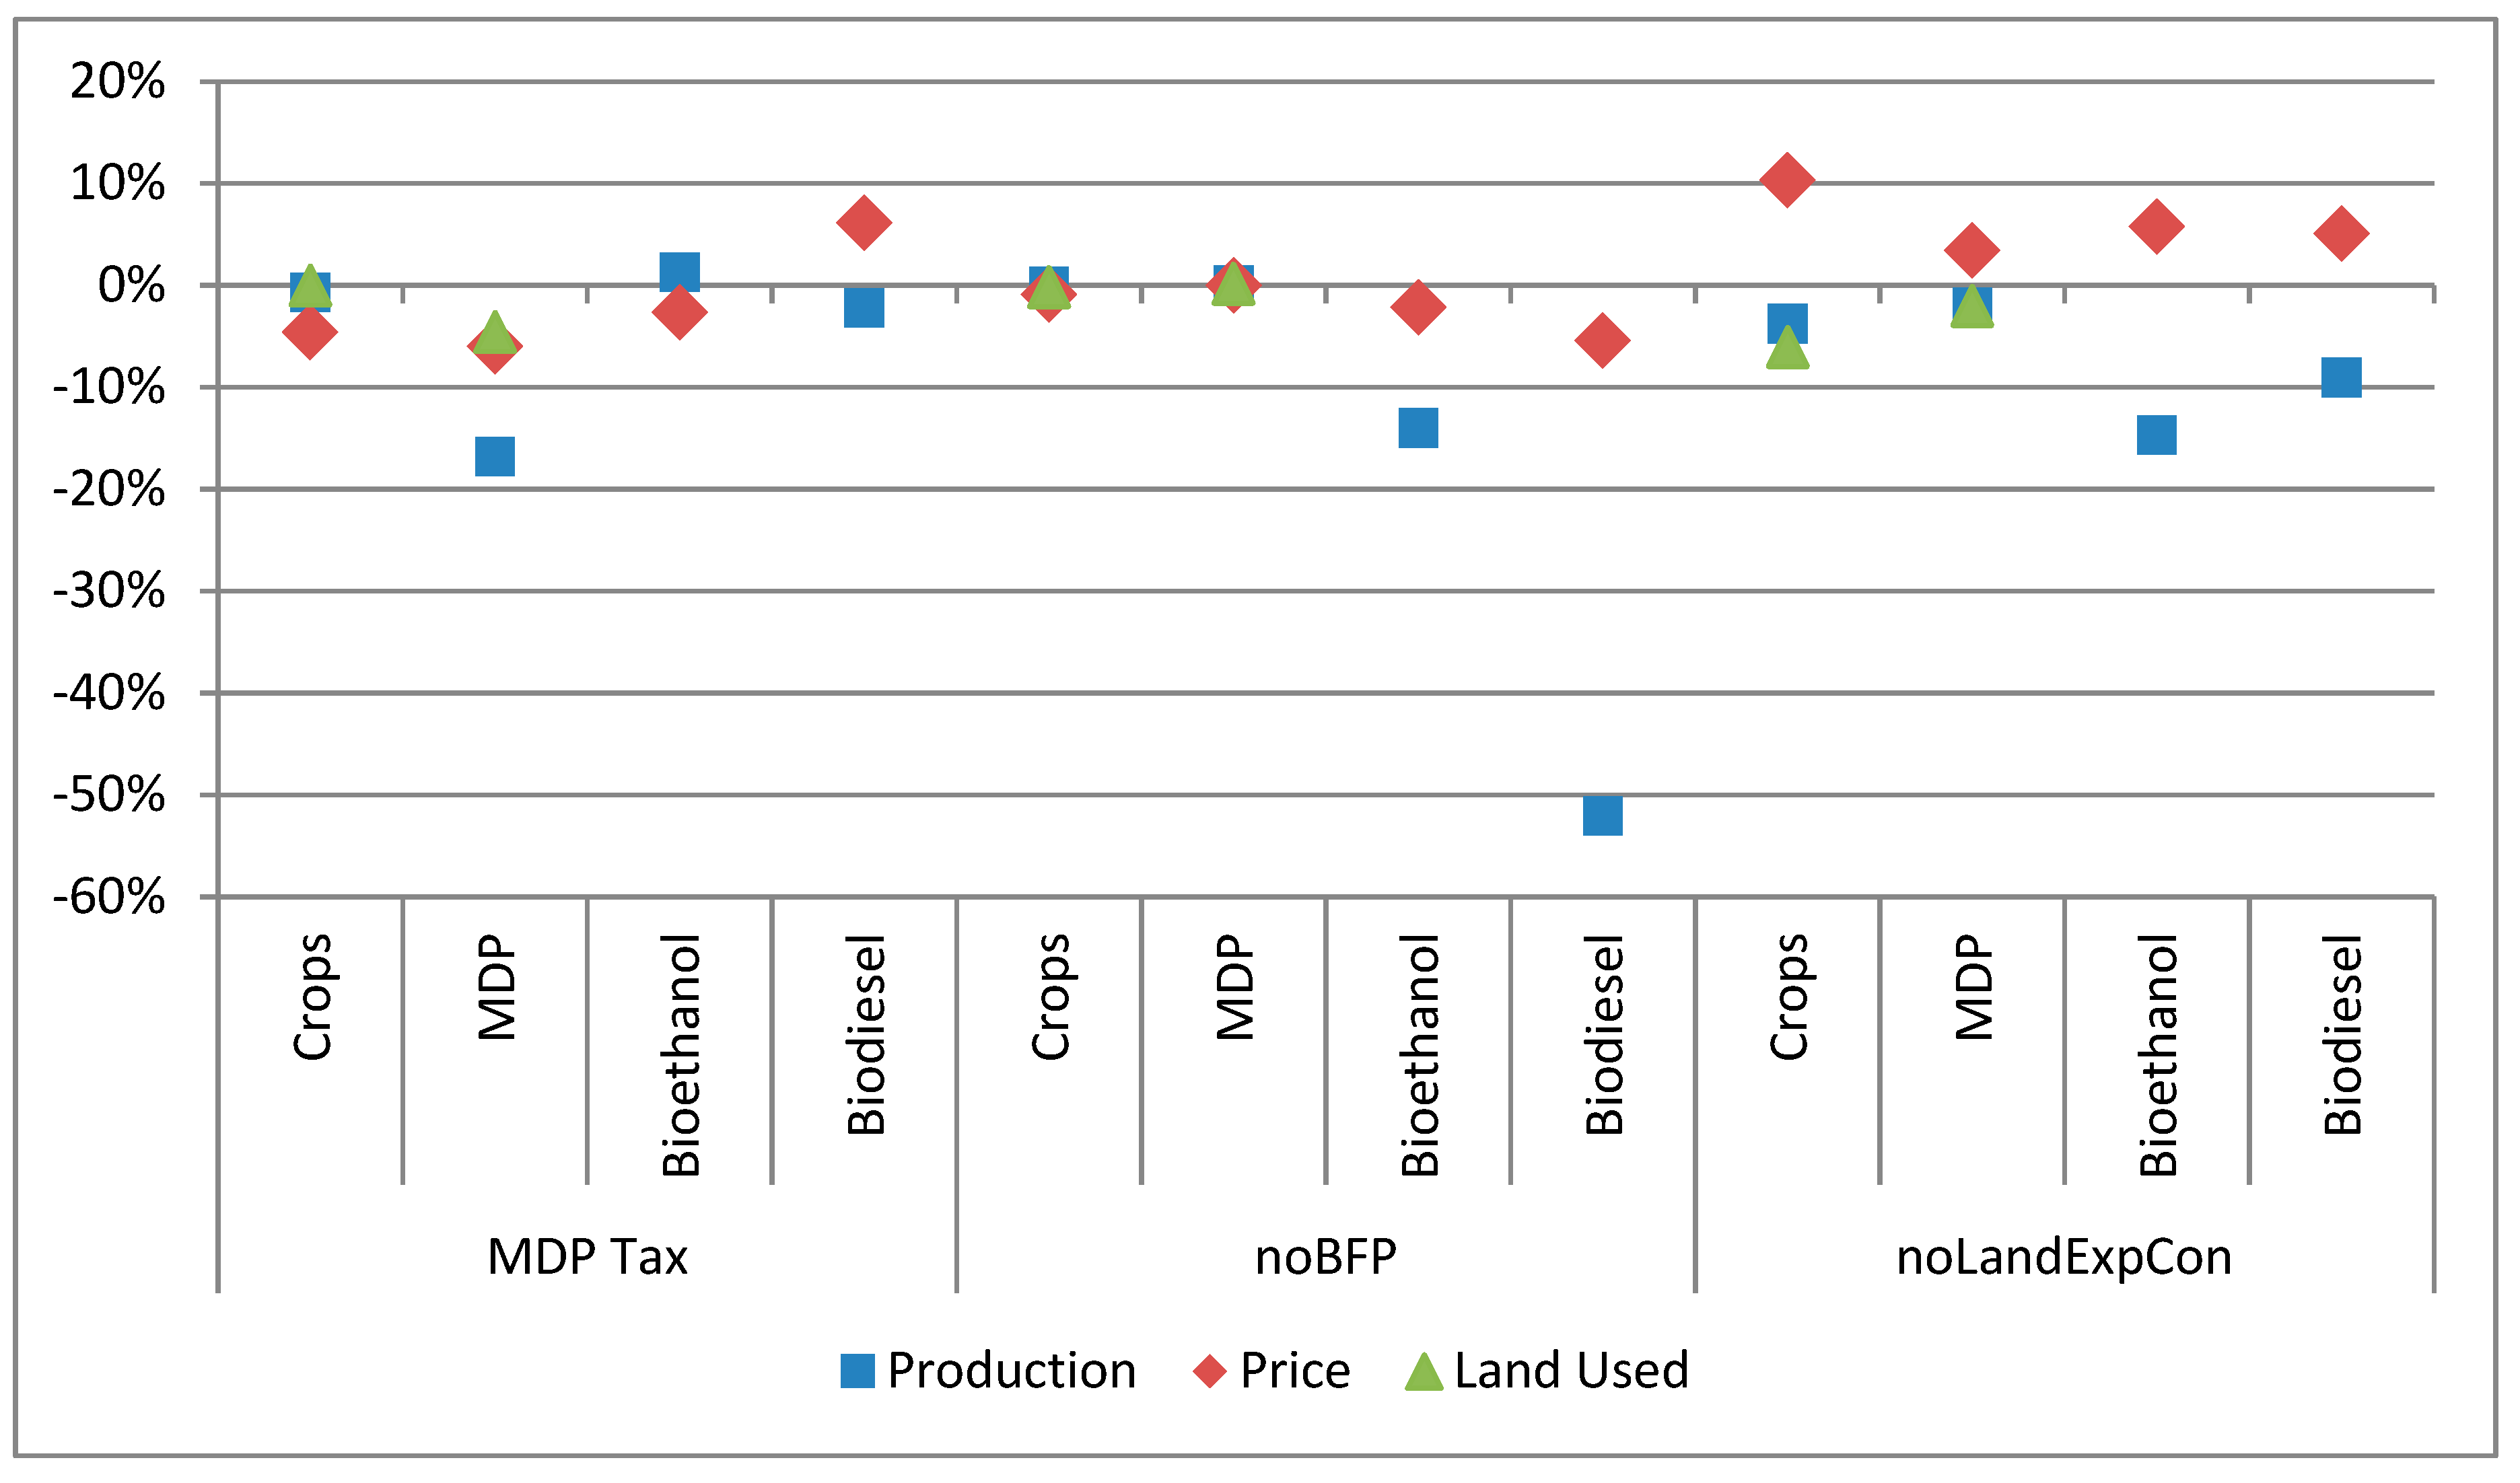
The abolishment of biofuel policies results in a global reduction of biodiesel production by 52%, and a global reduction of bioethanol production of 14% (Figure 10). This difference between the two types of biofuels is caused by the different shares of each type in transport fuels. The shares of biodiesel in transport diesel are higher compared to the shares of bioethanol (see Figure 2) in transport gasoline. Consequently, the “demand shock” and therefore the reduction in demand is higher in the biodiesel market. (Note that the share of 72% of bioethanol in Brazil (see Figure 2) is not forced into the model, since Brazil produces bioethanol and sugar in plants that can easily switch production depending on prices [12]). A minor effect is a change in relative prices of biodiesel and bioethanol compared to their fossil alternative: the relative price of biodiesel compared to fossil diesel increases, the relative price of bioethanol compared to fossil gasoline decreases.
Less demand for biodiesel causes vegetable oil price and production to decline. The production of jointly produced meals also decreases, while their prices rise. The impact on global crop production and prices as well as land use is relatively small. Production of rape seed decreases by 9%, as does production of soy bean and sugar cane/beet, since less of these feedstocks are used for biofuel production. With respect to changes in crop prices caused by biofuel policies, compared to studies (as analysed in [16]) that do not implement a MDP tax simultaneously, the changes in crop prices are at the lower bound of the range in results. This is in line with [12,22] (using the same model that we do), which also simulate relatively low increases in crop prices compared to studies quoted in [16]. Moreover, in [12] the authors show that the implementation of biofuel policies results in decreasing prices of indoor livestock which is mainly fed by feed crops. They explain this effect by the increases in the availability of animal feed on the market resulting from by-products of the biofuel industry. The restrictions on demand set by the MDP tax oppress this mechanism in our analysis.
While results of Section 3.2 illustrate that the MDP tax has an impact on the biofuel sector, an abolishment of biofuel policies does not impact on global prices, production or consumption of MDP, if the MDP tax is implemented at the same time.
Also with respect to land use change, on the global scale the abolishment of biofuel policies does not have a big impact: the total cropland area does not change, but the share of rapeseed, soy beans and sugar cane/beet is reduced. Pasture land increases by 0.3%. For an abolishment of biofuel policies without a simultaneous MDP tax, in [22] the authors also find low land use change effects, but with regional differences: less land is used for crop production in the EU, Paraguay, Argentina, Uruguay, Chile, and cropland area increases in in India. In [14], where the land use impact of the EU biofuel mandate in 2020 is simulated with the CGE model MIRAGE, the authors find an increase in the global cropland area of around 0.22% (2708 thousand hectares) and a decrease of 0.04% (357 thousand hectares) of pasture land in 2020 compared to a Baseline scenario. Substiantial differences in the underlying modelling of land use change ([14] allows for an endogenous expansion into uncultivated land in addition to land use substitution between cropland and managed pasture and forest) make results hard to compare to ours. We conclude that the abolishment of biofuel policies does not reduce land use substantially, since the by-products used for animal feeding need to be replaced by primary production of feed crops.
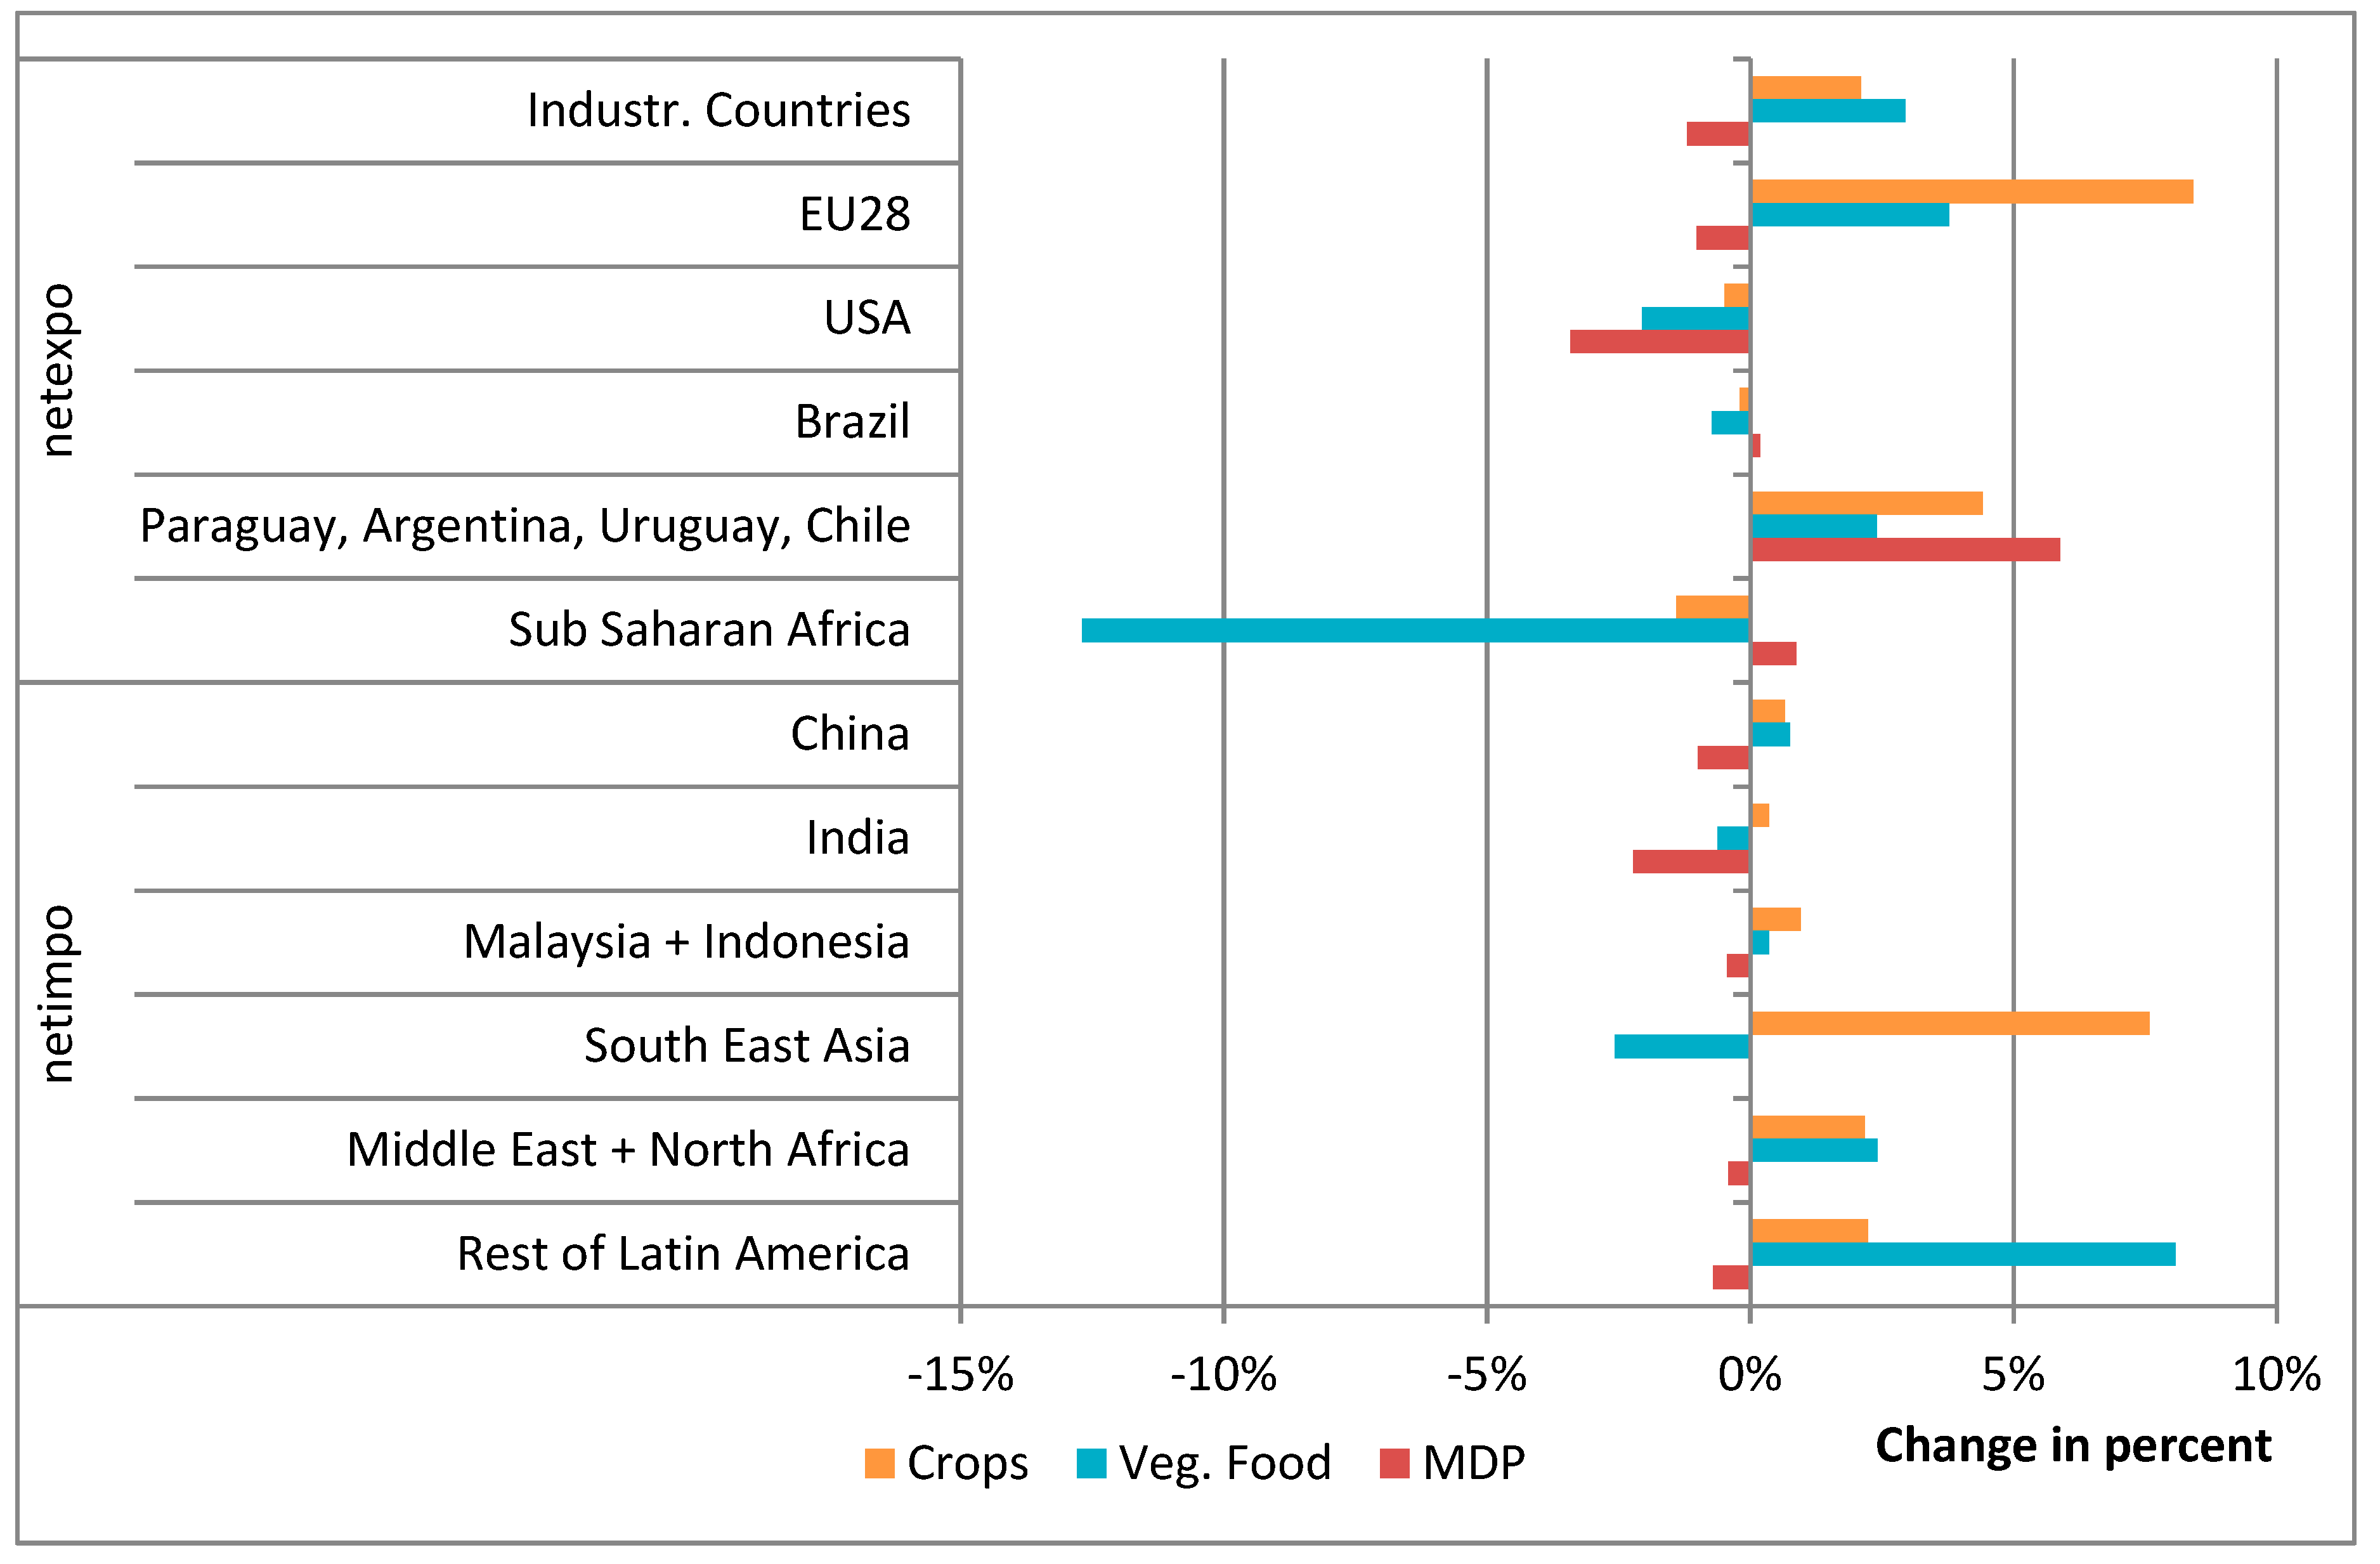
However, the abolishment of biofuel policies has some influence on international trade of MDP. It causes net-exports of MDP for most industrialised countries to decrease by 1% (see Figure 11). With less by-products being produced in the biofuel industries, prices of vegetable oils decrease, while in the joint production process DDGS and meal prices increase. This causes a reduction of MDP production in industrialised countires. With MDP consumption remaining stable, this leads to decreasing net-exports.
With a strong reduction in biofuel consumption in the EU (mainly biodiesel), EU net-exports of crops and total vegetarian food increases. The largest share of EU’s net-exports of crops go to the regions “Rest of the World”, Russia and Middle East and Northern Africa. The increases in EU net-exports of crops are highest for the target regions Sub-Saharan Africa (+18%), “Rest of Latin America” (+15%), Australia and New Zealand (+11%), and China (+10%).
The changes in trade patterns of the USA are different to the EU: Here, net-exports of crops and total vegetarian food decrease. For total vegetarian food the strongest changes in US net-exports are a decrease in net-exports to the region “Paraguay, Argentina, Uruguay, Chile” (−10%) and an increase in net-exports to “Rest of Latin America” (+27%). While the absolute quantity of changes in net-exports is negligible for the USA, this is not the case for “Rest of Latin America”: Here, net-imports increase by 8%. This is also due to strongly increased net-imports (+40%) from EU region “Mediterranean”.
The region “Paraguay, Argentina, Uruguay, Chile”, on the other hand, increases its net-exports of vegetarian food, mainly to USA, Sub-Saharan Africa and “Rest of Latin America”. At the same time, net-exports to several EU regions decrease strongly. Furthermore, “Paraguay, Argentina, Uruguay, Chile” increases its net-exports of MDP (5.9%), mainly to “Rest of the World” and USA. Sub-Saharan Africa decreases its net-exports of crops and, even more so, of other vegetarian food (13%) compared to the MDP tax scenario, mainly due to decreasing net-exports to EU countries.

3.4. The “No Cropland Expansion/Contraction Scenario”: Changes in Global Average Prices, Production, Consumption and Harvested Area Compared to “No Biofuel Policy Scenario”

In all previous scenarios we implemented cropland expansion/contraction. In this scenario, we analyse the effects of an increased land scarcity by assuming no cropland expansion into uncultivated areas. This scenario is compared to the “no biofuel policy scenario”.
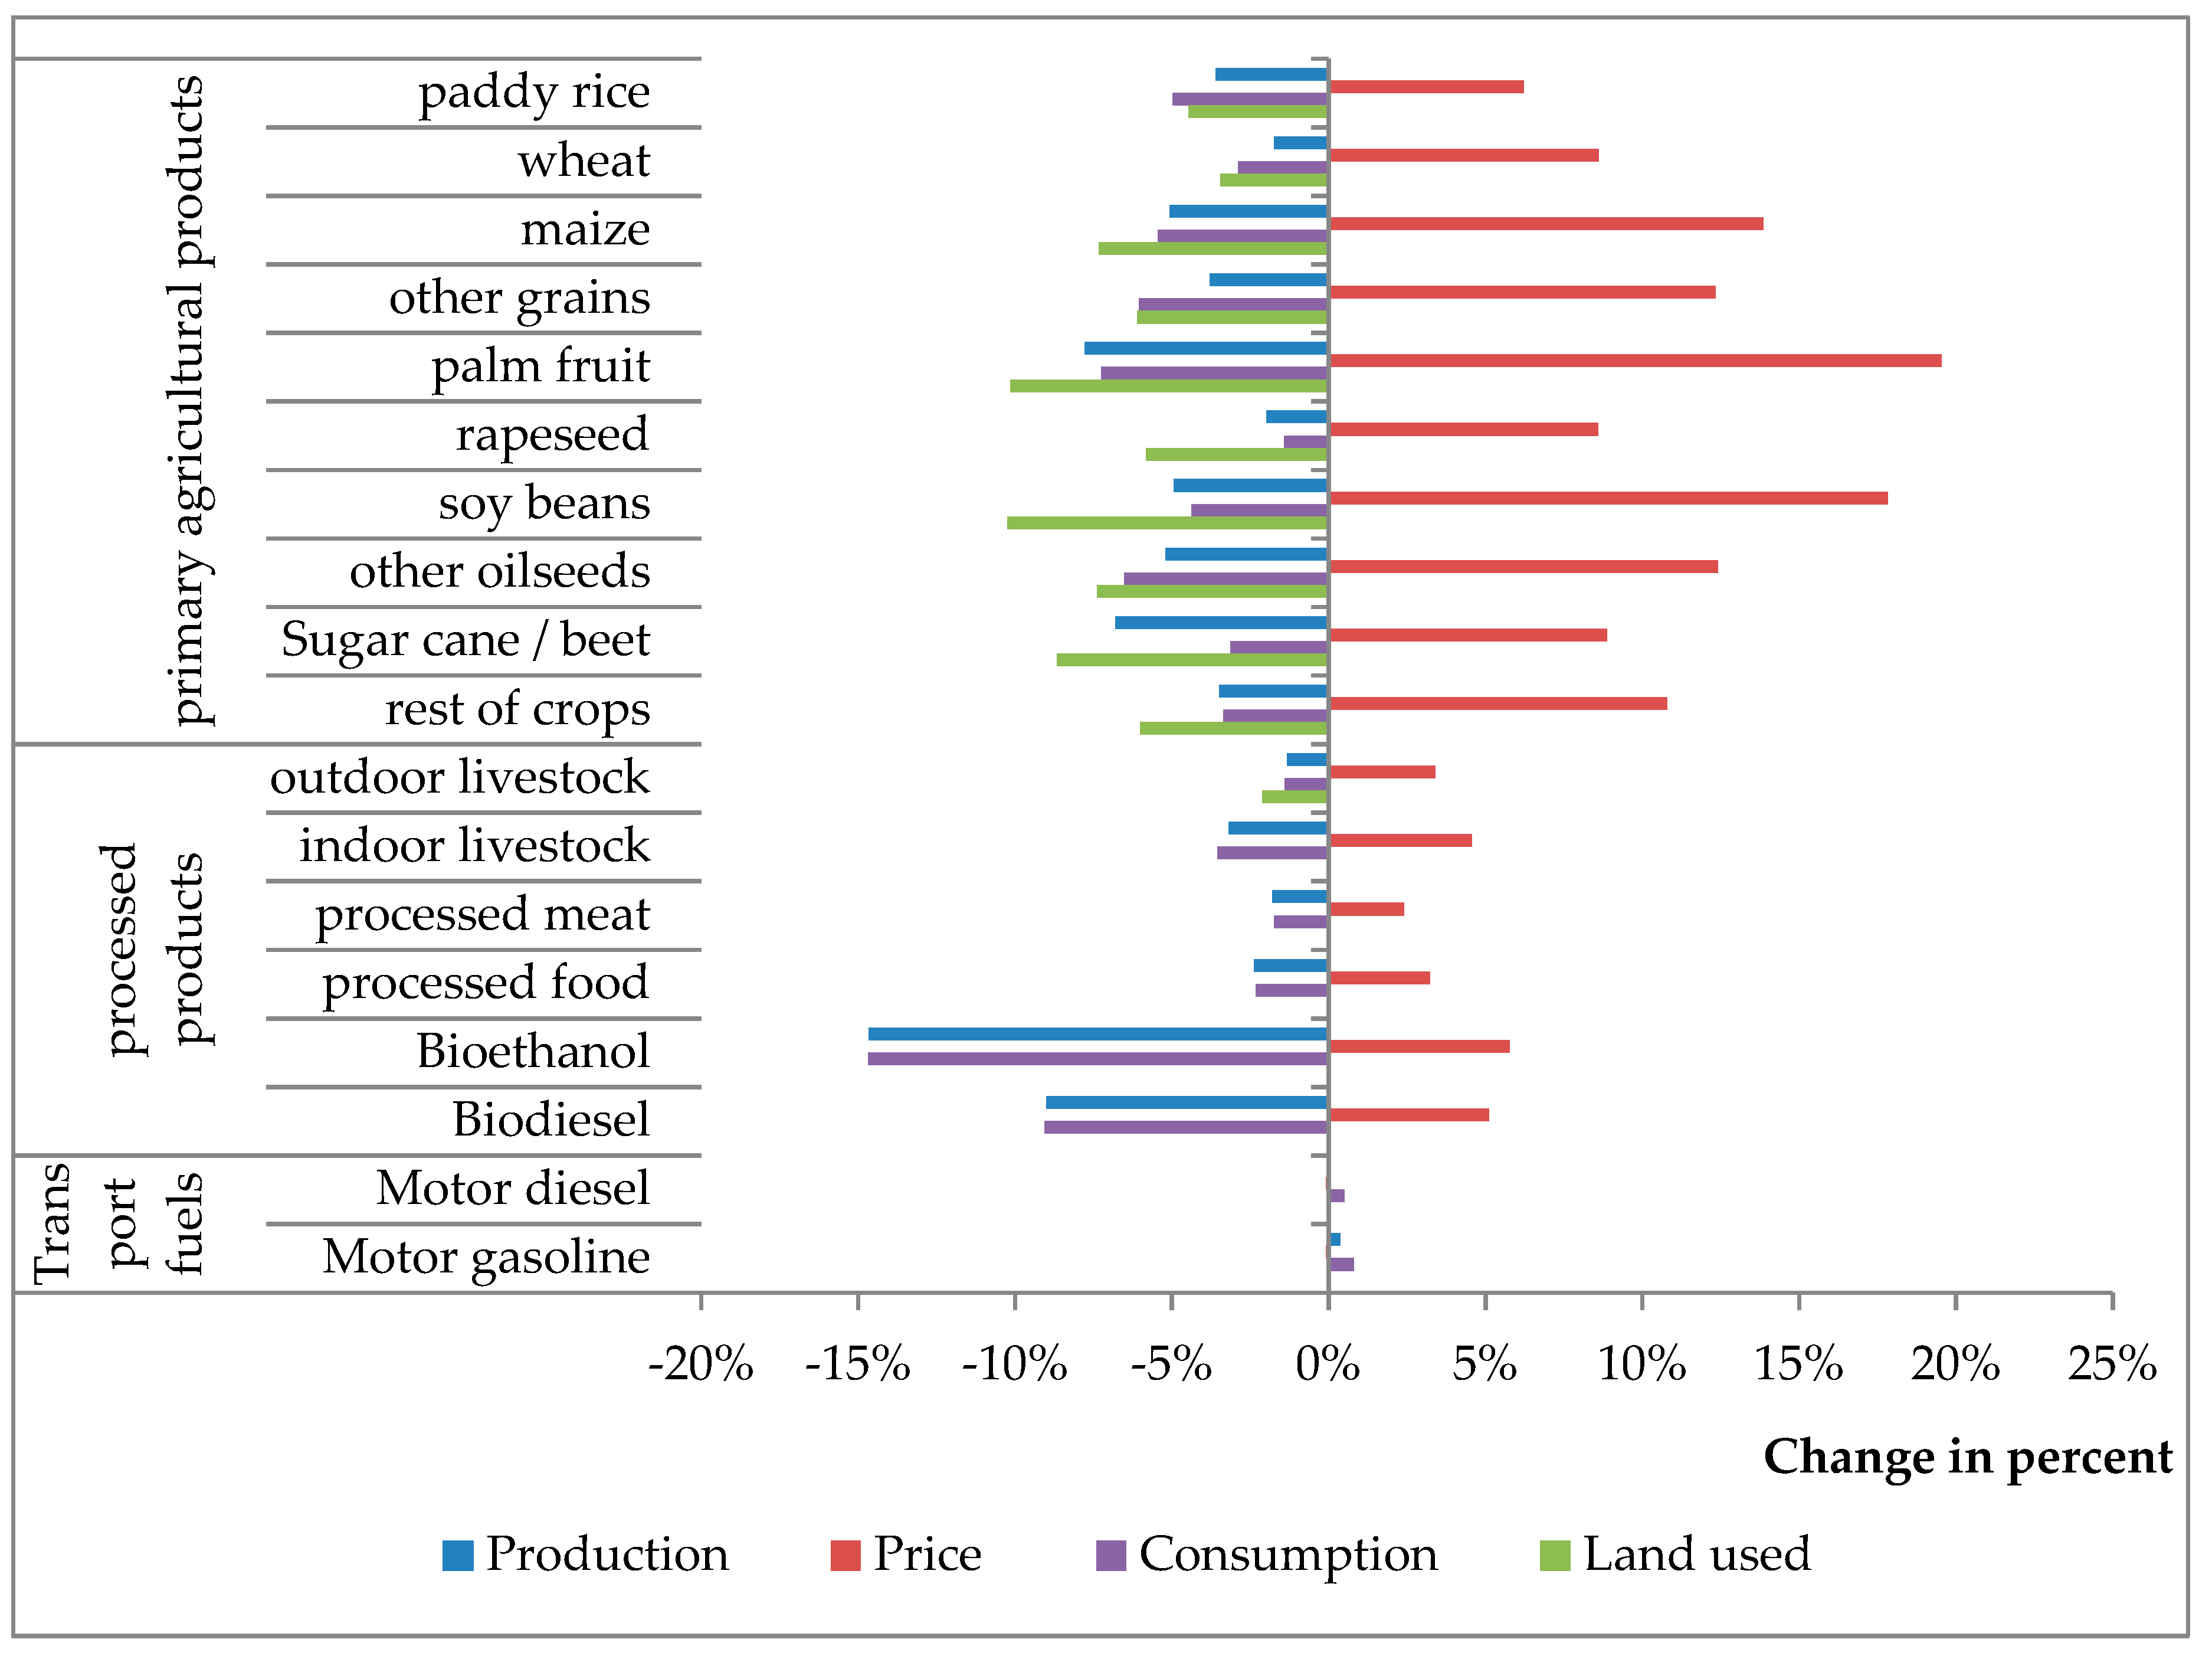
If no cropland expansion/contraction is assumed, global prices for all products using land increase as expected, due to the relative global land scarcity (Figure 12). This price increase averages 8.9% (mean of all products using land) and ranges from 2.3% (“Processed animal products”) to 19% (“Palm fruit”). The range in prices changes across crops is caused by the regional distribution of crop production combined with regionally different changes in growth rates of land expansion/contraction. Palm fruit, for instance is produced in regions with strongest incrases in land expansion under baseline conditions (South-East Asia, Malaysia/Indonesia), so when restricting cropland expansion the decrease in production is above average. Furthermore, effects are smaller for processed food products compared to crops; for processed food products there are other production factors than land, which dampen the effects of increased land prices. Biofuels are an exception to this: their production and consumption decrease stronger than that of crops (~15% for bioethanol and ~9% for biodiesel), compared to an average (over all sectors) decrease of ~5% in both production and consumption. We explain this by changes of relative prices; while prices for biofuels increase as an effect of rising land prices, prices for conventional fuels do not chage considerably between scenarios. Given a high elasticity of substition between biofules and conventional fuels, biofuels are replaced by fossil fuels if land prices increase.
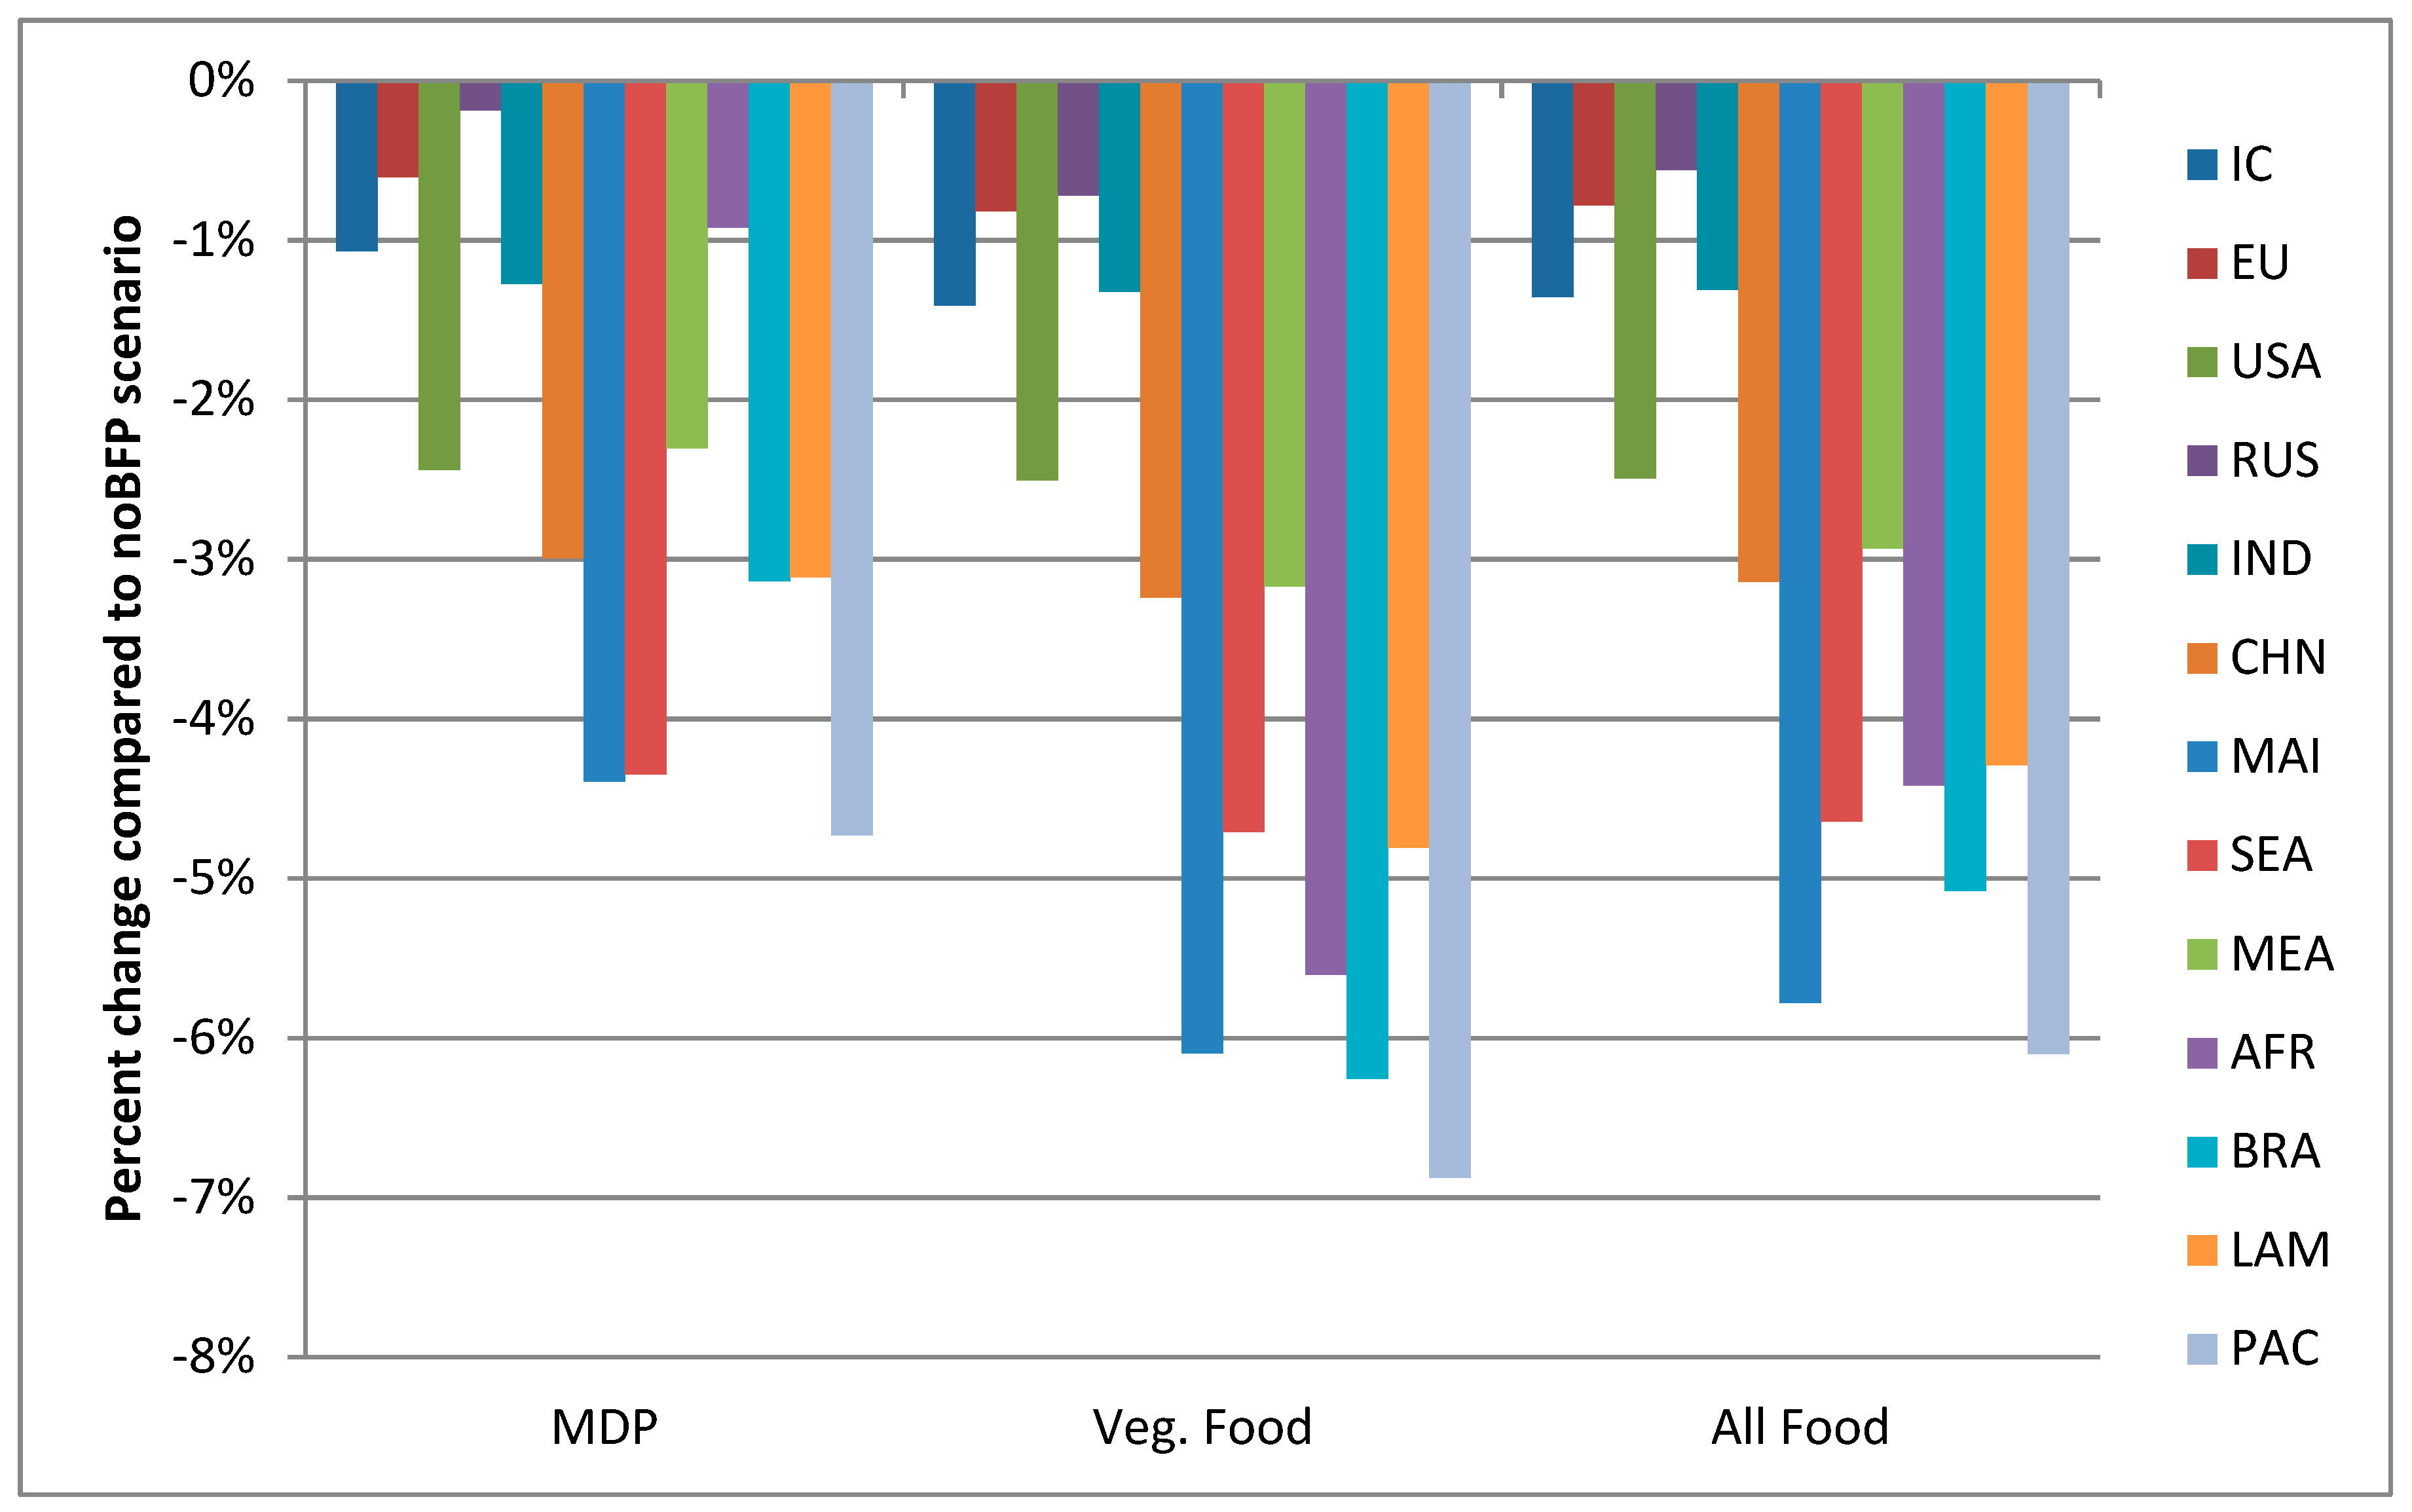
As a result of the increased land scarcity, production of both MDP and vegetarian food decrease in all regions. Changes differ across regions, since regional production of agricultural products is directly affected by the assumed cropland expansion/contraction. Prices react on the altered production, and consequently also consumption patterns adjust, with regional differences (−3.9% on average). The effects in private consumption can be dampened by adjusting net trade. In total, the industrialised countries react only marginally on the globally increased land scarcity (Figure 13). Their MDP consumption decreases by 1.1%. (Only Sub-Saharan Africa has a lower value (−0.9%)). Similarly, the consumption of vegetarian food (“Veg. Food”) decreases by 1.4%. Along with India, the aggregate of industrialised countries are the regions least affected by the altered land scarcity. There are, however, regional differences, which stem from the assumptions regarding land expansion/contraction in the other scenarios: India, Japan, Russia, and the EU are characterised by land contraction in the other scenarios, so their available cropland is increased in the NoLandExpCon scenario. On the other hand, land use is expanded in other regions of the “Industrialised countries aggregate”, for example, in the USA. Consequently, private consumption of MDP decreases stronger for the USA (−2.4%) than for the EU (−0.6%). In Russia, where in the other scenarios land contraction is more severe than for the EU (Figure 1), the effect is even smaller (−0.2%). The pattern is the same for vegetarian food, although the effect is less pronounced.
The most affected regions are those which hold large potentials for land expansion: South- and Middle America, Malaysia/Indonesia and South East Asia as well as Sub-Saharan Africa.
As mentioned above, the changes in regional availability of cropland also affect international trade (Figure 14). Sub-Saharan Africa changes from a net-exporter of vegetarian food to a net importer. Here, net-exports of crops and, to a lesser extent, MDP decrease. South America remains a big net-exporter of food products, but net-exports of all food sectors decrease. The industrialised countries aggregate is the only region where net-exports increase under the assumption of no land expansion/contraction. It benefits from the globally decreased availability of cropland as well as from the increased availability of cropland in EU, Russia and Japan. In the USA, which face a decrease in available cropland, net-exports decrease.
We obsever the strongest change on the import side for net-imports of vegetarian food in “Rest of Latin America”, where net-imports more than double (+132%) compared to the “no biofuel” scenario. This is caused by the large expansion of cropland areas which is conducted in this region in the other scenarios. Also Malaysia/Indonesia and South East Asia show a strong increase of net-imports in vegetarian food (57% and 34%, respectively). China and India are big net food importers. China has only small expansion potentials in the Baseline scenario, while in India cropland area decreases. Hence, under the NoLandExpCon scenario net-imports of food decrease in both regions.

3.5. Comparison Across Scenarios

In Figure 15 we compare in an aggregated manner changes in production, prices and land use in 2030 across scenarios. It illustrates that the ratio of changes in prices and production of crops, MDP and biofuels differs across scenarios. We find that the scenarios influencing the demand side (a tax on MDP consumption in industrialised countries and an abolishment of biofuel policies) have lower impacts on crop prices than changes on the supply side (no cropland expansion/contraction). At the same time, for the demand side changes in particular, we identify regional and product-specific adjustments that indicate that international trade and substitution is taking place to accommodate these changes in demand. Delzeit et al. [22] also find that demand shocks have smaller impacts on crop prices. Thus, our results confirm this finding, even with a significant shock (tax of up to 87.5% of product value) on the demand side.
Figure 15 also illustrates that the MDP tax impacts on biofuel markets, while biofuel policies in combination with the MDP tax have no influence on MDP markets. For the abolishment of biofuel policies compared to the tax on MDP consumption, we find smaller impacts on the prices and production of crops as well as on land use. Since the MDP market is significantly larger than the market for biofuels, policy instruments affecting production in the MDP market also result in stronger impacts on the inputs of production, namely crops for animal feeding and land use.

4. Conclusions

In summary, we conclude that when analysing biofuel policies and instruments to reduce MDP consumption simultaneously, it is important to consider complex agricultural value chains; particularly the consideration of different types of vegetable oils and the respective by-products (meals) matter when analysing policy measures.
Further, our results indicate that compared to changing preferences of consumers, a regulative policy such as a tax has a much stronger impact on consumption. While there is no tax on MDP in practice to validate our finding, we can draw on an example from Mexico: the country introduced a tax on sugar consumption in 2014, which has been found to reduce sugar consumption clearly [48].
We conclude from our study that before implementing a tax, feedback effects need to be studied. As explained in the introduction, a reduction of MDP consumption and the substitution of fossil fuels with biofuels aim to reduce greenhouse gas (GHG) emissions, while less MDP consumption is expected to reduce the pressure on land, but biofuel production might increase cropland areas. Hence, theres is a link between these policies with food security and negative environmental effects due to land use change or intensification of land use. Our paper contributes to these discussions. We show that a tax on MDP in industrialised countries results in lower food prices and higher food consumption in regions that face food insecurity. At the same time, the net effect of a MDP tax on climate change mitigation is not clear, such that further investigations with respect to demand behaviour are needed. Hence, for the question whether a combination of reduction of MDP consumption and biofuel policies is suitable to reduce GHG emissions in order to reach, for example, low emission pathways of the IPCC, our results need further analyses in the future. An alternative, possibly more suitable policy instrument might be the integration of the agricultural sector in to existing climate policies. Comparing these different options could be subject to future research.
According to our results, a MDP tax has a stronger impact on land use change than biofuel policies do. However, in order to meet low emission pathways, substantial amounts of biomass need to be mobilised for the Bioenergy and Carbon Capture and Storage (BECCS) technology [49]. This might have an even stronger impact on land use change. With respect to food production and prices, our results show that additional land endowment leads to a reduction in food prices and an increase in food production. Which assumptions to take in modelling excercises with respect to additional land endowment and endogenous land use change in the future, seems to be an important driver when simulating policy shocks that are related to land use—such as a tax on MDP or biofuel policies—and even more so BECCS.
Overall our study highlights the complexitiy of agricultural value chains. The various interlinkages between sectors, but also between political instruments, need to be taken into account carefully when analysing future policy options. The effects of such policies are not only relevant for GHG mitigation, but also, amongst others, for food security, international trade and ecology. Thus, considering the complexity and the feedback mechanisms in our models is key.

Acknowledgments

This project was supported by the German Federal Ministry of Education and Research (grant 01LL0901A: Global Assessment of Land Use Dynamics, Greenhouse Gas Emissions and Ecosystem Services—GLUES). The publication of this article was funded by the Open Access Fund of the Leibniz Association.

Author Contributions

Ruth Delzeit, Mareike Söder and Malte Winkler conceived and designed the study. Ruth Delzeit and Malte Winkler implemented the scenarios and analysed the modelling results. Ruth Delzeit, Malte Winkler and Mareike Söder wrote the paper.

Conflicts of Interest

The authors declare no conflict of interest.

Appendix A

Table A1. Starting (2018) and end (2030) values of the tax on MDP, which is adjusted to lower MDP consumption in Industrialised countries by 50% between 2017 and 2030. A value of 0.1 means that a 10% ad valorem tax is imposed on the respective sector in the respective region. For instance, an ad valorem tax of 62.5% on the production of indoor livestock is necessitated to decrease the consumption of indoor livestock in regions GER and BEN to a value smaller or equal to 50% of the consumption of indoor livestock in 2017. Both target values for consumption (i.e., how much consumption is “allowed” in each year) and values of the tax between 2018 and 2030 follow a linear trend. Note that according to GTAP8 there is no production of outdoor livestock in Scandinavia.
SectorRegion(s)2018 (Starting Value)2030 (End Value)
Indoor livestock (ILVS)GER, BEN0.10000.6250
Indoor livestock (ILVS)GBR, FRA, MED0.10000.6500
Indoor livestock (ILVS)SCA, USA, CAN0.10000.6750
Indoor livestock (ILVS)REU0.10000.7750
Indoor livestock (ILVS)ANZ0.10000.7250
Indoor livestock (ILVS)JPN0.10000.6000
Indoor livestock (ILVS)RUS0.10000.8000
Indoor livestock (ILVS)FSU0.10000.8250
Outdoor livestock (OLVS)GER, FRA, MED, USA0.10000.6500
Outdoor livestock (OLVS)GBR0.10000.6750
Outdoor livestock (OLVS)BEN0.10000.6250
Outdoor livestock (OLVS)REU0.10000.8000
Outdoor livestock (OLVS)CAN0.10000.7000
Outdoor livestock (OLVS)ANZ0.10000.7000
Outdoor livestock (OLVS)JPN0.10000.6000
Outdoor livestock (OLVS)RUS0.15000.8500
Outdoor livestock (OLVS)FSU0.15000.8750
Processed animal products (PCM)GER, JPN0.10000.6250
Processed animal products (PCM)GBR, FRA, SCA, USA0.10000.6750
Processed animal products (PCM)BEN0.10000.6500
Processed animal products (PCM)MED0.10000.7000
Processed animal products (PCM)REU0.10000.8000
Processed animal products (PCM)CAN0.10000.7000
Processed animal products (PCM)ANZ0.10000.7250
Processed animal products (PCM)RUS0.15000.8250
Processed animal products (PCM)FSU0.15000.8500

References

  1. Smith, P.; Haberl, H.; Popp, A.; Erb, K.H.; Lauk, C.; Harper, R.; Tubiello, F.N.; Pinto, A.D.S.; Jafari, M.; Sohi, S.; et al. How much land-based greenhouse gas mitigation can be achieved without compromising food security and environmental goals? Glob. Chang. Biol. 2013, 19, 2285–2302. [Google Scholar] [CrossRef] [PubMed]
  2. Foley, J.A.; Ramankutty, N.; Brauman, K.A.; Cassidy, E.S.; Gerber, J.S.; Johnston, M.; Mueller, N.D.; O’Connell, C.; Ray, D.K.; West, P.C.; et al. Solutions for a cultivated planet. Nature 2011, 478, 337–342. [Google Scholar] [CrossRef] [PubMed]
  3. Delgado, C.; Rosegrant, M.; Steinfeld, H.; Ehui, S.; Courbois, C. Livestock to 2020: The Next Food Revolution; JFAE Discussion Paper. 1999. Available online: https://www.researchgate.net/publication/5055893 (accessed on 22 December 2017).
  4. Pica-Ciamarra, U.; Otte, J. The ‘Livestock Revolution’: Rhetoric and reality. Outlook Agric. 2011, 40, 7–19. [Google Scholar] [CrossRef]
  5. Rosegrant, M.; Leach, N.; Gerpacio, R.V. Meat or wheat for the next millennium. Proc. Nutr. Soc. 1999, 58, 219–234. [Google Scholar] [CrossRef] [PubMed]
  6. Delgado, C.L. Rising consumption of meat and milk in developing countries has created a new food revolution. J. Nutr. 2003, 133, 3907S–3910S. [Google Scholar] [CrossRef] [PubMed]
  7. Bruinsma, J. The resource outlook: By how much do land, water and crop yields need to increase by 2050? In Expert Meeting on How to Feed the World in 2050, 24–26 June 2009; Food and Agriculture Organization of the United Nations (FAO): Rome, Italy, 2011. [Google Scholar]
  8. Kastner, T.; Rivas, M.J.I.; Koch, W.; Nonhebel, S. Global changes in diets and the consequences for land requirements for food. Proc. Natl. Acad. Sci. USA 2012, 109, 6868–6872. [Google Scholar] [CrossRef] [PubMed]
  9. Tilman, D.; Balzer, C.; Hill, J.; Befort, B.L. Global food demand and the sustainable intensification of agriculture. Proc. Natl. Acad. Sci. USA 2011, 108, 20260–20264. [Google Scholar] [CrossRef] [PubMed]
  10. Chum, H.; Faaij, A.; Moreira, J.; Berndes, G.; Dhamija, P.; Dong, H.; Gabrielle, B.; Eng, A.G.; Lucht, W.; Mapako, M.; et al. IPCC Special Report on Renewable Energy Sources and Climate Change Mitigation; Edenhofer, O., Pichs-Madruga, R., Sokona, Y., Seyboth, K., Matschoss, P., Kadner, S., Zwickel, T., Eickenmeier, P., Hansen, G., Schlömer, S., Eds.; Cambrige University Press: Cambridge, UK, 2011; pp. 209–332. [Google Scholar]
  11. Intergovernmental Panel on Climate Change (IPCC). Fifth Assessment Report; Cambridge University Press: Cambridge, UK, 2014. [Google Scholar]
  12. Calzadilla, A.; Delzeit, R.; Klepper, G. Assessing the Effects of Biofuel Quotas on Agricultural Markets. In World Scientific Reference on Natural Resources and Environmental Policy in the Era of Global Climate Change; World Scientific: Singapore, 2016; Volume 3, pp. 399–442. [Google Scholar]
  13. Valin, H.; Peters, D.; van den Berg, M.; Frank, S.; Havlik, P.; Forsell, N.; Hamelinck, C.; Pirker, J.; Mosnier, A.; Balkovic, J.; et al. The Land Use Change Impact of Biofuels Consumed in the EU: Quantification of Area and Greenhouse Gas Impacts; ECOFYS Netherlands B.V.: Utrecht, The Netherlands, 2015. [Google Scholar]
  14. Laborde, D.; Valin, H. Modelling Land Use Changes in a Global CGE: Assessing the EU biofuel mandates with the MIRAGE-BioF model. Clim. Chang. Econ. 2012, 3, 1250017. [Google Scholar] [CrossRef]
  15. Taheripour, F.; Hertel, T.W.; Tyner, W.E.; Beckman, J.F.; Birur, D.K. Biofuels and their by-products: Global economic and environmental implications. Biomass Bioenergy 2010, 34, 278–289. [Google Scholar] [CrossRef]
  16. Kretschmer, B.; Bowyer, C.; Buckwell, A. EU Biofuel Use and Agricultural Commodity Prices: A Review of the Evidence Base; Institute for European Environmental Policy: London, UK, 2012. [Google Scholar]
  17. Edwards, R.; Mulligan, D.; Marelli, L. Indirect Land Use Change from Increased Biofuels Demand: Comparison of Models and Results for Marginal Biofuels Production from Different Feedstocks; Joint Research Center—European Commission: Brussels, Belgium, 2010. [Google Scholar]
  18. Zhang, W.; Yu, E.; Rozelle, S.; Yan, J.; Msangi, S. The impact of biofuel growth on agriculture: Why is the range of estimated so wide? Food Policy 2013, 38, 227–239. [Google Scholar] [CrossRef]
  19. Taheripour, F.; Hertel, T.W.; Tyner, W.E. Implications of biofuels mandates for the global livestock industry: A computable general equilibrium analysis. Agric. Econ. 2011, 42, 325–342. [Google Scholar] [CrossRef]
  20. Apostolidis, C.; McLeay, F. Should we stop meating like this? Reducing meat consumption through substitution. Food Policy 2016, 65, 74–89. [Google Scholar] [CrossRef]
  21. Delzeit, R.; Schuenmann, F. Higher income and higher prices: The role of demand specifications and elasticities of livestock products for global land use. In Proceedings of the Annual Conference on Global Economic Analysis, West Lafayette, IN, USA, 7–9 June 2017. [Google Scholar]
  22. Delzeit, R.; Klepper, G.; Zabel, F.; Mauser, W. Global economic-biophysical assessment of midterm scenarios for agricultural markets—Biofuel policies, dietary patterns, cropland expansion, and productivity growth. Environ. Res. Lett. 2017. [Google Scholar] [CrossRef]
  23. Wirsenius, S.; Hedenus, F.; Mohlin, K. Greenhouse gas taxes on animal food products: Rationale, tax scheme and climate mitigation effects. Clim. Chang. 2011, 108, 159–184. [Google Scholar] [CrossRef]
  24. Säll, S.; Gren, I.-M. Effects of an environmental tax on meat and dairy consumption in Sweden. Food Policy 2015, 55, 41–53. [Google Scholar] [CrossRef]
  25. Woltjer, G.B. Meat consumption, production and land use: Model implementation and scenarios. Wettelijke Onderz. Nat. Milieu 2011, 268, 1–73. Available online: https://www.wur.nl/upload_mm/c/a/a/4195cd9a-1fb4-44a2-abac-bf8cd6d71e67_WOt-werkdocument%20268%20webversie.pdf (accessed on 22 December 2017).
  26. Springer, K. The DART General Equilibrium Model: A Technical Description. In Kiel Working Paper No. 883; Kiel Institute for the World Economy: Kiel, Germany, 1998. [Google Scholar]
  27. Springer, K. Climate Policy in a Globalizing World: A CGE Model with Capital Mobility and Trade. In Kieler Studien; Springer: Berlin, Germany, 2002. [Google Scholar]
  28. Klepper, G.; Peterson, S. Emissions Trading, CDM, JI and More—The Climate Strategy of the EU. Energy J. 2006, 27, 1–26. [Google Scholar] [CrossRef]
  29. Klepper, G.; Peterson, S. Marginal Abatement Cost Curves in General Equilibrium, The Influence of World Energy Prices. Resour. Energy Econ. 2006, 28, 1–23. [Google Scholar] [CrossRef]
  30. Weitzel, M.; Hübler, M.; Peterson, S. Fair, Optimal or Detrimental? Environmental vs. Strategic Use of Carbon-Based Border Measures. Energy Econ. 2012, 34, 198–207. [Google Scholar] [CrossRef]
  31. Hilderink, H.B.M. PHOENIX Plus: The Population User Support System Version 1.0. 2000. Available online: http://www.mnp.nl/phoenix (accessed on 15 May 2013).
  32. Stone, R. Linear Expenditure Systems and Demand Analysis: An Application to the Pattern of British Demand. Econ. J. 1954, 64, 511–527. [Google Scholar] [CrossRef]
  33. Narayanan, G.; Badri, A.; McDougall, R. Global Trade, Assistance, and Production: The GTAP 8 Data Base; Center for Global Trade Analysis: West Lafayette, IN, USA, 2012. [Google Scholar]
  34. Baldos, U.L.C.; Hertel, T.W. Development of a GTAP 8 Land Use and Land Cover Data Base for Years 2004 and 2007; GTAP Research Memorandum: West Lafayette, IN, USA, 2012; Available online: https://www.gtap.agecon.purdue.edu/resources/res_display.asp?RecordID=3967 (accessed on 22 December 2017).
  35. Hertel, T.; Golub, A.; Jones, A.; OHare, M.; Plevin, R.; Kammen, D. Effects of US Maize Ethanol on Global Land Use and Greenhouse Gas Emissions: Estimating Market-mediated Responses. BioScience 2010, 60, 223–231. [Google Scholar] [CrossRef]
  36. Bouët, A.; Dimaranan, B.V.; Valin, H. Modeling the global trade and environmental impacts of biofuel policies. In IFPRI Discussion Paper 01018; International Food Policy Institute: Washington, DC, USA, 2010. [Google Scholar]
  37. OECD/FAO. OECD-FAO Agricultural Outlook 2016–2025; OECD Publishing: Paris, France, 2016; ISBN 978-92-6-425323-0. [Google Scholar]
  38. Beurskens, L.W.M.; Hekkenberg, M.; Vethman, P. Renewable Energy Projections as Published in the National Renewable Energy Action Plans of the European Member States; Covering All 27 EU Member States; European Environmental Agency: Copenhagen, Denmark, 2011. [Google Scholar]
  39. Alexandratos, N.; Bruinsma, J. World Agriculture Towards 2030/2050: The 2012 Revision; FAO Agricultureal Development Economics Division: Rome, Italy, 2012. [Google Scholar]
  40. United Nations. Population Division of the Department of Economic and Social Affairs of the United Nations Secretariat, World Population Prospects: The 2012 Revision; United Nations: New York, NY, USA, 2012. [Google Scholar]
  41. Organisation for Economic Co-Operation and Development (OECD). OECD Environmental Outlook to 2050: The Consequences of Inaction; OECD Publishing: Paris, France, 2012. [Google Scholar]
  42. Riahi, K.; Rao, S.; Krey, V.; Cho, C.; Chirkov, V.; Fischer, G.; Kindermann, G.; Rafaj, P.; Nakicenovic, N. RCP 8.5—A scenario of comparatively high greenhouse gas emissions. Clim. Chang. 2011, 109, 33. [Google Scholar] [CrossRef]
  43. Schmitz, C.; van Meijl, H.; Kyle, P.; Nelson, G.C.; Fujimori, S.; Gurgel, A.; Havlik, P.; Heyhoe, E.; d’Croz, D.M.; Popp, A.; et al. Land use change trajectories up to 2050: Insights from a global agro-economic model comparison. Agric. Econ. 2014, 45, 69–84. [Google Scholar] [CrossRef]
  44. IFPRI. IMPACT Projections of Demand for Agricultural Products: Extended Country-Level Results for 2017 GFPR Annex IMPACT Trend 1; IFPRI: Washington, DC, USA, 2017. [Google Scholar]
  45. Henchion, M.; McCarthy, M.; Resconi, V.C.; Troy, D. Meat consumption: Trends and quality matters. Meat Sci. 2014, 98, 561–568. [Google Scholar] [CrossRef] [PubMed] [Green Version]
  46. Food and Agriculture Organization of the United Nations (FAO). Available online: http://faostat.fao.org/site/610/DesktopDefault.aspx?PageID=610#ancorFAO (accessed on 22 December 2017).
  47. Von Lampe, M.; Willenbockel, D.; Ahammad, H.; Blanc, E.; Cai, Y.; Calvin, K.; Fujimori, S.; Hasegawa, T.; Havlik, P.; Heyhoe, E.; et al. Why do global long-term scenarios for agriculture differ? An overview of the AgMIP Global Economic Model Intercomparison. Agric. Econ. 2014, 45, 3–20. [Google Scholar] [CrossRef]
  48. Colchero, M.A.; Rivera-Dommarco, J.; Popkin, B.M.; Ng, S.W. In Mexico, evidence of sustained consumer response two years after implementing a sugar-sweetened beverage tax. Health Aff. 2017, 36, 564–571. [Google Scholar] [CrossRef] [PubMed]
  49. Kato, E.; Yamagata, Y. BECCS capability of dedicated bioenergy crops under a future land-use scenario targeting net negative carbon emission. Earth’s Future 2014, 2, 421–439. [Google Scholar] [CrossRef]
Figure 1. Resulting annual growth rates of harvested area. Adapteded from [22]. © The Author(s). Published by IOP Publishing Ltd. CC BY 3.0. Abbreviations see Table 1.
Sustainability 10 00419 g001
Figure 2. Share of biofuels on transport fuel consumption in 2020. Adapted from [22]. © The Author(s). Published by IOP Publishing Ltd. CC BY 3.0. Abbreviations see Table 1.
Sustainability 10 00419 g002
Figure 3. Temporal development of global output from central sectors (aggregations according to Table 2) in the Baseline scenario.
Sustainability 10 00419 g003
Figure 4. Land use changes between 2007 and 2030 in terms of harvested area and share of total harvested area in the Baseline scenario.
Sustainability 10 00419 g004
Figure 5. Temporal development of consumption and prices for biofuels (BF), MDP, and vegetarian food in the Baseline scenario.
Sustainability 10 00419 g005
Figure 6. Global change in production, prices, consumption and land used under MDP tax scenario compared to baseline in 2030.
Sustainability 10 00419 g006
Figure 7. Global change in production, prices and consumption of energy products under the MDP tax scenario compared to baseline in 2030.
Sustainability 10 00419 g007
Figure 8. Change in private consumption of different food types under MDP tax scenario compared to baseline in 2030. Abbreviations: IC (Industrialised countries), IND (India), CHN (China), MAI (Malaysia, Indonesia), SEA (South East Asia), MEA (Middle East, North Africa), AFR (Sub-Saharan Africa), BRA (Brazil), LAM (Rest of Latin America), PAC (Paraguay, Argentina, Uruguay, Chile).
Sustainability 10 00419 g008
Figure 9. Change in net trade flows of different food types under MDP tax scenario compared to baseline in 2030.
Sustainability 10 00419 g009
Figure 10. Change in production, prices, consumption and land used in no biofuel policy scenario compared to MDP tax scenario in 2030.
Sustainability 10 00419 g010
Figure 11. Change in net trade flows of different food types under no Biofuel Policies scenario compared to MDP tax scenario in 2030.
Sustainability 10 00419 g011
Figure 12. Global change in production, prices, consumption and land used under the no land expansion/contraction scenario compared to the no biofuel scenario in 2030.
Sustainability 10 00419 g012
Figure 13. Change in private consumption of different food types under no cropland expansion scenario compared to no biofuel scenario in 2030. Abbreviations: IC (Industrialised countries), EU (European Union), USA (United States of America), RUS (Rusland), IND (India), CHN (China), MAI (Malaysia, Indonesia), SEA (South East Asia), MEA (Middle East, North Africa), AFR (Sub-Saharan Africa), BRA (Brazil), LAM (Rest of Latin America), PAC (Paraguay, Argentina, Uruguay, Chile).
Sustainability 10 00419 g013
Figure 14. Change in net trade flows of different food types under no cropland expansion scenario compared to no biofuel scenario in 2030.
Sustainability 10 00419 g014
Figure 15. Overview on changes in production, prices and land use of crops and MDP under different scenarios. MDP Tax scenario is compared to baseline in 2030; noBFP scenario is compared to MDP Tax scenario in 2030; noLandExpCon scenario is comparedto noBFP scenario in 2030.
Sustainability 10 00419 g015
Table 1. List of regions in Dynamic Applied Regional Trade CGE model (DART-BIO). Adapted from [12].
EU (7)Region in AggregationNon-EU (16)Region in Aggregation
GERGermanyIC, EU28USAUSAIC
GBRUnited Kingdom, IrelandIC, EU28CANCanadaIC
FRAFranceIC, EU28ANZAustralia, New ZealandIC
SCAFinland, Sweden, DenmarkIC, EU28JPNJapanIC
BENBelgium, Netherlands, LuxemburgIC, EU28RUSRussiaIC
MEDMediterraneanIC, EU28; IC, EU28FSURest of Former Soviet Union and EuropeIC
REURest of European UnionIC, EU28BRABrazil
PACParaguay, Argentina, Uruguay, Chile
LAMRest of Latin America
CHNChina
INDIndia
MAIMalaysia, Indonesia
SEASouth East Asia
MEAMiddle East, North Africa
AFRSub-Saharan Africa
ROWRest of the World
Table 2. List of sectors and products in DART-BIO and their aggregation. Adapted from [12].
Agricultural Related Products (29)Energy Products (13)
Aggregates “crops” and “Vegetarian food”
PDRPaddy riceCOLCoal
WHTWheatCRUOil
MZE 1MaizeGASGas
GRONOther cereal grainsMGASMotor gasoline
PLMOil Palm fruitMDIEMotor diesel
RSDRapeseedOILPetroleum and coal products
SOYSoy beanELYElectricity
OSDNOther oil seedsETHW *Bioethanol from wheat
C_BSugar cane and sugar beetETHM *Bioethanol from maize
AGROther cropsETHG *Bioethanol from other grains
ETHSBioethanol from sugar cane
Aggregate “Vegetarian food”
VOLNOther vegetable oilsAggregate “Biofuels”
SGRSugarBETHBioethanol
FODRest of foodBDIEBiodiesel
PLMoil *Palm oil
RSDoil *Rapeseed oilNon-energy products (3)
SOYoil *Soy bean oilCRPNOther chemical rubber plastic products
OSDNoil *Oil from other oil seedsETSPaper, minerals and metals
OTHOther goods and services
Aggregate “Milk and Dairy Products (MDP)”
OLVSOutdoor livestock and related animal products (cattle and other grazing animals, raw milk and wool)
ILVSIndoor livestock (swine, poultry and other animal products from indoor livestock)
PCMProcessed animal products
No aggregate
SOYmeal *Soy bean meal
OSDNmeal *Meal from other oil seeds
PLMmeal *Palm meal
RSDmeal *Rapeseed meal
FRSForestry
FRIForest related industry
DDGSw *DDGS from wheat
DDGSm *DDGS from maize
DDGSg *DDGS from other cereal grains
1 New products compared to the GTAP database are in cursive. All goods are produced by an analogous industry, except where indicated by an asterisk (*), which indicates jointly produced goods. Bioethanol and Dried Distillers Grains with Solubles (DDGS) are jointly produced by the bioethanol industry (3 types of industries); and oilseeds oil and meal are jointly produced by the vegetable oil industry (4 types of industries).
Table 3. Definition of scenarios.
ScenarioTax on MDPBiofuel PoliciesLand Expansion/Contraction
BLNOYESYES
MDPTaxYES 1YESYES
NoBFPYESNOYES
NoLandExpConYESNONO
1 Bold characters indicate that respective factors are implemented.
Table 4. Implementation of the tax on meat and dairy products (MDP), biofuel policies, and land expansion/contraction into DART-BIO.
Tax on MDPBiofuel PoliciesLand Expansion/Contraction
An exogenous tax on MDP is imposed in the industrialised countries (i.e., DART-regions GER, GBR, FRA, SCA, MED, REU, USA, CAN, ANZ, JPN, RUS, FSU, BEN) from 2018 on, such that in 2030 private MDP consumption in these countries is 50% of their respective private MDP consumption in 2017. The tax is adapted to fulfil this target in the “MDP Tax Scenario”; note that it is not adapted in the other scenarios, in order not to even out effects by adjusting the MDP tax. Consequently it is possible that in another scenario the MDP tax is implemented, but the 50% target is not met.Biofuel policies follow the path outlined in [37] and national action plans documenting the national biofuel targets (for EU member states) until 2020 [38] and remain constant thereafter. To implement the biofuel policy targets, a quota is imposed on the regional consumption (Armington aggregation) which may be met either by domestic production or by imported biofuels. In case of Brazil, we do not impose a quota on bioethanol since its production is competitive and depends on market prices.Cropland follows the path outlined in [39]: in most regions cropland expands into uncultivated areas, while in the EU, India, and Japan cropland area contracts (Figure 1).
Table 5. Summary of the main results found for each scenario.
ScenarioCompared toMain Results: Production, Prices, Consumption and Harvested AreaMain Results: International Trade
MDPTax (baseline assumptions plus tax on MDP consumption)Baseline• biodiesel and bioethanol affected differently, when different types of inputs are considered• Industrialised countries increase their net-exports of food at the expense of all other food-exporting regions
• consumption of fossil fuels increases
NoBFP (assumption of the MDPTax scenario plus abolishment of global biofuel quotas)MDPTax• consumption of biodiesel and bioethanol decreases to varying degrees (52% vs. 14%)• net-exports of crops and vegetarian food increase in the EU, and decreases in the USA
• low impact on global production and prices (crops and especially MDP)• PAC increases net-exports of vegetarian food and MDP
NoLandExpCon (assumption of the NoBFP scenario plus assumption of no exogenous land use change)NoBFP• prices of all products using land decrease, depending on their respective cultivation area and its assumed cropland expansion/contraction• regions with high potentials for cropland expansion are affected strongest and face decreasing net-exports in the food sector
• regions with high potentials for cropland expansion are affected strongest
• consumption of biofuels decrease stronger than for other processed food products

