Spatial Differences in and Influences upon the Sustainable Development Level of the Yangtze River Delta Urban Agglomeration in China

1
School of Public Administration, Dongbei University of Finance and Economics, Dalian 116025, China
2
Key Laboratory of Regional Sustainable Development Modeling, Institute of Geographic Sciences and Natural Resources Research, Chinese Academy of Sciences, Beijing 100101, China
*
Authors to whom correspondence should be addressed.
Sustainability 2018, 10(2), 411; https://doi.org/10.3390/su10020411
Submission received: 2 January 2018
/
Revised: 23 January 2018
/
Accepted: 25 January 2018
/
Published: 6 February 2018
Abstract
:Based on new data from 2006–2015, we used the entropy method and panel data regression to analyze the spatial difference and influences on the level of sustainable development within China’s Yangtze River Delta urban agglomeration. The main findings are: (1) During the 2006–2015 period, the sustainable development level of the Yangtze River Delta urban agglomeration was generally low, with 69% of its cities in a phase of low-level sustainable development; however, notable spatial variation in the levels of urban sustainable development occurred mainly along the “Hu-Ning-He-Hang-Yong development belt”, with a spatial distribution that was “high in the middle and low on all sides”. (2) The industrial structure, export dependence, and land-use efficiency all had positive impacts, whereas economic growth had a negative impact, on the sustainable development level of the Yangtze River Delta urban agglomeration. (3) For the super large city, export dependence positively impacted the urban sustainable development level; for the large city, both export dependence and land-use efficiency had a positive influence, while the regulation of government had a negative influence on the urban sustainable development level; for the medium-sized city, export dependence and land-use efficiency positively influenced the urban sustainable development level, but economic growth and the regulation by government negatively influenced it.
1. Introduction
With accelerated urbanization in China have gradually arisen accompanying problems of overpopulation, infrastructure shortage, environmental deterioration and ecological damage which can no longer be ignored. The city is a complex system composed of the economy, society and environment. During the process of urban development, the concept of sustainable development should be introduced to improve the living environment, relieve population-growth pressures, and work to guarantee coordinated development between economic activity and the eco-environment. To judge the urban sustainable development capacity properly and determine sustainable development strategies that can be implemented reasonably, quantitative evaluation and the dynamic monitoring of progress in urban sustainable development are necessary, since only through these methods can sufficiently robust data be acquired.
Urban agglomeration—the core of which is the large city—has become a kind of city–region development and spatial combination model, with increasing significance in a world of globalization and exploding information. To face the challenges of globalization, urban agglomeration participates in global urban competition, re-division of labor, and cooperation to create a strong combination of economic and social communities, by virtue of its abundant industrial clusters and economies of scale. Already, in the 21st century, the ascent of urban agglomeration has profoundly affected the international competitiveness of many countries and changed international political and economic patterns [1]. World class urban agglomerations—those found near the Atlantic in the north-eastern United States, in the North American Great Lakes region, in and around London in the United Kingdom and in Europe’s north-west metropolitan areas, and in Japan on its Pacific coast—not only constitute the core of national economic development, but they also extend the administrative boundary and have profoundly influenced the world’s economic and social development. Indeed, urban agglomerations have demonstrated increasing importance globally by becoming allocation centers of production factors, command centers of production, incubation centers of science and technology, creation centers of material wealth, and centers for exchanging new ideas. This has become the key spatial subject for a country participating in a global competition among national and transnational corporations [2].
Since the implementation of China’s Open Policy in the 1980s, the country’s east has taken the lead in social and economic development, exemplified by the gradual formation of the Yangtze River Delta urban agglomeration, with Shanghai as its center; the Pearl River Delta urban agglomeration centered on Guangzhou and Shenzhen; and the Beijing–Tianjin–Hebei urban agglomeration with Beijing and Tianjin forming its center. By accelerating economic growth in the eastern coastal areas, these urban agglomerations have stimulated the development of the national economy and have become the main form promoting the new type of urbanization [3]. The Yangtze River Delta urban agglomeration, which lies in the overlapping zone of “Belt and Road” and “the Yangtze River Economic Belt”, plays an important role in the overall opening up and modernization of China. At the same time, like most developed urbanized regions in the country, the Yangtze River Delta urban agglomeration also serves as a major platform for China to participate in international competition, and is an important engine driving social-economic development, which further develops the Yangtze River Delta [4].
In 2016, 26 cities of the Yangtze River Delta urban agglomeration produced a combined GDP of nearly 15 trillion Yuan, thus contributing 19.8% of the country’s GDP and 21.6% of its GDP growth rate. However, due to the rapid economic growth of the Yangtze River Delta urban agglomeration and the continuous promotion of urbanization, “urban disease” has emerged, such as traffic jams, environmental degradation and housing shortages, which severely hinder progress in urban sustainable development. Given the economic new normal, the topic of how to improve urban sustainable development levels in a comprehensive way by tackling these city diseases must now be considered when developing such urban agglomerations. To that end, this paper takes the Yangtze River Delta urban agglomeration as a suitable example for analyzing the spatial distribution of urban sustainable development levels and influencing factors, with the aim of offering effective suggestions for promoting the overall sustainable development of Chinese urban agglomerations in future.
2. Literature Review
In the 1980s, because of increasing concern about the negative impacts on human health, natural resources, and the environment brought about by economic development, the United Nations released the Brundtland report [5]. In the report, “sustainable development” was defined as “development that meets the needs of the present without compromising the ability of future generations to meet their own needs.” Sustainable development may also be defined as the extent of the future that human beings can predict; that is, to what extent the goods and services provided by a system can indefinitely satisfy human needs [6]. As a symbol of human civilization, the city is defined as an “artificial environment” that actually consists of natural, artificial, social environments each having both positive and negative externalities upon the city at the same time, since each respectively represents a city’s practical benefits and utility costs [7]. With rapid economic growth and the ongoing expansion of urbanization, “city diseases” represented by traffic jams, environmental degradation and the disparity in wealth between the rich and poor have emerged. Hence, sustainable development has gradually become the main focus of urbanization.
Urban sustainable development may be defined as the development pattern that is followed which will not reduce the level of welfare that can be guaranteed to local residents, while at the same time not robbing people in the neighboring area of access to such benefits [8] A sustainable city should thus have the following characteristics: first, the sum of its positive external effects is greater than the sum of its negative external effects derived from the interactions among its natural, artificial, and social environments; second, it should be beneficial to generating positive environmental and social-network externalities, while the negative impact generated by the above three environments interacting is limited to a threshold, one related to the urban environmental and spatial carrying capacity [8]; third, a sustainable city does not merely pursue equality but also seeks a broader availability to acquire foundations that are beneficial to continuously update professional foundations and unleash innovative potential.
Chapter 40 of Agenda 21 states this: “the government should introduce and develop indicators about sustainable development, and take it as a key step to provide reference for making decisions related to sustainable development” [5]. There are two main indicators currently used to measure the sustainable development level: (1) The welfare index is the average value of the human welfare and ecological welfare indexes of the World Conservation Union (WCU) and the International Development Research Center (IDRC) [9,10]. (2) The sustainable development index based on satellite imagery, for which global night-time photos are now available; this index provides important information on geographical socioeconomic status and human activities on the ground [11]. In particular, the area and intensity of artificial lighting can indirectly reflect the extent of environmental change, which is an indirect measure for estimating greenhouse gas emissions and economic productivity [12]. There is a rich literature on the study of urban sustainable development. However, relatively few studies have been conducted to build a system for objectively evaluating the sustainable development level of urban agglomerations in China. As the most economically advanced urban agglomeration in China, and one of the six major urban agglomerations in the world, the Yangtze River Delta is an ideal research target for studying China’s level of urban sustainable development. To assess this, instead of using the conventional general indicators, this paper builds up a more detailed indicator system for evaluating the urban sustainable development level. From the social, economic and environmental points of view, this paper analyzes the level of urban sustainable development to explore its spatial differentiation and associated factors in order to clarify which factors likely affect different types of cities. Based on these results, this paper makes some recommendations for future city development and planning.
3. Indexing System, Research Methods, and Data Sources
3.1. Indexing System
Based on the existing literature [13,14,15,16,17] and following three research principles (scientific, systemic, and operative), indexes of urban economic, social, and environmental dimensions were obtained to construct a comprehensive index system with which to evaluate the urban sustainable development level (Table 1).
3.2. Research Methodology
3.2.1. Entropy-Weighting Method
As an objective weighting method, the starting point of this entropy-based approach is to determine the weighting coefficient(s) according to the discrepancy between the indexes. The entropy method avoids human bias and interference in this process in order to better objectively reflect the importance of each index in the evaluation system. This paper first uses the method to determine the respective weights of the selected indicators, and then uses these to evaluate the urban economic sustainable development level, urban social development level, and urban ecological environment level of these cities within the Yangtze River Delta urban agglomeration. As a final step, the comprehensive scores of each city were calculated.
Following these steps, all data used in this paper were standardized before their analysis. This standardization included the positive transformation of indicators and making the indexes dimensionless. For negative indicators, this paper makes them positive through a reciprocal transformation. Specifically, we have:
where refers to the standardized value; refers to the original value; refers to the minimum of the data values; and refers to the maximum of the data values. When the number of indexes is , the number of objects is , and the th entropy is defined as:
where , . After calculating the th entropy, we set the entropy weight to the th evaluation index. Then, the index weights were calculated by:
where The calculation of each urban comprehensive index process can be expressed by the follow equation:
where refers to the specific city in the Yangtze River Delta urban agglomeration, and refers to the year from 2006 to 2015.
3.2.2. Panel Data Regression
Panel data track the same group of individuals over a period of time, and has both a cross-sectional dimension and a time dimension. Relying on data from either dimension individually may result in missing variables and errors. Panel data can resolve the problem of missing variables adequately and so provide more individual dynamic information. Following the literature [20,21,22], the basic form of panel regression is as follows:
where is the time-invariant individual characteristic; is time-varying explanatory variables; and is the randomly-perturbed variable.
3.3. Data Sources
Subject to the availability and accuracy of data, this paper chose the related data of 26 cities in the Yangtze River Delta urban agglomeration covering the period 2006 to 2015. Quantitative analysis of the spatial differences in, and influencing factors on, the urban sustainable development level were carried out in STATA v14.2, with their final presentation prepared in Arc GIS v10.2 software. All data used came from the China City Statistical Yearbooks (volumes 2007 to 2016).
4. Spatial Differences in the Urban Sustainable Development Level
According to the entropy-weight method, this paper computed the comprehensive scores of sustainable development level for 26 prefecture-level cities in the Yangtze River Delta (Table 2).
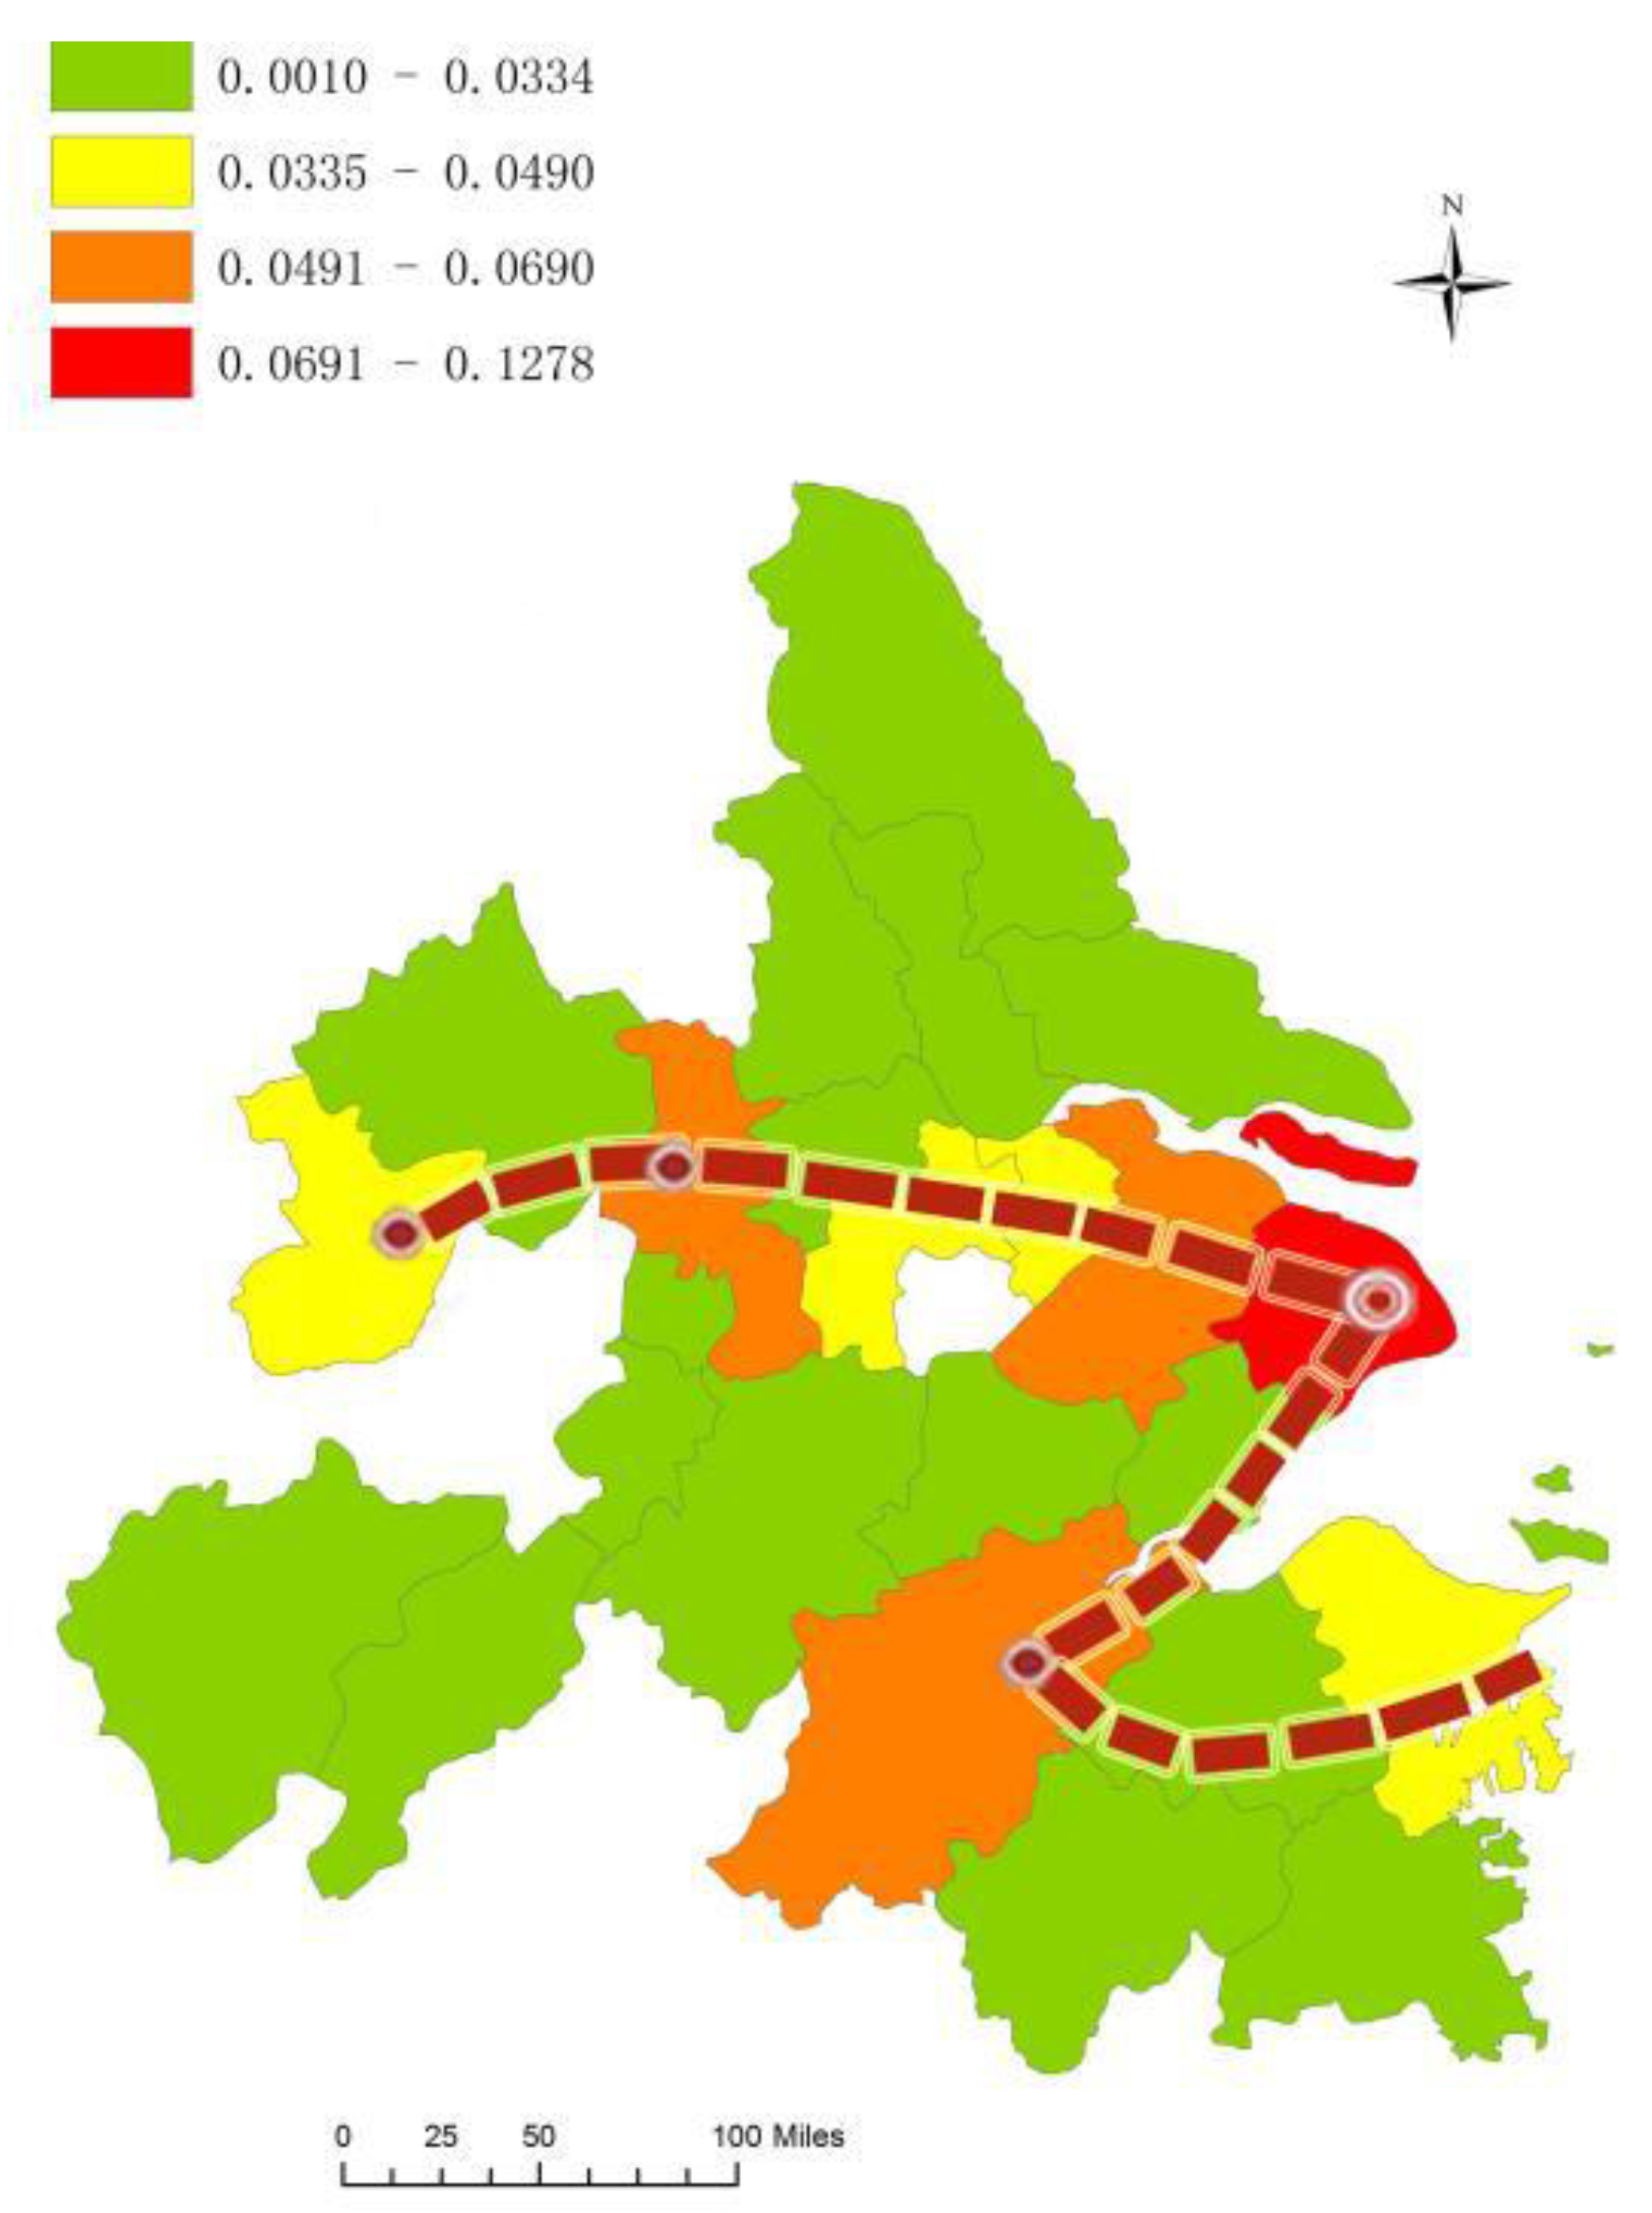
As is evident from Table 2, according to the average annual scores generated, the urban sustainable development level of the Yangtze River Delta urban agglomeration is always at a low level; these cities consistently had a mean score of 0.039, except for 2009 and 2013 when the score was 0.038. This indicates that the provision of city public services and environmental protection are not keeping pace with rapid urban economic growth, and the urban economy still follows an inefficient model. Urban development has been established such that its economic, social, and environmental sub-systems all obtain comprehensive benefits, so a benign urban ecosystem has yet to form [23]. This situation reflects the reality of the country’s development after national reform and opening up. In the hope of controlling the negative impact of this unsustainable development pattern, the Chinese government proposed the new normal policy in 2014; this pays more attention to the coordinated development of the economy and society. It is clear from Table 2 that the scores of the urban sustainable development level in most cities did increase after 2014. However, for the cities within the Yangtze River Delta urban agglomeration, its spatial distribution shows a decreasing trend from the center outwards to the periphery, along the “Hu-Ning-He-Hang-Yong development belt”. Shanghai obtained the highest score of 0.128, but Anqing, Chizhou and Chuzhou all obtained the same, lowest score of 0.024.
Based on the average scores of the urban sustainable development level in Table 2, this paper used Arc GIS software and the natural breaks method to divide the 26 cities into four phases: low-level development (0.001–0.0334); moderate-level development (0.0335–0.0490); moderately high-level development (0.0491–0.0690); and high-level development (0.0691-0.1278). Overall, in the study interval from 2006 to 2015, approximately 69% of the 26 cities within the Yangtze River Delta urban agglomeration were in the low-level sustainable urban development phase; four cities (Nanjing, Wuxi, Changzhou, Ningbo) were in the middle-level development phase (15%); three cities were in the lower high-level development phase (12%); and just one city, Shanghai, had reached the high-level development phase. Figure 1 shows the differences in the urban sustainable development level among these Chinese cities.
Shanghai scored the highest urban sustainable development level, matching its role as the economic center of China with the goal of becoming a modern international metropolitan city. As early as 2010, at the Shanghai Expo, Shanghai proposed the development concept “Better City, Better Life”. As the most developed city in China, the openness and resource agglomeration of Shanghai are far better than those of any other city within the Yangtze River Delta urban agglomeration, which provides the necessary conditions for the transformation of the development pattern. According to the latest general plan for Shanghai (2015–2040), it is poised to become a modern cosmopolitan city and center of international economy, finance, information, shipping, tourism and sci-tech innovation, and a cultural international metropolis, by 2040. In future, Shanghai will pay more attention to the coordination of urban internal development in order to achieve the goal of urban sustainable development. Serving as a transportation hub connecting the south to the north, Taizhou (Jiangsu) has a big harbor (Taizhou Port) with a designated 10,000-DWT wharf. This city also has remarkable advantages by virtue of its public transport and convenient transportation, providing superior conditions for urban sustainable development. The city of Suzhou has a state-level high-tech industrial base and also protects the ancient city sector appropriately. Perfectly preserved ancient urban buildings and a system of dikes run throughout the city to preserve natural green space, which has a significant positive influence on the sustainable development of this urban environment. As the city of mobile payments, Hangzhou transformed its industrial structure rather successfully: the proportion of GDP from tertiary industry stood at 61% in 2015, just lower than Shanghai’s 68%.
5. Influences on the Urban Sustainable Development Level
5.1. Empirical Model
Pragmatic analyses were used to obtain a clearer view of how different variables may influence the sustainable development level of the Yangtze River Delta urban agglomeration. Based on previous research [23,24,25], we derived and used levels of economic growth (Eco), industrial structure (Ind), export dependence (Exp), land-use efficiency (Lan), resource consumption (Res), and regulation by government (Gov) as explanatory variables in the following model:
where the dependent variable is the score for the urban sustainable development level; is the regression coefficient; is the intercept term, which shows the individual effect; and represent the random error (unexplained variance in ). This paper used per capita GDP, non-agricultural industry output, GDP created per square kilometer of land, the ratio of industrial output to industrial land, and the ratio of fiscal expenditures to fiscal revenue to measure the level of economic growth, industrial structure, export dependence, land-use efficiency, resource consumption, and regulation by government, respectively. This paper used the panel data regression model above to conduct the empirical analysis.
5.2. Research Results and Discussion
Table 3 shows the descriptive statistics of the dependent and independent variables. The values for VIF (variance inflation factor) were less than 2, implying that multi-collinearity among the predictors is not a problem. Additionally, the small standard deviations indicate no outliers in the data distribution.
5.2.1. Comprehensive Analysis of Factors Influencing the Urban Sustainable Development Level
Through regression, we obtained results for analyzing the main possible influences on the urban sustainable development level of those cities within the Yangtze River Delta Agglomeration.
For model I in Table 4, we can see that industrial structure, export dependence, and land-use efficiency all had a significantly (at α = 0.01) positive influence on urban sustainable development. According to the fitted model, if the ratio of industrial structure, export dependence and land-use efficiency are increased by 1%, then the urban sustainable development level will correspondingly increase by 0.0629%, 0.0118% and 0.206%; among these factors, land-use efficiency has the greatest impact. The Yangtze River Delta urban agglomeration is the most powerful in China; its non-agricultural industries play a more important role in the economic system, especially its tertiary industry, which has developed rapidly. The ratio of secondary and tertiary industrial output values to GDP are up to 47.8% and 48.4%, respectively, and the output value of tertiary industry exceeded secondary industry in 2015. The development of tertiary industry benefits mitigates industrial pollution, conserves resources and space, and improves the urban sustainable development level [26]. In 2015, Shanghai’s port ranked first globally in terms of its throughput data for international cargo and mail air transportation, at 110 million tons, 130 million tons, 30 million tons, 50 million tons, and 80 million tons more than that moved through the ports of Chicago, New York, Tokyo, Paris, and London, respectively; this clearly indicates that Shanghai is heavily involved in global production and distribution systems. (Data source available at website: http://www.toutiao.com/i6206242749337633282/. Accessed at: 13 November 2017) With the free movement of captial and a reasonable allocation of global resources, international trade not only brings considerable foreign trade revenue into China, it also introduces advanced technology and experience. By competing internationally for business, the Yangtze River Delta urban agglomeration continues to improve its efficiency and the quality of its economy. Nonetheless, land-use efficiency also exerted a significant influence on urban sustainable development of the Yangtze River Delta urban agglomeration. Since ancient times, the Yangtze River Delta region has been one of the most economically developed areas in China. How to adequately handle the conflicts between limited land resources and a dense population has always been the key problem in the progress of urban development. Improving the efficiency of land-use by promoting the industrial structure and using advanced technology can alleviate growing pressure on dwindling urban space [21,27].
As the results show, the level of economic growth had a significant (α = 0.01) negative influence on urban sustainable development. The model indicates that if the ratio of the economic level is increased by 1%, then the urban sustainable development level will decrease by 0.0115%. Our research results show that the 26 sampled cities within the Yangtze River Delta urban agglomeration still keep to the typical extensive model in the study period, and the deterioration of the urban environment is a price paid for a growing economy. In addition, because local government does not provide enough public services and infrastructure matching the economic growth rate, the provision of public services and urbanization remain out of sync, which is detrimental to improving the level of urban sustainable development [28]. Furthermore, the “city diseases” caused by traffic congestion, poverty, over-population and environmental deterioration also restrict urban development and can have serious negative influences on urban sustainable development [24]. In sum, our results point to a clear direction for the future economic development pattern of the Yangtze River Delta urban agglomeration: that is, the quality of economic growth must garner more attention than the speed and scale of it.
5.2.2. Factors Affecting the Urban Sustainable Development Level of Different Types of Cities
To more clearly analyze the factors affecting the sustainable development of different types of cities—in accordance with the State Council’s arrangement about adjusting the standard of divisions at the urban scale—this paper divided the 26 cities within the Yangtze River Delta urban agglomeration into three types: super large city (cities with a population > 5 million), large city (cities with population of 1–5 million), and medium-sized city (cities with a population 0.5–1 million). Pooled panel crossed-section regressions were then used to analyze the data of these different city types (as shown in Table 4).
The model II results in Table 4 show that for a super large city, only export dependence was a significant (α = 0.01) positive influence on its urban sustainable development level. If the ratio of export dependence increases by 1%, then the urban sustainable development level would increase by 0.432%. This indicates that the scale of foreign trade plays a crucial role in promoting the urban sustainable development level of a super large city. Since the city serves as the collection and distribution center of resources, maintaining the flow of resources is a prime condition for stimulating urban vitality. With a population exceeding 5 million inhabitants, the foreign exchange and trade of a super large city together play a pivotal role in maintaining the vitality of the economy and society. In 2016, the Yangtze River Delta urban agglomeration accounted for more than 34.6% of the total national imports and exports of China, and its foreign investment reached 51.6% of the county’s total, with the ratios increased by 0.7% and 0.3% during the study period, respectively (Data source available at website: http://www.stats.gov.cn/. Accessed at: 13 November 2017). The admirable competitiveness of the Yangtze River Delta urban agglomeration is not only an important promoter of the urban economy, but also facilitates the introduction of advanced experience from overseas super large cities’ development that emphasizes the sustainability of urbanization.
The model III results in Table 4 show that for a large city, its export dependence and land-use efficiency had a significantly (α = 0.01) positive influence on its urban sustainable development level. According to the model, increasing the ratio of export dependence and land-use efficiency by 1% will increase the urban sustainable development level by 0.212% and 0.0726%, respectively. Not unlike the scenario for a super large city, the development of large cities also depends on competing globally, with the flow and allocation of resources having a positive influence on improving the urban sustainable development level of a large city. However, unlike the fully explored and used land of a super large city, some land may be developed or re-developed inside large cities, the efficiency of which can determine how the urban sustainable development level improves. Regulation by government also had significantly (α = 0.01) negative influence on the urban sustainable development level. If the ratio of regulation of government rises by 1%, then the urban sustainable development level drops by 0.0221%. This effect agrees with reality in that the government guides the external urbanization of China. Generally speaking, China’s urbanization has been driven in a top-down manner and has taken efficiency as its aim. This means urban planning is directly managed by the government, involving a strict approval process. The struggle between the reality of urban development and a rigid management system has fostered the duality of the modern city: behind the glitter is the underdeveloped infrastructure and irrational urban planning [29]. Under the current tax-sharing fiscal system, the sources of local fiscal revenues are limited. It is not unusual, then, for the municipal government to collect fiscal capital through land business activities [30]. The unplanned exploitation of land leads to the wasteful and inefficient utilization of land resources, which will harm a city that lacks sufficient land. Thus, continued inefficient utilization of land will restrict the sustainability of urban development.
The model IV results in Table 4 show that for a medium-sized city, both its export dependence and land-use efficiency significantly (α = 0.01) and positively influenced the urban sustainable development level. According to model IV, if these two variables are increased by 1%, respectively, then the urban sustainable development level should correspondingly increase by 0.00906% and 0.0483%. This indicates that the foreign trade scale is a key promoter for the medium-sized city. Like the super large city and large city, a medium-sized city can improve its urban sustainable development level via the development of an export-oriented economy. In the development process, the exploration of land and the expansion of cities could stimulate the medium-sized city to accommodate more people immigrating from rural populations, to its benefit. Compared with the super large city and large city, the coefficient of land-use efficiency was smaller, suggesting that land resource scarcity is not prominent for a medium-sized city still possessing available unexplored land resources. More remarkably, the medium-sized city should pay more attention to reasonable urban land planning and the scientific exploitation of land resources in order to avoid future problems such as the inefficient utilization of land resources. The level of economic growth and government regulation had a significantly (α = 0.01) negative influence on the urban sustainable development level. Were these variables to increase by 1%, the corresponding urban sustainable development levels would increase by 0.00952% and 0.00287%, respectively. Hence, these results show that medium-sized cities cannot properly deal with the relations between urban economy sustainable development, urban society sustainable development and urban environment sustainable development. Economic growth is associated with the deterioration of the urban environment and social tensions [25]. But the medium-size city is still undergoing development, so its pattern of economic expansion, governmental administration and public service systems are not yet fully realized. Rapid economic growth has brought its own problems, such as the well-known population, social, and environmental issues, which eventually lead to serious city diseases that negatively impact urban sustainable development unless these concerns are resolved soon. Regulation by government does not have a positive effect on the sustainable development of medium-sized city; its problems are conspicuous, such as those of land finance and the unplanned exploration of urban land, and the policy distortion ultimately translates into irrational urban development [31,32].
6. Conclusions
This paper used econometric analytical tools, such as the entropy method and panel data regression, to evaluate the urban sustainable development level of 26 cities within the Yangtze River Delta urban agglomeration in the form of an exploratory analysis of its spatial differences as well as factors that influenced it from 2006 to 2015. The main findings of this paper are three-fold: (1) During this 10-year period, the urban sustainable development level of the Yangtze River Delta urban agglomeration was generally low, with 69% of the cities in a low-level sustainable urban development phase; yet there was notable spatial variation in the urban sustainable development level along the “Hu-Ning-He-Hang-Yong development belt”, being “high in the middle and low on all sides”. (2) As the Yangtze River Delta urban agglomeration undergoes sustainable development, its industrial structure, export dependence, and land-use efficiency exert a considerable positive influence on its cities’ urban sustainable development level, but this is negatively influenced by the growth of its economy. (3) For the super large city, export dependence has a positive impact on its urban sustainable development level, while for the large city an additional positive influence is land-use efficiency, whereas the regulation of government has a negative influence on its urban sustainable development level. For the medium-sized city, its urban sustainable development level is positively influenced by export dependence and land-use efficiency but negatively so by its economic growth and government regulation.
Acknowledgments
This work was supported by the National Natural Science Foundation of China (Grant No. 51578276).
Author Contributions
Mingdou Zhang conceived and designed the experiments; Dongqi Sun and Yu Li performed the experiments; Mingdou Zhang and Hang Xiao analyzed the data; Dongqi Sun contributed reagents/materials/analysis tools; Mingdou Zhang and Hang Xiao wrote the paper.
Conflicts of Interest
The authors declare no conflict of interest.
References
- Fang, C.; Song, J.; Lin, X. Theory and Practice of China’s Sustainable Urbanization; Science Press: Beijing, China, 2010. (In Chinese) [Google Scholar]
- United Nations. Department of Economic and Social Affairs, Population Division; World Urbanization Prospects, The 2009 Revision; United Nations: New York, NY, USA, 2010. [Google Scholar]
- Fang, C. Important progress and future direction of studies on China’s urban agglomerations. J. Geogr. Sci. 2015, 25, 1003–1024. (In Chinese) [Google Scholar] [CrossRef]
- Gu, C. Research progress and prospect of urban agglomeration. Geogr. Res. 2011, 30, 771–784. (In Chinese) [Google Scholar]
- UNCED. Agenda 21 program of action for sustainable development. In Proceedings of the United Nations Conference on Environment and Development, Rio de Janeiro, Brazil, 3–4 June 1992. [Google Scholar]
- Brundtland Report, 1987. Available online: https://en.wikipedia.org/wiki/Our_Common_Future (accessed on 4 November 2017).
- Camagni, R.; Capelloa, R.; Nijkamp, P. Towards sustainable city policy: An economy environment technology nexus. Ecol. Econ. 1998, 24, 103–118. [Google Scholar] [CrossRef]
- Nijkamp, P.; Rienstra, S.A.; Vleugel, J.M. Transportation Planning and the Future; Wiley: Hoboken, NJ, USA, 1988. [Google Scholar]
- Prescott-Allen, R. The Well-Being of Nations: A Country-by-Country Index of Quality of Life and the Environment; Island Press: Washington, DC, USA, 2001. [Google Scholar]
- Parris, T.M.; Kates, R.W. Characterizing and measuring sustainable development. Annu. Rev. Environ. Resour. Sci. 2003, 28, 559–586. [Google Scholar] [CrossRef]
- Doll, C.N.G.; Muller, J.-P.; Elvidge, C.D. Night-time imagery as a tool for global mapping of socio-economic parameters and greenhouse gas emissions. J. Hum. Environ. 2000, 29, 157–162. [Google Scholar] [CrossRef]
- Doll, C.N.G.; Muller, J.-P.; Morley, J.G. Mapping regional economic activity from night-time light satellite imagery. Ecol. Econ. 2006, 57, 75–92. [Google Scholar] [CrossRef]
- Lu, H.F.; Lan, S.F.; Li, L. Studies on energy indices for evaluating system sustainable development property. China Environ. Sci. 2002, 22, 380–384. (In Chinese) [Google Scholar]
- Lu, M. Restructuring urban system: On the strategy of sustainable regional development and urban development in China. J. Nanjing Univ. Philos. Hum. Soc. Sci. 2010, 56, 15–26. (In Chinese) [Google Scholar]
- Liu, G.Y.; Yang, Z.J.; Chen, B.; Zhang, Y.; Zhang, L.X.; Zhao, Y.W.; Jiang, M.M. Energy-based urban ecosystem health assessment: A case study of Baotou City. Acta Ecol. Sin. 2008, 28, 1720–1728. (In Chinese) [Google Scholar]
- Tran, L. An interactive method to select a set of sustainable urban development indicators. Ecol. Indic. 2016, 61, 418–427. [Google Scholar] [CrossRef]
- Pupphachai, U.; Zuidema, C. Sustainability indicators: A tool to generate learning and adaptation in sustainable urban development. Ecol. Indic. 2017, 72, 784–793. [Google Scholar] [CrossRef]
- Pájaro, M.; Alonso, A.A.; Carrillo, J.A.; Vázquez, C. Stability of stochastic gene regulatory networks using entropy methods. IFAC-PapOnLine 2016, 49, 1–5. [Google Scholar] [CrossRef]
- Ye, D.; Hai, L.; Li, N.; Li, L.; Zhao, Q. Research on comprehensive evaluation of low carbo economy development level based on AHP-Entropy method: A case study of Dalian. Energy Procedia 2016, 104, 468–474. [Google Scholar]
- Xu, H.; Kuo, S.; Li, G.; Legara, E.F.T.; Zhao, D.; Monterola, C.P. Generalized cross entropy method for estimating joint distribution from incomplete information. Phys. A Stat. Mech. Appl. 2016, 453, 162–172. [Google Scholar] [CrossRef]
- He, B.; Hong, X.; Fan, G. Block empirical likelihood for partially linear panel data models with fixed effects. Stat. Probab. Lett. 2017, 123, 128–138. [Google Scholar] [CrossRef]
- Kelejian, H.; Piras, G. Spatial Econometrics; Academic Press: Cambridge, MA, USA, 2017. [Google Scholar]
- Li, S.; Dong, G. Urban sustainable development theory and its guidance to planning practice. Urban Probl. 2006, 25, 14–20. (In Chinese) [Google Scholar]
- Deng, X.; Huang, J.; Rozelle, S.; Uchida, E. Growth, population and industrialization, and urban land expansion of China. Urban Econ. 2008, 63, 96–115. (In Chinese) [Google Scholar] [CrossRef]
- Fang, C.; Pang, B.; Liu, H. Global city size hierarchy: Spatial patterns, regional features, and implications for China. Habitat Int. 2017, 66, 149–162. [Google Scholar] [CrossRef]
- Harrison, A.; Rodriquez-Clare, A. Trade, foreign investment, and industrial policy for developing countries. Handb. Dev. Econ. 2010, 5, 4039–4214. [Google Scholar]
- Enserink, B.; Koppenjan, J. Public participation in China: Sustainable urbanization and governance. Manag. Environ. Qual. Int. J. 2007, 18, 459–474. [Google Scholar] [CrossRef]
- Cai, X.; Li, X.; Tang, Y. China’s public services and population urbanization. Chin. J. Popul. Sci. 2012, 26, 58–65, 112. [Google Scholar]
- Zhang, M.; Wang, Y. The study on transform of urbanization operation mode and convergence of income gap between urban and rural areas. Reform Econ. Syst. 2015, 30, 11–16. (In Chinese) [Google Scholar]
- Wu, Q.; Li, Y.; Yan, S. The incentives of China’s urban land finance. Land Use Policy 2015, 40, 432–442. [Google Scholar]
- Cohen, M. Monitoring and enforcement of environmental policy. Int. Yearb. Environ. Resour. Econ. 1999, 3, 44–106. [Google Scholar] [CrossRef]
- Tilt, B. The politics of industrial pollution in rural China. J. Peasant Stud. 2013, 40, 915–932. [Google Scholar] [CrossRef]
Figure 1.
The average scores of the urban sustainable development level (2006–2015) in the Yangtze River Delta urban agglomeration.
Figure 1.
The average scores of the urban sustainable development level (2006–2015) in the Yangtze River Delta urban agglomeration.

Table 1.
Comprehensive index system for assessing the urban sustainable development level.
| Sub-system | Evaluation Standard | Indicator | Weight |
|---|---|---|---|
| Urban economic sustainable development | Economy | GDP | 0.0426 |
| Fixed asset investment across the country | 0.0489 | ||
| Total retail sales | 0.0433 | ||
| Local fiscal revenues | 0.0376 | ||
| Industrial structure | Share of primary industry output in GDP | 0.0376 | |
| Share of secondary industry output in GDP | 0.0430 | ||
| Share of tertiary industry output in GDP | 0.0136 | ||
| Economic benefit | Per capita GDP | 0.0106 | |
| GDP created per square kilometer of land | 0.0149 | ||
| Outward economic factors | Foreign investment | 0.0156 | |
| Per capita foreign investment use | 0.0432 | ||
| International tourism revenues | 0.0171 | ||
| Urban social sustainable development | Quality of life | Per capita disposable income of residents | 0.0394 |
| Per capita consumption of residents | 0.0196 | ||
| Urban Engel’s coefficient | 0.0185 | ||
| Number of buses per 100,000 residents | 0.0146 | ||
| Number of hospital beds per 100,000 residents | 0.0185 | ||
| Number of doctors per 100,000 residents | 0.0174 | ||
| Progress of social civilization | Fiscal expenditure on education | 0.0137 | |
| On-campus student number of GNC | 0.0408 | ||
| Number of books per capita | 0.0493 | ||
| Ratio of “sci-tech three-cost” to financial expenditure | 0.0309 | ||
| Ratio of culture, education, science and health fees to financial expenditures | 0.0139 | ||
| Social stability index | Urban unemployment rate | 0.0145 | |
| Ratio of employment of non-agricultural industries to total employment | 0.0165 | ||
| Purchase ratio of unemployment insurance | 0.0047 | ||
| Demographic development index | Human population size | 0.0431 | |
| Population density | 0.0166 | ||
| Urban environment sustainable development | Quality of the environment | Per capita public green space | 0.0165 |
| Park green area | 0.0317 | ||
| City green coverage rate | 0.0438 | ||
| Standard discharge quantity of industrial waste water | 0.0163 | ||
| Removal quantity of industrial dust | 0.0559 | ||
| Resource utilization | Ratio of industrial waste discharge to total output value of large-scale industrial enterprises | 0.0504 | |
| Gas penetration rate | 0.0241 | ||
| Percentage of industrial solid wastes that are comprehensively utilized | 0.0043 | ||
| Treatment ratio of urban waste water | 0.0098 | ||
| Lifetime garbage treatment rate | 0.0071 |
Note: The weights were calculated by the entropy method in Section 3.2.1.
Table 2.
Comprehensive scores of urban sustainable development levels over a 10-year period.
| URB | 20.06 | 20.07 | 20.08 | 20.09 | 20.10 | 20.11 | 20.12 | 20.13 | 20.14 | 20.15 | Mean |
|---|---|---|---|---|---|---|---|---|---|---|---|
| Shanghai | 0.125 | 0.125 | 0.132 | 0.127 | 0.128 | 0.124 | 0.126 | 0.129 | 0.132 | 0.130 | 0.128 |
| Nanjing | 0.069 | 0.067 | 0.068 | 0.066 | 0.068 | 0.073 | 0.071 | 0.072 | 0.070 | 0.065 | 0.069 |
| Wuxi | 0.048 | 0.048 | 0.048 | 0.048 | 0.048 | 0.048 | 0.047 | 0.046 | 0.045 | 0.042 | 0.047 |
| Changzhou | 0.037 | 0.039 | 0.039 | 0.040 | 0.040 | 0.040 | 0.040 | 0.041 | 0.041 | 0.040 | 0.040 |
| Suzhou | 0.055 | 0.056 | 0.058 | 0.057 | 0.054 | 0.053 | 0.056 | 0.056 | 0.056 | 0.054 | 0.055 |
| Nantong | 0.032 | 0.033 | 0.033 | 0.032 | 0.033 | 0.032 | 0.032 | 0.033 | 0.033 | 0.033 | 0.033 |
| Yancheng | 0.028 | 0.028 | 0.026 | 0.028 | 0.027 | 0.028 | 0.027 | 0.024 | 0.025 | 0.027 | 0.027 |
| Yangzhou | 0.030 | 0.030 | 0.030 | 0.030 | 0.033 | 0.032 | 0.031 | 0.031 | 0.030 | 0.029 | 0.031 |
| Zhenjiang | 0.030 | 0.031 | 0.031 | 0.031 | 0.033 | 0.033 | 0.035 | 0.033 | 0.032 | 0.031 | 0.032 |
| Taizhou (Zhejiang) | 0.028 | 0.028 | 0.026 | 0.026 | 0.027 | 0.025 | 0.024 | 0.025 | 0.024 | 0.025 | 0.026 |
| Hangzhou | 0.061 | 0.062 | 0.065 | 0.065 | 0.067 | 0.064 | 0.064 | 0.065 | 0.070 | 0.071 | 0.065 |
| Jiaxing | 0.032 | 0.033 | 0.033 | 0.032 | 0.033 | 0.034 | 0.033 | 0.031 | 0.031 | 0.033 | 0.033 |
| Huzhou | 0.030 | 0.029 | 0.029 | 0.029 | 0.029 | 0.030 | 0.029 | 0.027 | 0.027 | 0.029 | 0.029 |
| Zhoushan | 0.026 | 0.025 | 0.025 | 0.027 | 0.025 | 0.024 | 0.025 | 0.022 | 0.023 | 0.024 | 0.025 |
| Jinhua | 0.031 | 0.030 | 0.031 | 0.029 | 0.027 | 0.028 | 0.027 | 0.024 | 0.024 | 0.027 | 0.028 |
| Shaoxing | 0.034 | 0.034 | 0.034 | 0.033 | 0.032 | 0.032 | 0.032 | 0.034 | 0.034 | 0.036 | 0.033 |
| Taizhou (Jiangsu) | 0.026 | 0.026 | 0.027 | 0.028 | 0.027 | 0.029 | 0.032 | 0.035 | 0.035 | 0.037 | 0.030 |
| Ningbo | 0.047 | 0.048 | 0.053 | 0.049 | 0.052 | 0.049 | 0.049 | 0.048 | 0.048 | 0.047 | 0.049 |
| Xuancheng | 0.031 | 0.029 | 0.025 | 0.028 | 0.026 | 0.027 | 0.026 | 0.027 | 0.019 | 0.021 | 0.026 |
| Chuzhou | 0.024 | 0.023 | 0.022 | 0.025 | 0.023 | 0.025 | 0.025 | 0.023 | 0.024 | 0.024 | 0.024 |
| Chizhou | 0.030 | 0.031 | 0.023 | 0.025 | 0.023 | 0.023 | 0.022 | 0.019 | 0.020 | 0.021 | 0.024 |
| Hefei | 0.037 | 0.038 | 0.040 | 0.039 | 0.041 | 0.043 | 0.042 | 0.044 | 0.047 | 0.044 | 0.042 |
| Tongling | 0.032 | 0.030 | 0.025 | 0.025 | 0.024 | 0.025 | 0.025 | 0.025 | 0.026 | 0.027 | 0.026 |
| Maanshan | 0.028 | 0.028 | 0.028 | 0.026 | 0.028 | 0.030 | 0.029 | 0.029 | 0.029 | 0.030 | 0.029 |
| Wuhu | 0.026 | 0.027 | 0.027 | 0.029 | 0.029 | 0.028 | 0.029 | 0.031 | 0.031 | 0.031 | 0.029 |
| Anqing | 0.024 | 0.024 | 0.023 | 0.025 | 0.024 | 0.023 | 0.023 | 0.024 | 0.025 | 0.025 | 0.024 |
| Mean | 0.039 | 0.039 | 0.039 | 0.038 | 0.039 | 0.039 | 0.039 | 0.038 | 0.039 | 0.039 | —— |
Table 3.
Statistical description of the variables.
| Variable | Obs. | Mean | SD | Min | Max | VIF |
|---|---|---|---|---|---|---|
| URB | 26.0 | 0.0385 | 0.0218 | 0.0191 | 0.1321 | —— |
| Eco | 26.0 | 0.7034 | 0.3618 | 0.1036 | 2.9335 | 1.91 |
| Ind | 26.0 | 0.9585 | 0.0420 | 0.7811 | 0.9966 | 1.09 |
| Exp | 26.0 | 0.1657 | 0.1723 | 0.0081 | 0.9227 | 1.11 |
| Lan | 26.0 | 0.0980 | 0.0836 | 0.0027 | 0.4949 | 1.75 |
| Res | 26.0 | 0.0380 | 0.0222 | 0.0025 | 0.1698 | 1.60 |
| Gov | 26.0 | 1.2756 | 0.3618 | 0.7115 | 2.4674 | 1.17 |
Table 4.
Regression results for the influence of six factors on urban sustainable development (URB).
Table 4.
Regression results for the influence of six factors on urban sustainable development (URB).
| Model | I | II | III | IV |
|---|---|---|---|---|
| VARIABLES | URB(G) | URB(S) | URB(L) | URB(M) |
| Eco | –0.0115 *** | 0.0137 | 0.0068 | –0.00952 *** |
| (–0.0034) | (–0.0085) | (–0.0020) | (–0.0019) | |
| Ind | 0.0629 *** | –0.5290 | 0.0193 | 0.0040 |
| (–0.0222) | (–0.5390) | (–0.0183) | (–0.0052) | |
| Exp | 0.0118 ** | 0.423 *** | 0.0212 *** | 0.00906 *** |
| (–0.0055) | (–0.0693) | (–0.0039) | (–0.0015) | |
| Lan | 0.206 *** | 0.0274 | 0.0726 *** | 0.0483 *** |
| (–0.0141) | (–0.0260) | (–0.0112) | (–0.0099) | |
| Res | –0.0044 | –0.4580 | 0.0266 | 0.0147 |
| (–0.0435) | (–0.4160) | (–0.0641) | (–0.0095) | |
| Gov | –0.0034 | 0.0747 | –0.0211 *** | –0.00287 *** |
| (–0.0031) | (–0.0439) | (–0.0035) | (–0.0008) | |
| Constant | –0.0315 | 0.4700 | 0.0303 * | 0.0272 *** |
| (–0.0225) | (–0.4950) | (–0.0173) | (–0.0055) | |
| Observations | 260 | 22 | 134 | 104 |
| R-squared | 0.576 | 0.975 | 0.664 | 0.625 |
Note: Standard errors in parentheses, *** p < 0.01, ** p < 0.05, * p < 0.1.
© 2018 by the authors. Licensee MDPI, Basel, Switzerland. This article is an open access article distributed under the terms and conditions of the Creative Commons Attribution (CC BY) license (http://creativecommons.org/licenses/by/4.0/).
Share and Cite
MDPI and ACS Style
Zhang, M.; Xiao, H.; Sun, D.; Li, Y. Spatial Differences in and Influences upon the Sustainable Development Level of the Yangtze River Delta Urban Agglomeration in China. Sustainability 2018, 10, 411. https://doi.org/10.3390/su10020411
AMA Style
Zhang M, Xiao H, Sun D, Li Y. Spatial Differences in and Influences upon the Sustainable Development Level of the Yangtze River Delta Urban Agglomeration in China. Sustainability. 2018; 10(2):411. https://doi.org/10.3390/su10020411
Chicago/Turabian StyleZhang, Mingdou, Hang Xiao, Dongqi Sun, and Yu Li. 2018. "Spatial Differences in and Influences upon the Sustainable Development Level of the Yangtze River Delta Urban Agglomeration in China" Sustainability 10, no. 2: 411. https://doi.org/10.3390/su10020411
Note that from the first issue of 2016, this journal uses article numbers instead of page numbers. See further details here.