Sustainable Tourism Planning for Taiwanese in Administrative Effects with Respect to Chinese Arrivals


1
Department of Management Sciences, Tamkang University, No. 151, Yingzhuan Rd., Danshui Dist., New Taipei City 25137, Taiwan
2
Department of Industrial Development, National Development Council, 4F, 3, Baoqing Rd., Taipei 10020, Taiwan
*
Author to whom correspondence should be addressed.
Sustainability 2018, 10(12), 4729; https://doi.org/10.3390/su10124729
Submission received: 14 November 2018
/
Revised: 6 December 2018
/
Accepted: 7 December 2018
/
Published: 12 December 2018
(This article belongs to the Section Economic and Business Aspects of Sustainability)
Abstract
:It has been a crucial achievement for most of the destinations to open up and develop a new inbound market, which means a great opportunity to increase the arrivals and economic benefits. The mighty Chinese outbound market is a welcomed resource but not always the assurance of the economics growth and industries’ profits. While foreseeing the excessive arrivals and low-price groups are harmful to the tourism business and society, the criticism and negative impression shall be prevented in advance. With the considerations of sustainable tourism and a good relationship with China, Taiwan has established a comprehensive administrative tourism mechanism on receptions of travel agencies. The unique mechanism was designed to foster the healthy business models, to construct the win-win political and economic situations, and to ease the possible impacts. By applying the Importance–Performance Analysis, this study reveals the administrative direction that needs to be revised. Among these control requests, the reasonable group fee is the key to fitting the anticipation of receptions of travel agencies. This study further proposes the Importance–Support Analysis and Importance–Performance–Support Analysis frames to enhance the validity of the Importance.
1. Introduction
For the purpose of insuring the travel safety and service quality for Chinese tourists, and to take precautions against the illegal immigration, China implements the “Approved Destination Status” (ADS) to confine the approved travel destinations through the bilateral agreements. Some of the travel hosts respond with administrative approaches accordingly to manage the number of arrivals and service requirements [1,2]. Taiwan was listed as the 93th approved destination of the status in 2008. Even coping with daily approving quota, the Chinese arrivals to Taiwan soared to 3,987,152 in 2014. It occupied 40.23% of the total inbound arrivals the same year and approximated those of other Asia-Pacific destinations (the year was approved: Thailand, 1998; Malaysia and Singapore, 1990; Korea, 1998; Japan, 2000). According to the statistics revealed by the National Tourism Administration and Tourism Academy, China, the number of Taiwan tourists to China has a general uptrend. For instance, the numbers are 4386 thousand and 5366 thousand in 2008 and 2014, respectively, and then 5870 thousand in 2017 [3]. However, the market of Taiwan residents to visit China was developed for a period of time. It was relatively mature since it was enforced in 1987. Comparing to the tourism scale in China, the reception capacity is limited in Taiwan. While facing the enormous resource of China tourists, Taiwan has to elaborate appropriate measures and administration along with this open policy and to ensure tourism sustainability and prosperity.
This policy was not only a milestone but also an impact on China, Taiwan and neighbor destinations. To examine a full picture of the influence, the discussions are far beyond a point of view of tourism destination development. It is inevitably toward construction of a comprehensive administration frame. Related to politics, economics, society, region competition and tourism industry structure, these debates are intricate and have elicited advantages and disadvantages disputes toward this policy. These viewpoints show that the characteristic of this policy is a dedicated strategy to balance the sensitive politics, economics and society circumstances and then to prosper tourism. When valuing the effects of these administrative approaches, the gain and loss of each circumstance and the prospects from the reception travel agencies are vital factors of success.
First, tourism has been regarded as a thermometer of the relationship across the Strait. The optimistic opportunities can be a frontier of further cooperation without politics involved. However, the tourism policy cannot be separated from political issues in Taiwan. It is the equally important and examined unavoidably along with other issues. While overheated Chinese arrivals are recognized as a compromise of China’s manipulation, the shrinking arrivals are then interpreted as China’s scheme of mistrust message. The attitudes of China and Taiwan demonstrate the managing and supportive forces and the cooperative possibility as well. With the specialty and the intensive close attention, the Chinese inbound issue is beyond the economics discussion.
The core economic benefit of the tourism is to propel the multiplier effect, and then to upgrade the living quality. In Taiwan’s position, it also can urge the collaboration with China and the increase the range of visibility. The booming Chinese arrivals indeed contribute to noticeable share of visitor expenditures. From 2008 to 2014, Taiwan gained US$26.63 billion tourism receipts from Chinese tourists, with US$14.65 billion from the group tours. The economic credit was criticized for its downward trend of average expenditures per person per day. The highest figure of the total Chinese tourists was US$270.31 in 2011, and then decreased yearly to US$241.98 in 2014. The figure of the group tours slightly fluctuated along the average of US$265.86. In other words, the increased yearly total visitor expenditures mainly come from the growth of the number of arrivals rather than the actual consuming power. The other negative impact is the fierce price competition. The Chinese group tourist is the main component, which occupied 51.99% of the whole Chinese inbound arrivals. The reception travel agencies tried to construct the scale economy and then dominate the market by gathering a great quantity of Chinese tourists. The competition soon conducted a price war and therefore the profits and service were meagre. The reception travel agencies had to canvass the shopping or activity which violates the regulations in order to make up the cost gap. The uniform products for groups are familiar as superficial and only for specific businesses.
On the society level, the misbehaviors of Chinese have been focused and exaggerated. For the inaccessible reason, Taiwan has been an aspiring and welcomed tourism destination for Chinese. Originating from similar culture and language, the customs and attitudes of two sides somehow are different. Through these social visits, both societies have more understanding and toleration, even though the complaints and dislike arose high toward the situations of overcrowded scenic attractions. Residents and domestic tourists do not classify that into a common phenomenon of popular scenic attractions, but ascribe it to the Chinese tourists and malfunctioning management upon them.
Taiwan’s policy to join the competition has influenced the Asian region. The group fees for Chinese travelling to Asian destinations are close-fought, and their geographic distances are similar. Even with the distinguishing culture backgrounds, the promotion and quality of the products are key factors in having advantages. Taiwan’s image has been a curious and desirable destination to Chinese for the historical entanglement. Taiwan is benefited from that, in order to yield twice the promotion result with half the effort. On the opposite side, the quota control has been recognized as a retrograde mechanism to push the tourists to other competitors.
In view of the healthy tourism industries, the conservative group products cannot add the tourism value. While the market is full of the low-price products, the receptions of travel agencies then lack the negotiating power of the price. The business model is therefore not a solid profitable model. The transferred group fee and number of customers mainly dominate the profit of the reception travel agencies. When examining this service supply chain, the structure is a combination of origin and the host. The quality is represented all the way from the grouping through the end of the journey. The distribution of cost and profit between the origin and the host directly causes the formation of the product and service. Unfortunately, the inadequate group fees delivered to the receptions of travel agencies are strangling their innovation and vitality. For the purposes of sustainable tourism and diminishing the tourists’ complaint, the healthy business model is vital for tourism administrative issues.
Tourism development has become one of the most important policies in Taiwan. The arrivals goal and the economic influx are equally important. The policy of opening the market to China is a cautious progression weighing the pros and cons of quantity/quality, benefits/sustainable and development/impact in many levels. Facing an enormous and potential market like China, a comprehensive administrative mechanism needs to be established in advance. This study reveals the prospects toward the administrative approaches from the receptions of travel agencies in Taiwan. Results from an importance–performance approach revealed the differences between the policy objective and agencies’ anticipation. It not only provided corrective suggestions but also proposed supportive points to validity of importance. The importance–support analysis (ISA) and importance–performance–support analysis (IPSA), which are derived from the added scale, are useful quantity tools for efficiency enhancement.
2. Literature Review
The policy of opening the market to Chinese tourists not only increases a largest source of tourism to Taiwan, but also increases interaction and understanding, and prompts Taiwan’s tourism to promote its economic benefits [4]. With Taiwanese hosts, and Taiwanese hosts’ alienation, tourists from China appreciate Taiwanese for their manners and kindness [5]. Taiwan and China originate from the same culture, but the Chinese characters in Taiwan remain traditional, which is a Chinese symbol for root. There are renowned writers noted for their literary works as well. The results of an importance–performance analysis (IPA) survey was one of the advantages which allured Chinese visitors to Taiwan [6]. Taiwan and China share a similar cultural background based on geographic proximity, social capital, religion, and linguistic commonality [7,8]. The accessibility and expenditure were also essential factors. Taiwan is within a few hours’ flight distance and has a similar cultural orientation to China [9]. Geographical proximity, and abundant shopping and dining opportunities for inexpensive quality products in Taiwan are tourism images and strategies for China tourists [10]. Chen [11] suggested Taiwan could create a niche cruise tourism industry in Asia, and also suggested an important aspect, based on which the analysis subject should reach the mature phase while applying the IPA method to avoid a deviation in the result.
The enthusiastic points of exploring new inbound resources focus on the direct and apparent benefits. The destinations can have apparent short-term arrivals growth and the increase of visitors spending and business opportunities [12,13,14,15,16]. In favor of the improvements of the facility, infrastructure and employment rate, the tourism development is also conducive to establishment of a circumspect tourism service supply chain [17,18,19,20,21]. The visitor expenditures collected from the consumption of inbound tourists can eventually support the governmental finance and exchequer [19,22].
The concerns on fast-growing numbers are also arguing the sabotage of quality of life (QoL) [16,22,23,24]. When discussing the social influences caused by tourism growth, some researches reported the optimistic and positive relationship between QoL and tourism [15,25,26,27]. Nevertheless, there are evidences damaging the QoL along with the opening market for Chinese. Hong Kong revoked the confinements on Chinese group tours in 2002 and then announced the Individual Visit Scheme in 2003. With the fostering of untied policies, the visited spots were more popularized and the spending per Chinese person was booming. The consumed souvenirs were diversified thereafter. The complaints of overwhelming Chinese tourists and disastrous travel experience have brought negative image and repercussion [28]. The environmental/social disadvantages and cultural/habitual conflicts accompanying the tourism growth has been a serious dilemma while opening a new market to China.
Tourism is a confirmative approach to encouraging the interactions between tourists and residences at an appropriate visitor scale [29,30,31]. The tolerance soon declines and the prosperity becomes a burden after the tipping point [18]. When the origin and the host negotiate the wide open market for the commensurate profits for both sides, the internal safety of the host is exposed [32]. There are researches that agree that the visa control is one of the effective approaches to constraining the excessive Chinese outbound market [33,34,35,36,37]. Another argument about the open policy is the concept of market access management, which has a positive correlation with tourism competitiveness [38]. The market access concept is beyond the practical distance. It is an attractive ability that connects the travel demand [39,40]. For those destinations implementing the VisaScreen, the purposes are to fulfil other latent administrative intentions besides illegal immigration [41,42]. When applying the market access concept to the VisaScreen, the unduly limitation will be a curb to the number of arrivals [32,43,44]. It may trigger more demands [42].
The tourism policy-making process can be top-bottom for the purpose of administration tourism, or bottom-up for incorporating the stands of tourism industries. The China tourism policy study by Wang [45] found that the socioeconomic environments [46], the frame and the relationship of tourism associations, the coordination within the agency, the opinions of tourism industries and employees, the pressure and interest groups related to tourists and residences [47] are factors in deciding the direction of tourism policy. With multiple considerations, the tourism policy-making process is a negotiation process, which is divided into three steps. (1) After counselling and studying the suggestions from the pressure and interest groups, the government dominates the direction of the policy. (2) The government is to intervene in the conflicts among the pressure and interest groups, and to construct an overall advantage. (3) The pressure and interest groups participate in the leadership and democratic process with finance, sanction and society resources, in order to sway the direction of policy [48,49].
3. Importance–Performance Analysis (IPA)
Taiwan has enforced comprehensive administrations for a healthy market on receptions of Chinese travel agencies. This study argued the credits of these confinements and requests on tourism industries and its development. By presenting the results of the differences of IPA, the suggestions from the receptions of travel agencies to the government can be achieved.
3.1. The Importance of IPA
First introduced by Martilla and James [50], the IPA is a useful diagnostic instrument [51,52]. It is a technique for identifying and improving the priorities [53]. According to the analysis results, the decision-maker can therefore make the most of the limited resources effectively [54] and adjust the strategies for better implemental effects and relative competitiveness [55]. For the concise characteristic, the IPA was widely applied on Tourism Destination Competitiveness (TDC) to derive mighty strategies from the advantages [56].
IPA is a two-dimensional plot constituted by importance and performance scales to demonstrate the priorities of the analyzed items (Figure 1). Van and Immerwahr [57] explained the items scattered on dimension I are important and well-performed. When illustrated as government services, the items on dimension I are services that correspond with the public demands. On the opposite, the items on dimension III are less important and less performed. The performance of the relatively insignificant services can be increased by casting more efforts for the more public satisfaction, but the feedbacks are small. However, the critical dimension IV, which is the important items, is neglected. For a better allocation of the resources, the strategies, the tack and the strength need to be re-examined for these services. The services scattered on dimension II are not indispensable. These services have high performance but are not appreciated by the public. The credits imply the endeavor with potential problems, such as misallocation of resources or over-rectification on these items. The scattering plot of IPA can demonstrate the differences between governmental decision-makers and the public, and the items needed to be improved. In order to present the useful information to decision-makers, the validities of importance and performance are cautious.
3.2. The Application on Tourism
IPA provides a quantitative, solid, theoretical and concise approach to case analyses for tourism researchers [58]. This technique illustrates the merits and drawbacks of tourism products, services, and the competitions within industries or destinations [59,60,61], especially for these familiar with studies of leisure industries and tourism brands [62,63,64]. It also introduces the analysis of development and location of destinations [65,66], and the connections between business and tourism [60].
3.3. The Confirmation of Validity
The objectives of the researches decide the origin of the coordinates, either data-centered or scale-centered. A common criticism of IPA is the unpersuasive validity and reliability attributing to flaw research processes. The IPA is convincing with a concrete and professional domain knowledge and operational definition [56]. Nevertheless, Tarrant and Smith [67] stressed the absence of statistical validity or reliability on projection would lead to untruthful analysis consequentially. Such negligence was observed in some tourism researches [68]. These applications of IPA were queried for an error of validity caused by the attributes-oriented explanation of importance [69,70].
There are conceptive and measuring perspectives to confirm the validity of importance. The straight narration is the most popular and instinctive approach. It is also the main stream in the public survey guidance [71]. A lot of researches have realized the importance of consumer behaviors cannot explain the consumer satisfaction or their behavior changes [72,73,74,75,76]. The consumers are reluctant, or not aware, to express their inner motives and favors [72]. In a similar situation, the importance of public administration is measured by the satisfaction of stakeholders reflected from their complaints or commitments [77,78]. To avoid the arbitrariness of straight narration, there are more researches to provide useful designing, collective, and evaluative information for the government, decision-makers and citizens by combining other skills with IPA to present the relationship between importance and performance. Van and Immerwahr [57] constructed an entire performance regression model with independent performance of indexes. Even if the study contributed a supplement to the IPA without extra cost of new survey or redundant questionnaire, the premise of a regression model was fulfilled and the results of the study remained differences to real situation.
3.4. Introducing the Support Dimension to IPA
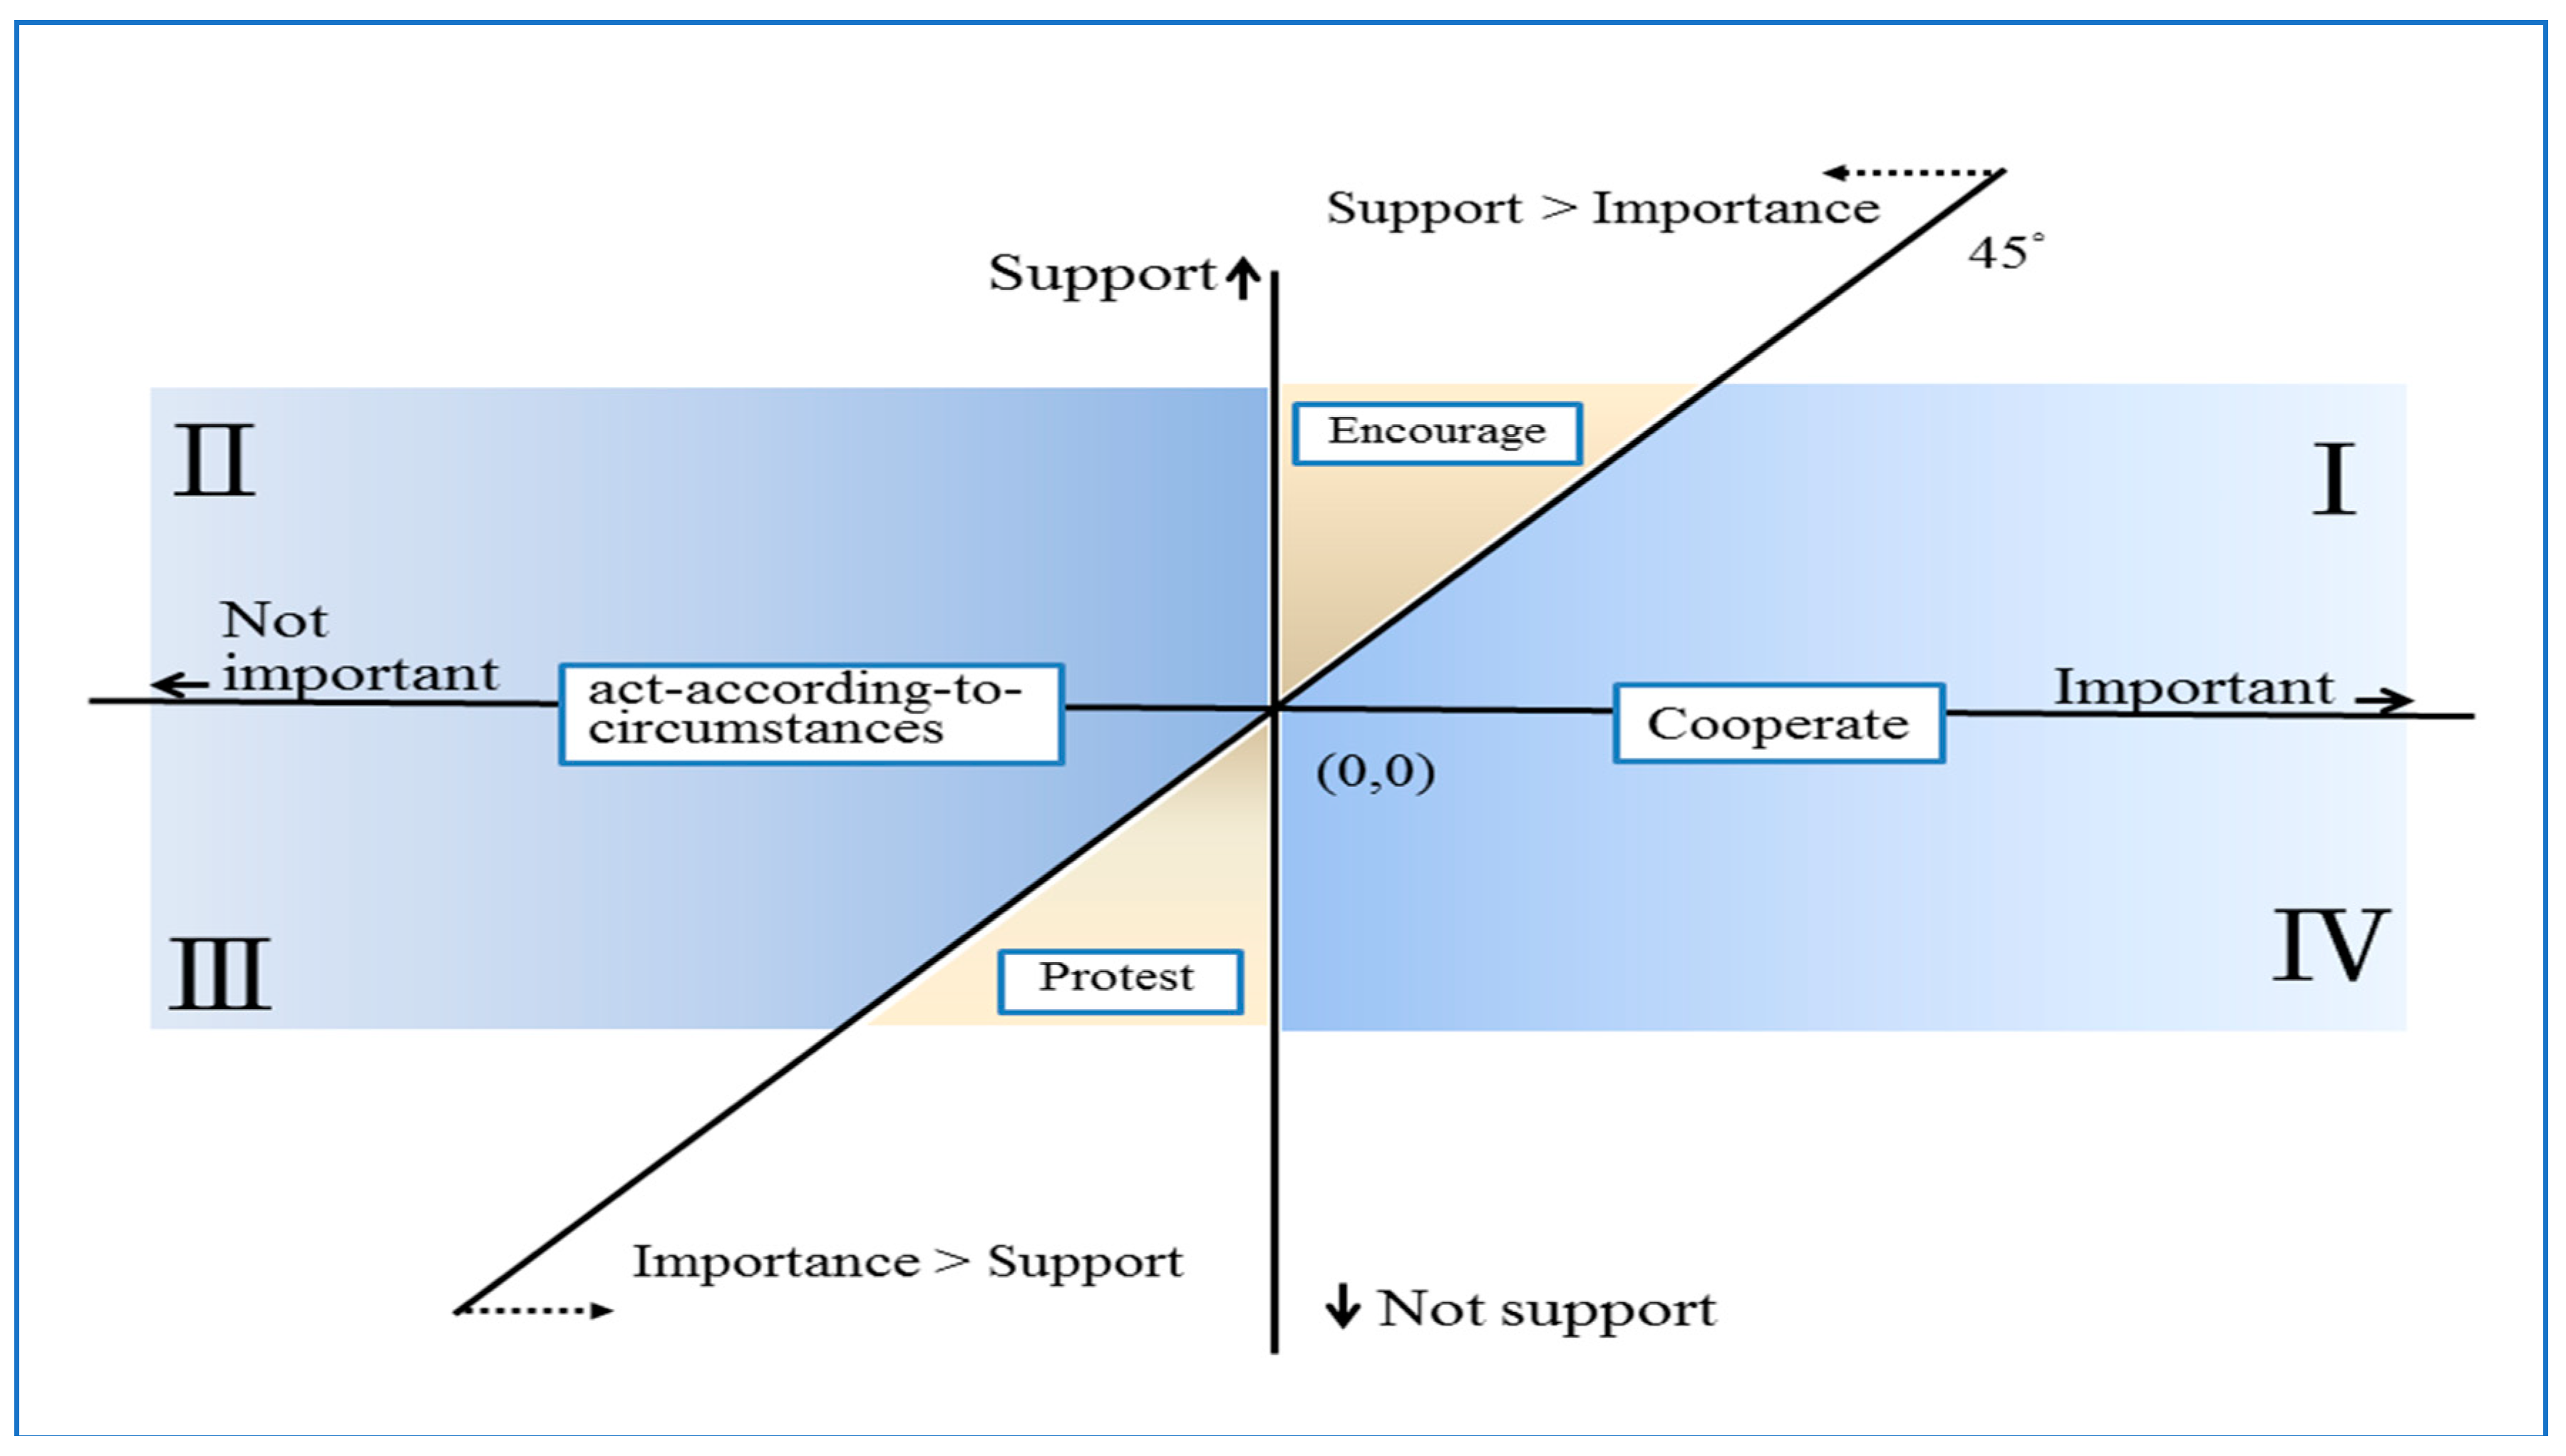
We can comprehend the degree of importance and performance via IPA. While discussing the validity of importance, a support attitude from the travel agency can demonstrate the identification and confirm the response of importance. This study introduces the ISA and IPSA by incorporating the support dimension to endorse the importance dimension. There are two assumptions we propose:
- Without the external interference, the degree of support from travel agencies in administrative policy is extremely similar to the degree of importance they value.
- The degree of external interference is the deviating distance of support from the importance.
According to the first assumption, the correlation of support and importance from the travel agencies equals to 1, which is a 45° line that passes through the origin of importance–support coordinates. The travel agencies value the importance based on the benefits for themselves or for the market. The more beneficial approach gains more support. The straight and perfunctory narration on importance can be rechecked by their support. To achieve the purpose of examination, the questions will be designed carefully to avoid the answer of support prejudiced by the importance.
The second assumption illustrates the measurement of external interference. The condition of travel agencies themselves or the socioeconomic environment will have their supportive attitude deviate from importance. An importance–support (IS) plot with the same origin as that of IPA can confirm the validity of importance and measure the external interference.
In the IS plot, we accomplished attitudes that the travel agencies toward the administrative policy. The travel agencies will fight for the items that scatter in both the important area (dimensions I and IV) and the region of support > importance. These items that are highly beneficial to agencies and industry are encouraged. For those items in the important area but with less support, the travel agencies will assess the necessity of the market and choose to cooperate even if there are external interferences to reduce their support.
The items scattered in the unimportant area (dimensions II and III) are considered less priority. The passive attitudes of travel agencies accompany criticism and complaint. In the region of support > importance, the agencies comply with dissatisfaction, and the authority shall expect an act-according-to-circumstances response rather than a self-regulating consequence. The most reluctant situation is in the unimportant and nonsupportive areas. The travel agencies will protest against the unreasonable items, or lobby the legislatives to deter the process from implements. In view of the backlash, the authority shall deliberate every detail and process, deal sincerely and fairly to strive for the understanding of industry, and ponder the necessity of the administration (Figure 2).
4. The Administrations on Chinese Inbound Market
Among 3,393,346 Chinese tourists who travelled to Taiwan for pleasure purposes in 2014, the number of group tourists was 2,002,655. The number of pleasure purpose went up to 3,437,425 in 2015. Even if it was influenced by the frigid interactions and declined to 2,845,547 and 2,093,548 in 2016 and 2017, respectively, China has remained the largest inbound resource for Taiwan in recent years. A tourism mechanism was implemented towards the receptions of travel agencies and the inbound market for administrative purposes. To have a complete picture of administrations designed by Taiwan authorities, the original intention and the consequential mechanism are introduced from Section 4.1, Section 4.2, Section 4.3, Section 4.4 and Section 4.5. Then, the result and the feedback of a survey, which was conducted on receptions of travel agencies, are illustrated in Section 5.1.
4.1. Quota to Total Quantity Control (TQC)
The total quantity control (TQC) on Chinese group arrivals and receptions of travel agencies is above all the administrative items. Beyond regular examination, an average quota of visa applications per day on Chinese group arrivals is enforced under the considerations, such as reception quality, capabilities of scenic spots, business order and structure, the cross-border transportation, social acceptancy, and the managing manpower. As part of the examining processes, this control is for the purposes of balancing the year-round arrivals and avoiding momentary excessive arrivals simultaneously. The average quota per day was 1000 persons in 2002, then gradually increased to 3000 persons in 2008 (July), 4000 persons in 2011, and 5000 persons in 2013 (April).
However, the receptions of travel agencies were apprehensive of the quota for not making the most of the potential group demands. With a flexible remedy of recruiting the daily surplus to high season from July 2008 to April 2013, the quota was accused of existing in name only. The historical high record was 11,144 group arrivals on 18 April 2012, which was 2.786 times than the quota. The living and travel quality were demoted when these were scrambles for tour buses and accommodations, and huge crowds of Chinese groups. In view of the shortcomings, the elastic adjustment then was applied as little as possible.
The visa control possibly has the tourists choose other destinations, and therefore lessens the market access. The receptions of travel agencies are liable for the loss of the visa application failure or an altered or hurried schedule caused by visa delay. In 2015, the waiting time to get visa for Chinese was about one month. Even the group travel agencies in China expressed the uncertainty was a threat for it and had driven the tourists to head to other destinations. On the opposite, Taiwan considered the destination could be a buyer’s market by exploiting the waiting phenomenon. It is an opportunity to select high-quality tourists. The success of the “hunger marketing” depends on the great demand to scarce supply, elite brand, and extremely added value of the product. Without extrinsic incidents, the Chinese outbound market is a tremendous supply. Even when facing the appeals from the travel agencies, Taiwan has a confidence to be an attraction for Chinese to recompense the long-cherished wish. Along with the brand name and controlled quantity, Taiwan had thrived to develop niche products. Then, the hunger marketing effect did happen with the waiting list for visa. The quantity control had blocked the possible tourists to travel to other destinations and derived some illegal operations, such as applying non-tourism or free individual travel (FIT) visa for tourism groups. This kind of operations is not confined by the quota and the regulations. It saves the waiting time and cost as well.
The travel agencies of Taiwan and China are required to have permission to run the Chinese grouping and reception business. Nonetheless, the qualifications are not barriers for Taiwan’s travel agencies. In order to correct some cases of borrowing permissions, Taiwan halted the application to freeze the number of receptions of travel agencies, and then incurred another criticism for market intervention.
4.2. The Obligation to Report
The reception travel agencies are obligated to report incidents that are against the regulations or irregular. The incidents include: when the number of a group does not agree with requirements, re-designating the tour guide, re-arranging the tour bus or driver, and revising accommodation or shops, disappearance member, emergencies and disputes. The receptions of travel agencies that fail to report the incidents will have punishments of “warning”, and then accumulate to suspension. From 2010 to 2014, 465 warnings and 26 suspensions for this reason were issued, and these punishments resulted in the damages of goodwill and profits.
The purposes to design the report mechanism are to fully comprehend the situations of Chinese arrivals and the reception arrangements, and for the on-site inspections. However, these purposes are not to increase the business in the first place. The receptions of travel agencies argue the reschedule of the itinerary is familiar and necessary. In order to meet the requirement, they have to report on trifles and add more workloads. When comparing to other behaviors that are against the regulations, report faulty is insignificant but exhausted and cost-consuming. They also stress the report requirement has little relationship with the quality enhancement. The receptions of travel agencies that are intended to dodge the inspection will not provide reports, and the effects of report are consequently underperformed.
The tax inspection can effectively expose the false report and support the on-site inspection. Through cross-reference, the tax report and reception report are mutual evidence. For example, the shopping itinerary of Chinese groups is confined to the members of the Travel Quality Assurance Association. These members are responsible for reasonable prices and commissions, and the return or exchange of unsatisfied goods. The transactions under the table will damage the business order and tax revenue. There are 5501 cases against tax and report regulations in the period from 2012 to 2014, and the total amount of the fine is approximate US$40 million.
4.3. The Benchmark of the Reception
A variety of reception depends on the flexibility of alliance and cost structure, and is decided normally by market. In order to meet the living standard and travel quality, Taiwan has listed the minimum reception cost as US$60 per person per day in the regulation since 2009. The benchmark has covered the operation cost, fee, tickets, wages and profits as well. The merit proposed by the administration is to remain a trustable and fair group operation, which will not be manipulated or deteriorated by the depression cost. On the other hand, the receptions of travel agencies debate the benchmark is merely a formality and hard to achieve. The economic scale and long-term relationship in the industry, rather than the benchmark, are the key factors in guaranteeing the profit. The agencies are proud of the ability to bargain and are reluctant to unveil the confidential cost structure. While the group travel agencies are responsible for the group fee, a shortage between group fee and reception cost can be retrieved from the commission. With no sanction to group travel agencies, the benchmark, contrarily, is a restraint to commission.
The delayed payment and extreme low group fees result in insufficient funds for receptions of travel agencies to operate the group tours. Taiwan negotiated a 45-day payment term in the contract in 2011, but somehow the statement has been on paper because of the sustainable relationship consideration. The receptions of travel agencies are eager for a solution by having discussions with China, rather than the administrative demands on Taiwan’s industry.
4.4. The Negotiations and Bilateral Management
The periodic tourism negotiation mechanism began in 2009. The broad issues related to policy implement, administrative management, operations against the regulation, disputes between travel agencies, the business transactions, etc. are communicated and delivered. The functions of the mechanism are promoting the understanding of each other, preventing the unhealthy operation, and conveying the concerns from the market. The role of China authority takes great part in the business development. First of all, a highly supervised market needs the supports from both authorities of destination and the origin. Secondly, the group travel agencies involve the formation of group fee and the itinerary. Third, the Chinese tourism market has suffered negative reputations such as forcing shopping, and given every effort to rectify it.
China announced a template of the contract in April 2014, which was adopted officially as the essentials of the revised Travel Law. The regulations include confinements on shopping arrangement and additional purchase beyond the schedule, clearer definition and calculation of “indispensable charge”, to compel the punitive duty of compensation on travel agencies. Before the implement (October 2014), the arrivals of Chinese groups rose to 141,887 persons in September (growing by 33.16% compared to that in the same month of the last year) to avoid the possible ban on the horizon. The number rose again after the negative growing rates from October to December (−33.57%, −22.09%, and −14.37%, respectively). The reaction from the market showed that the deterrent effect was elaborated but still needed prolonged efforts and consistent approaches.
As the mechanism implemented in domestic industries can only get half of the result, there are expediencies to govern the travel agencies and tour managers from origins. Based on the adequate and concrete evidences, a rejected order issued by the Taiwan authority is a prompt method to forbid dishonored operations. By the end of May 2015, there had been three group agencies and four tour managers listed, which were not able to do business with Taiwan side.
4.5. The Quality Products
Besides the market order, another goal of the administrative mechanism is to upgrade the quality. In Taiwan’s public administration experience, the public power can also give directions to the development of products and niche market by administrative approaches. When the high-quality group was distinguished from the normal group in 2013, the higher reception standard was framed into the regulations along with exclusive quota. Encouraged by the saving time on visa approval, the travel agencies design products of high quality beyond exhausted and superficial schedule. To the administrative view, it implies more inspections on the high-quality group to meet the standards.
5. Survey and Findings
5.1. Survey on the Receptions of Travel Agencies
Besides the travel license, the travel agencies in Taiwan which intended to arrange tours for the tourists from China were required to acquire a reception permit and pay a travel agency guarantee deposit. The qualified travel agencies were obligated to comply with the administration and would be punished as a way of warning, fine or suspension while violating the regulations. By coordinating the contact person in each travel agency in advance, a survey on 215 non-suspended receptions of travel agencies was conducted in January 2015. These questionnaires were personally designated to the superintendents who were responsible for the business of tourists from China. The distribution and retrieve of the questionnaires were proceeded personally or by mail in one month; the 154 valid results were represented as a sample in Table 1.
The priority of tourism quality and quantity depends on the mission of each phase. Compared to the free market mechanism, the active administration to interfere the operation will achieve the mission and damage some advantages of the industry. The necessity of the administration needs to be re-examined frequently and gain the assurance from the industry. This study introduced support questions to IPA and produced the IS and IPS plots to express the relationship of these items.
A survey on 215 non-suspended receptions of travel agencies was conducted in January 2015. The questionnaire was designed based on the practical consideration and the intension and mechanism of Taiwan’s administrations on Chinese inbound groups. The issues covered policy and management, group fee and commission, inspection and punishment, negotiation with China, and quality enhancement of the product. The total group tourists received by top 20 receptions of travel agencies occupied 51.8% of the market in 2014. The number of tourists from China arranged by 215 non-suspended receptions of travel agencies was 2,002,655 in 2014. By examining the screen plot, the reception volume of each travel agency had major differences. To present the opinions from various reception volumes, the reception travel agencies were classified into four stratums according to the range of reception volume on the screen plot. The travel agencies which had a considerable reception volume are classified as stratum 1, which is illustrated as following: (1) “Extremely high” is for over 60 thousand group tourists. There were six agencies and their volumes accounted for 21.7% of the whole market. Five agencies were punished in 2014. (2) The “High” volume is from 30 thousand to 60 thousand, accounting for 30.1% of all. Nine of the 14 agencies were punished in this stratum. (3) The “Medium” volume is from 12 thousand to 30 thousand, accounting for 26.1%. Fourteen of the 28 agencies were punished. (4) “A Little” volume indicates below 30 thousand tourists, accounting for 22.1%. Twenty-six of the 167 agencies were punished.
The receptions of travel agencies valued importance and performance and expressed their support on each of the 15 administrative items, which are “1. Reception Fee”, “2. Report Obligation”, “3. Halt (the Number of Reception Travel) Agencies”, “4. Quota Control”, “5. Low Group Fee”, “6. Delayed Payment (from the Grouping Travel Agencies)”, “7. Excessive Commission”, “8. Inspection Density”, “9. Tax Inspection”, “10. Warning and Suspension”, “11. China’s Management”, “12. Chinese regulation”, “13. Bilateral Negotiation”, “14. Quality Products”, and “15. Healthy industry”. The seven-point Likert scales for each item in three parts are: “1. Extremely not important” to “7. Extremely important”, “1. Poor performance” to “7. Excellent performance”, and “1. Strongly not support” to “7. Strongly support”. There were 154 replies from managers and superintendents who actually operate the Chinese business, and the response rate was 71.6% (Table 1).
5.2. Findings
The IPA in this study is data-centerd and the averages of importance and support are 5.56 and 5.47, respectively. The average of performance is 3.55, which is much lower than importance and support (Table 2). The importance scores of 7 items are higher than their average, while the performance and support have 8 and 6 items, respectively. Further looking into the rank of 13 items in the three dimensions, the ranks of importance are similar to the ranks of support, but these two trends are opposite to that of performance. By comparing the difference between support and performance, 6. Delayed Payment (3.81), 11. Chinese Management (3.81), 5. Low Group Fee (3.67) and 12. China’s regulation (3.66) are the items with largest gaps. According to the IPA plots, we concluded findings as follows.
5.2.1. The Whole Administrative Control is Necessary, but the Performance is Under the Industry’s Expectation
The scores pointed out an above-the-average importance of the whole administrative control and a below-the-average performance, which are “slightly important” and “less performance”, respectively. The receptions of travel agencies approved the core concept of administration but the implement somehow needs to be corrected. They elaborated design on every receptive segment and relatively severe punishments than other markets requiring enormous administrative cost, resulting in disturbance. We found the items scattered widely and the agencies identify themselves with some items. It implies a resource displacement.
5.2.2. The Group Fee and Bilateral Management-Related Items are Most Important and Least Performance
The items scatter mostly in dimensions II and IV, which represent “not important with good performance” and “important but performance is not good”. Within the seven items in the important area (dimensions I and IV), only 15. Healthy industry is in dimension I, other items (6. Delayed Payments, 5. Low Group Fee, 11. Chinese Management, 1. Reception Fee, 13. Bilateral Negotiation, 12. Chinese regulation) are in dimension IV (Figure 3). The important but under-average performance items focus on the group fee and Chinese superintendence. The main reason is the frequent and considerable cash flow of the reception. More group tourists need more turnover cash. What is intriguing is more group tourists also cause more shortage of the group fee payment from the group travel agencies. It drives the receptions of travel agencies to bargain lower price for more tourists to cover the shortage. The vicious cycle can be rectified by constructing a reasonable cost structure.
Other appeals, besides the group fee, are the bilateral management for the effective management on the group travel agencies of China. Manipulating the reception by quantity and payment delivered, the group travel agencies can be the trigger of the illegal operations in Taiwan. Benefiting from the origin of the culture, the Chinese agencies are familiar with the regulation and organization, and can easily demand or initiate the unacceptable operations. The receptions of travel agencies must be the punished subjects while the group agencies are free of responsibilities.
5.2.3. The Key Point of Resource Allocation is Not to Enhance the Credits of Inspection and Administration
There are eight items in the unimportant area (dimensions II and III), and only 7. Excessive Commission is in the dimension III (neither important nor with good performance). Those that are not important and with good performance are 9. Tax Inspection, 8. Inspection Density, 4. Quota Control, 3. Halt Agencies, 2. Report Obligation, 14. Quality Products, and 10. Warning and Suspension. We found the seven items scatter in dimension II are for inspection and administration purposes. From the angle of authority, the resource shall be mastered to ensure a good performance. The illegal scene and effort therefore need to exhaust lots of cost to have the application under control. From another angle, the good performance, especially inspection, indicates the loss of income and brand name. The imbalance credits happen when some illegal operations are minor but accumulative to strict punishments. The intimidating effects are achieved but do not foster the market.
Comparing to the only one item in dimension III, 7. Excessive Commission, we understand the travel agencies tend to deal the commission distribution from the market rather than from administrative force. When there is a failure occurring, the agencies also complain the incompetence of the administration.
5.2.4. The Agencies Support the Whole Administration Even When the Performance Is Less than Average
While the average score of performance is 3.55, the average score of support from the travel agencies is 5.47, similar to the importance average score of 5.56 (Table 2). It expresses their support to the whole mechanism. We found the performance is not appreciated but the agencies still support the mechanism designed has considered both the administration and market. However, a more effective approach to catering to the demand of the agencies needs to be discussed.
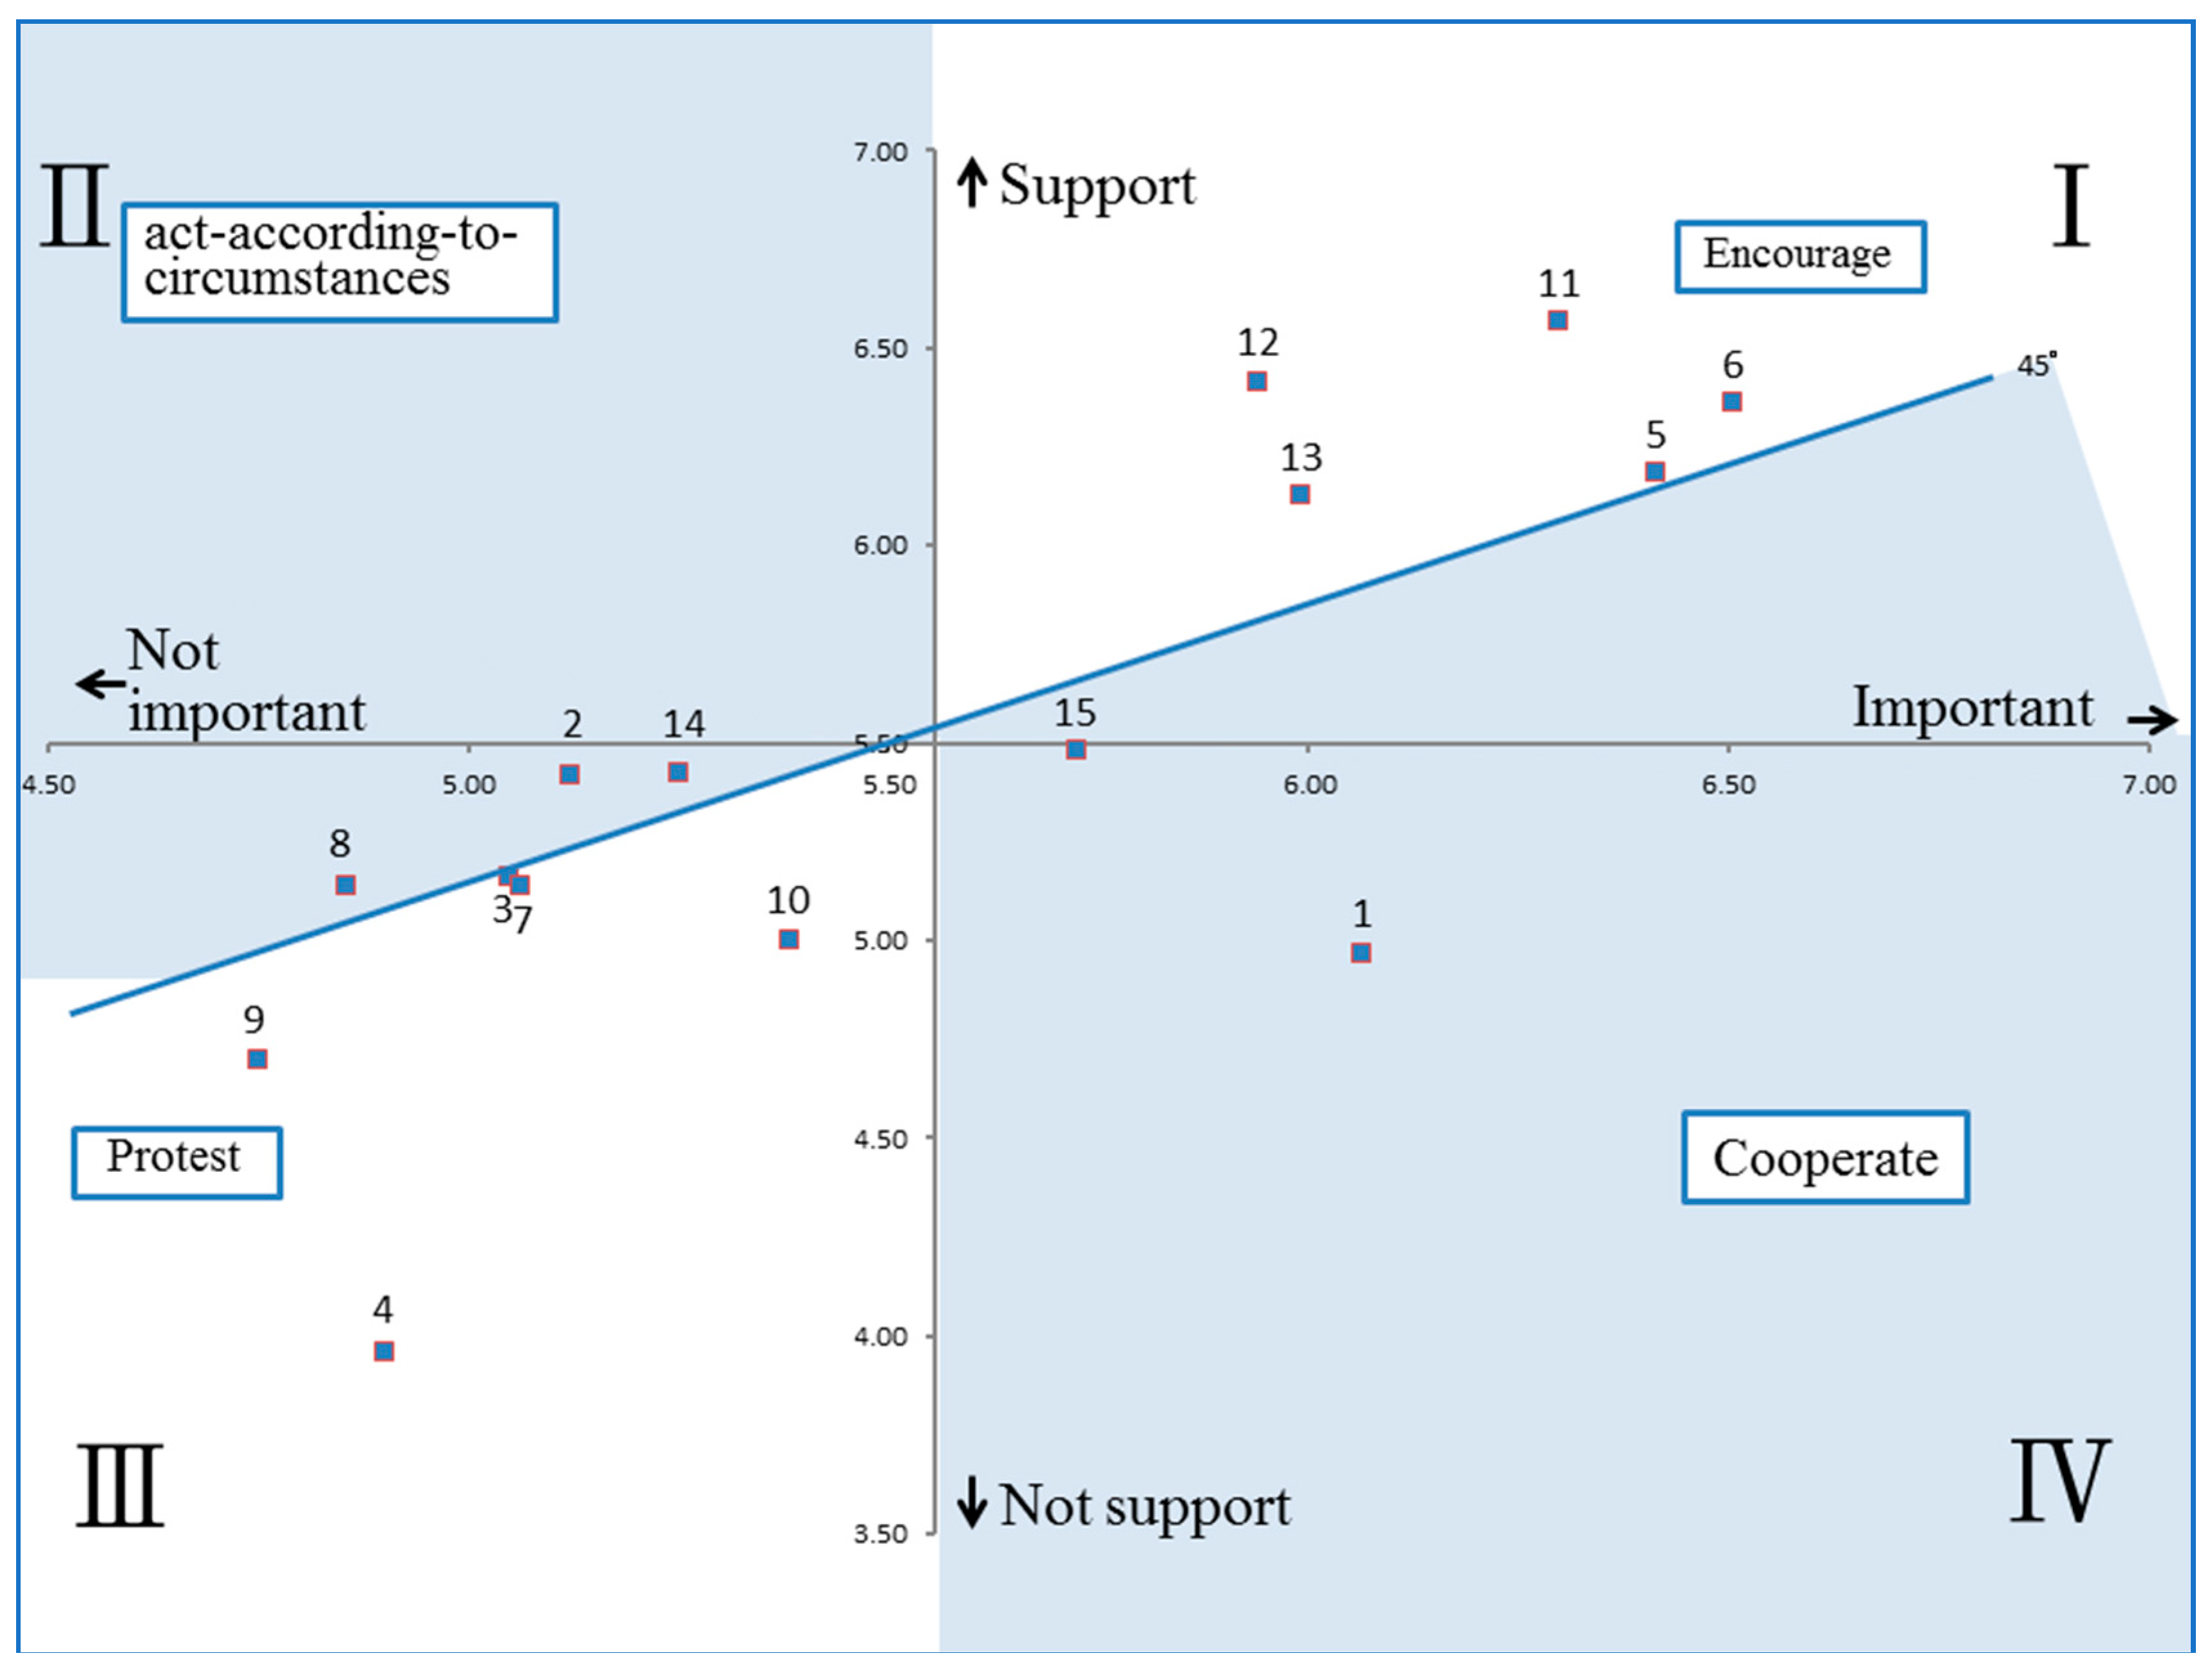
Most of the items scatter in dimensions I (Important and Support) and III (Neither Important nor Support) in the IS plot (Figure 4), which direction is opposite to the IP plot. The positive relationship in the IS plot echoes the two assumptions we proposed, which are the agencies will support the administrations that benefit themselves, and the external interference to the importance that can be measured. When mapping the IP and IS plots, and the horn shape implies the differences between performance and support are getting large when the items are more important (Figure 5).
5.2.5. The Group Fee and Negotiation with China Items are Most Encouraged
There are five items scatter in the “Encourage” area of IS plot: 6. Delayed Payment, 5. Low Group Fee, 11. Chinese Management, 12. China’s Regulation, and 13. Bilateral Negotiation. It illustrates a top priority job that the agencies tend to solve the unreasonable business model from the origin. The authority of China responded in 2015 by announcing the regulation on the market management, the order construction, and the consumers’ rights protections. The declaration was for Chinese inbound and outbound market, and also a heart-strengthening shot to the agencies in Taiwan.
1. Reception Fee and 15. Healthy industry are in the “cooperate” area, as they are important but less supportive with external interferences. It remains a debate that the reception fee is decided by market or administration. The authority demands the threshold for the purpose of industry development but gains a result of underperform.
5.2.6. The Agencies to Protest against “Quota Control” Most
Among the five items scattered in the “protest” area (9. Tax Inspection, 4. Quota Control, 3. Halt Agencies, 7. Excessive Commission, and 10. Warning and Suspension), 4. Quota Control is the most unwelcomed. The agencies oppose or plead for the control removal occasionally. While the authority and social groups are seeking the maximum benefits by balancing the reception capability, tolerance, and development, the confronting positions of authority and agencies would be inevitable.
The “act-according-to-circumstances” area reflects a passive reaction on 14. Quality Products, 2. Report Obligation, and 8. Inspection Density. The authority may not encounter fierce objection but non-cooperative conducts are also expectable. These items can be confined in certain intensity to bring order out of chaos.
5.2.7. The Authority Shall Work Hard to Diminish the Gap between Performance and Support, Instead of Performance and Importance
We mapped the IP and IS plots to generate a new IPS plot at the same importance scale. As a practical administration shall win the support from industry, the IPS plot can provide the difference information of performance and support. In this study, the horn shape indicates the important items have bigger gaps of performance and support than those in the unimportant area (Figure 5). The average difference is 3.08 in the important area, and the differences of 11. Chinese Management, 6. Delayed Payment, 5. Low Group Fee, and 12. China’s regulation are over 3.6. The average difference of the unimportant area is 0.90. In other words, the authority shall distribute more efforts to the items in the important area, and the level of Performance therefore can be improved obviously. An ideal situation of positive IP line that is consistent with the IS line is the most optimal administration mechanism.
6. Discussion and Implication
An open tourism policy is no doubt a booster for economic growth and internationalization. Taiwan shall not be absent in the competition of striving for a new and potential market like China. Taiwan took action in early stages to keep the market order from deterioration. The mechanism is designed for both management and development. However, the effect of this mechanism has to be examined by industry. The goal can be reached via the cooperation of origin and host. We applied the IPA to present the least support from the receptions of travel agencies, for the interference plays certain part in mechanisms to maintain the market order. The result also shows the direction and resource distribution need to be justified. The group fee, negotiation with China and the quota control-related items are most appealing for improvement. Although there are good performances on reception standard and inspection, the appreciation is only visible from the agencies when the problems are solved.
The purpose of public administration cannot only for the benefit of industry. The maintenance of market order from the intended behavior against the regulations is necessary. Nevertheless, the intensity of the administration can be loosened along with the mature of the market. With the minimum control, the agencies will complain less, strengthen the ability of self-control, and increase their competitiveness. Another advantage is the authority can make the most of the resource to reach the goal effectively. The obligation of the administration is then only on the regular requirements to confine misbehaviors and maintain the good order. There were 13 administrative items integrated in this study. Administered by these various requirements, the travel agencies demonstrated their viewpoints by grouping important and less important items. The results suggested the travel agencies would support the items which were valued as important. Nevertheless, some items were valued important but performed poorly. Others were well-performed but less important. To make the most of the administrative resources, miscellaneous requirements should be trimmed off for the best effects. The tourism mechanism should incorporate the opinions and gain the support from travel agencies in both developing and enforcing stages.
There are several continuous issues for further research on this topic. For tourism management, the suitable tourism administration was to design under the goal of management, the characteristics of the market and the cooperation of tourism industry. The development, priority and effects of administrative measures in various situations would be a topic for study. For the IPA approach, this study proposed “support” dimension and addressed the confirmation of validity. Studies to confirm the validity and multi-dimension-integrated model could be the consolidation and extension in IPA research.
7. Conclusions and Limitation
The tourism interaction between Taiwan and China fosters a comprehensive administration in Taiwan. Beyond the tourism revenues, the mechanism was established under the consideration of market specialty in Taiwan, as well as the tourism sustainability and well-development. China has contributed the largest travel expenditures and become the most fast-growing outbound resource in the world since 2012. According to UNWTO World Tourism Barometer (May 2016), the number of outbound tourists from China was 128 million, and the travel expenditures reached US$292.2 billion, both dominating the global tourism market. However, the destinations which accepted tourists from China should take the impact and disorder, along with overloaded tourists, into account. The introduction of the integrated mechanism in Taiwan, as well as the approach proposed to examining the effects of the administration items in this study, was a useful reference to destinations.
This study introduces the support concept to verify the validity of importance. The ISA illustrates the reactions when the agencies face the administration. The follow-up researches can deliberate adequate questionnaire to confirm the validity of importance and further measure the differences between the resource allocation and implement. Through the evidence, the decision-maker can rectify the approach to meet the agencies’ expectation. In this case, the more important items have bigger gaps between support and performance. It suggests the effect of the administration is not totally covered, or the different interpretations of the important items remain huge. Take Quota Control as an example, the authority, industry and social groups shall proceed several communications to reach a consensus on balancing the business opportunity and sustainable tourism.
This survey was conducted in 215 non-suspended receptions of travel agencies. This study constructed a list of contact persons of the travel agencies. Through the discussion prior to the survey, the contact persons could ensure the retrieving and accuracy of the responses. The number of receptions of travel agencies even grew to 417 in December 2018, which indicated more communicative efforts. While the suspended agencies were excluded in this survey, the most negative criticism might not be adopted in the results. An elaborate qualitative analysis could represent the standpoints of the entire market, as well as the suspended agencies. A comprehensive administration should be developed from a process of policy-making. This study demonstrated unilateral valuation on administration from travel agencies. Nevertheless, a multilateral examination was necessary to value the policy and mechanism. The research from authorities and other parties could be the replenishment of this study.
Author Contributions
Conceptualization, R.-C.T. and C.-H.C.; investigation, C.-H.C.; methodology, R.-C.T. and C.-H.C.
Funding
This research received no external funding.
Acknowledgments
The authors gratefully acknowledge financial support from the Ministry of Science and Technology with project number MOST 107-2410-H-032-032.
Conflicts of Interest
The authors declare no conflicts of interest.
References
- McKercher, B. The Implicit Effect of Distance on Tourist Behavior: A Comparison of Short Haul and Long Haul Pleasure Tourists to Hong Kong. J. Travel Tour. Mark. 2008, 25, 367–381. [Google Scholar] [CrossRef]
- Whyte, B. Visa-Free Travel Privileges: An Exploratory Geographical Analysis. Tour. Geogr. 2008, 10, 127–149. [Google Scholar] [CrossRef]
- Mainland Affairs Council. Cross Strait Economic Statistics Monthly; Mainland Affairs Council: Taipei, Taiwan, 2018; Volume 307, pp. 2–17.
- Tsaur, R.C.; Chen, C.H. Strategies for cross-border travel supply chains: Gaming chinese group tours to Taiwan. Tour. Manag. 2018, 64, 154–169. [Google Scholar] [CrossRef]
- Rowen, I. Tourism as a territorial strategy: The case of China and Taiwan. Ann. Tour. Res. 2014, 46, 62–74. [Google Scholar] [CrossRef]
- Wang, H.J.; Zhang, D. Comparing literary tourism in mainland China and Taiwan: The Lu Xun native place and the Lin Yutang house. Tour. Manag. 2017, 59, 234–253. [Google Scholar] [CrossRef]
- Chang, J.C. Tourists’ satisfaction judgments: An investigation of emotion, equity, and attribution. J. Hosp. Tour. Res. 2007, 32, 108–134. [Google Scholar] [CrossRef]
- Huang, W.-J.; Chen, C.-C.; Lin, Y.-H. Cultural proximity and intention to visit: Destination image of Taiwan as perceived by Mainland Chinese visitors. J. Destin. Mark. Manag. 2013, 2, 176–184. [Google Scholar] [CrossRef]
- Sun, Y.Y.; Budruk, M. The moderating effect of nationality on crowding perception, its antecedents, and coping behaviours: A study of an urban heritage site in Taiwan. Curr. Issues Tour. 2017, 20, 1246–1264. [Google Scholar] [CrossRef]
- Sung, Y.K.; Chang, K.C.; Sung, Y.F. Market segmentation of international tourists based on motivation to travel: A case study of Taiwan. Asia Pac. J. Tour. Res. 2016, 21, 862–882. [Google Scholar] [CrossRef]
- Chen, C.A. How can Taiwan create a niche in Asia’s cruise tourism industry? Tour. Manag. 2016, 55, 173–183. [Google Scholar] [CrossRef]
- Lee, C.K.; Kim, S.S.; Kang, S. Perceptions of casino impacts—A Korean longitudinal study. Tour. Manag. 2003, 24, 45–55. [Google Scholar] [CrossRef]
- McGehee, N.; Andereck, K. Factors predicting rural residents’ support of tourism. J. Travel Res. 2004, 43, 131–140. [Google Scholar] [CrossRef]
- Choi, C.; Murray, I. Resident attitudes towards sustainable community tourism. J. Sustain. Tour. 2010, 18, 575–594. [Google Scholar] [CrossRef]
- Huh, C.; Vogt, C.A. Changes in residents’ attitudes toward tourism over time: A cohort analytical approach. J. Travel Res. 2008, 46, 446–455. [Google Scholar] [CrossRef]
- Sharma, B.; Dyer, P.; Carter, J.; Gursoy, D. Exploring residents’ perceptions of the social impacts of tourism on the Sunshine Coast, Australia. Int. J. Hosp. Tour. Adm. 2008, 9, 288–311. [Google Scholar] [CrossRef]
- Choi, H.-S.C.; Sirakaya, E. Measuring Residents’ Attitude toward Sustainable Tourism: Development of Sustainable Tourism Attitude Scale. J. Travel Res. 2005, 43, 380–394. [Google Scholar] [CrossRef]
- Diedrich, A.; Garcia-Buades, E. Local perceptions of tourism as indicators of destination decline. Tour. Manag. 2008, 41, 623–632. [Google Scholar] [CrossRef]
- Haley, A.J.; Snaith, T.; Miller, G. The social impacts of tourism: A case study of Bath, UK. Ann. Tour. Res. 2005, 32, 647–668. [Google Scholar] [CrossRef]
- Vargas-Sánchez, A.; de los Ángeles Plaza-Mejía, M.; Porras-Bueno, N. Understanding residents’ attitudes toward the development of industrial tourism in a former mining. J. Travel Res. 2009, 47, 373–387. [Google Scholar] [CrossRef]
- Williams, J.; Lawson, R. Community issues and resident opinions of tourism. Ann. Tour. Res. 2001, 28, 269–290. [Google Scholar] [CrossRef]
- Tovar, C.; Lockwood, M. Social impacts of tourism: An Australian regional case study. Int. J. Tour. Res. 2008, 10, 365–378. [Google Scholar] [CrossRef]
- Faulkner, B.; Tideswell, C. A framework for monitoring community impacts of tourism. J. Sustain. Tour. 1997, 5, 3–28. [Google Scholar] [CrossRef]
- Fredline, L.; Deery, M.; Jago, L. Social Impacts of Tourism on Communities; CRC for Sustainable Tourism: Gold Coast, Australia, 2006. [Google Scholar]
- Kayat, K. Power, social exchanges and tourism in Langkawi: Rethinking resident perceptions. Int. J. Tour. Res. 2002, 4, 171–191. [Google Scholar] [CrossRef]
- Sirakaya, E.; Teye, V.; Sonmez, S. Understanding residents’ support for tourism development in the central region of Ghana. J. Travel Res. 2002, 41, 57–67. [Google Scholar] [CrossRef]
- Yen, I.; Kerstetter, D. Tourism impacts, attitudes and behavioral intentions. Tour. Anal. 2009, 13, 545–564. [Google Scholar] [CrossRef]
- Liu, A.; McKercher, B. The Impact of Visa Liberalization on Tourist Behaviors—The Case of China Outbound Market Visiting Hong Kong. J. Travel Res. 2016, 55, 603–611. [Google Scholar] [CrossRef]
- Andereck, K.L.; Valentine, K.M.; Knopf, R.C.; Vogt, C.A. Residents’ perceptions of community tourism impacts. Ann. Tour. Res. 2005, 32, 1056–1076. [Google Scholar] [CrossRef]
- Fredline, L. Host Community Perceptions of the Impacts of Tourism on the Gold Coast; CRC for Sustainable Tourism: Gold Coast, Australia, 2002. [Google Scholar]
- Woosnam, K.; Norman, W.; Ying, T. Exploring the theoretical framework of emotional solidarity between residents and tourists. J. Travel Res. 2009, 48, 245–258. [Google Scholar] [CrossRef]
- Neumaeyer, E. Visa Restriction and Bilateral Travel. Prof. Geogr. 2010, 62, 171–181. [Google Scholar] [CrossRef]
- Qu, H.; Lam, S. A Travel Demand Model for Mainland Chinese Tourists to Hong Kong. Tour. Manag. 1997, 18, 593–597. [Google Scholar] [CrossRef]
- Qu, H.; Li, I. The Characteristics and Satisfaction of Mainland Chinese Visitors to Hong Kong. J. Travel Res. 1997, 35, 37–41. [Google Scholar] [CrossRef] [Green Version]
- Sparks, B.; Pan, G.W. Chinese Outbound Tourists: Understanding Their Attitudes, Constraints and Use of Information Sources. Tour. Manag. 2009, 30, 483–494. [Google Scholar] [CrossRef]
- Li, M.; Zhang, H.; Mao, I.; Deng, C. Segmenting Chinese Outbound Tourists by Perceived Constraints. J. Travel Tour. Mark. 2011, 28, 629–643. [Google Scholar] [CrossRef] [Green Version]
- Lai, C.; Li, X.; Harrill, R. Chinese Outbound Tourists’ Perceived Constraints to Visiting the United States. Tour. Manag. 2013, 37, 136–146. [Google Scholar] [CrossRef]
- Pearce, D. Tourist Development, 2nd ed.; Longman Scientific: Harlow, UK, 1989. [Google Scholar]
- McKercher, B. The Effect of Market Access on Destination Choice. J. Travel Res. 1998, 37, 39–47. [Google Scholar] [CrossRef]
- McKercher, B.; Chan, A.; Lam, C. The Impact of Distance on International Tourist Movements. J. Travel Res. 2008, 47, 208–224. [Google Scholar] [CrossRef]
- Bonham, C.; Edmonds, C.; Mak, J. The Impact of 9/11 and Other Terrible Global Events on Tourism in the United States and Hawaii. J. Travel Res. 2006, 45, 99–110. [Google Scholar] [CrossRef]
- McKercher, B. The Roots of Stereotypes about Tourists. Society 2008, 45, 345–347. [Google Scholar] [CrossRef]
- Neumaeyer, E. Unequal Access to Foreign Spaces: How States Use Visa Restrictions to Regulate Mobility in a Globalized World. Trans. Br. Inst. Geogr. 2006, 31, 72–84. [Google Scholar] [CrossRef]
- Assaf, A.G.; Josiassen, A. Identifying and Ranking the Determinants of Tourism Performance: A Global Investigation. J. Travel Res. 2011, 51, 388–399. [Google Scholar] [CrossRef]
- Wang, D.; Ap, J. Factors affecting tourism policy implementation: A conceptual framework and a case study in China. Tour. Manag. 2013, 36, 221–233. [Google Scholar] [CrossRef]
- Dredge, D. Policy networks and the local organisation of tourism. Tour. Manag. 2006, 27, 269–280. [Google Scholar] [CrossRef]
- Hall, C.M.; Tribe, J. Tourism and Public Policy; Cengage Learning EMEA: Andover, UK, 2003. [Google Scholar]
- Baggott, R. Pressure Groups Today; Manchester University Press: Manchester, UK, 1995; Volume 1. [Google Scholar]
- Eising, R. Multilevel governance and business interests in the European Union. Governance 2004, 17, 211–245. [Google Scholar] [CrossRef]
- Martilla, J.A.; James, J.C. Importance-performance analysis. J. Mark. 1977, 41, 77–79. [Google Scholar] [CrossRef]
- Johns, N. Importance-performance analysis using the profile accumulation technique. Serv. Ind. J. 2001, 21, 49–63. [Google Scholar] [CrossRef]
- Matzler, K.; Sauerwein, L.; Heischmidt, K.A. Importance-performance analysis revisited: The role of the factor structure of customer satisfaction. Serv. Ind. J. 2003, 23, 112–129. [Google Scholar] [CrossRef]
- Sampson, S.E.; Showalter, M.J. The performance-importance response function: Observations and implications. Serv. Ind. J. 1999, 19, 1–25. [Google Scholar] [CrossRef]
- Levenburg, N.M.; Magal, S.R. Applying importance-performance analysis to evaluate e-business strategies among small firms. E-Serv. J. 2005, 3, 29–48. [Google Scholar] [CrossRef]
- Matzler, K.; Bailom, F.; Hinterhuber, H.H.; Renzl, B.; Pichler, J. The asymmetric relationship between attribute-level performance and overall customer satisfaction: A reconsideration of the importance-performance analysis. Ind. Mark. Manag. 2004, 33, 271–277. [Google Scholar] [CrossRef]
- Oh, H. Revisiting importance-performance analysis. Tour. Manag. 2001, 22, 617–627. [Google Scholar] [CrossRef]
- Van Ryzin, G.G.; Immerwahr, S. Research note: Importance performance analysis of citizen satisfaction surveys. Public Adm. 2007, 85, 215–226. [Google Scholar] [CrossRef]
- Azzopardi, E.; Nash, R. A critical evaluation of importance–performance analysis. Tour. Manag. 2013, 35, 222–233. [Google Scholar] [CrossRef]
- Deng, W. Using a revised importance-performance analysis approach: The case of Taiwanese hot springs tourism. Tour. Manag. 2007, 28, 1274–1284. [Google Scholar] [CrossRef]
- Enright, M.J.; Newton, J. Tourism destination competitiveness: A quantitative approach. Tour. Manag. 2004, 25, 777–788. [Google Scholar] [CrossRef]
- Hudson, S.; Shephard, G.W.H. Measuring service quality at tourist destinations: An application of importance-performance analysis to an alpine ski resort. J. Travel Tour. Mark. 1998, 7, 61–77. [Google Scholar] [CrossRef]
- Joppe, M.; Martin, D.W.; Waalen, J. Toronto’s image as a destination: A comparative importance-satisfaction analysis by origin of visitor. J. Travel Res. 2001, 39, 252–260. [Google Scholar] [CrossRef]
- Litvin, S.W.; Ling, S. The destination attribute management model: An empirical application to Bintan, Indonesia. Tour. Manag. 2001, 22, 481–492. [Google Scholar] [CrossRef]
- O’leary, S.; Deegan, J. Ireland’s image as a tourism destination in France: Attribute importance and performance. J. Travel Res. 2005, 43, 247–256. [Google Scholar] [CrossRef]
- Evans, M.R.; Chon, K. Formulating and evaluating tourism policy using importance-performance analysis. Hosp. Educ. Res. J. 1989, 13, 203–213. [Google Scholar]
- Pike, S.; Ryan, A. Destination positioning analysis through a comparison of cognitive, affective and cognitive perceptions. J. Travel Res. 2004, 42, 333–342. [Google Scholar] [CrossRef]
- Tarrant, A.; Smith, E.K. The use of modified importance-performance framework to examine visitor satisfaction with attributes of outdoor recreation settings. Manag. Leis. 2002, 7, 69–82. [Google Scholar] [CrossRef]
- Huan, T.C.; Beaman, J.; Shelby, L.B. Using action-grids in Tour. Manag. Tour. Manag. 2001, 23, 255–264. [Google Scholar] [CrossRef]
- Lowenstein, M.W. Customer Retention: An Integrated Process for Keeping Your Best Customers; ASQC Quality Press: Milwaukee, WI, USA, 1995. [Google Scholar]
- Smith, W.W. Social desirability bias and exit survey responses: The case of a first nation’s campground in Central Ontario, Canada. Tour. Manag. 2007, 28, 917–919. [Google Scholar] [CrossRef]
- Miller, T.I.; Kobayashi, M.M. Citizen Surveys: How to Do Them, How to Use Them, What They Mean, 2nd ed.; International City/County Management Association: Washington, DC, USA, 2000. [Google Scholar]
- Myers, J.H.; Alpert, M.I. Determinant Buying Attitudes: Meaning and Measurement. J. Mark. 1968, 32, 13–20. [Google Scholar] [CrossRef]
- Neslin, S.A. Linking product features to perceptions: Self-stated versus statistically revealed importance weights. J. Mark. Res. 1981, 18, 80–86. [Google Scholar] [CrossRef]
- Oliver, R.L. Satisfaction: A Behavioral Perspective on the Consumer; Irwin McGraw-Hill: Boston, MA, USA, 1997. [Google Scholar]
- Myers, J.H. Measuring Customer Satisfaction; American Market Association: Chicago, IL, USA, 1999. [Google Scholar]
- Allen, D.R.; Rao, T.R. Analysis of Customer Satisfaction Data; American Society for Quality: Milwaukee, WI, USA, 2000. [Google Scholar]
- Lyons, W.E.; Lowery, D.; DeHoog, R.H. The Politics of Dissatisfaction: Citizens, Services, and Urban Institutions; M.E. Sharpe: Armonk, NY, USA, 1992. [Google Scholar]
- Van de Walle, S.; Bouckaert, G. Public service performance and trust in government: The problem of causality. Int. J. Public Adm. 2003, 26, 891–913. [Google Scholar] [CrossRef]
Figure 1.
The importance–performance analysis frame.

Figure 2.
The attitudes of travel agencies with degrees of support.

Figure 3.
The IP plot of administrative effects of Chinese arrivals in Taiwan.

Figure 4.
The IS plot of administrative effects of Chinese arrivals in Taiwan.

Figure 5.
The IPS plot and the distance between performance and support.


Table 1.
The response rate of the survey on receptions of travel agencies.
| Stratum | 1 | 2 | 3 | 4 | Total |
|---|---|---|---|---|---|
| Number of receptions of travel agencies | |||||
| Population | 6 | 14 | 28 | 167 | 215 |
| Sample | 6 | 13 | 28 | 107 | 154 |
| Response Rate | 100.0% | 92.9% | 100.0% | 64.1% | 71.6% |
| Number of tourists | |||||
| Population | 433,894 | 602,556 | 523,354 | 442,851 | 2,002,655 |
| Sample | 433,894 | 567,898 | 523,354 | 322,647 | 1,847,793 |
| Response Rate | 100.0% | 94.2% | 100.0% | 72.9% | 92.3% |
Table 2.
The scores of importance, performance, and support.
| Items | Importance | Performance | Support | ||||
|---|---|---|---|---|---|---|---|
| Scores | Rank | Scores | Rank | Scores | Rank | Difference with Performance | |
| Average | 5.56 | 3.55 | 5.47 | 1.92 | |||
| 6. Delayed Payment | 6.51 | 1 | 2.55 | 14 | 6.36 | 3 | 3.81 |
| 5. Low Group Fee | 6.42 | 2 | 2.51 | 15 | 6.18 | 4 | 3.67 |
| 11. Chinese Management | 6.30 | 3 | 2.75 | 11 | 6.56 | 1 | 3.81 |
| 1. Reception Fee | 6.06 | 4 | 2.62 | 13 | 4.96 | 13 | 2.34 |
| 13. Bilateral Negotiation | 5.99 | 5 | 3.44 | 9 | 6.12 | 5 | 2.68 |
| 12. China’s Regulation | 5.94 | 6 | 2.75 | 11 | 6.41 | 2 | 3.66 |
| 15. Healthy Industry | 5.73 | 7 | 3.89 | 6 | 5.48 | 6 | 1.59 |
| 10. Warning and Suspension | 5.38 | 8 | 4.65 | 2 | 5.00 | 12 | 0.35 |
| 14. Quality Products | 5.25 | 9 | 3.82 | 7 | 5.42 | 7 | 1.60 |
| 2. Report Obligation | 5.12 | 10 | 4.74 | 1 | 5.42 | 8 | 0.68 |
| 7. Excessive Commission | 5.06 | 11 | 3.07 | 10 | 5.14 | 10 | 2.06 |
| 3. Halt Agencies | 5.05 | 12 | 4.00 | 5 | 5.16 | 9 | 1.16 |
| 4. Quota Control | 4.90 | 13 | 3.61 | 8 | 3.95 | 15 | 0.34 |
| 8. Inspection Density | 4.86 | 14 | 4.27 | 4 | 5.14 | 10 | 0.86 |
| 9. Tax Inspection | 4.75 | 15 | 4.54 | 3 | 4.69 | 14 | 0.16 |
© 2018 by the authors. Licensee MDPI, Basel, Switzerland. This article is an open access article distributed under the terms and conditions of the Creative Commons Attribution (CC BY) license (http://creativecommons.org/licenses/by/4.0/).
Share and Cite
MDPI and ACS Style
Tsaur, R.-C.; Chen, C.-H. Sustainable Tourism Planning for Taiwanese in Administrative Effects with Respect to Chinese Arrivals. Sustainability 2018, 10, 4729. https://doi.org/10.3390/su10124729
AMA Style
Tsaur R-C, Chen C-H. Sustainable Tourism Planning for Taiwanese in Administrative Effects with Respect to Chinese Arrivals. Sustainability. 2018; 10(12):4729. https://doi.org/10.3390/su10124729
Chicago/Turabian StyleTsaur, Ruey-Chyn, and Chyoug-Hwa Chen. 2018. "Sustainable Tourism Planning for Taiwanese in Administrative Effects with Respect to Chinese Arrivals" Sustainability 10, no. 12: 4729. https://doi.org/10.3390/su10124729
Note that from the first issue of 2016, this journal uses article numbers instead of page numbers. See further details here.