Sustainable Performance of Low-Carbon Energy Infrastructure Investment on Regional Development: Evidence from China

Accounting School, Nanfang College of Sun Yat-Sen University, Guangzhou 510275, China
*
Author to whom correspondence should be addressed.
Sustainability 2018, 10(12), 4657; https://doi.org/10.3390/su10124657
Submission received: 20 September 2018
/
Revised: 25 November 2018
/
Accepted: 3 December 2018
/
Published: 6 December 2018
(This article belongs to the Special Issue Resilient Infrastructure Systems and Sustainable Economic Growth)
Abstract
:In the 13th Five-Year Plan, the Chinese government declared that one of the sustainable policy priorities is improving the energy supply composition in order to reduce greenhouse gas emissions. In accordance with the Plan, the Guangdong government subsequently planned to invest in low-carbon energy infrastructure from 2016 to 2020. Using data from Guangdong province and other regions in China for 2007–2016, we propose a two-stage network data envelopment analysis (Network DEA) model to examine the sustainable performance of the Chinese regional/provincial economic system. We postulated that the less sustainable performance of Chinese regional economic systems may be attributed to lower energy productivity performance. However, we found that increased governmental and industrial spending on electricity mix improvement by building new low-carbon power plants created momentum in Guangdong’s economic growth, which experienced an annual rise of roughly 1.16%. Finally, the results from the two-stage Network DEA model showed that Guangdong fared better than other provinces with respect to sustainable performance. Investment in low-carbon energy infrastructure is not only a measure to combat CO2 emission, but could act as the driving force of regional economic systems.
1. Introduction
One of the inherent administrative objectives of governments is to promote social development while facilitating economic prosperity. For this task, the infrastructure investment budget is a typical financial instrument used by regulators as the exogenous force to stimulate demand in intermediate and final goods, so that additional transactions accelerate economic growth. Among the many resources required to support economic development, energy is always indispensable. In this sector, the overdependence on fossil fuels had gone unchallenged until recent years [1]. As climate change worsens and extreme weather conditions threaten the living environment of all species on the planet, sustainable development has become a priority on every government’s agenda. Consequently, the trend of revolutionizing traditional fossil fuel combustion power plants in order to curb CO2 emissions is essential to long-term sustainability policies worldwide.
According to the statistics from International Energy Agency [2], greenhouse gas (GHG) emissions from fuel combustion power plants was approximately 32.294 billion metric tons in 2015, of which China was responsible for 28% (approximately 9.041 billion metric tons). As China experienced unprecedented growth after it opened up its markets to the world, its economic growth has gradually caused the country to become the world’s largest GHG emitter [3]. In the hope of decelerating global warming and alleviating consequent economic loss, China, as a member of the global markets, is expected to take on more responsibility for environmental protection. China has since implemented a large number of energy policies to improve the efficiency of the energy industry and to mitigate CO2 emission (e.g., Formulating the plan for total amount control of pollutant emission) [4,5]. For example, in its 11th Five-Year Plan (from 2006 to 2010) and the subsequent 12th Five-year Plan (from 2011 to 2015), China aimed to decrease its energy consumption intensity in terms of per unit gross domestic product (GDP) by 20% and 16%, respectively [6]. China has long been involved in renewable energy investment, reaching a 10-year increasing trend from 2006 to 2015 [7]. The Chinese government has evidently supported renewable energy development directly through national and regional policies.
In the 13th Five-year Plan, China has carefully laid out its economic policy for 2016 to 2020; the awareness of environmental protection was also embedded in the main theme. As of 2015, under the Paris Agreement, China has committed to increase the share of non-fossil fuel in primary energy consumption to around 20% between 2020 and 2030 in its first Nationally Determined Contribution (NDC) [8]. This step signified further modification in China’s energy industry. To improve the efficiency of the energy system and industry, without potential economic growth, has been a challenge to the sustainable development of China. Thus, it is critical to evaluate the impacts of such policies, considering all factors such as energy supply, economic, and environmental efficiency. With this information, policy makers can optimize the allocation of limited resources in order to achieve sustainable development goals (SDGs).
Various indicators, e.g., per capita energy consumption, energy productivity, and CO2 emission intensity, have been widely used to identify the severity of CO2 emission in different aspects of sustainability [6]. However, these measures, which are usually two-dimensional for practical reasons, fail to incorporate the many façades of the performance assessment, such as scale differentiation. Thus, to form sensible inferences about sustainability under a single evaluation framework, we started with widely-used data envelopment analysis (DEA) [9,10,11], and its extended version, the network data envelopment analysis (Network DEA), to evaluate the impact of government spending on sustainability. The interaction mechanism of the Network DEA model provided an operational framework to decompose an organization into several sub-units. Network DEA is a powerful management tool that depicts an efficient frontier by decision-making units (DMUs), and can be used for determining suitable resource allocation. Median DMU can provide benchmarking [8]. From the Network DEA model, we can obtain a comprehensive performance score, which contains all the available information, such as inputs, intermediate measures, and output. This score can then be used to identify best-performing DMUs and to form guidelines for other units to follow in order to improve its performance in the future [12,13].
In this paper, we propose a modified two-stage Network DEA model for sustainable performance evaluation. We considered energy use and energy productivity together as a series-connection process, with the consumption of various types of energies as the intermediate measure, linked to consecutive stages/processes in the model. In particular, energy use efficiency was used to determine whether the energy system of a given region has gradually transformed to low-carbon, as part of the government’s investment was to induce efficiency improvement away from fossil fuel consumption. Energy productivity efficiency was used to evaluate the maximum possible economic benefit (in terms of GDP) and CO2 abatement performance of the region, given energy consumption from previous stage.
The policy impact on the regional sustainable performance was also assessed in this study. Following the guidelines of the 13th Five-Year Plan of the central government, Guangdong Province has set schemes for energy diversification in order to reduce GHG emissions from fossil fuel combustion power plants. The Guangdong government has planned to increase the capacity of the low-carbon energy infrastructure, including nuclear, solar, and wind power, to meet increasing demand for clean energy. The investment in low-carbon energy infrastructure in Guangdong may offer the opportunity to align national or regional growth interests with environmental protection against CO2 emissions. Therefore, it is important for policy makers to understand these policy impacts in order to ensure the implemented measures will attain the expected efficiency and effectiveness. To assess the influence of the regional energy industry and the investment in low-carbon energy infrastructure on regional economic growth, we used the Leontief input-output (I-O) model with data from Guangdong in 2016–2020. Our research could be viewed as a preliminary evaluation of policy planning for the energy supply revolution.
Due to the simplicity of the Leontief I-O model in the setup of the inter-sectoral relationship within a given regional economy, it is commonly used for impact analysis in a variety of areas, especially for assessments of energy infrastructure investment [14,15,16,17,18]. Yet, the limitations caused by the transmission network, regional economic activities, and energy demand must be carefully considered under the energy system. Nakano et al. [19] built a regional I-O model to calculate the economic and environmental effects of the construction of a biomass power plant, and Sugino et al. [20] measured the impacts of adopting low-carbon energy technologies. Varela-Vázquez and Sánchez-Carreria [21] demonstrated that the introduction of offshore wind power could promote the growth of Spanish economy. Okkonen and Lehtonen [22] found that the establishment of a bio-oil production system could benefit regional economies in Finland.
Generally, with respect to the sustainable development goals, the government should consider how to invest in low-carbon infrastructure in a win-win strategy for both the economy and the environment. Therefore, the government should review its sustainable performance not only from the traditional economic standpoint, but an environmental one as well. It would also be interesting to compare the results with other homogeneous organizations. We first analyzed the regional sustainable performance using data from 2007 to 2016 for Guangdong. Second, we investigated the economic impact of certain sustainability policies (i.e., low-carbon energy infrastructure investment) on regional economic system and its CO2 abatement potential. Finally, we conducted a scenario analysis to identify the influence of the policy on the sustainable performance score of Guangdong, to determine impacts on sustainable development.
The reminder of this paper is organized as follows. In Section 2, we introduce the current status and future plan of the energy sector in Guangdong province in China. We develop a sustainable performance model in Section 3. An overview of the Network DEA and Leontief I-O models employed in this paper are presented in Section 4. The empirical results are discussed in Section 5. A summary of the main findings and some concluding remarks are presented in the final section.
2. Current Status of Guangdong’s Social and Economic Environment in China
Guangdong province in China has long benefited from early industrialization and urbanization, due to its advantageous geographic location and open policy. It has contributed the most to the national gross domestic product, ranked 1 among all 31 provinces and special administrative regions (SARs) in China. In the past decade, around 11% of the national GDP has been attributed to Guangdong. Guangdong has played a vital role in boosting the Chinese economy.
Table 1 presents the trend in annual gross domestic product (GDP) in China and Guangdong. In 2016, the GDP of Guangdong was 79,512 billion RMB. However, the regional economic performance slowed down after 2012 in contrast to its rapid increase between 2007 and 2011, with an average annual growth rate almost reaching 13.8% (Table 1). Seeing that the unprecedented growth of Guangdong’s economy had come to an end, the administrative priority shifted toward finding avenues to sustain stable economic momentum. With limited budget, the government would have to make the best choice among various policy instruments.
From Table 2, we can see that as the regional economy grew quickly, the energy consumption of Guangdong also increased, reflecting the production expansion. The annual compound growth rate of energy consumption between 2012 and 2016 was a fraction (3.51%) of GDP growth (8.6%). The energy consumption per unit of GDP (i.e., energy intensity) had gradually fallen; however, in 2016, it was 0.386, meaning that the energy-saving policy was in effect. However, greenhouse gas emissions have increased over the years, triggering concerns about environmental protection. In the past decade, the share of electricity in energy consumption ranged from 49.3% to 52.7%, suggesting that with adequate low-carbon electricity supply, it is possible to mitigate the pollution in Guangdong. In the 13th Five-Year Plan of Guangdong, investment plans for new renewable energy infrastructure were laid out in the hope of improving the energy portfolio to reduce GHG emissions. We aimed to evaluate the economic impact of the investment during the Plan’s proposed period from 2016 to 2020.
3. Sustainable Performance Model Development Based on Network DEA and I-O Model
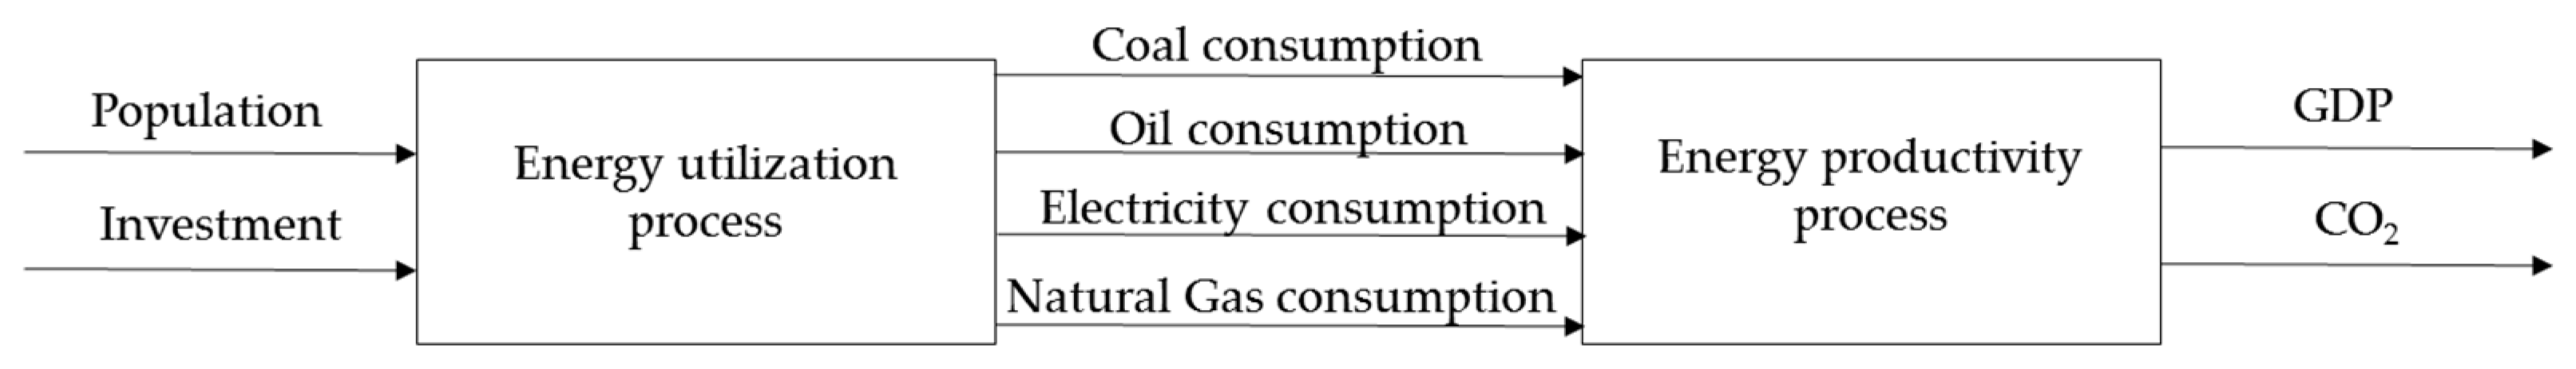
It is important for the government to have a clear idea about the impact of policy on sustainability in order to fine-tune and improve the efficiency of the implemented schemes. There have been a number of studies analyzing energy, economic, and environmental efficiency in the unity analytical framework using the DEA model, considering multiple inputs and outputs at national level [25,26,27]. In managerial practice, more insights into sustainable performance can be found in the Network DEA model, which is known for its abundance of information [28]. Though Network DEA has become more prominent in performance evaluation, with applications in various fields [29,30,31,32], few studies have used the Network DEA approach for regional sustainable performance evaluation [33,34]. Wu et al. [27] proposed a DEA model to estimated energy usage efficiency, CO2 emission efficiency, and economic-environmental efficiency for Asia-Pacific Economic Cooperation (APEC) economies, in which a group of specific variables, including population, total primary energy consumption, GDP, and CO2 emission, were used. Our sustainable performance evaluation was motivated by the multi-stage DEA framework with the input-output specification for performance score calculated separately as proposed by Wu et al [26], with a modification to the serial connection of the two-stage Network DEA model: the consumption of various energy types has been treated as intermediate variables from the previous stage to the following stage. Because infrastructure investment in the energy industry signals the effort to strengthen energy supply and/or grid systems in response to the increase in energy demand in a regional economic system, it was also included as one of the inputs to evaluate energy use efficiency. The framework of our modified two-stage Network DEA model, for sustainable performance evaluation at the regional/provincial level in China, is illustrated in Figure 1, showing the two-stage process with a connection between the energy use stage and the energy productive stage. Previous studies have highlighted several crucial variables associated with sustainable performance, such as population, capital, energy consumption, GDP, and CO2 emission, which were used as the input, intermediate, and output variables in our network DEA model. Note that the production or value-added approach could also be seen as a common variable selection process presented in the sustainable performance model we propose.
In this model, energy use process occurs when energy demand is satisfied in a given region, involving the consumption of various types of energy, which was treated as the outputs of energy use. Population and investment in the energy industry were treated as two inputs. The energy productivity process was where regional economic activities and the corresponding environmental issues occurred. Population has been identified as one of the most important factors of regional energy use evaluation. Public investment in the energy industry was used as a proxy for the effort in energy system improvement given the increase in energy demand as the regional economy expanded. The consumption of different types of energy, such as coal, oil, natural gas, and electricity, represent crucial productive factors for regional economic system. To evaluate sustainable development, we used GDP and CO2 emission as the desirable and undesirable output, respectively, to represent the double-sided issue of economic growth and environmental protection.
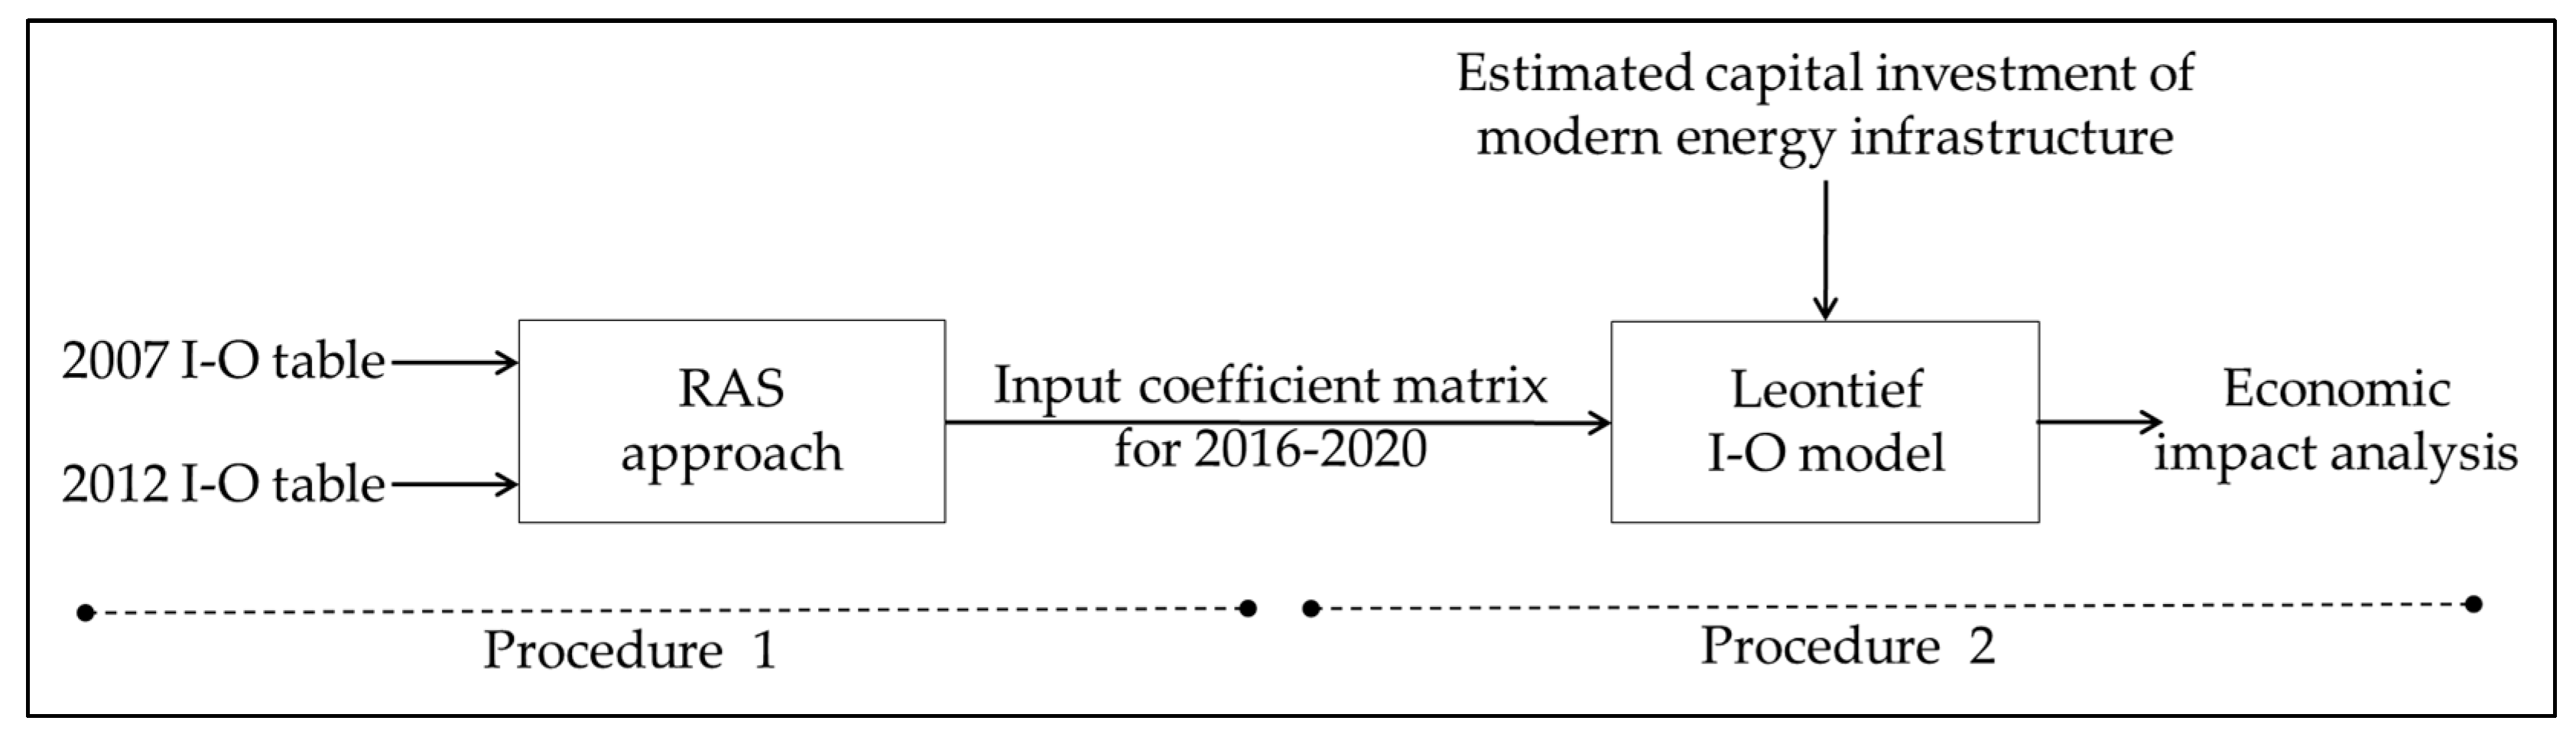
The proposed sustainable performance model was used for ex-post analysis of government efforts on regional sustainable development. We incorporated an economic model in the model design in response to this sustainability theme. The Leontief input-output model, constructed by the interrelationship among industries/sectors and the final demand under a given economic system, is commonly used to evaluate the maximum economic gain due to a certain policy in the short-term [35,36]. Lee and Yoo [15] developed a variation of the standard demand-driven Leontief I-O model to consider the outputs from four transportation industries as one final demand source driving the growth of the Korean economy. In this paper, we introduced two conceptual procedures of the economic analysis model, as illustrated in Figure 2, to depict a clearer picture of the effect of low-carbon energy infrastructures investment on the economic development of Guangdong, China.
The input-output table is the key component of the Leontief I-O model. To compensate for the lack of the official input-output table for Guangdong in 2017, we constructed a two-stage conceptual process of the economic analysis model. As shown in Figure 2, in order to estimate the input (technical) coefficients for Guangdong’s 2017 input-output table, we adopted the mechanical adjustment methodology, i.e., the RAS method proposed by Stone and Brown [37]. In procedure-1, using changes in technical coefficients in the same industrial structure in Guangdong’s economy between 2007 and 2012 as parameters of industrial technological coefficients, we estimated technological coefficients of each sector in 2017 in the input-output table. Then, in procedure-2, the estimated 2017 technological coefficients were used to build Guangdong’s input-output model, depicting a possible scenario of industrial production and service activities in Guangdong. This conceptual framework built from the systematic procedure offered a possible solution to the missing data issue, and allowed further research on the economic growth of Guangdong’s economy with the investment in modern energy infrastructure during the 13th Five-Year Plan.
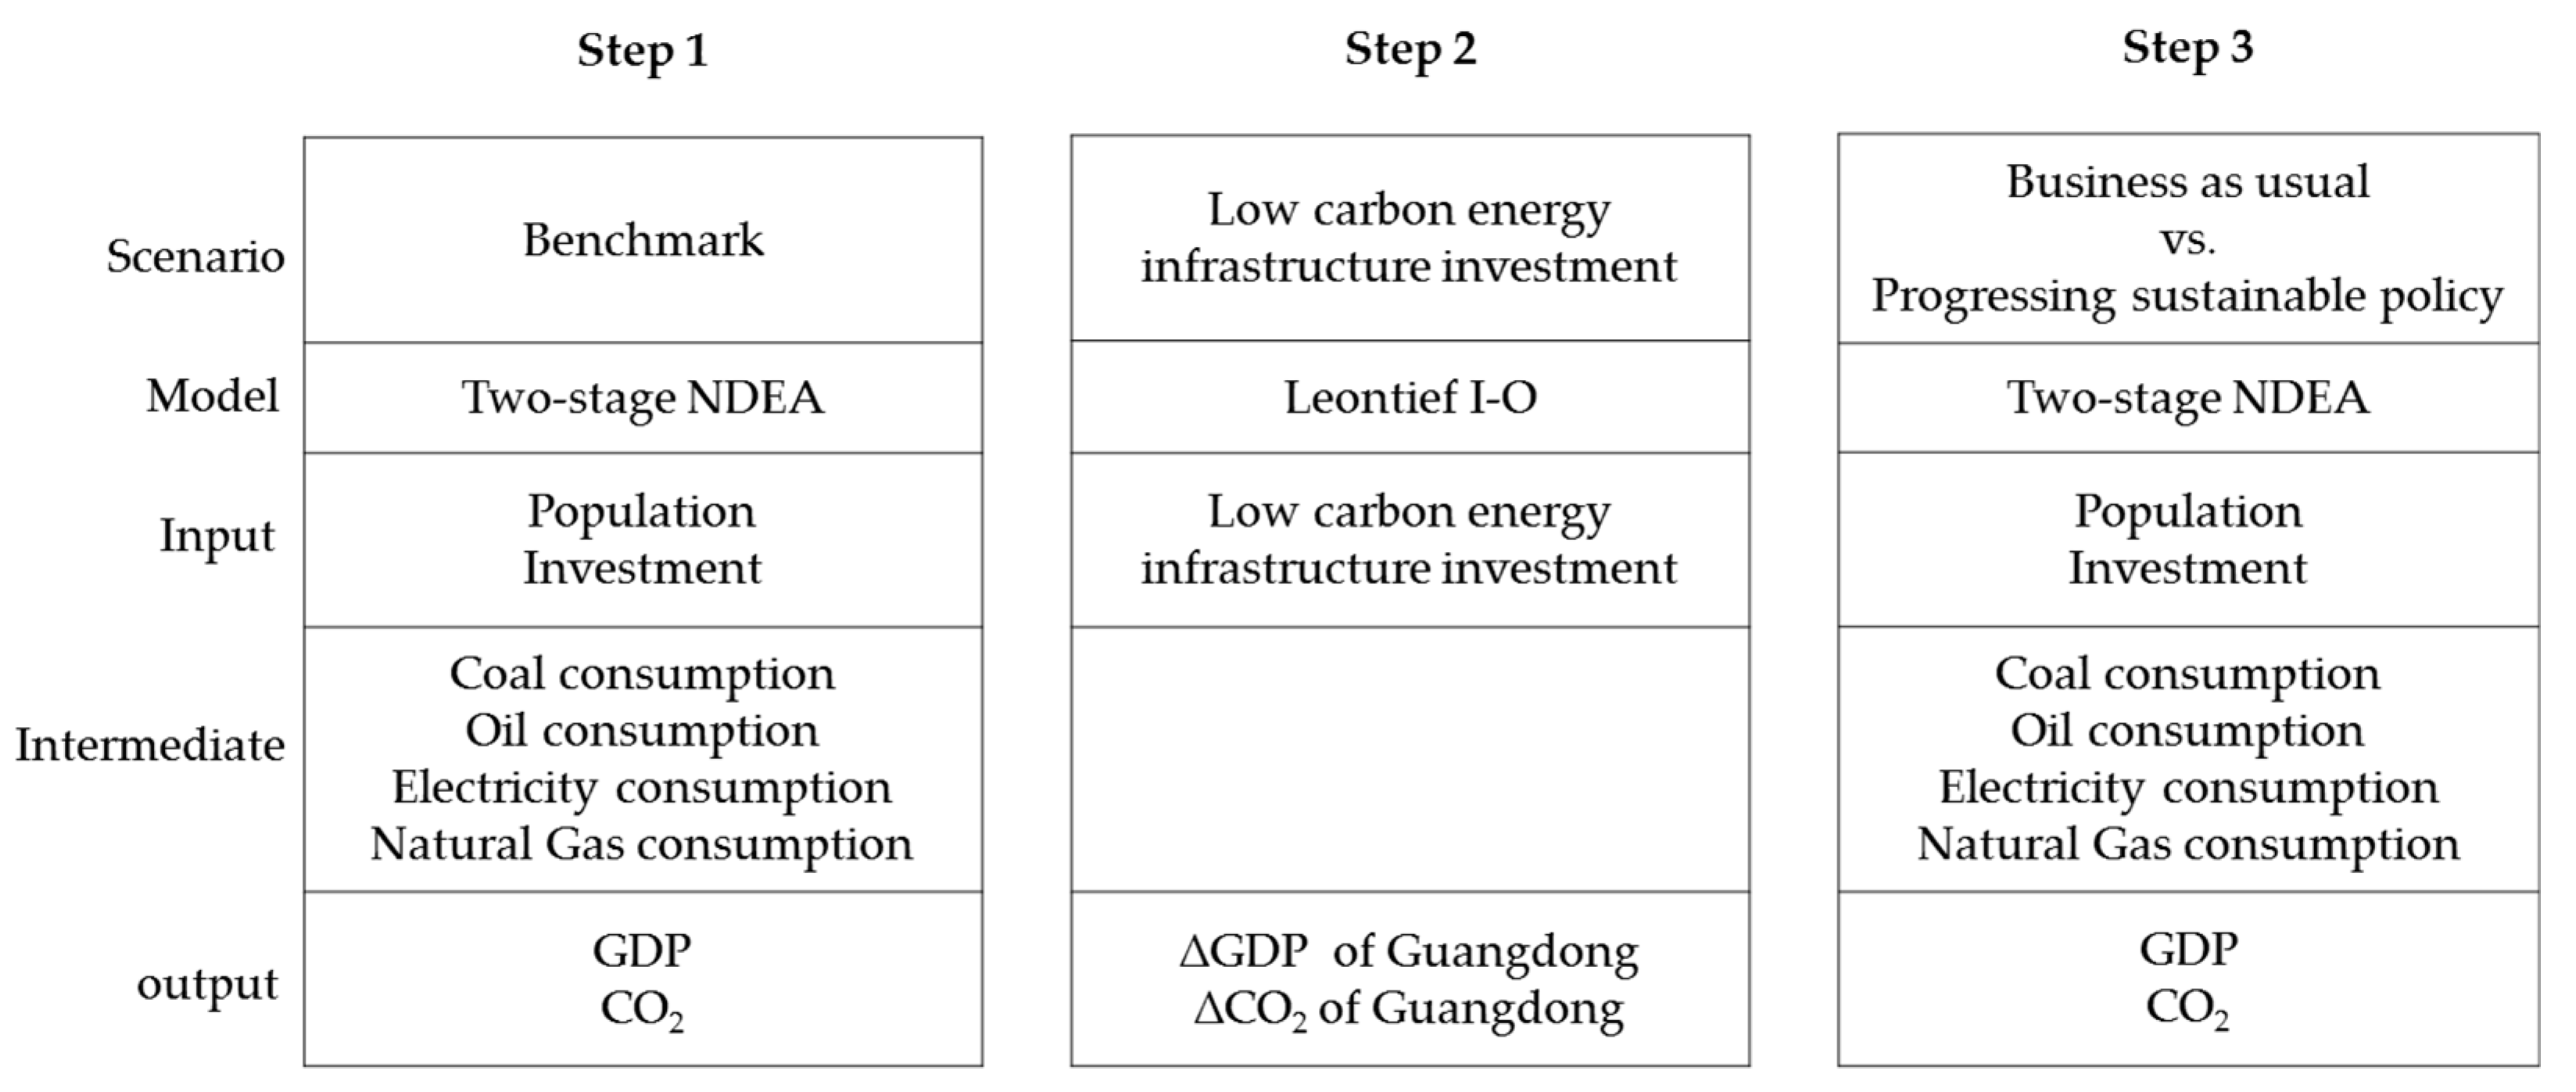
The proposed sustainable performance network DEA with Leontief I-O model can be divided into three steps as demonstrated in Figure 3. First, the network DEA was used to evaluate the sustainable performance at the regional level in China from 2007 to 2016 as the benchmark scenario. Second, the Guangdong’s input-output model was constructed, where the low-carbon energy infrastructures investment was introduced into the model as an exogenous factor to obtain the desirable economic potential (GDP). Along with the variation of regional GDP obtained from the Leontief I-O model, potential CO2 reduction was also estimated from low-carbon energy infrastructure investment. Both that were treated as the outcome of the PSP scenario that we proposed, and used to replace the data of desirable and undesirable output in the energy productivity stage of specific DMU (i.e., Guangdong province) and further feed into the network DEA model. Third, network DEA was applied to determine the sustainable performance score of given regions to assess the benefits from Guangdong’s sustainable policy in the prospect of energy use and productivity efficiency.
4. Methodology
4.1. Proposed Two-Stage Network DEA Model of Regional Sustainable Performance Evaluation
The original two-stage Network DEA model was introduced by Färe and Grosskopf [38] with intermediate measures in the performance evaluation. The Network DEA approach decomposes the overall performance of the production system into several sub-processes or divisional stages associated with intermediate variables. The identification of inefficient sources is emphasized, which enables the decision-maker to make policy recommendations. Kao [39] focused on the type of internal network structure of DMU to reinforce the generalized application of the Network DEA model. Kao identified three kinds of internal network structure: serial, parallel, and hybrid (parallel-serial) connection, and suggested that the overall efficiency of DMU could be estimated by the weighted average of efficiency of all sub-DMUs, making it easier to identify the characteristics of sub-DMUs with higher weights. Tone and Tsutsui [40] proposed the network slack-based measure (NSBM), which addresses intermediate measures directly in the objective function for assigning an efficiency score. The performance score calculation by the SBM approach was based on the slacks of each variable. It was possible to identify the adjustments in the input and output simultaneously to identify inefficient DMUs.
The sustainable performance model we propose, with a serial connection between energy use and energy productivity process, is illustrated in Figure 1. The regional/provincial sustainable system was treated as a DMU and was decomposed into energy use and energy productivity processes. These network structures with serial connections in this empirical study were modified into a general network DEA. In the energy use stage, a regional sustainable system consumed m inputs (e.g., population and investment in energy industry) to create desirable output (e.g., electricity consumption) and undesirable output (e.g., coal, oil, and natural gas consumption). In the energy productivity stage, desirable output (e.g., electricity consumption) and undesirable output from the energy use stage were used to satisfy the energy need for economic activities, and desirable output (e.g., regional GDP) and its by-product with undesirable output (e.g., CO2 emission) were produced. The objective function of overall sustainable performance based on the NSBM approach is defined in Equation (1) as follows:
where the superscripts and denoted the energy use stage and energy productivity stage, respectively, and indicates the intermediate output. With regard to the free linking constraints imposed on this model, we assumed that the output of the previous stage was the same as the input of the following stage. Moreover, the weight for each stage is user-specified in order to observe the specific sustainable performance of each region. In our setting, each stage’s weight was set to 0.5.
4.2. General Leontief Framework for Input-Output Analysis
The input-output (I-O) model introduced by Leontief [41] is used to measure the economic effects of exogenous social, environmental, and economic factors, and has been widely applied in academic, industrial, and governmental economic analysis [42]. The three crucial factors in the basic Leontief I-O model are: economic output, input coefficient, and final demand of each sectors within a specific economic system. The Leontief I-O model can be classified into the demand-side I-O model and the supply-side I-O model [43]. We adopted this model to estimate the maximum economic gain of exogenous energy policy—the investment in renewable energy infrastructure—in Guangdong in the short-term from 2016 to 2020. According to the framework of the demand-side Leontief I-O model, total gross output in sector , denoted by , can be expressed as:
where is the intermediate input produced by sector for producing the final product of sector ; is the input coefficient indicating direct consumption effect, i.e., the quantitative relationship between the intermediate input and the final product from sector , under the assumption of constant technical efficiency, as shown in Equation (3).
We rewrote Equation (2) in matrix form:
where is a direct input coefficient matrix defined as technical coefficient above; is an identity matrix; is a final demand matrix, ; is called the Leontief inverse matrix or input-output matrix; and is also a input coefficient matrix that combines the direct and indirect input coefficients to form the complete consumption coefficient matrix. The multipliers in the Leontief inverse matrix are also the core of the demand-side Leontief I-O model, depicting the relationship between the final demand and the total gross output. Deviations from final demand were treated as an exogenous impact on the inter-sectoral structure. When the final demand on a specific sector/industry changed as the exogenous shock occurred, we then observed the changes in total gross output of the economic system from the Leontief I-O model.
The goal of the analysis of the linkage effect was to quantify the causation power among sectors by the input and output activities under a given economic system [15]. The linkage effect of each sector was separated into backward and forward linkage effects. The sensitivity coefficient (SC) is the standardized forward linkage effects, whereas the influence coefficient (IC) is the standardized backward effect. IC and SC were calculated using Equations (5) and (6), respectively.
Since the value-added (GDP) output in each sector was also an important indicator to evaluate the macro and micro economic effects of economic policies, it was captured in Equation (7) as follows:
where is the value-added coefficient of each sector, measured by from the input-output table; is the economic value-added of sector ; and is the gross output/input of sector .
4.3. General RAS Method
Though Guangdong’s input-output table is updated every five years, its regional inter-industrial structure can change drastically within that time frame. As demonstrated in Table 2, the annual growth rate of Guangdong’s GDP slowed from 13.8% to 8.6%, suggesting some structural change within. Therefore, the 2012 Guangdong’s input-output table may not be suitable for estimating the potential economic impacts of low-carbon energy infrastructure investment over the 13th Five-Year period. The traditional method may involve using time-series data estimation to construct Guangdong’s input-output table with forecasted values; however, we opted for the RAS method to extract more information from the 2012 Guangdong input-output table and to simulate the dynamic change in the inter-industrial structure in Guangdong for the past 5 years. The RAS method proposed by Bacharch [44] is a biproportional method for adjustment. With recursive iteration estimation obtained from the RAS method, it was possible to identify the adjustment parameters in order to obtain the synchronized input-output table using known data from the intermediate inputs and output (demand) from the 2012 Guangdong’s input-output table. In this paper, we adopted the original recursive iteration estimation proposed by Stone and Brown [37]. An extensive collection of studies explored other algorithms in the RAS method [45,46,47,48] and may be of interest for future research.
To gain insights into the dynamic change in the inter-industrial structure in Guangdong, we used its 2012 and 2007 input-output table [49], denoted and , respectively. The input coefficient matrix of was and the input coefficient matrix of was . To demonstrate the mechanical adjustment procedure, the original RAS method was used, as shown in Equation (8):
where and are the two constrained conditions, is the intermediate output (demand) of , and is the intermediate input of . Equation (8) can be rewritten as:
where and are the two adjustment vectors by sector, and were crucial parameters to predict future input coefficient matrix. Note that there was an underlying assumption that the dynamic change in the following five years (2016–2020) would be similar to that of the previous five years (2007–2012).
5. Empirical Results
As stated above, governments today are concerned with sustainable performance in addition to the traditional economic gain. We also wanted to know whether the environmental outcome had actually met the expectations of the implemented sustainability policy. We used the two-stage Network DEA model and Leontief I-O model to evaluate the sustainable performance of regional economic system in China and the impacts of sustainable policy: the effects of low-carbon energy infrastructure investment on the sustainability performance of Guangdong.
5.1. Data Collection
We used the two-stage Network DEA model to evaluate the sustainable performance at the regional/provincial level in China for the period between 2007 and 2016 as the benchmark scenario. Given data availability, we excluded Tibet from this study. The sustainable performance model was the same as shown in Figure 1, where the inputs of the energy use process were the population of each region/province and the amount of investment in the energy industry. The intermediate variables employed as links between energy use and the productivity process were the amounts of coal, oil, natural gas, and electricity consumption. The desirable output of energy productivity process was the regional GDP. The undesirable output was CO2 emissions.
The data on the amount of regional population and regional GDP were collected from the China Statistical Yearbook [23]. The data for the amounts of energy consumption were drawn from the China Energy Statistical Yearbook. The data on CO2 emission were calculated from the regional consumption of coal, oil, natural, and electricity and their corresponding CO2 emission coefficients according to the Intergovernmental Panel on Climate Change (IPCC) Guideline for National Greenhouse Gas Inventories [50], as shown in Equation (10):
where denotes the CO2 emission from each type of energy, such as coal, crude oil, natural gas, and electricity in year t; denotes the total consumption of each type of energy in year t; denotes the net calorific value of each type of energy; denotes the carbon emission factor of each type of energy; and denotes the carbon oxidation factor of each type of energy. The constant values of 44 and 12 are the molecular weights of CO2 and carbon, respectively. A summary of the statistics of the variables in the two-stage network DEA model are reported in Table 3.
The input-output analysis was used to identify the importance of the energy sector of the regional economy. There were two sets of the original input-output data from Ministry of Statistics of Guangdong [51] in the past decade: Guangdong’s 42 industrial sectors’ input-output table for 2007 (i.e., Guangdong 2007) and Guangdong’s 42 industrial sectors’ input-output table for 2012 (i.e., Guangdong 2012). However, both datasets were inadequate for assessing the economic impact of modern energy infrastructure investment on the development of Guangdong’s economy over the period of 2016 to 2020, due to the omission of technological progress and the changes in sector classification. For the economic analysis using the Leontief I-O model, we matched and adjusted for different definitions of industrial sectors in the two input-output tables from the Ministry of Statistics of Guangdong [50], and constructed a modified I-O table structure of 41 industrial sectors for use in this paper, including the Electricity and Heat Production sector, as illustrated in code 23 in Table 4.
To proceed, we first obtained the influence coefficient and sensitivity coefficient of the 41 sectors that we complied from Guangdong’s 2012 and 2007 official input-output tables in order to understand the inter-sectoral relations of the regional economic system. The RAS method was used to capture the dynamic technological inter-industrial changes in Guangdong between 2007 and 2012, which were used, in turn, to estimate Guangdong’s 2017 input coefficient matrix with 41 sectors, and finally to build a Leontief I-O model to assess the economic effect of modern renewable energy infrastructure investment on Guangdong’s economy during 2016 to 2020.
5.2. Sustainable Performance Analysis of Regional/ProvincialEconomic System
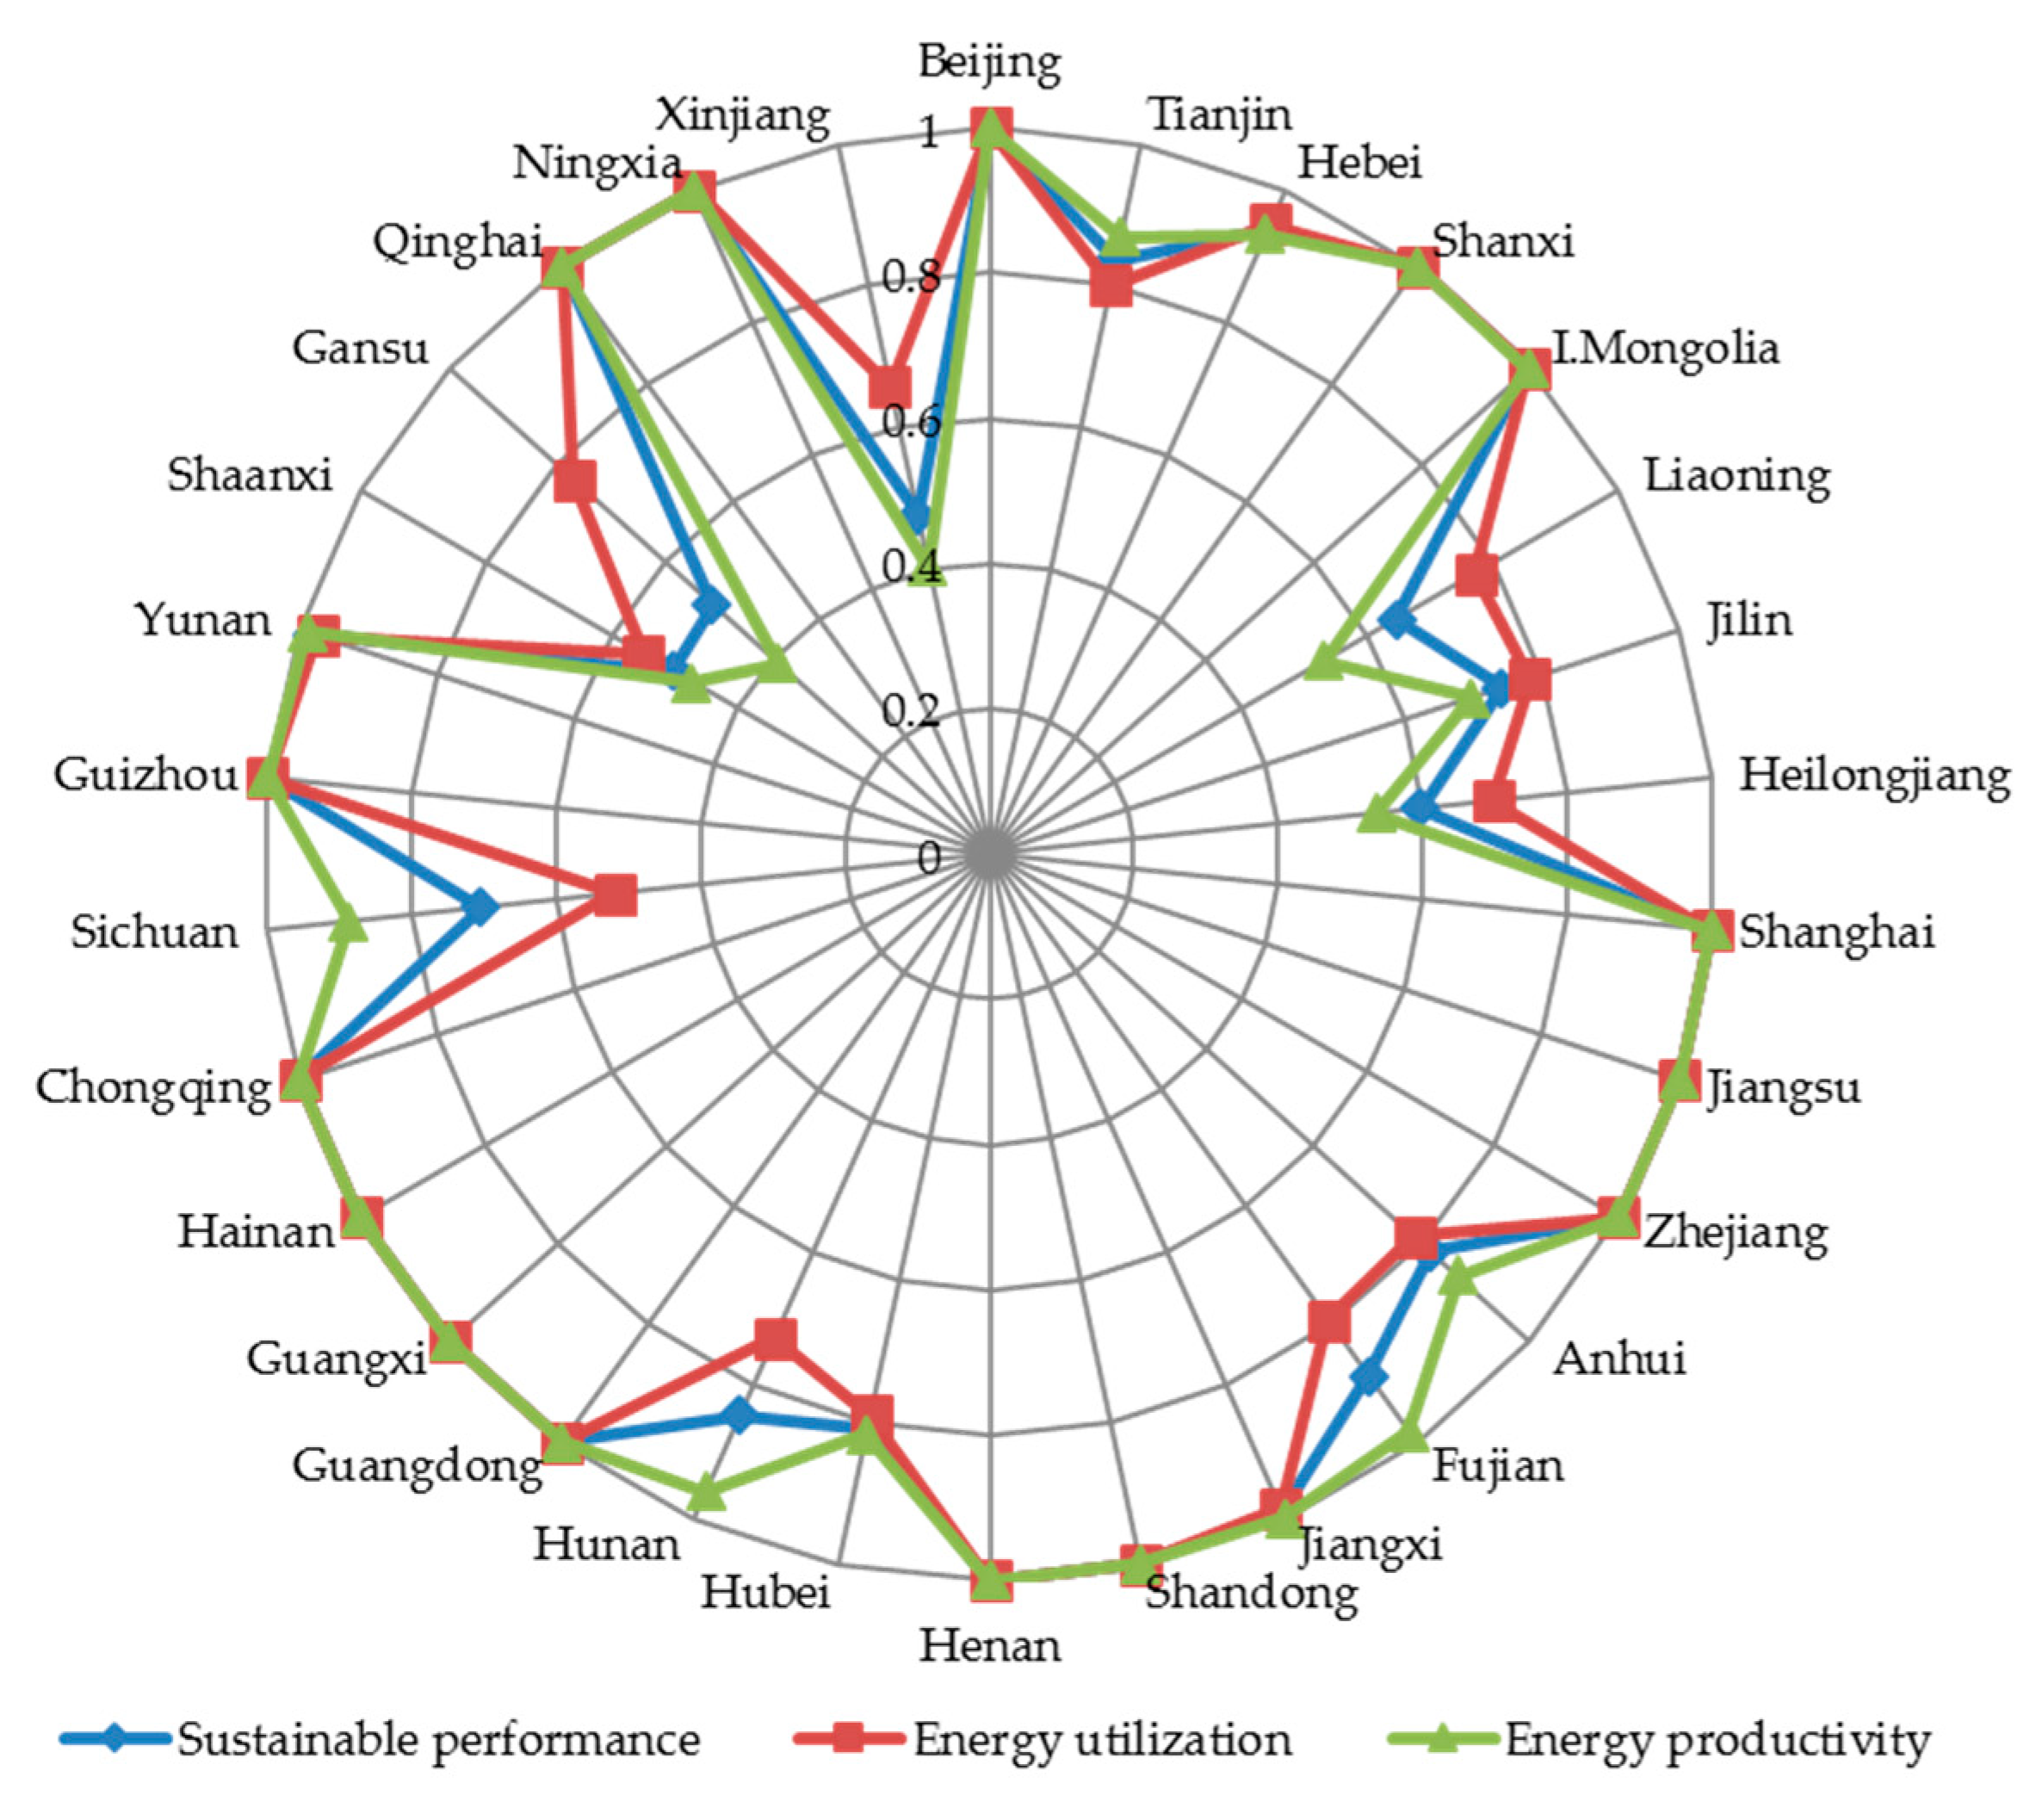
One of our research objectives was to evaluate the sustainable performance of regional/provincial economies. This information could be a crucial measure to guide the government through the current process regional/provincial sustainable development. Table 5 demonstrates the 30 regions/provinces (i.e., DMUs) and their sustainable performance scores from 2007 to 2016. Note that a performance score of 1 means that the region/province was efficient in the performance evaluation of regional sustainable development, and its efforts were greater than in other regions/provinces. The average of the sustainable performance score was roughly 0.876 in 2007–2016, and in 2011, 2014, and 2016, the annual performance score was above average. We also observed that most regions/provinces improved their sustainability performance. Thirteen regions/provinces were identified as efficient DMUs for last decade: Beijing, Shanxi, Shanghai, Jiangsu, Zhejiang, Henan, Guangdong, Guangxi, Hainan, Chongqing, Guizhou, Qinghai, and Ningxia. Note that Hebei showed a drastic decline after 2014. The sustainable performance of Heilongjiang, Anhui, Sichuan, Shaanxi, and Gansu was significantly lower than the average score and other regions/province in the long term. Figure 4 shows the sustainable performance score for all regions/provinces. The score can be further decomposed into energy use and energy productive performance score. From Figure 4, we can infer that, in general, a lower sustainable performance may be associated with lower energy productivity performance in a region. There were at least seven regions that showed this pattern. The above findings indicate that a low-carbon energy/electricity supply mix was essential for improving sustainability and supporting economic growth on both the national and regional levels.
5.3. Economic Impact Analysis of Low-Carbon Energy Infrastructure Investment
5.3.1. Importance of Energy Sector on Guangdong’s Economic System
The influence coefficient represents the relation between a final product and its intermediate input: the increased output of some goods would increase the amount of intermediate goods needed from other sectors. The increase in demand of a certain sector could have a pulling effect by boosting the final gross output of the economy. The sensitivity coefficient indicates the degree of a sector that is increasing their output as the intermediate goods that satisfying an increase in demand from other sectors. The influence coefficient and sensitivity coefficient of each sector in Guangdong were measured using Equations (5) and (6), respectively, as demonstrated in Table 6. In 2012, the influence coefficient of Electricity and Heat Production (one of the energy sectors) was relatively low (0.864), while its sensitivity coefficient was relatively large (2.162).
Logically, when demand in other sectors rises, the Electricity and Heat Production sector must also increase their production (electricity). When low-carbon energy is the main environmental policy, the demand for more renewable energy capacity increases in order to satisfy the overall electricity demand. As society has become more aware of environment-friendly options, the demand for clean energy has continued to grow. During 2016–2020, the 13th Five-Year Plan period, Guangdong province has had the foresight to invest in the infrastructure of modern energy systems. In addition to stabilizing the electricity supply to meet the growing demand from the booming economy, renewable energy, such as solar and wind, were also considered new sources of electricity supply. Through diversification of the electricity portfolio and gradual reduction in carbon emissions associated with electricity production, the Guangdong government aimed to effectively reduce the emissions of low-level greenhouse gases to meet both the local and national reduction targets.
Table 6 summarizes the economic value-added (one of the GDP calculation methodologies) coefficient of each sector in Guangdong. The economic value-added coefficients of all sectors were between 36% and 38%. The economic value-added coefficients of Electricity and Heat production sector were 30.03% and 26.03% in 2007 and 2012, respectively, which was lower than the overall average level. As output from the Electricity and Heat production sector is the intermediate good for the rest of the sectors, the investment in renewable energy infrastructure with mass expenditures may create direct and indirect demands for infrastructure construction in related sectors. Notably, when compared to traditional fossil fuels with high energy conversion efficiency, the capacity factor of renewable energy is perhaps only one-quarter, and its efficiency is also bounded by weather and/or the size of land. Thus, a gradual downward trend in the coefficient of the economic value-added coefficient in the Electricity and Heat production sector would be expected.
Gold and Uranium Mining, Non-Metallic Mineral, Construction, Water Production, and Scientific Technology ranked higher in the sectoral income impacts of the investment in the energy sector (i.e., Electricity and Heat Production sector), as demonstrated in the first two columns of Table 6. It could be inferred from the results that the low-carbon infrastructure investment of Guangdong would increase the final demand for the Electricity and Heat production sector, which, in turn, would translate into economic benefits for other related industries resulting from increased output.
5.3.2. Estimated Economic Impact of Low-Carbon Energy Infrastructures Investment
The 2017 Guangdong Implementation Plan for Energy Structure Adjustment during the 13th Five-Year Plan laid out the addition of new power plants during the period of 2016–2020, with a planned capacity of 36,000 MW, to meet the growth in energy demand due to rapid industrialization and urbanization, as well as to transform its energy portfolio in order to reduce GHG emissions. As shown in Table 7, power supply would be transformed to low-carbon energy such as natural gas, nuclear, and renewable energies in the future, with only some exceptions for previously approved coal-fired power plants. The capacity investment in nuclear and renewable energy would exceed more than half of 36,000 MW to simultaneously improve energy independence and low-carbonization.
According to the “Capital Cost Estimates for Utility Scale Electricity Generating Plants” report published by the U.S Energy Information Administration [50], the average overnight capital cost of an Ultra Supercritical Coal facility is $3636 USD/Kw, $1104 USD/Kw for Advanced Natural Gas Combined Cycle, $5945 USD/Kw for Advanced Nuclear, $6628 USD/kW for Offshore Wind, and $2671 USD/kW for Photovoltaic–Fixed. In Guangdong, generally, the overall project investment would amount to 783 billion RMB during the 13th Five-Year Plan period, as shown in Table 6.
In this paper, we used the RAS method to evaluate the technological evolution of the overall productivity system in Guangdong between 2007 and 2012 and, consequently, to estimate the inter-sectoral input coefficient matrix, representing the linkages between the Electricity and Heat production sector and other sectors for 2016 to 2020. The estimations were then used to establish the Leontief demand-side I-O model to evaluate the economic impact of energy infrastructure investment in Guangdong. Using Guangdong’s 2012 input-output table, we set two constraint vectors: (1) the intermediate demand/output (vector , i.e., the total output minus the final demand) and (2) the intermediate input (vector , i.e., the total inputs minus value-added) for each sector. The RAS method was used to adjust the elements of the 2007 Guangdong input-output table, making the row-sum and column-sum of 2007 Guangdong’s input coefficient matrix equal to the two constraint vectors. We finally obtained the values of vectors and after 21 recursive iterations for each sector. These vectors demonstrated the estimated dynamic change in the inter-industrial structure of Guangdong’s economy, which in turn were used to estimate the input coefficient matrix of Guangdong’s input-output table for the future five years (2016 to 2020). The last two columns of Table 6 list the parameters of vector R and vector S obtained from the RAS method.
Based on the Leontief I-O model, we were able to simulate the impacts of sustainability policies in Guangdong province from 2016 to 2020. The input coefficient matrix was updated using the RAS method in order to quantify the estimated inter-industrial structure in Guangdong. The estimated capital expenditure on low-carbon energy infrastructure projects is demonstrated in Table 7. The average investment amount in low-carbon energy infrastructure is seen as the variation in the final demand on the Electricity and Heat production sector.
Changes in the total output and economic value-added (GDP) of the divisional and macro-economic categories are shown in Table 8. The investment in the power supply infrastructure would increase the overall economic output in Guangdong province by an average of 1.37% annually, while the average change in GDP was approximately 1.16%. In addition, we observed that the industrial division benefitted the most from this investment, as its total economic output and GDP increased by an average of approximately 2.62% and 1.58%, respectively. The average change in total economic output of the agricultural sector was 0.32%, while that of the service sector increased by an average of approximately 0.71%. The GDP as a whole increased 0.71% on average.
5.4. Influence of Low-Carbon Energy Infrastructure Investment on the Sustainable Performance of Guangdong
In this research, we worked to identify the impact of reform policy on the sustainable performance evaluation at the regional/provincial level by using comparative analysis between two scenarios: (1) the business-as-usual (BAU) scenario, where no policy effect was considered; the possible sustainable performance of each region/province was estimated based on the outcome from the last column of Table 5 (i.e., benchmark scenario) assuming the present trend continued. (2) In the progressive-sustainable-policy (PSP) scenario, we re-evaluated the possible sustainable performance of each region/province as if the low-carbon energy infrastructure investment occurred, with greater low-carbon electricity capacity, thus greatly benefitting economic growth and CO2 reduction, based on the estimation from Table 8 using the Leontief model. As shown in Table 9, compared with the BAU scenario, the PSP scenario showed that low-carbon energy infrastructure investment in Guangdong would strengthen its sustainability, as its sustainable performance score in PSP is higher than other regions/provinces (DMUs) who scored below 1. Although Guangdong’s performance score remained 1 across the three scenarios, it could be inferred that, if Guangdong chose to not invest in low-carbon development, then its performance score could be, when comparing to other DMUs who had continued their efforts in sustainability, much lower than 1. We could then say that the investment in low-carbon energy infrastructure helped maintain the sustainable performance of Guangdong, providing economic momentum and environmental protection. This confirmed the efficacy of investment in low-carbon energy supply.
Together with the performance score, we looked into the possible economic effect and CO2 abatement when electricity usage rose under a low-carbon energy supply portfolio, which had a lower emission coefficient. The CO2 emissions were considerably reduced. Finally, we substituted the investment in the energy sector, energy usage, GDP, and CO2 emissions in Guangdong with the estimates from the previous section and its PSP scenario parameters, while controlling other DMUs parameters as if in the BAU scenario. Then, we re-ran our two-stage Network DEA model to determine if Guangdong’s performance score had changed or maintained its competitive position in China. Guangdong retained its perfect score throughout our tests, confirming its competitive advantage among others in sustainable development, and concluding our analysis.
6. Conclusions
This paper proposed a two-stage Network DEA model to measure the sustainable performance of regional/provincial economies in China. In our setup, both undesirable intermediates and outputs were incorporated in the model specifications. Sustainable performance was decomposed into energy use and productivity performance, in order to incorporate more valuable information into the model. Guangdong’s low-carbon energy infrastructure investment was treated as the progressive sustainable policy, which was also embedded in the Leontief I-O model to evaluate its economic and environmental impacts. Finally, we used the two-stage Network DEA model to provide inferences about policy efficacy by comparing the BAU and PSP scenarios. Our main conclusions and policy suggestions are as follows.
First, 13 regions/provinces were evaluated for their sustainable performance during 2007–2016. Heilongjiang, Anhui, Sichuan, Shaanxi, and Gansu had sustainable performance scores that were significantly below average in the long-term. By decomposing the sustainable performance into energy use and productivity performance, it could be inferred that low-carbon electricity could support both economic growth and GHG emissions control.
Second, in the process of regional economic growth, the demand for energy resources cannot be overlooked. One of the advantages of the Leontief input-output model is its ability to assess the possible maximum economic benefits in the short-term. As we demonstrated, the energy infrastructure investment increased the final demand of other related manufacturing sectors, whose services were required for the completion of infrastructure construction. On average, the GDP of Guangdong province would change by approximately 1.16% annually, combined with the accumulative, divisional economic impact on other sectors, such as agriculture, industrial, and service. The GDP stimulation of the agricultural division would increase to 0.32% on average, and would create about a 1.58% change in the GDP of the industrial division on average, which would boost the GDP of the services sector by about 0.71% on average.
Third, Guangdong province still appeared to be more efficient than other regions/provinces in terms of its sustainable performance, as it had included sustainable development as an objective in its policy. We then confirmed that investment in low-carbon energy infrastructure could not only serve as an exogenous driving force of the regional economy, but could also minimize the pressure of CO2 emissions.
In summary, this study proposed a two-stage Network DEA model to evaluate the sustainable performance of regions/provinces in China. The results could serve as a general guideline for policy makers to prioritize energy production efficiency. We confirmed that the low-carbon energy infrastructure investment proposed by Guangdong would maintain its competitive advantage in terms of sustainable development compared to other regions/provinces. We suggest that future studies could consider using the variables selection procedure for sustainable performance evaluation at the regional level in China to improve the discriminative ability of the DEA model, as well as to gain more insight into policy directives. Finally, if provided with more information about capital expenditure on different types of low-carbon power plants in the input-output analysis, the evaluation precision could be higher.
Author Contributions
The manuscript was produced through contributions of both authors. T.-Y.L. (Tzu-Yu Lin) designed the research framework and wrote the article; S.-H.C. (Sheng-Hsiung Chiu) provided the method and finished the empirical work.
Funding
This research received no external funding.
Acknowledgments
The authors are grateful to the anonymous referees for valuable comments and suggestions. Any errors are entirely due to the authors.
Conflicts of Interest
The authors declare no conflict of interest.
References
- Hu, J.L.; Chang, M.C.; Tsay, H.W. The congestion total-factor energy efficiency of regions in Taiwan. Energy Policy 2017, 110, 710–718. [Google Scholar] [CrossRef]
- International Energy Agency. World Energy Outlook 2017; International Energy Agency: Paris, France, 2017; Available online: http://www.iea.org/weo2017/ (accessed on 6 December 2018).
- Hu, J.L.; Lee, Y.C. Efficiency three industrial waste abatements for regions in China. Int. J. Sustain. Dev. World 2008, 15, 132–144. [Google Scholar] [CrossRef]
- Bian, Y.; Liang, N.; Xu, H. Efficiency evaluation of Chinese regional industrial systems with undesirable factors using a two-stage slacks-based measure model. J. Clean. Prod. 2015, 87, 348–356. [Google Scholar] [CrossRef]
- Xie, B.C.; Wamg, J.Y.; Ma, J.J.; Duan, N. Efficiency evaluation of China’s provincial power systems based on the dynamic network slack-based measure model. J. Clean. Prod. 2018, 174, 650–660. [Google Scholar] [CrossRef]
- Wang, H.; Ang, B.W.; Wang, Q.W.; Zhou, P. Measuring energy performance with sectoral heterogeneity: A non-parametric frontier approach. Energy Econ. 2017, 62, 70–78. [Google Scholar] [CrossRef]
- Renewable Energy Policy Network for the 21 Century. Renewables 2017 Global Status Report; Renewable Energy Policy Network for the 21 Century (REN21): Bonn, Germany, 2017; Available online: http://www.ren21.net/gsr-2017/ (accessed on 6 December 2018).
- National Development & Reform Commission of China. China’s Intended Nationally Determined Contribution: Enhanced Action on Climate Change; National Development & Reform Commission of China: Beijing, China, 2015. Available online: http://zys.ndrc.gov.cn/xwfb/201506/t20150630_710182.html (accessed on 6 December 2018).
- Zhou, P.; Ang, B.W. Linear programming models for measuring economy-wide energy efficiency performance. Energy Policy 2008, 36, 2911–2916. [Google Scholar] [CrossRef]
- Zhou, P.; Ang, B.W.; Wang, H. Energy and CO2 emission performance in electricity generation: A non-radial directional distance function approach. Eur. J. Oper. Res. 2012, 221, 625–635. [Google Scholar] [CrossRef]
- Chen, C.M. A critique of non-parametric efficiency in energy economics studies. Energy Econ. 2013, 38, 146–152. [Google Scholar] [CrossRef]
- Yu, M.M.; Lee, B.C.Y. Efficiency and effectiveness of service business: Evidence from international tourist hotels in Taiwan. Tour. Manag. 2009, 30, 571–580. [Google Scholar] [CrossRef]
- Chiu, S.H.; Lin, T.Y. Performance evaluation of Taiwanese international tourist hotels: Evidence from a modified NDEA model with ICA technique. Technol. Econ. Dev. Econ. 2018, 24, 1560–1580. [Google Scholar] [CrossRef]
- Chang, Y.T.; Shin, S.H.; Lee, T.W. Economic impact of port sectors on South African economy: An input-output analysis. Transp. Policy 2014, 35, 333–340. [Google Scholar] [CrossRef]
- Lee, M.K.; Yoo, S.H. The role of transportation sectors in the Korean national economy: An input-output analysis. Trans. Res. Part A Policy Pract. 2016, 93, 13–22. [Google Scholar] [CrossRef]
- Nakano, S.; Arai, S.; Washizu, A. Development and application of an inter-regional input-output table for analysis of a next generation energy system. Renew. Sustain. Energy Rev. 2018, 82, 2834–2842. [Google Scholar] [CrossRef]
- Sabiroglu, I.M.; Bashirli, S. Input-output analysis in an oil-rich economy: The case of Azerbaijan. Resour. Policy 2012, 37, 73–80. [Google Scholar] [CrossRef]
- Zou, Q.; Liu, X. Economic effects analysis of seawater desalination in China with input-output technology. Desalination 2016, 380, 18–28. [Google Scholar] [CrossRef]
- Nakano, S.; Murano, A.; Washizu, A. Economic and Environmental effects of utilizing unused woody biomass. J. Jpn. Inst. Energy 2015, 94, 522–531. [Google Scholar] [CrossRef]
- Sugino, M.; Morita, M.; Iwata, K.; Arimura, T. Multiplier impacts and emission reduction effects on Joint Crediting Mechanism: Analysis with a Japan and international disaggregated input-output table. Environ. Econ. Policy Stud. 2017, 19, 633–657. [Google Scholar] [CrossRef]
- Varela-Vázquez, P.; Sánchez-Carreria, M.C. Estimation of the potential effects of offshore wind on the Spanish economy. Renew. Energy 2017, 111, 815–824. [Google Scholar] [CrossRef]
- Okkonen, L.; Lehtonen, O. Local, regional and national level of the socioeconomic impacts of a bio-oil production system? A case in Lieksa, Finland. Renew. Sustain. Energy Rev. 2017, 71, 103–111. [Google Scholar] [CrossRef]
- National Bureau of Statistics of the People’s Republic of China. China Statistical Yearbook 2017; National Bureau of Statistics: Beijing, China, 2017. (In Chinese)
- Ministry of Statistics of Guangdong Province. Statistical Yearbook of Guangdong Province 2017; Ministry of Statistics of Guangdong Province: Guangzhou, China, 2017. (In Chinese)
- Guo, X.; Lu, C.C.; Lee, J.H.; Chiu, Y.H. Applying the dynamic DEA model to evaluate the energy efficiency of OECD countries and China. Energy 2017, 134, 392–399. [Google Scholar] [CrossRef]
- He, Q.; Han, J.; Mi, Z.; Zhao, H.; Zhang, Q. The comprehensive environmental efficiency of socioeconomic sectors in China: An analysis based on a non-separable bad output SBM. J. Clean. Prod. 2018, 176, 1091–1110. [Google Scholar] [CrossRef]
- Wu, T.H.; Chen, Y.S.; Shang, W.; Wu, J.T. Measuring energy use and CO2 emission performances for APEC economies. J. Clean. Prod. 2018, 183, 590–601. [Google Scholar] [CrossRef]
- Galagedera, D.U.A.; Roshdi, I.; Fukuyama, H.; Zhu, J. A new network DEA model for mutual fund performance appraisal: An application to U.S. equity mutual funds. Omega 2018, 77, 168–179. [Google Scholar] [CrossRef]
- Lin, T.Y.; Chiu, S.H. Using independent component analysis and network DEA to improve bank performance evaluation. Econ. Model. 2013, 32, 608–616. [Google Scholar] [CrossRef]
- Chiu, S.H.; Lin, T.Y.; Yang, H. Measuring the Sustainable Performance of Industrial and Commercial Service Industries in Taiwan. Asian J. Econ. Model. 2018, 6, 391–402. [Google Scholar]
- Yeh, T.L.; Chen, T.Y.; Lai, P.Y. A comparative study of energy utilization efficiency between Taiwan and China. Energy Policy 2010, 2386–2394. [Google Scholar] [CrossRef]
- Suzuki, S.; Nijkamp, P. An evaluation of energy-environment-economic efficiency for EU, APEC and ASEAN countries: Design of a Target-Oriented DFM model with fixed factors in Data Envelopment Analysis. Energy Policy 2016, 100–112. [Google Scholar] [CrossRef]
- Iftikhar, Y.; Wang, Z.; Zhang, B.; Wang, B. Energy and CO2 emissions efficiency of major economies: A network DEA approach. Energy 2018, 147, 197–207. [Google Scholar] [CrossRef]
- Faramarzi, G.R.; Khodakarami, M.; Shabani, A.; Saen, R.F.; Azad, F. New network data envelopment analysis approaches: An application in measuring sustainable operation of combined cycle power plants. J. Clean. Prod. 2018, 108, 232–246. [Google Scholar] [CrossRef]
- Byun, J.; Park, H.W.; Hong, J.P. An international comparison of competitiveness in knowledge services. Technol. Forecast. Soc. Chang. 2017, 114, 203–213. [Google Scholar] [CrossRef]
- Wydra, S. Production and Employment Impacts of Biotechnology—Input–output Analysis for Germany. Technol. Forecast. Soc. Chang. 2011, 78, 1200–1209. [Google Scholar] [CrossRef]
- Stone, R.; Brown, A. A Programme for Growth: A Computable Model of Economic Growth; Chapman & Hall: London, UK, 1962. [Google Scholar]
- Färe, R.; Grosskopf, S. Network DEA. Socio-Econ. Plan. Sci. 2000, 34, 35–49. [Google Scholar] [CrossRef]
- Kao, C. Efficiency decomposition in network data envelopment analysis: A relational model. Eur. J. Oper. Res. 2009, 192, 949–962. [Google Scholar] [CrossRef]
- Tone, K.; Tsutsui, M. Network DEA: A slacks-based measure approach. Eur. J. Oper. Res. 2009, 197, 243–252. [Google Scholar] [CrossRef] [Green Version]
- Leontief, W.W. Input-Output Economics; Oxford University Press: Oxford, UK, 1966. [Google Scholar]
- Hughes, D.W. Policy Uses of Economic Multiplier and Impact Analysis. Choices 2003, 18, 25–29. [Google Scholar]
- Miller, R.; Blair, P. Input-Output Analysis: Foundations and Extensions; Prentice-Hall: Upper Saddle River, NJ, USA, 1985. [Google Scholar]
- Bacharach, M. Estimating nonnegative matrices from marginal data. Int. Econ. Rev. 1965, 6, 294–310. [Google Scholar] [CrossRef]
- Jackson, R.; Murray, A. Alternative input-output matrix updating formulations. Econ. Syst. Res. 2004, 16, 135–148. [Google Scholar] [CrossRef]
- Lenzen, M.; Gallego, B.; Wood, R. Matrix balancing under conflicting information. Econ. Syst. Res. 2009, 21, 23–44. [Google Scholar] [CrossRef]
- Varela-Vázquez, P.; Sánchez-Carreria, M.C. Socioeconomic impact of wind energy on peripheral regions. Renew. Sustain. Energy Rev. 2015, 50, 982–990. [Google Scholar] [CrossRef]
- Hiramatsu, T.; Inoue, K.; Kato, Y. Estimation of interregional input–output table using hybrid algorithm of the RAS method and real-coded genetic algorithm. Transp. Res. Part E Logist. Transp. Rev. 2016, 95, 385–402. [Google Scholar] [CrossRef]
- Intergovernmental Panel on Climate Change. IPCC Guideline for National Greenhouse Gas Inventories. 2006. Available online: http://www.ipcc-nggip.iges.or.jp/public/2006gl/vol2.html (accessed on 6 December 2018).
- U.S. Energy Information Administration. Capital Cost Estimates for Utility Scale Electricity Generating Plants; U.S. Energy Information Administration: Washington, DC, USA, 2016. Available online: https://www.eia.gov/analysis/studies/powerplants/capitalcost/ (accessed on 6 December 2018).
- Ministry of Statistics of Guangdong Province. The Input-Output Table. Available online: http://www.gdstats.gov.cn/ (accessed on 6 December 2018).
Figure 1.
Two-stage sustainable performance evaluation model.

Figure 2.
Two conceptual procedures of economic analysis model.

Figure 3.
The proposed research design process.

Figure 4.
Regional sustainable performance, energy use, and productivity.

Table 1.
Annual statistics of regional gross domestic product (GDP) in Guangdong province in China.
| Year | China’s GDP | Guangdong’s GDP (%) | Rank |
|---|---|---|---|
| 2007 | 270,232 | 31,777 (11.76) | 1 |
| 2008 | 319,516 | 36,797 (11.52) | 1 |
| 2009 | 349,081 | 39,493 (11.31) | 1 |
| 2010 | 413,030 | 46,036 (11.15) | 1 |
| 2011 | 489,301 | 53,246 (10.88) | 1 |
| 2012 | 540,367 | 57,148 (10.58) | 1 |
| 2013 | 595,244 | 62,475 (10.50) | 1 |
| 2014 | 643,974 | 67,810 (10.53) | 1 |
| 2015 | 689,052 | 72,813 (10.57) | 1 |
| 2016 | 743,586 | 79,512 (10.69) | 1 |
| 2007–2011 | 16.00% | 13.8% | |
| 2012–2016 | 8.31% | 8.6% |
Source: National Bureau of Statistics of the People’s Republic of China [23]; Note: The table in parentheses provides the share of national gross domestic product; Monetary unit: Billion RMB.
Table 2.
Annual statistics of energy indicators in Guangdong province in China.
| Year | Guangdong GDP | Energy Consumption | Energy Intensity | Electricity Ratio |
|---|---|---|---|---|
| 2007 | 31,777 | 21,427 | 0.674 | 49.3% |
| 2008 | 36,797 | 22,672 | 0.616 | 48.5% |
| 2009 | 39,493 | 23,943 | 0.606 | 46.3% |
| 2010 | 46,036 | 24,595 | 0.534 | 50.4% |
| 2011 | 53,246 | 26,224 | 0.492 | 51.5% |
| 2012 | 57,148 | 26,764 | 0.468 | 52.2% |
| 2013 | 62,475 | 27,666 | 0.443 | 51.0% |
| 2014 | 67,810 | 28,670 | 0.423 | 53.5% |
| 2015 | 72,813 | 29,387 | 0.404 | 52.2% |
| 2016 | 79,512 | 30,730 | 0.386 | 52.7% |
| 2007–2011 | 13.8% | 5.18% | ||
| 2012–2016 | 8.6% | 3.51% |
Source: Statistical Yearbook of Guangdong Province in 2017 [24]; Note: Energy intensity = Energy consumption/Guangdong’s GDP; Electricity ratio = electricity consumption/energy consumption; Monetary unit: Billion RMB; Energy measurement unit: 10,000 tons of standard coal equivalent (SCE).
Table 3.
Summary statistics of variables by region/province in China from 2007 to 2016.
| Region | Input | Intermediate | Output | |||||
|---|---|---|---|---|---|---|---|---|
| Population | Investment | Coal | Oil | Natural Gas | Electricity | GDP | CO2 | |
| 10 Thousand People | 100 Million RMB | Ton | Ton | 10 Thousand Liters | 10 Thousand KWH | 100 Million RMB | Ton | |
| Beijing | 1996.800 | 182.567 | 22,527,400.000 | 21,019,210.000 | 938,810.000 | 8,424,930.000 | 17,117.511 | 181,088,187.148 |
| (176.062) | (42.980) | (8,144,338.030) | (1,406,057.136) | (374,529.775) | (1,178,514.123) | (5,341.145) | (5,144,546.993) | |
| Tianjin | 1368.400 | 534.029 | 54,674,440.000 | 20,695,940.000 | 352,550.000 | 6,801,730.000 | 11,751.176 | 221,444,433.928 |
| (159.903) | (114.718) | (6,083,832.002) | (4,609,550.433) | (205,379.590) | (1,221,020.672) | (4,433.681) | (34,329,312.980) | |
| Hebei | 7230.100 | 1103.123 | 357,184,250.000 | 25,360,420.000 | 411,380.000 | 28,212,150.000 | 23,808.046 | 984,739,390.945 |
| (186.666) | (464.364) | (37,479,721.435) | (3,770,530.528) | (213,594.849) | (5,018,572.991) | (6,541.122) | (122,250,404.627) | |
| Shanxi | 3563.300 | 1775.885 | 354,207,960.000 | 7,182,880.000 | 355,220.000 | 15,996,210.000 | 10,449.304 | 793,033,761.643 |
| (110.504) | (585.494) | (37,493,893.681) | (1,066,514.926) | (223,814.421) | (2,275,709.246) | (2,714.036) | (86,410,770.415) | |
| Inner Mongolia | 2480.900 | 2003.137 | 322,683,730.000 | 12,511,010.000 | 397,560.000 | 18,832,950.000 | 13,721.839 | 763,769,354.288 |
| (29.909) | (456.746) | (71,629,769.634) | (1,220,220.570) | (65,157.761) | (5,562,189.929) | (4,328.195) | (167,204,419.298) | |
| Liaoning | 4364.200 | 858.558 | 200,405,060.000 | 84,096,010.000 | 437,360.000 | 17,805,890.000 | 21,233.149 | 770,684,182.469 |
| (33.859) | (240.710) | (15,265,430.628) | (7,448,153.691) | (267,279.792) | (2,687,418.574) | (6,353.871) | (72,943,985.861) | |
| Jilin | 2743.900 | 657.888 | 102,525,440.000 | 15,583,460.000 | 190,620.000 | 5,959,710.000 | 10,585.466 | 280,277,095.062 |
| (8.800) | (133.420) | (12,066,302.601) | (1,104,421.078) | (54,040.125) | (775,861.967) | (3,462.742) | (29,663,908.816) | |
| Heilongjiang | 3825.500 | 838.181 | 128,373,230.000 | 30,608,100.000 | 330,860.000 | 7,835,330.000 | 12,061.160 | 384,019,973.012 |
| (11.712) | (186.006) | (14,296,532.257) | (2,588,812.438) | (28,531.978) | (937,128.687) | (3,184.450) | (37,708,942.229) | |
| Shanghai | 2312.100 | 186.219 | 60,428,910.000 | 42,768,710.000 | 557,890.000 | 13,024,070.000 | 19,684.166 | 343,600,283.467 |
| (130.366) | (55.722) | (5,333,567.051) | (4,220,540.898) | (203,115.996) | (1,360,568.614) | (5,087.374) | (23,737,868.596) | |
| Jiangsu | 7885.700 | 808.996 | 279,041,860.000 | 48,896,830.000 | 1,039,510.000 | 42,654,010.000 | 50,839.808 | 981,533,365.622 |
| (93.386) | (439.196) | (40,508,779.816) | (8,341,023.638) | (441,153.419) | (9,060,547.353) | (17,447.307) | (170,795,448.373) | |
| Zhejiang | 5416.500 | 639.351 | 142,550,980.000 | 46,214,280.000 | 481,870.000 | 30,518,700.000 | 32,598.073 | 612,834,611.644 |
| (147.881) | (232.199) | (5,798,076.897) | (4,375,484.721) | (269,356.645) | (5,763,081.294) | (9,664.690) | (63,230,421.722) | |
| Anhui | 6075.000 | 601.565 | 149,112,480.000 | 12,878,910.000 | 214,770.000 | 12,788,540.000 | 15,763.877 | 405,083,343.433 |
| (83.678) | (139.314) | (22,051,653.947) | (3,796,916.125) | (126,533.105) | (3,568,296.121) | (5,928.578) | (76,976,844.384) | |
| Fujian | 3737.100 | 716.952 | 80,815,550.000 | 22,844,210.000 | 308,560.000 | 14,996,180.000 | 18,502.180 | 326,151,628.502 |
| (86.871) | (202.430) | (9,746,363.544) | (8,158,510.151) | (200,653.733) | (3,521,071.249) | (6,705.824) | (63,379,097.240) | |
| Jiangxi | 4487.600 | 343.611 | 73,748,250.000 | 11,252,770.000 | 93,030.000 | 8,304,880.000 | 11,987.704 | 231,063,224.202 |
| (72.405) | (156.431) | (11,163,237.556) | (2,678,718.097) | (70,061.291) | (2,331,130.645) | (4,400.083) | (45,465,078.665) | |
| Shandong | 9648.000 | 1461.921 | 409,360,780.000 | 104,487,530.000 | 589,860.000 | 37,806,800.000 | 47,083.558 | 1,347,375,721.773 |
| (190.089) | (754.014) | (35,456,371.372) | (33,093,184.555) | (234,218.873) | (9,509,190.618) | (14,428.068) | (231,972,457.530) | |
| Henan | 9433.600 | 926.242 | 268,196,020.000 | 20,008,940.000 | 617,060.000 | 25,308,490.000 | 27,673.764 | 742,409,778.795 |
| (51.870) | (290.302) | (15,866,822.976) | (4,010,546.664) | (210,638.021) | (4,411,426.693) | (8,627.477) | (67,311,057.980) | |
| Hubei | 5774.700 | 520.834 | 134,865,390.000 | 25,958,820.000 | 268,480.000 | 14,186,600.000 | 20,586.036 | 430,264,358.615 |
| (62.978) | (111.700) | (20,704,281.072) | (3,533,544.618) | (116,808.046) | (2,772,574.025) | (8,066.172) | (53,314,224.162) | |
| Hunan | 6597.900 | 578.847 | 122,481,620.000 | 17,654,390.000 | 169,370.000 | 12,415,210.000 | 20,402.861 | 368,785,805.931 |
| (169.403) | (157.656) | (8,219,367.450) | (3,732,954.960) | (79,693.023) | (2,319,554.758) | (7,698.484) | (37,981,173.703) | |
| Guangdong | 10,443.900 | 1016.805 | 163,868,340.000 | 78,171,850.000 | 1,075,460.000 | 44,573,210.000 | 54,829.964 | 855,454,550.878 |
| (426.032) | (254.919) | (20,324,592.181) | (7,163,435.469) | (408,472.053) | (7,989,652.744) | (16,347.414) | (111,487,762.733) | |
| Guangxi | 4748.400 | 479.835 | 69,926,480.000 | 16,552,320.000 | 45,030.000 | 10,789,890.000 | 12,017.294 | 255,900,177.425 |
| (82.984) | (168.614) | (11,497,664.868) | (7,215,349.369) | (40,261.232) | (2,471,009.689) | (4,351.910) | (59,295,730.780) | |
| Hainan | 882.200 | 94.164 | 7,986,260.000 | 12,075,750.000 | 380,500.000 | 1,966,890.000 | 2628.838 | 72,210,476.749 |
| (24.430) | (46.318) | (2,454,656.965) | (1,606,233.048) | (104,843.248) | (636,891.544) | (984.972) | (14,601,731.132) | |
| Chongqing | 2928.900 | 421.878 | 62,445,270.000 | 5,841,600.000 | 662,980.000 | 7,015,200.000 | 10,685.007 | 193,815,138.778 |
| (78.522) | (168.880) | (8,759,688.467) | (1,654,853.755) | (168,404.637) | (1,717,098.954) | (4,449.668) | (30,348,763.433) | |
| Sichuan | 8133.400 | 1221.456 | 122,907,760.000 | 20,595,740.000 | 1,498,440.000 | 16,900,630.000 | 21,731.623 | 441,459,698.878 |
| (69.164) | (388.936) | (11,666,878.116) | (7,368,906.167) | (258,234.197) | (3,500,520.086) | (7,846.493) | (55,323,624.542) | |
| Guizhou | 3529.200 | 521.880 | 124,673,690.000 | 5,368,940.000 | 77,690.000 | 9,640,820.000 | 6714.709 | 308,861,361.239 |
| (52.845) | (127.909) | (13,952,152.847) | (1,825,047.422) | (45,228.566) | (2,183,817.775) | (3,097.322) | (43,972,809.911) | |
| Yunan | 4643.400 | 947.516 | 98,963,380.000 | 8,537,200.000 | 50,380.000 | 11,828,500.000 | 9611.565 | 294,582,008.467 |
| (86.324) | (240.995) | (10,521,106.145) | (1,652,341.757) | (12,167.151) | (2,916,176.610) | (3,580.489) | (31,726,749.665) | |
| Shaanxi | 3752.900 | 1278.879 | 148,320,870.000 | 27,768,430.000 | 656,070.000 | 9,967,220.000 | 12,964.797 | 437,232,521.100 |
| (33.591) | (456.312) | (45,832,665.442) | (3,159,812.895) | (167,720.350) | (2,467,767.890) | (4,912.218) | (109,665,166.063) | |
| Gansu | 2573.900 | 699.707 | 64,024,910.000 | 18,384,620.000 | 188,620.000 | 9,053,040.000 | 5120.788 | 240,311,865.550 |
| (21.610) | (291.928) | (9,929,429.943) | (1,586,933.531) | (59,940.244) | (1,891,256.020) | (1682.396) | (36,228,007.238) | |
| Qinghai | 570.900 | 289.703 | 17,587,990.000 | 2,625,700.000 | 336,370.000 | 5,258,990.000 | 1722.657 | 83,558,740.378 |
| (14.487) | (157.904) | (3,806,611.260) | (536,494.331) | (100,292.351) | (1,635,777.053) | (635.506) | (21,144,212.320) | |
| Ningxia | 643.100 | 434.124 | 73,194,640.000 | 4,815,970.000 | 167,010.000 | 6,780,660.000 | 2101.952 | 197,474,724.839 |
| (21.860) | (202.525) | (21,250,960.643) | (2,044,341.160) | (46,097.179) | (1,867,699.044) | (777.156) | (57,656,884.283) | |
| Xinjiang | 2233.200 | 1545.016 | 122,132,540.000 | 30,328,870.000 | 1,060,200.000 | 12,009,970.000 | 6822.805 | 420,471,954.966 |
| (97.948) | (825.965) | (52,175,559.053) | (4,292,359.834) | (360,442.059) | (7,272,511.121) | (2348.782) | (162,487,032.111) | |
Note: Standard deviation is provided in the parentheses.
Table 4.
The 41 industrial sectors of Guangdong province in China.
| Code | Name | Code | Name |
|---|---|---|---|
| 1 | Agriculture | 22 | Waste Product |
| 2 | Coal and Lignite Mining | 23 | Electricity and Heat Production |
| 3 | Oil and Gas Mining | 24 | Gas Production |
| 4 | Gold and Uranium Mining | 25 | Water Production |
| 5 | Other Mining | 26 | Construction |
| 6 | Food, Beverage, and Tobacco | 27 | Transportation and Post |
| 7 | Textiles | 28 | Information and Computing |
| 8 | Apparat and Leather | 29 | Wholesale and Retail |
| 9 | Wood and Furniture | 30 | Accommodation |
| 10 | Pulp, Paper, and Paper | 31 | Financial Service |
| 11 | Petroleum Processing | 32 | Real Estate |
| 12 | Chemical | 33 | Lease Service |
| 13 | Non-metallic Mineral | 34 | Scientific Technology |
| 14 | Basic Metal Processing | 35 | Equipment Repair |
| 15 | Metal Product | 36 | Environment Management |
| 16 | General Equipment | 37 | Household Service |
| 17 | Transportation Equipment | 38 | Education |
| 18 | Electronic Machinery | 39 | Health Service |
| 19 | Communication Machinery | 40 | Sport and Entertainment |
| 20 | Instrument Machinery | 41 | Public Management |
| 21 | Other Manufacturing |
Source: The input-output table (Ministry of Statistics of Guangdong, China [50]).
Table 5.
Sustainable performance of 30 regions/provinces in China from 2007 to 2016.
| Region | 2007 | 2008 | 2009 | 2010 | 2011 | 2012 | 2013 | 2014 | 2015 | 2016 | 2007–2016 |
|---|---|---|---|---|---|---|---|---|---|---|---|
| Beijing | 1.000 | 1.000 | 1.000 | 1.000 | 1.000 | 1.000 | 1.000 | 1.000 | 1.000 | 1.000 | 1.000 |
| Tianjin | 0.745 | 0.771 | 0.805 | 0.806 | 0.846 | 0.862 | 0.783 | 0.948 | 0.880 | 0.915 | 0.836 |
| Hebei | 1.000 | 1.000 | 1.000 | 1.000 | 1.000 | 1.000 | 1.000 | 1.000 | 0.741 | 0.670 | 0.941 |
| Shanxi | 1.000 | 1.000 | 1.000 | 1.000 | 1.000 | 1.000 | 1.000 | 1.000 | 1.000 | 1.000 | 1.000 |
| Inner Mongolia | 0.995 | 0.999 | 1.000 | 1.000 | 1.000 | 1.000 | 1.000 | 1.000 | 1.000 | 1.000 | 0.999 |
| Liaoning | 0.609 | 0.530 | 0.607 | 0.576 | 0.630 | 0.595 | 0.593 | 0.618 | 0.702 | 1.000 | 0.646 |
| Jilin | 0.707 | 0.638 | 0.645 | 0.622 | 0.725 | 0.712 | 0.776 | 0.762 | 0.914 | 0.917 | 0.742 |
| Heilongjiang | 0.577 | 0.554 | 0.540 | 0.554 | 0.590 | 0.609 | 0.610 | 0.616 | 0.703 | 0.612 | 0.597 |
| Shanghai | 1.000 | 1.000 | 1.000 | 1.000 | 1.000 | 1.000 | 1.000 | 1.000 | 1.000 | 1.000 | 1.000 |
| Jiangsu | 1.000 | 1.000 | 1.000 | 1.000 | 1.000 | 1.000 | 1.000 | 1.000 | 1.000 | 1.000 | 1.000 |
| Zhejiang | 1.000 | 1.000 | 1.000 | 1.000 | 1.000 | 1.000 | 1.000 | 1.000 | 1.000 | 1.000 | 1.000 |
| Anhui | 0.797 | 0.757 | 0.818 | 0.898 | 1.000 | 0.836 | 0.757 | 0.767 | 0.744 | 0.799 | 0.817 |
| Fujian | 1.000 | 1.000 | 1.000 | 0.732 | 0.803 | 0.809 | 0.801 | 0.809 | 0.934 | 1.000 | 0.889 |
| Jiangxi | 1.000 | 1.000 | 1.000 | 1.000 | 1.000 | 1.000 | 1.000 | 1.000 | 1.000 | 0.924 | 0.992 |
| Shandong | 1.000 | 1.000 | 1.000 | 1.000 | 1.000 | 1.000 | 1.000 | 1.000 | 1.000 | 1.000 | 1.000 |
| Henan | 1.000 | 1.000 | 1.000 | 1.000 | 1.000 | 1.000 | 1.000 | 1.000 | 1.000 | 1.000 | 1.000 |
| Hubei | 0.730 | 0.712 | 0.717 | 0.775 | 0.735 | 0.821 | 0.934 | 0.864 | 0.929 | 0.867 | 0.808 |
| Hunan | 0.786 | 0.846 | 0.883 | 0.878 | 0.861 | 0.844 | 0.840 | 0.826 | 0.848 | 0.849 | 0.846 |
| Guangdong | 1.000 | 1.000 | 1.000 | 1.000 | 1.000 | 1.000 | 1.000 | 1.000 | 1.000 | 1.000 | 1.000 |
| Guangxi | 1.000 | 1.000 | 1.000 | 1.000 | 1.000 | 1.000 | 1.000 | 1.000 | 1.000 | 1.000 | 1.000 |
| Hainan | 1.000 | 1.000 | 1.000 | 1.000 | 1.000 | 1.000 | 1.000 | 1.000 | 1.000 | 1.000 | 1.000 |
| Chongqing | 1.000 | 1.000 | 1.000 | 1.000 | 1.000 | 1.000 | 1.000 | 1.000 | 1.000 | 1.000 | 1.000 |
| Sichuan | 1.000 | 0.677 | 0.615 | 0.674 | 1.000 | 0.704 | 0.647 | 0.583 | 0.568 | 0.565 | 0.703 |
| Guizhou | 1.000 | 1.000 | 1.000 | 1.000 | 1.000 | 1.000 | 1.000 | 1.000 | 1.000 | 1.000 | 1.000 |
| Yunan | 0.998 | 1.000 | 0.815 | 1.000 | 1.000 | 1.000 | 1.000 | 1.000 | 1.000 | 1.000 | 0.981 |
| Shaanxi | 0.517 | 0.528 | 0.543 | 0.515 | 0.490 | 0.491 | 0.444 | 0.454 | 0.553 | 0.511 | 0.505 |
| Gansu | 0.479 | 0.508 | 0.504 | 0.511 | 0.514 | 0.490 | 0.509 | 0.486 | 0.549 | 0.584 | 0.513 |
| Qinghai | 1.000 | 1.000 | 1.000 | 1.000 | 1.000 | 1.000 | 1.000 | 1.000 | 1.000 | 1.000 | 1.000 |
| Ningxia | 1.000 | 1.000 | 1.000 | 1.000 | 1.000 | 1.000 | 1.000 | 1.000 | 1.000 | 1.000 | 1.000 |
| Xinjiang | 0.384 | 0.425 | 0.318 | 0.313 | 0.293 | 0.315 | 0.311 | 0.424 | 0.998 | 0.996 | 0.478 |
| Avg. | 0.878 | 0.865 | 0.860 | 0.862 | 0.883 | 0.870 | 0.867 | 0.872 | 0.902 | 0.907 | 0.876 |
Table 6.
Summary of crucial parameters on all sectors in Guangdong economic system.
| Sector | Income Effect | Influence Coefficient | Sensitivity Coefficient | EVA Coefficient | RAS Parameter | |||||
|---|---|---|---|---|---|---|---|---|---|---|
| 2007 | 2012 | 2007 | 2012 | 2007 | 2012 | 2007 | 2012 | |||
| Agriculture | 0.050 | 0.049 | 0.722 | 0.705 | 1.004 | 1.029 | 0.601 | 0.611 | 0.777 | 0.841 |
| Coal and Lignite Mining | 0.000 | 0.000 | 0.354 | 0.341 | 0.768 | 0.893 | 0.000 | 0.000 | 0.000 | 1.092 |
| Oil and Gas Mining | 0.021 | 0.016 | 0.606 | 0.506 | 1.791 | 1.101 | 0.703 | 0.844 | 0.646 | 0.537 |
| Gold and Uranium Mining | 0.185 | 0.225 | 0.979 | 0.970 | 0.996 | 0.850 | 0.373 | 0.339 | 1.363 | 0.461 |
| Other Mining | 0.130 | 0.192 | 1.120 | 0.959 | 0.462 | 0.498 | 0.274 | 0.365 | 0.986 | 1.130 |
| Food, Beverage, and Tobacco | 0.085 | 0.078 | 1.005 | 1.017 | 0.773 | 1.154 | 0.255 | 0.253 | 0.866 | 1.868 |
| Textiles | 0.160 | 0.160 | 1.123 | 1.138 | 1.030 | 0.820 | 0.266 | 0.236 | 1.395 | 0.606 |
| Apparat and Leather | 0.130 | 0.117 | 1.040 | 1.125 | 0.581 | 0.616 | 0.333 | 0.270 | 1.280 | 1.122 |
| Wood and Furniture | 0.129 | 0.139 | 1.188 | 1.157 | 0.574 | 0.531 | 0.221 | 0.237 | 1.129 | 0.816 |
| Pulp, Paper, and Paper | 0.137 | 0.160 | 1.230 | 1.317 | 1.310 | 0.902 | 0.232 | 0.199 | 1.300 | 0.611 |
| Petroleum Processing | 0.049 | 0.043 | 0.995 | 0.880 | 1.548 | 1.489 | 0.112 | 0.211 | 1.317 | 0.942 |
| Chemical | 0.163 | 0.135 | 1.196 | 1.189 | 3.267 | 3.296 | 0.242 | 0.230 | 1.184 | 0.847 |
| Non-metallic Mineral | 0.241 | 0.260 | 1.127 | 1.069 | 0.807 | 0.741 | 0.246 | 0.247 | 1.024 | 1.004 |
| Basic Metal Processing | 0.169 | 0.228 | 1.383 | 1.354 | 2.299 | 2.827 | 0.133 | 0.171 | 0.784 | 1.617 |
| Metal Product | 0.177 | 0.222 | 1.325 | 1.302 | 1.565 | 0.846 | 0.216 | 0.226 | 1.011 | 0.524 |
| General Equipment | 0.144 | 0.141 | 1.348 | 1.323 | 0.931 | 0.950 | 0.230 | 0.225 | 1.030 | 1.217 |
| Transportation Equipment | 0.117 | 0.103 | 1.385 | 1.296 | 0.897 | 0.886 | 0.213 | 0.233 | 1.083 | 0.819 |
| Electronic Machinery | 0.130 | 0.143 | 1.434 | 1.359 | 1.347 | 1.049 | 0.183 | 0.206 | 1.006 | 0.632 |
| Communication Machinery | 0.118 | 0.091 | 1.589 | 1.448 | 3.023 | 4.109 | 0.160 | 0.206 | 0.653 | 1.635 |
| Instrument Machinery | 0.113 | 0.119 | 1.503 | 1.289 | 0.825 | 0.456 | 0.192 | 0.273 | 0.951 | 0.313 |
| Other Manufacturing | 0.146 | 0.140 | 1.261 | 1.313 | 0.502 | 0.385 | 0.252 | 0.230 | 1.073 | 0.163 |
| Waste Product | 0.049 | 0.119 | 0.689 | 1.334 | 0.791 | 1.412 | 0.586 | 0.209 | 1.665 | 1.260 |
| Electricity and Heat Production | - | - | 0.951 | 0.864 | 2.081 | 2.162 | 0.300 | 0.263 | 1.198 | 0.807 |
| Gas Production | 0.042 | 0.053 | 1.474 | 1.407 | 1.392 | 0.981 | 0.138 | 0.185 | 2.040 | 0.396 |
| Water Production | 0.217 | 0.360 | 0.733 | 1.034 | 0.418 | 0.503 | 0.543 | 0.290 | 2.020 | 0.685 |
| Construction | 0.295 | 0.159 | 1.200 | 1.225 | 0.401 | 0.440 | 0.239 | 0.216 | 1.106 | 2.450 |
| Transportation and Post | 0.042 | 0.110 | 0.889 | 0.953 | 1.152 | 1.461 | 0.470 | 0.388 | 1.251 | 1.174 |
| Information and Computing | 0.060 | 0.075 | 0.847 | 0.818 | 0.644 | 0.543 | 0.559 | 0.538 | 0.894 | 0.795 |
| Wholesale and Retail | 0.025 | 0.053 | 0.613 | 0.689 | 0.804 | 1.177 | 0.722 | 0.590 | 1.415 | 1.932 |
| Accommodation | 0.138 | 0.105 | 0.892 | 0.880 | 0.651 | 0.732 | 0.380 | 0.417 | 0.817 | 1.115 |
| Financial Service | 0.023 | 0.050 | 0.648 | 0.724 | 1.469 | 1.227 | 0.612 | 0.557 | 1.420 | 0.711 |
| Real Estate | 0.019 | 0.025 | 0.528 | 0.557 | 0.714 | 0.639 | 0.809 | 0.733 | 1.358 | 0.758 |
| Lease Service | 0.083 | 0.044 | 0.880 | 0.898 | 0.999 | 1.182 | 0.499 | 0.481 | 1.190 | 0.999 |
| Scientific Technology | 0.103 | 0.187 | 0.875 | 1.300 | 0.370 | 0.397 | 0.443 | 0.199 | 1.545 | 3.093 |
| Equipment Repair | 0.070 | 0.085 | 1.128 | 0.903 | 0.422 | 0.381 | 0.424 | 0.447 | 0.723 | 0.193 |
| Environment Management | 0.042 | 0.077 | 0.703 | 0.699 | 0.381 | 0.349 | 0.655 | 0.565 | 1.566 | 0.413 |
| Household Service | 0.057 | 0.129 | 0.785 | 0.736 | 0.515 | 0.533 | 0.569 | 0.552 | 1.174 | 1.164 |
| Education | 0.048 | 0.061 | 0.670 | 0.610 | 0.363 | 0.375 | 0.707 | 0.691 | 1.189 | 4.070 |
| Health Service | 0.100 | 0.076 | 0.983 | 0.878 | 0.374 | 0.341 | 0.452 | 0.514 | 0.914 | 0.014 |
| Sport and Entertainment | 0.088 | 0.059 | 0.856 | 0.798 | 0.400 | 0.382 | 0.538 | 0.527 | 1.136 | 0.786 |
| Public Management | 0.081 | 0.069 | 0.742 | 0.638 | 0.356 | 0.356 | 0.599 | 0.664 | 0.904 | 9.128 |
Note: EVA coefficient represents the economic value-added (one of the GDP calculation methodologies) coefficient of each sector in Guangdong province; RAS parameter represents the dynamic change of input coefficient of each sectors in Guangdong province between 2007 and 2012.
Table 7.
The investment estimation of modern energy infrastructure in Guangdong’s sectors during the 13th Five-Year Plan period.
Table 7.
The investment estimation of modern energy infrastructure in Guangdong’s sectors during the 13th Five-Year Plan period.
| The Objective of the Energy Policy: 36,000 MW | |||
|---|---|---|---|
| Project | Capacity | Capital Cost ($/kW) | Capital Investment |
| Coal | 6000 MW | 3636/kW | 13,089,600 |
| Natural Gas | 9000 MW | 1104/kW | 5,961,600 |
| Nuclear | 8000 MW | 5945/kW | 28,536,000 |
| Wind Power | 11,000 MW | 6628/kW | 30,686,700 |
| Solar Power | 2671/kW | ||
| Pumped-hydro electricity | 2000 MW | NA | NA |
| Total | 36,000 MW | 78,273,900 | |
Note: Exchange rate 1 USD: 6 RMB. Monetary unit: 10 thousand RMB.
Table 8.
The economic analysis of low-carbon energy infrastructure in Guangdong’s sectors during the 13th Five-Year Plan period (2016–2020).
Table 8.
The economic analysis of low-carbon energy infrastructure in Guangdong’s sectors during the 13th Five-Year Plan period (2016–2020).
| Progressing Sustainable Policy Scenario | Final Demand | Division/Macro-Economic | Total Gross Output | GDP |
|---|---|---|---|---|
| Low-carbon energy infrastructure | 78,273,900 | Agriculture (1) | 0.32% | 0.32% |
| Industrial (2–26) | 2.62% | 1.58% | ||
| Service (27–41) | 0.71% | 0.71% | ||
| Regional Economic | 1.37% | 1.16% |
Note: The parentheses represent the serial number of each sectors in Table 3. Monetary Unit: 10,000 RMB.
Table 9.
Sustainable performance of 30 regions/provinces in China under three scenarios.
| Region | Benchmark Scenario | Business as Usual Scenario | Progressive Sustainable Policy Scenario |
|---|---|---|---|
| Beijing | 1.000 | 1.000 | 1.000 |
| Tianjin | 0.836 | 0.926 | 0.926 |
| Hebei | 0.941 | 0.567 | 0.542 |
| Shanxi | 1.000 | 1.000 | 1.000 |
| Inner Mongolia | 0.999 | 1.000 | 1.000 |
| Liaoning | 0.646 | 1.000 | 1.000 |
| Jilin | 0.742 | 0.926 | 0.925 |
| Heilongjiang | 0.597 | 0.600 | 0.610 |
| Shanghai | 1.000 | 1.000 | 1.000 |
| Jiangsu | 1.000 | 1.000 | 1.000 |
| Zhejiang | 1.000 | 1.000 | 0.954 |
| Anhui | 0.817 | 0.761 | 0.741 |
| Fujian | 0.889 | 1.000 | 1.000 |
| Jiangxi | 0.992 | 0.947 | 0.960 |
| Shandong | 1.000 | 1.000 | 1.000 |
| Henan | 1.000 | 1.000 | 1.000 |
| Hubei | 0.808 | 0.928 | 0.943 |
| Hunan | 0.846 | 0.848 | 0.846 |
| Guangdong | 1.000 | 1.000 | 1.000 |
| Guangxi | 1.000 | 1.000 | 1.000 |
| Hainan | 1.000 | 1.000 | 1.000 |
| Chongqing | 1.000 | 1.000 | 1.000 |
| Sichuan | 0.703 | 0.550 | 0.504 |
| Guizhou | 1.000 | 1.000 | 1.000 |
| Yunan | 0.981 | 1.000 | 1.000 |
| Shaanxi | 0.505 | 0.487 | 0.499 |
| Gansu | 0.513 | 0.569 | 0.564 |
| Qinghai | 1.000 | 1.000 | 1.000 |
| Ningxia | 1.000 | 1.000 | 1.000 |
| Xinjiang | 0.478 | 1.000 | 1.000 |
| Average | 0.876 | 0.904 | 0.901 |
| SD | 0.174 | 0.168 | 0.172 |
© 2018 by the authors. Licensee MDPI, Basel, Switzerland. This article is an open access article distributed under the terms and conditions of the Creative Commons Attribution (CC BY) license (http://creativecommons.org/licenses/by/4.0/).
Share and Cite
MDPI and ACS Style
Lin, T.-Y.; Chiu, S.-H. Sustainable Performance of Low-Carbon Energy Infrastructure Investment on Regional Development: Evidence from China. Sustainability 2018, 10, 4657. https://doi.org/10.3390/su10124657
AMA Style
Lin T-Y, Chiu S-H. Sustainable Performance of Low-Carbon Energy Infrastructure Investment on Regional Development: Evidence from China. Sustainability. 2018; 10(12):4657. https://doi.org/10.3390/su10124657
Chicago/Turabian StyleLin, Tzu-Yu, and Sheng-Hsiung Chiu. 2018. "Sustainable Performance of Low-Carbon Energy Infrastructure Investment on Regional Development: Evidence from China" Sustainability 10, no. 12: 4657. https://doi.org/10.3390/su10124657
Note that from the first issue of 2016, this journal uses article numbers instead of page numbers. See further details here.