Land Inequality and Economic Growth: A Meta-Analysis


1
Department of Economics, University of Molise, 86039 Campobasso, Italy
2
Department of Economics and Law, University of Cassino, 03043 Cassino, Italy
3
Department of Economics, Roma Tre University, 00145 Rome, Italy
*
Authors to whom correspondence should be addressed.
Sustainability 2018, 10(12), 4655; https://doi.org/10.3390/su10124655
Submission received: 29 October 2018
/
Revised: 1 December 2018
/
Accepted: 3 December 2018
/
Published: 6 December 2018
(This article belongs to the Section Economic and Business Aspects of Sustainability)
Abstract
:Increasing commercial pressure on land may lead to land concentration in developing countries, especially in the context of complex systems of property rights. In this article we review through meta-analysis (MA) the econometric findings of the literature estimating the nexus between land inequality and economic growth. In particular, our MA controls for various features of the studies and for the so-called “publication bias”, and shows that land-inequality negatively affects economic growth, especially at low development levels. Analysis based on panel data, which generally imply a relatively short run perspective, typically report a lower or positive correlation between land inequality and growth, suggesting that the negative impact of land inequality emerges in the long run, possibly through credit constraints and institutional mechanisms.
1. Introduction
Economic growth and resource distribution issues have a permanent importance in the research agenda of economists and international institutions: from early World Bank analysis to recent contributions on the relationship between inequality and sustainable development in light of the financial crisis [1,2,3]. Land inequality is a determinant of income inequality; therefore, land distribution becomes a crucial issue, mainly in countries at a low development level. Furthermore, in many developing countries, commercial pressure on land, especially through foreign direct investments (FDI), is increasing very rapidly. As argued in Section 5, with a focus on Africa, the combination of commercial pressure on land and insecure rights may lead to “excessive” land concentration and shape the development pattern in many countries in the direction of inequality for a long time.
The first contribution of this article is to review, through a meta-analysis (MA), previous and relevant literature analyzing the nexus between economic growth and land inequality, with the aim to highlight the implications for the contemporary debate on development, especially regarding commercial pressure on land. The second contribution is to deepen our understanding of the crucial importance of land as a factor of production, and a determinant of economic growth and sustainability, especially in rural areas of developing countries. Indeed, the sustainability of development, defined as the ability to meet the needs of current generations without weakening the ability of the future generations to satisfy their own, is negatively affected by an unequal distribution of land, not only through the growth channel, but also through its negative impact on institutions, including institutions for governance of the commons.
A large literature estimating the correlation “land inequality—economic growth” has often suggested, albeit with a variety of results, negative coefficients, particularly in the long term, and the fact that high levels of inequality in asset ownership are very difficult to reverse. If there is a tentative consensus that societies with more equal income distribution show a faster and more sustainable growth pattern [4] and that land inequality crucially affects income inequality, we should worry now about the distributional consequences of the emerging pattern of land acquisitions in the developing countries.
Our review differs from other meta-analytical assessments of the inequality growth nexus essentially because we focus on land, limiting our analysis to studies that highlight the impact of land inequality (commonly proxied by the Gini index) on growth. The MA by De Dominicis et al. [5] refers to the Gini index of income inequality; Neves et al. [6] consider articles on the impact of inequality in income, land, and human capital, but indeed most of their estimates (42 out of 49) are selected from empirical works using only income. These two previous metanalytical assessments confirm the relevance of our specific topic by arguing that income inequality is a poor measure of wealth inequality [5], and that the negative growth impact of an unequal distribution of land is higher than that due to the unequal distribution of income [6].
A major criticism of MA is that the peer-review process can greatly affect the magnitude of the estimated effect, furthermore the quality of collected studies varies considerably according to different methodological or empirical choices, or different model specifications, data source, and so on. Therefore, the meta-analytical assessment might be affected by the so-called “publication bias,” a term that in general refers to all factors that influence the magnitude of the reported effects. A more specific issue concerns the potential “publication impact” (rather than a “bias”), that is the consequences of the peer-review process. In our meta-analytical assessment, we have opted to consider both published and unpublished studies in order to assess the “publication impact,” and collected in total 180 point estimates of the parameter of interest from 22 quantitative studies. We adopt a weighted least squares meta-regression analysis (WLS-MRA) to examine, after a rigorous check for publication bias, which factors influence the effect magnitude. Our MA shows that when correcting for publication bias there is evidence that land inequality negatively affects growth, especially in the developing areas.
Finally, the focus on land rather than income inequality allows us to contribute to the debate of the role of agrarian structures and of smallholder agriculture in development According to the standard development model smallholder agriculture is “efficient in what it does” [7,8,9], and although some authors question the evidence base for an exclusive development focus on smallholders, there is consensus that mega-farms are unlikely to be the answer [10]. Since recent data on large-scale land investments indicate acquisitions of average and median sizes of respectively 10 and 48 thousand hectares, often with government discretionary allocation [11,12,13], we believe there are good reasons to reevaluate the land concentration-growth nexus.
The article is organized as follows: Section 2 briefly reviews the relevant empirical literature (including all collected studies in our MA); Section 3 describes the empirical methodology; Section 4 discusses the econometric results; Section 5 comments on the contemporary relevance of our topic, based on trends in Africa; and, finally, Section 6 draws some conclusions.
2. Economic Growth and Land Inequality: The Debate
The theoretical literature finds several channels through which land inequality affects economic growth: through credit market imperfections and credit constraints that prevent the poorest from making investment and formation of human of physical capital, through redistribution that is politically motivated by the preference of “median voters,” and through other mechanisms, such as social instability/weak property rights, that reduce growth.
On the empirical side, all studies adopt a version of the Barro and Sala-i-Martin framework: the growth rate of period t is a function of initial level of state variables—gross domestic product (GDP) and human capital per person—and a set of control and environmental variables, which, for the subset in our MA, includes the variable land Gini.
For a very simple taxonomy of this literature, and in order to establish a framework for the quantitative review, we distinguish three types of contributions: (i) political economy models; (ii) literature on distribution, mainly empirically oriented; and (iii) historical approaches that apply econometric analysis to the study of colonialism.
2.1. Political Economy Models
The political economy approach indicates two transmission channels through which inequality slows down economic growth: government redistribution policies with higher distortionary taxes, and socio-political instability that disrupts market activities and creates uncertainty regarding the political and legal environment.
In a set of early models, the initial resource allocation leads to political conflicts for wealth distribution [14,15,16,17], and in turn, to radical policies of income redistribution that undermine incentives to save and invest, thus reducing economic growth. Land inequality plays a role in this literature because inequality in land ownership is strongly related to inequality in the distribution of assets and the Gini land ownership coefficient is used as a proxy for wealth distribution [14,18].
In this literature, (i) spending on public services is financed through a tax on capital, (ii) the tax on capital leads to a lower rate of capital accumulation, and (iii) the tax rate preferred by each individual is decreasing in the share of capital income (relative to her labor income). Governments maximize the ideal tax rate of the median voter, based on her relative factor endowment; hence, the greater the inequality of wealth and income, the lower is growth.
This is not a consensual conclusion in this strand of literature. Other authors have argued that redistribution through the tax system can produce opposite results if the progressive redistribution occurs in the presence of liquidity constraints or other capital market imperfections that essentially prevent investments inhuman capital or any other profitable projects [19,20,21,22,23,24].
Social stability and property rights are the focus of socio-political instability models: the idea is that inequality encourages populism that induces political and macroeconomic instability slowing down economic growth. For example, Keefer and Knack [25] argue that polarization generates political instability, in particular increasing the probability of extreme reforms of existing policies with negative effects on growth. Evidence at a cross-country level indicates that the channels through which social polarization negatively affects growth are the decrease of the security of property and contract rights. In cross-country analysis, if the security of property rights is controlled, the relationship between inequality and growth decreases considerably.
2.2. Empirically Oriented Literature on Distribution
We classify in this section studies that include in the growth regression a measure of land distribution as proxy or instrument for income inequality (see References [26,27]), but do not check for the channels through which land inequality affects growth.
During the 80s and 90s, the correlation between asset/land distribution and growth became part of the agenda of institutions, in particular of the World Bank, and economic growth was analyzed as a consequence of land inequality rather than the opposite as in Simon Kuznets’ [28] inverted-U hypothesis [26,29,30,31].
For example, Birdsall and Londoño [32,33] used the Deininger and Squire database [34] for an econometric analysis of growth as a function of land distribution, among other variables, and emphasized the relevance of asset distribution for growth and poverty reduction.
Caselli [35] shows that the negative growth differential between highly unequal Latin American countries and those in East and South East Asian during the 1960s to 1990s would have been halved if in the former region the initial inequality levels were the same as in Asia.
Focusing on the growth impact of income inequality, empiric baseline estimations and sensitivity analyses, Li and Zou [36] find that income inequality is positively, or not significantly, correlated to economic growth; on the other hand, the Gini land coefficient of distribution, that enters as a control variable in the sensitive analysis, has always negative and significant coefficients.
Using provincial data in the Philippines, Balisacan, and Fuwa [37] find a positive coefficient of the impact of the initial land inequality on economic growth. The literature on income inequality suggests two possible channels for this result: (i) if the rich have higher marginal propensity to save, and (ii) if higher inequality generates the incentives to work and invest more.
2.3. Land Gini and Human Capital
A subset of studies in this group explore further the role of initial land inequality, including the interaction term between land inequality and education level, to assess whether the impact of the land Gini operates through a constraint to human capital.
Deininger and Olinto [40] find evidence for conditional convergence (weak convergence across countries) and a significant growth-reducing impact of land distribution inequality. After controlling for the education level, their analysis shows that the effectiveness of policies aiming to increase growth through investment in education is reduced by a higher inequality of asset ownership.
In the same vein, Fort and Ruben [41] and Fort [42] investigate how the link between land ownership and education and secure property rights may affect economic growth. Findings indicate that land inequality is an obstacle to the implementation of educational policies; furthermore, once controlling for a measure of country’s political stability, the growth impact of assets inequality remains significant.
Mo [43] explores how political instability and investment in human capital influence the link between inequality and economic growth. The analysis shows that high inequality generates a low level of skill in the workforce, as it is difficult for the poor to invest in human capital, and this negatively affects growth. Furthermore, the socio-political instability caused by income inequality induces governments to adopt redistribution policies that reduce economic incentives, and consequently slow down the accumulation of capital and growth.
2.4. Mainly Historical Approaches
A strand of literature on developing countries focuses on the relationship between colonial institutions and patterns of growth by applying econometric analysis to colonialism and gives crucial insights, especially on the strong role of land inequality in determining income inequality. Acemoglu et al. [44] analyze the link between differences in economic institutions and differences in per capita income across countries, and argue that colonialism is important for development because it has shaped the institutions of different societies, by either setting “extractive states” or trying to “replicate” European institutions. Acemoglu and Robinson [45] debate that extractive institutions are associated with poverty, depriving the population of incentives and opportunities.
Economic historians [46,47] have argued that different economic development paths depend on the initial factor endowments. Suitability to cash crops lead to higher income inequality as many of them were efficiently produced in large estates on the basis of forced labor whilst a moderate effect on land inequality is found for scale-neutral food crops. Factor endowments are also crucial in determining inequality in Easterly [48], who assesses the correlation between development and inequality by using the exogenous suitability of land for wheat versus sugarcane as instruments, and finds that agricultural endowments might influence income distribution and, in turn, inequality influences growth.
Frankema [49] analyzes, in a cross-country context, the effect of land inequality at the end of the colonial age on current income inequality focusing on Latin America, where the heavy colonial heritage of land inequality is a major cause of persistent income inequality.
In our subset of studies for MA, we collect only one article related to this strand of literature. Nunn [50] tests in the context of the United States whether economic inequality was caused by the specialization in plantation agriculture, with its use of slavery, power concentration, and adverse institutional settings. The study finds that in 1860, the land Gini index of inequality and slavery were positively correlated, but without a subsequent effect on economic development.
3. Methodology: The Meta-Analysis
The MA, also called “the analysis of the analyses” [51], is a statistical method to review quantitative literature. In the last two decades, this technique has been performed in numerous fields of economics, including development and economic growth [52,53,54,55,56,57,58,59].
In comparison with traditional surveys of the literature, MA has the advantage of being a systematic method to summarize studies’ findings, with the purpose of avoiding wrong interpretations or wrong review conclusions [60], and it is more useful than qualitative reviews in capturing heterogeneity [61]. In this section we use it to check for the correlation between land inequality and economic growth. Land inequality has been quantified in literature through the Gini index, which measures the inequality of land distribution among households. The minimum value of 0 (or 0%) indicates the perfect equality, while the maximum value 1 (or 100%) represents perfect inequality.
The standard procedure in the empirical literature on the topic is to assume a simple linear relationship between land inequality and growth. The per capita income growth is regressed on a series of controls (including the land Gini index) explaining differences in economic growth among countries.
Most quantitative conventional studies estimate a regression of the following form:
where growth refers to economic growth of country c in time t, LandInequality is the Gini index for the land inequality, X is a vector of other determinants of economic growth, and ε is the usual disturbance term.
Using the MA, we evaluate and combine point estimates () of the effect of the Gini land coefficient on economic growth, and we test the null hypothesis that the effect size, quantifying the orientation and the size of the effect of land inequality on growth, is equal to zero when the results from different studies are combined.
Usually a single study reports more than one estimate of the effect size, and in these cases, we opted to include in our MA all estimates, rather than to use other synthetic indexes such as the simple mean or the median estimate, or simply the estimate chosen as benchmark by the author, for example.
Data Collection and Literature Search
In the first phase of the MA, we searched for potentially relevant studies via electronic sources, such as Google Scholar, Scopus, and RePEc databases, for any references on “inequality land and growth” and “distribution land and growth” in the title or in the abstract of published and unpublished articles. We focused on articles written in English and that were made available to the public since 1994. We completed the systematic search of the literature in June 2017.
In order to ensure comparability of the sample under investigation, we consider only studies that use the Gini land index as a measure of the inequality of land distribution and estimate a linear model for the analysis of the link between land inequality to growth. We also excluded studies that use simultaneous equations and studies that did not publish all the statistical information relevant to keep comparability.
These search criteria lefts us with 22 studies and 180 estimates of the coefficient associated with the Gini index (14 articles are published in academic journals with a total of 115 point estimates, 8 are unpublished studies or working papers reporting 65 point estimates in total). The collected studies cover the period 1994–2007. The list of articles included in the MA and general information on each and every article is in Appendix A.
The MA computes the size of an estimated effect by combining comparable estimates from independent empirical analysis, and at the same time, highlighting the possible sources of heterogeneity. The simple average of estimates is negative and equal to −0.56; approximately 81% (148 out of a total of 180) of the estimated effects were negative, while the remaining 19% (32 out of a total of 180) were positive.
In order to correctly interpret these synthetic results, it is necessary that the estimates from separate but similar studies are comparable. With regard to the comparability of estimates in our sample, we address two issues: (1) the Gini index is measured on a 0−1 scale, however some studies do not use this measurement unit; (2) all selected articles contain one or more regressions that estimate the effect of land Gini index on different left-hand side LHS variables, as growth (or average growth) of income, GDP, expenditures, or output.
One solution is to use the partial correlation coefficient (rij), hereafter PCC. Doucouliagos [62] presented the first application of PPC to meta-analysis; since then, partial correlations have been widely used in meta-analysis. It measures the correlation between the left hand side variable and one right hand side variable of a regression, keeping constant all other control variables.
Therefore, we convert each collected effect into the PCC to a common metric following the formula:
with standard errors, SE, calculated as:
where t and df are, respectively, the t-statistic and the degrees of freedom of the collected effect under investigation [63]. The Appendix B shows a detailed description of the computed PCC.
4. MA Results
4.1. Basic MA
The MA combines all effect size estimates of a common variable of interest reported by the collected articles, assigning more weight to more precise econometric results. Hence, the initial step of the MA is developed around the idea of meta-averages.
Therefore, the first question is: once all the collected estimates are combined, what is the true underlying growth effect of land inequality? The initial answer is a set of basic calculations that compute weighted means, which might differ substantially from the mean. Two weighted averages can be computed using the pooled fixed effect estimator (FEE) and the pooled random effect estimator (REE). The former assumes that there is no heterogeneity among studies’ results and the different magnitude of the estimates is due to sampling variation; the latter assumes heterogeneity among studies results.
Statistically, the underlying hypothesis in the FEE is that all effect sizes are equal, for example , where represents the effect of size of the jth observation (in our case, j = 1, 2, 3, …, 180) and β is the true effect size, or population effect size [64]. The observed effects will be distributed around α (the common effect), and will have a variance σ2 that depends primarily on the sample size for each study. Hence, the weighted average effect is calculated with weights that are inversely proportional to the variance, and as a result, point estimates have greater weights associated to smaller standard errors [65].
The REE assumes that all analyses are estimating different (random) treatment effects [66]. The combined effect β, therefore, represents an average of the population of true effects, and the variance associated with each effect size has two components: one regarding the sample level, as in the fixed effect model (within-variance), and the other one regarding the random effect variance (between-variance). Hence, the weights are inversely proportional to an estimate of between-study heterogeneity, , and are equal to (). A weighted least squares (WLS) estimate can be obtained regressing the t-statistic of the estimated coefficients () on the inverse of their standard errors; it gives more efficient estimates and corrects for heteroscedasticity. Table 1 reports the results of the basic MA. Considering the fact that the distribution of the PCC is truncated (the coefficient ranges from −1 to 1), and that it might cause an asymmetry, we also computed the Fisher’s z-transformed correlation [67]:
For a robustness check, both MA results for both PCC and Fisher’s z-transformed correlation are reported in the table.
Table 1 displays pooled estimates of the effect size of land inequality, computed as simple means, weighted averages, FE, and RE estimates. All averages were statistically significant at 1% level. The simple average was equal to −0.19 in the case of the PCC and −0.20 in the case of the Fisher’s z-transformed correlation. However, with a highly skewed distribution, the weighted average was a more appropriate summarizing measure. The FEE and WLS estimates led to the same averages, but the confidence interval was slightly wider for the WLS estimate. The fixed effect of the PCC showed a value of −0.13, as opposed to the random effect, which showed a value of −0.17.
Results were slightly higher if Fisher’s z-transformed correlation was used; either way, the two distributions presented the same behavior. Hence, the PCCs were used in the ensuing analysis.
In summary, the preliminary result of our MA is that land inequality seemed to influence growth negatively: there was a trade–off between land inequality and economic growth. These findings may, however, be greatly affected by the presence of publication bias, e.g., when editors or referees, but also researchers, have a preference for results that are statistically significant and with a direction in line with the theoretical predictions.
4.2. Publication Selection Bias
Journal editors and authors may be inclined to report econometric results in a certain direction or there may be a tendency to publish only statistically significant findings, leaving aside non-significant findings or studies. This behavior produces the so-called “publication bias” [66]. As already widely established by the literature, any simple overall MA should be interpreted with caution due to the possible presence of heterogeneity and/or publication bias in empirical findings [68].
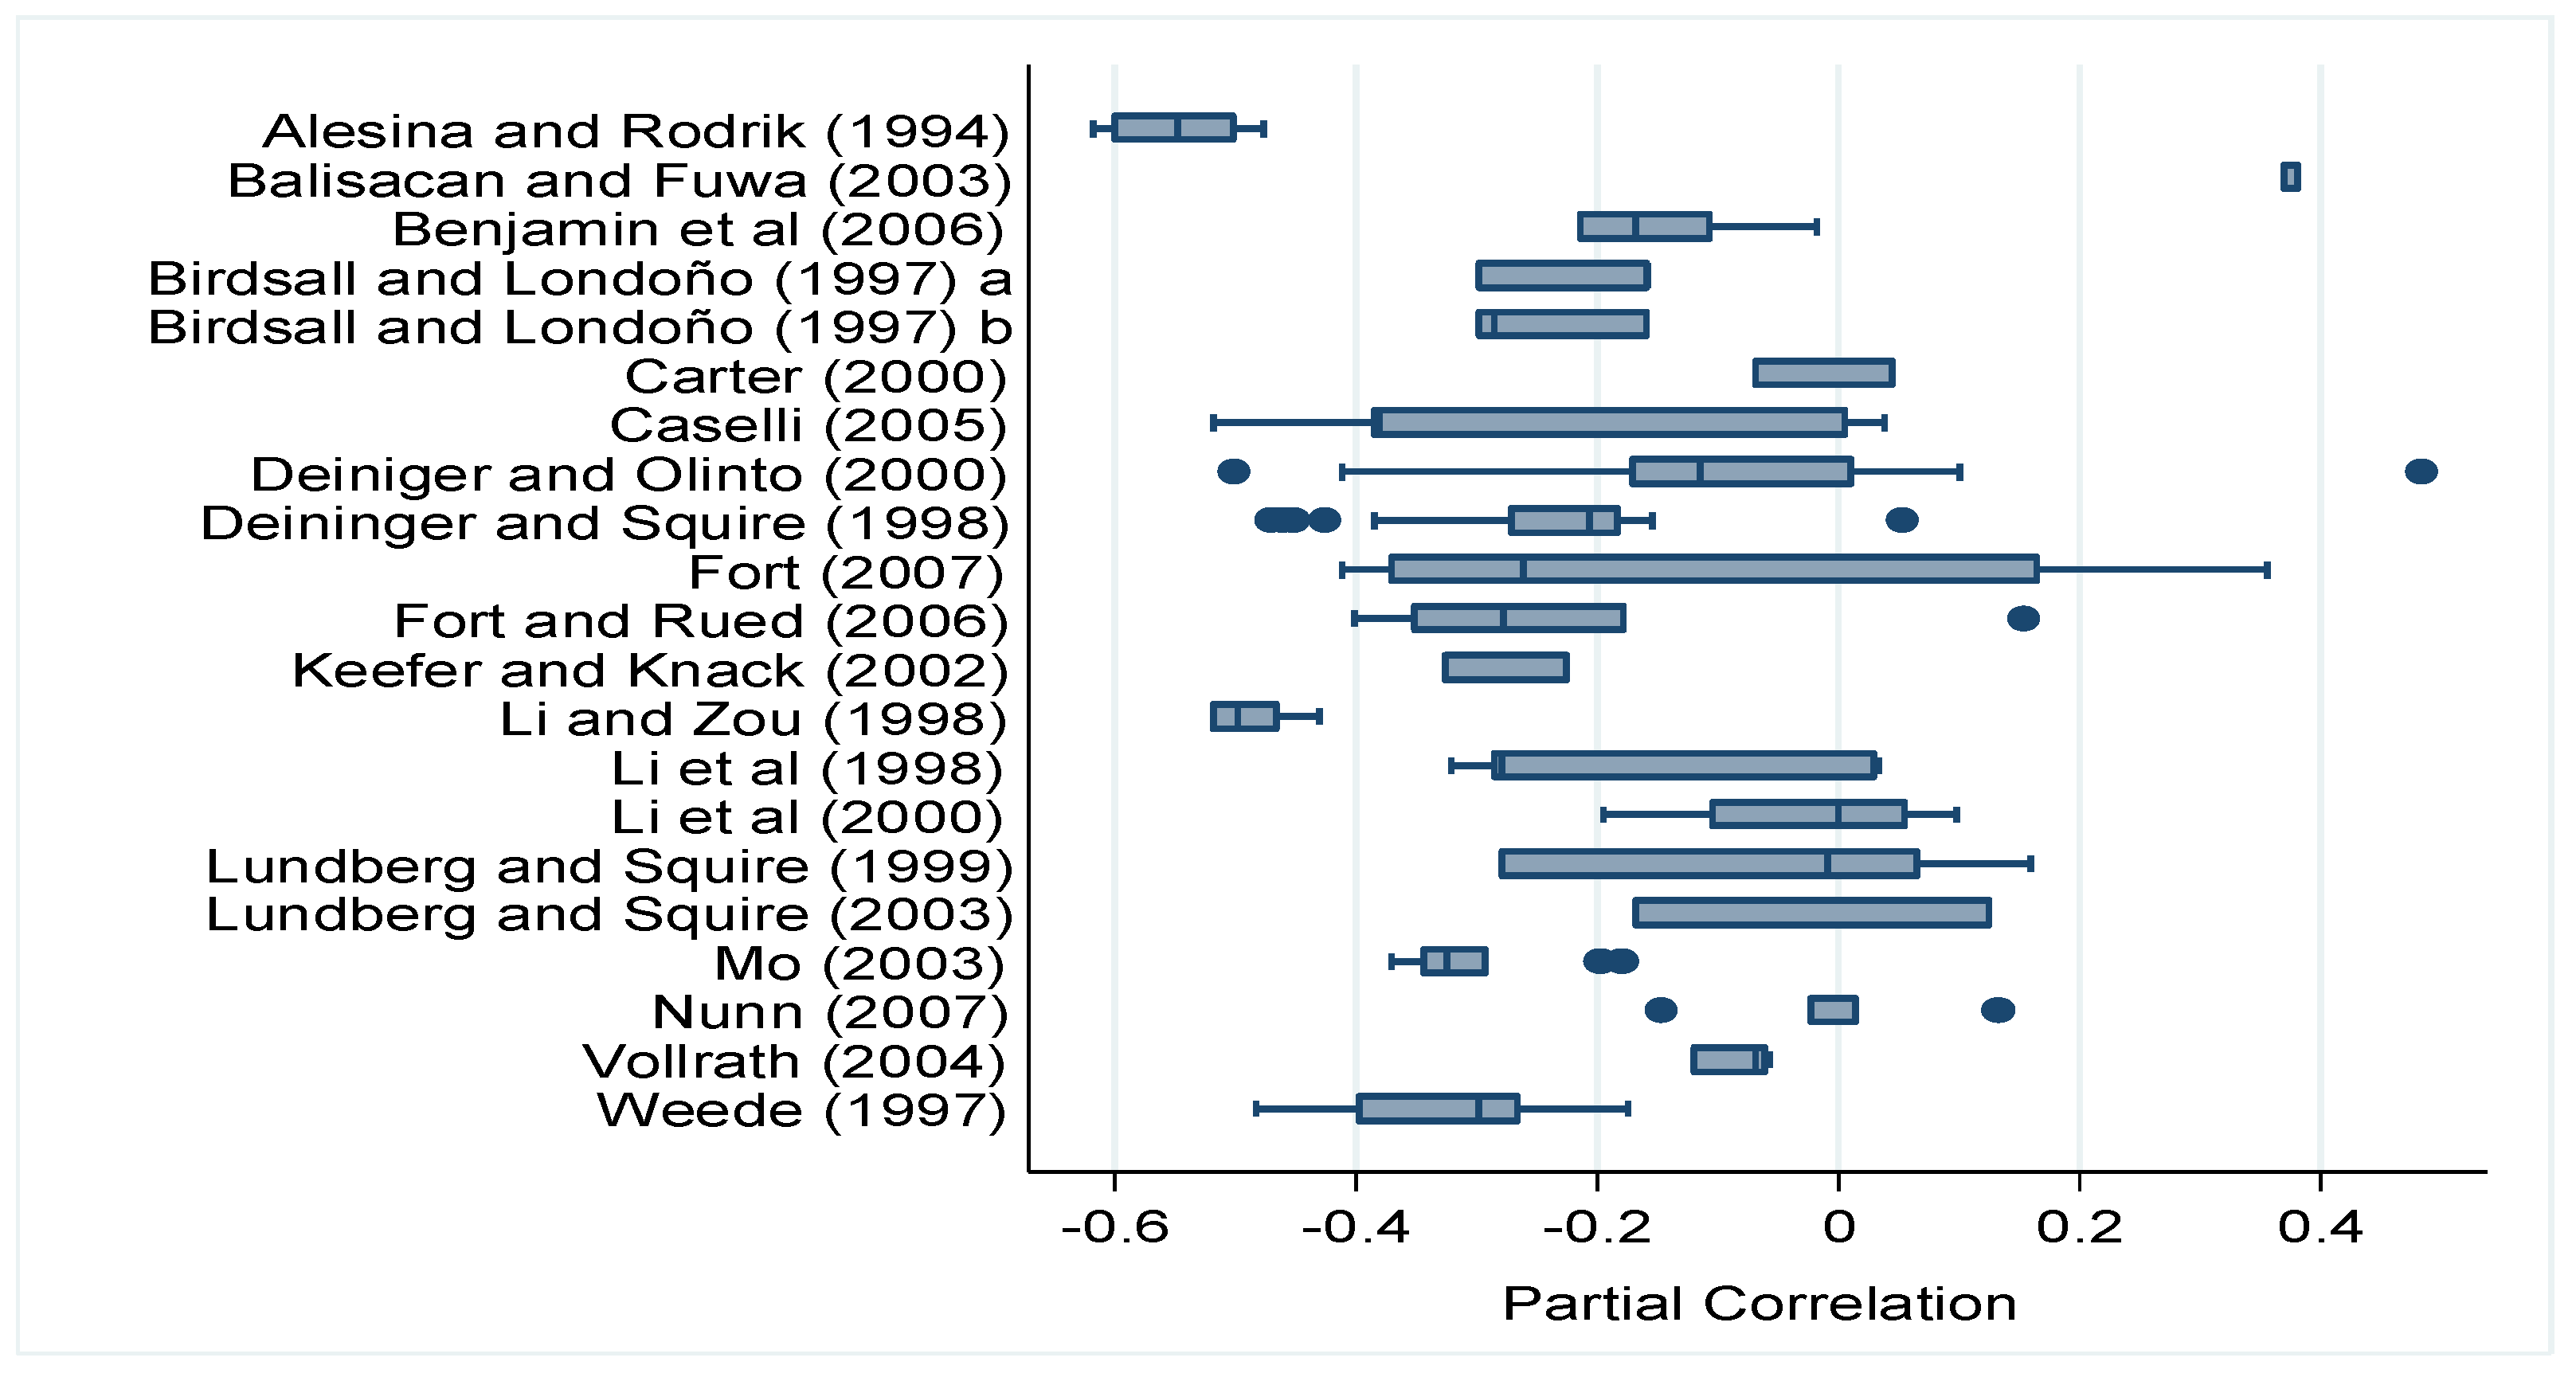
Figure 1 shows the heterogeneity of the results across studies: the results range from negative to positive values and are less or more economically significant. Even if the expectation of a negative growth effect of land inequality is by and large confirmed, 12 studies found evidence of positive effects.
The so-called Q-test is a formal way to test the hypothesis of heterogeneity () versus the alternative that at least one estimate differs. If H0 is true, the Q-test has an asymptotic chi-squared distribution with k − 1 degrees of freedom [64]. In our meta sample, the hypothesis of heterogeneity is accepted and the null hypothesis of homogeneity is rejected with a p-value < 0.001 (Q-test is 1350.88 with 179 degrees of freedom). Higgins and Thompson [65] suggest the I2 index to measure the share of variation of point estimates as a result of heterogeneity rather than sampling error. In our meta sample I2 is equal to 86.75%, which reveals a high degree of heterogeneity. Therefore, considering these results, we are going to explain such heterogeneity in the effect sizes in the last section using a meta-regression analysis.
A popular plot to investigate the publication bias is the funnel plot [69] that compares the estimated coefficient of the impact of land inequality on growth from each study and the inverse of its standard error, as a measure of precision. Publication bias may lead to asymmetrical funnel plots.
The funnel graph in Figure 2 seems to be asymmetrical with a tendency to values on the left side (negative values). The solid vertical line illustrates the meta-average, suggesting a small negative effect of land inequality on economic growth.
However, visual inspections are subjective and somehow ambiguous [70], and the funnel asymmetry test (FAT-PET) allows one to identify the asymmetry of the funnel plot by means of a regression between the collected effect sizes and respective standard errors; namely, the test determines if the intercept deviates significantly from zero [69]. The WLS version, preferred to the OLS since meta-regression errors are likely to be heteroscedastic [63], is as follows:
In the absence of publication selection, the overall effect size will vary randomly around the “true” value, , independently of its standard error; this means that the null hypothesis should be accepted. Another advantage of the use of the WLS model is that, according to Equation (5), the dependent variable in our model is no longer censored.
To account for the fact that estimates within one study are not statistically independent, we adopt a “robust with cluster” procedure to adjust standard errors for intra-study correlation. This is a common solution in meta-analysis literature [71,72], which relaxes the independent and identically distributed (i.i.d.) assumption of independent errors, and corrects for potential unobserved correlation among errors within clusters of observations.
In Table 2, we explore the publication bias by implementing the FAT-PET using WLS, panel, and multilevel models.
Table 2 shows that the estimated coefficient was significantly different from zero only in the case of the WLS model (column 1), signaling the presence of publication bias, while in the other three models (columns 2–4), it was not significantly different from zero, which does not confirm the existence of publication bias. Moreover, the estimated coefficient was always negative, even if it was significant only when fixed-effect panel model was used (column 2), providing evidence of a genuinely negative effect.
Stanley and Doucouliagos [73] argue that in the presence of a genuine effect, the FAT-PET is downwardly bias, and suggest the “precision-effect estimate with standard error” (PEESE) model to correct potential publication bias:
The PEESE results shown in Table 3 suggest that, after correcting for publication bias, there existed a significant and negative effect of land inequality on economic growth.
In the following, we implement a multiple meta-regression analysis (MRA) to explain the diversity in findings in the literature controlling for various characteristics of the collected studies.
4.3. Multiple Meta-Regression Analysis
In our MRA, we include as moderator a set of control variables reflecting features of the studies considered and try to explain the heterogeneity in the MA sample.
We select seven characteristics: (i) the development level of the countries included in the sample, (ii) the theoretical framework, (iii) the definitions of the dependent variable, (iv) the estimation techniques, (v) the structure of the data, (vi) the database used for growth and for land inequality, and (vii) published versus unpublished articles. Finally, we added dummies for periods in order to collect studies using data related only to specific time periods.
Results for the overall sample are shown in Table 4. In columns 1 and 2, we took into account the potential publication bias and estimated the multiple WLS-MRA and the PEESE correction, and in column 3 we simply dropped the standard error from the regression in order to check how the results change.
Adding our set of moderators, we could capture quite a lot of the heterogeneity in the partial correlation coefficients. Since the FAT coefficient was statistically insignificant (in column 1), it did not appear as evidence of publication selection. The overall inequality effect on economic growth was negative and statistically significant, ( = −0.44 with p-value < 0.05). After correcting for potential publication selection bias and by looking at results in column 2, we still found a significant and negative effect, ( = −0.41 with p-value < 0.01). Such a result was also confirmed by the simple MRA (column 3); however, without filtering out publication bias, the estimated effect was lower ( = −0.33 with p-value < 0.01).
From a methodological point of view, the estimated coefficients of dummies for country groups included in our multiple MRA indicate how results from analyses focusing on specific countries differ. In particular, we investigated how the effect size differed among studies that included in their analysis countries with different levels of development. We added dummies Developed, with value equal to one when the primary study includes only developed countries, and Developing, with value equal to one when the primary study includes only developing countries. The dummy sample of countries remained as the control variable, corresponding to studies that included both developed and developing countries. Statistically significant coefficients of these country dummies supported the idea that inequality affects the developed countries less and the developing countries more. Part of the heterogeneity can be explained by which sample of countries was considered.
Concerning the dummies describing the theoretical framework, we included dummies for “Endogenous Human Capital (HC)” and “Political Economy Models.” The omitted category was a dummy related to the set of the empirically oriented literature on distribution. The dummy for historical approaches was dropped due to collinearity, since it included only one study. The idea was that studies based on the same theoretical framework tended to include the same set of control variables. We found that all controls had negative and statistically significant coefficients, hence the theoretically grounded analyses tended to confirm the negative results predicted by theory: empirical tests tended to produce lower effects.
The MRA included controls for the dependent variable used as a measure of economic growth, as well as for the structure of the data and the estimators adopted. We distinguished studies that compute the economic growth rate using data on GDP from those that used data on income. Even if conceptually, the terms income and GDP were equal in national economic accounting, in practice their data may differ due to the use of different sources of information. Results in Table 4 show that only the coefficient of the dummy GDP was equal to 1 when the dependent variable used was the growth rate of GDP and was statistically significant and negative, hence land inequality seemed to affect GDP more than income growth. The estimated coefficient for the dummy “Agricultural production” was not statistically significant, and sectoral analysis does not influence the findings.
Most of the collected articles in our MA used cross-country regressions and found that falls in the growth rate were caused by inequality in land distribution rather than in income [18,25,30,35,36,37,74]. The cross-country estimates have received several critiques due to the omitted variables in the regression model, such as technology, climate, institutions, and any other variable specific to each country. To address these methodological concerns, Deininger and Olinto [40], Fort and Ruben [41], Li et al. [75], and Mo [43] use panel data econometric methods and fixed-effect estimators in order to account for country specific characteristics. The coefficient of dummy labeled “Panel data” (Structure of data) was positive and, although it was only statistically significant for the simple MRA (column 3), we were interested in its direction: the negative impact of land inequality was more evident in cross-sectional studies. Studies that use panel data showed mixed results for the direction of the impact of inequality on growth, with some positive coefficients. This was possibly due to the fact that in a panel dimension, the average annual growth rates refer to the short or medium-run; indeed, the largest number of studies estimated the impact of land Gini index on economic growth rate over five-year intervals. Deininger and Olinto [40] used a sample over 5 years for 60 countries, and Mo [43] uses a panel data set covering 1960–1985, divided into 5-year sub-periods. However, as also pointed out in the previous section, the channels through which inequality affects growth are different in different time horizons [76].
Looking at dummies for the estimation techniques, our evidence suggests that the diversity in the effects sizes was in part explained by differences in techniques. The cross-sectional analyses used the OLS estimator to quantify the impact of inequality on growth, whilst panel studies used panel estimation techniques, such as fixed and random models, or instrumental variables (IV) estimator, or still, OLS to “within groups,” and so on, even if none of these techniques are completely adequate to estimate the inequality–growth linkage [40]. For example, the variation of land inequality is mostly cross-sectional and likely persistent in time series; therefore, FE models usually yield biased results. Instead, the RE estimator leads to inconsistency of results because of the correlation between the country-specific effects and the variables commonly included in the analysis to assess the nexus between land inequality and growth. Surprisingly, the statistically insignificant coefficient associated to the dummy for the Generalised Method of Moments GMM does not signal that more appropriate estimation techniques produce large diversity in estimates of the impact of land inequality on growth. Whereas the positive sign of the significant coefficient related to the Two-Stage least squares (2SLS) estimator suggests that the negative relationship between inequality and growth weakens when studies correct for endogeneity.
Regarding the heterogeneity produced by the fact that studies use different sources of data, we added dummies for sources used for the economic growth and the land Gini index. All estimated coefficients of this set of controls (with exception for National Statistic Office) were statistically significant; the use of different databases might influence the wide variety of findings.
Finally, since the peer-review process can greatly affect the magnitude of the estimated effect, the inclusion of published and unpublished articles allows us to evaluate the potential “publication impact” including in our MRA the “dummy for published.” Its estimated coefficient was negative and statistically significant, signaling that indeed, the peer-review process exerted some influence on reported results in the collected studies.
5. Relevance of the Topic: Commercial Pressure on Land and the Risk of Land Concentration
The commodity price boom in 2007–2008 has been followed by a wave of large-scale land acquisitions (LSLAs), especially through FDI, in low-income countries. Efforts to collect data systematically [77,78] and an extensive case study literature [11,12,79,80,81] have improved data availability and confirm a growing interest in international land-based investments. Figure 3 shows the geographic break down of the count of deals, transnational and national, by target region, based on Land Matrix data (last accessed June 2018).
The data indicate that the region most targeted in terms of international investments is Africa, and indeed most of the case study literature on LSLAs (the “land grabbing” debate) regards countries within the region. We therefore focus on Africa to argue the relevance of land inequality for the current development debate.
Land balances worldwide show that a large share of the remaining land suitable for agriculture not already in use (net balance) is actually concentrated in African countries, in particular the Sub-Saharan region, and although the estimates of the area for cropland expansion are very sensitive to the definition of “potentially available” land, it is strongly confirmed that in Africa, arable land is relatively abundant [79,82]. Accordingly, the idea of a vast extensive margin for agriculture and of egalitarian farm structures has long been in the background of the development discourse on Africa.
However, the recent debate on LSLAs has refocused attention on land and contributed to reshape the perspective on agrarian structures [79,83] by pointing out that surplus land in Africa is concentrated within relatively few countries, whilst other countries are land constrained and experiencing declining farm sizes [83,84,85]. This is largely a result of demographic trends, since sub-Saharan Africa is forecasted to have positive rates of growth of rural population to 2050 [86].
As for land distribution, the historical record [49] shows that inequality in West and Central Sub-Saharan Africa was relatively low but, even then, there was significant heterogeneity. Recent studies on land inequality have reported evidence of rising Gini coefficients over time [83,87] and data from national and international sources (mostly around the year 2000) show that more than half of the countries in Africa have values of the Gini index for land distribution above 0.5 [77].
In this context, international investors have targeted Africa with deals of very large sizes (see Table 5), a pattern of acquisitions that does not depend on the concentration of investments in sectors that usually operate on large scale [11,12,13,80,81,88,89,90].
Furthermore, host governments that perceive commitments on investment and employment as their main advantage tend to offer very favorable conditions on large deals and this creates a strong incentive to adopt a plantation model in agriculture [12,80].
The functioning of contemporary land markets in Africa may contribute to rising inequality in three ways. First, through land titling, i.e., the transfer of land out of customary tenure, which increases the availability of land for sale on the market [75,83,90,91,92,93]. Second, there is evidence of a rise of medium-scale holdings, linked more to acquisitions by domestic investors belonging to the urban or rural elites than to the expansion of small-scale into medium-scale farmers [83].
Third, the role of governments in the structure of property rights on land in Sub-Saharan Africa may contribute to land concentration. “State landlordism,” insecurity of land tenure and the crucial role of the state in land transactions are likely to determine a pattern of acquisitions characterized by deals of very large size and commercial pressure can lead to a development path oriented towards land concentration. This is reinforced by the fact that FDI flows are very large compared to the economic size of target countries [78,81,90,94,95,96].
In summary, recent evidence indicates that commercial pressure on land in the context of complex property rights structures may result in development patterns based on land concentration. This evidence led us to re-examine through MA the literature on land inequality and growth.
6. Conclusions
We reviewed the findings of the literature estimating the impact of land inequality on growth through a meta-analysis and we argue, focusing on Africa, that our topic is relevant since increasing commercial pressure on land may determine development patterns based on land concentration, with negative implications on sustainable development.
In the meta-analytical assessment, we have tested for publication bias, i.e., a bias to report econometric findings pointing in a precise direction and, in particular, we have found a bias in favor of the negative results. However, in this MA, we have controlled for publication bias, various characteristics and methodologies adopted by different articles collected, and we have obtained evidence that the land-inequality does indeed have a negative impact on economic growth. Furthermore, such an impact is more substantial for developing countries. We also found that articles relying on panel data, which generally imply a relatively short- or medium-run perspective, typically report a lower or positive correlation between economic growth and land inequality, suggesting that the negative impact of land inequality on growth operates in the long run, possibly through credit constraints and institutional mechanisms.
We are aware that the main limitation of our MA is that it relies on small number of studies (only 22), but those ones were almost the whole range of the econometric articles about the nexus land inequality growth. Thus, summarizing the main finding of our analysis, we can argue that land inequality negatively affects growth essentially in the long run and in the developing areas.
Author Contributions
Conceptualization, N.C.; Methodology, M.C., N.C., and G.D.; Software, M.C., G.D.; Validation, M.C., N.C., and G.D.; Formal Analysis, M.C., N.C., and G.D.; Investigation, M.C., N.C., and G.D.; Resources, M.C., N.C., and G.D.; Data Curation, M.C., G.D.; Writing-Original Draft Preparation, N.C., G.D.; Writing-Review & Editing, M.C., N.C., and G.D.; Visualization, M.C.; Supervision, N.C.
Funding
This research received no external funding.
Conflicts of Interest
The authors declare no conflict of interest.
Appendix A

Table A1.
Summary of studies included in the MA.
| Article | Simple Mean | Type of Publication | Framework (Model) | Dependent Variable (Growth of) | Country | Structure of Data | Estimation Technique | Data Source | Time Span |
|---|---|---|---|---|---|---|---|---|---|
| Alesina and Rodrik [35] | −6.073 | Journal | Political Economy | Income | Developing & Developed | Cross-sectional/Pooled | OLS | Taylor and Hudson | 1960–1985 |
| Balisacan and Fuwa [58] | 0.001 | Journal | Empirical | Expenditure | Philippines | Panel Data | IV | National Statistic Office | 1988–1997 |
| Benjamin et al. [48] | −0.077 | WP | Empirical | Income | China | Panel Data | Panel-FE | Household survey | 1986–1999 |
| Birdsall and Londoño [53] | −0.031 | WP | Empirical | Income, GDP | Developing & Developed | Cross-sectional/Pooled | OLS | Deininger–Squire dataset | 1960–1993 |
| Birdsall and Londoño [54] | −0.030 | Journal | Empirical | Income, GDP | Developing & Developed | Cross-sectional/Pooled | OLS | Deininger–Squire dataset | 1960–1993 |
| Carter [50] | −0.005 | WP | Empirical | GDP Output | Developing & Developed | Panel Data | Mixed effect-RE | Deininger and Olinto 1999/FAO | 1960–1993 |
| Caselli [56] | −0.042 | Journal | Empirical | GDP | Developing | Cross-sectional/Pooled | OLS | Deininger and Olinto and Taylor Hudson | 1965–1994 |
| Deininger and Olinto [61] | −0.001 | WP | Endogenous HC model | GDP | Developing & Developed | Panel Data | GMM | FAO and Other Sources | 1960–1990 |
| Deininger and Squire [56] | −0.035 | Journal | Empirical | GDP, Income | Developing & Developed | Cross-sectional/Pooled | OLS | FAO and Other Sources | 1960–1992 |
| Fort [63] | −0.035 | Journal | Endogenous HC | GDP | Developing & Developed | Panel Data | GMM | FAO | 1960–1990 |
| Fort and Ruben [62] | −0.057 | WP | Endogenous HC | GDP | Developing & Developed | Panel Data | GMM | FAO | 1970–1990 |
| Keefer and Knack [46] | −0.033 | Journal | Political Economy | Income | Developing & Developed | Cross-sectional/Pooled | OLS | FAO | 1972–1990 |
| Li and Zou [57] | −0.031 | Journal | Empirical | GDP | Developing & Developed | Cross-sectional/Pooled | OLS | World Bank National Accounts | 1960–1990 |
| Li et al. [95] | −0.028 | Journal | Empirical | Income | Developing & Developed | Panel Data | AR, IV, OLS/Panel-FE | World Bank National Accounts | 1947–1994 |
| Li et al. [94] | −0.003 | Journal | Political Economy | GDP | Developing & Developed | Panel Data | 2SLS, OLS/Panel-FE | World Bank National Accounts | 1980–1992 |
| Lundberg and Squire [52] | 0.011 | WP | Empirical | GDP | Developing & Developed | Panel Data | IV | Deininger–Squire dataset | 1960–1993 |
| Lundberg and Squire [47] | 0.023 | Journal | Empirical | GDP | Developing & Developed | Panel Data | OLS/Panel-FE | Deininger–Squire dataset | 1960–1993 |
| Mo [64] | −3.428 | Journal | Endogenous HC | GDP | Developing | Panel Data | OLS/Panel-FE | Taylor and Hudson | 1960–1985 |
| Nunn [70] | −0.013 | MPRA Paper | Historical model | Income | Americas | Cross-Country | OLS | National Statistic Office | 2000 |
| Vollrath [59] | −1.470 | WP | Empirical | Agri Output per Worker | Developing & Developed | Panel Data | OLS | FAO | 1960–1990 |
| Vollrath [60] | −0.656 | Journal | Empirical | Agri Output per Worker | Developing & Developed | Panel Data | OLS, Panel-FE, RE, AR | FAO | 1960–1990 |
| Weede [39] | −0.038 | Journal | Political Economy | GDP | Developing & Developed | Cross-sectional/Pooled | OLS | Taylor and Hudson | 1960–1985 |
Appendix B
Table A2.
Descriptive statistics of computed PCCs.
| Paper | Mean | Median | Min | Max | Obs |
|---|---|---|---|---|---|
| Total sample | −0.19 | −0.19 | −0.62 | 0.49 | 180 |
| Alesina and Rodrik [35] | −0.54 | −0.54 | −0.62 | −0.48 | 8 |
| Balisacan and Fuwa [58] | 0.38 | 0.38 | 0.37 | 0.38 | 2 |
| Benjamin et al. [48] | −0.13 | −0.14 | −0.21 | −0.02 | 4 |
| Birdsall and Londoño [53] | −0.22 | −0.16 | −0.30 | −0.16 | 14 |
| Birdsall and Londoño [54] | −0.23 | −0.22 | −0.30 | −0.16 | 4 |
| Carter [50] | −0.01 | −0.01 | −0.07 | 0.05 | 2 |
| Caselli [56] | −0.26 | −0.35 | −0.52 | 0.04 | 12 |
| Deininger and Olinto [61] | −0.10 | −0.11 | −0.50 | 0.49 | 26 |
| Deininger and Squire [56] | −0.26 | −0.23 | −0.47 | 0.05 | 20 |
| Fort [63] | −0.15 | −0.26 | −0.41 | 0.36 | 7 |
| Fort and Ruben [62] | −0.24 | −0.28 | −0.40 | 0.16 | 7 |
| Keefer and Knack [46] | −0.28 | −0.28 | −0.33 | −0.22 | 2 |
| Li and Zou [57] | −0.48 | −0.48 | −0.52 | −0.43 | 4 |
| Li et al. [95] | −0.16 | −0.20 | −0.32 | 0.03 | 6 |
| Li et al. [94] | −0.03 | −0.02 | −0.20 | 0.10 | 14 |
| Lundberg and Squire [52] | −0.02 | 0.03 | −0.28 | 0.16 | 4 |
| Lundberg and Squire [47] | −0.02 | −0.02 | −0.17 | 0.13 | 2 |
| Mo [64] | −0.30 | −0.32 | −0.37 | −0.18 | 10 |
| Nunn [70] | −0.01 | −0.00 | −0.15 | 0.13 | 4 |
| Vollrath [59] | −0.08 | −0.06 | −0.12 | −0.06 | 4 |
| Vollrath [60] | −0.18 | −0.19 | −0.26 | −0.10 | 14 |
| Weede [39] | −0.31 | −0.28 | −0.48 | −0.17 | 10 |
References
- Ostry, J.; Berg, A.; Charalambos, G.; Tsangarides, C. Redistribution, Inequality, and Growth. IMF Staff Discussion Note 2014. Available online: https://www.imf.org/external/pubs/ft/sdn/2014/sdn1402.pdf (accessed on 20 June 2017).
- Rajan, R. Fault Lines: How Hidden Fractures Still Threaten the World Economy; Princeton University Press: Princeton, NJ, USA, 2010. [Google Scholar]
- Stiglitz, J. The Price of Inequality: How Today’s Divided Society Endangers Our Future; W. W. Norton & Company: New York, NY, USA, 2012. [Google Scholar]
- Berg, A.; Ostry, J.D.; Tsangarides, C.G.; Yakhshilikov, Y. Redistribution, inequality, and growth: New evidence. J. Econ. Growth 2018, 23, 259–305. [Google Scholar] [CrossRef]
- De Dominicis, L.; Florax, R.J.G.M.; de Groot, H.L.F. A Meta-Analysis on the Relationship Between Income Inequality and Economic Growth. Scott. J. Polit. Econ. 2008, 55, 654–682. [Google Scholar] [CrossRef] [Green Version]
- Neves, P.C.; Afonso, A.; Silva, T.S. A Meta-Analytic Reassessment of the Effects of Inequality on Growth. World Dev. 2016, 78, 386–400. [Google Scholar] [CrossRef]
- Cornia, A. Farm size, land yields and the agricultural production function: An analysis for fifteen developing countries. World Dev. 1985, 13, 513–534. [Google Scholar] [CrossRef]
- Ellis, F. Peasant Economics Farm Households and Agrarian Development; Cambridge University Press: Cambridge, UK, 1993. [Google Scholar]
- Lipton, M. Land Reform in Developing Countries; Routledge: London, UK, 2009. [Google Scholar]
- Collier, P.; Dercon, S. African Agriculture in 50 Years: Smallholders in a Rapidly Changing World? World Dev. 2014, 63, 92–101. [Google Scholar] [CrossRef]
- Anseeuw, W.; Alden Wily, L.; Cotula, L.; Taylor, M. Land Rights and the Rush for Land: Findings of the Global Commercial Pressures on Land Research Project; ILC: Rome, Italy, 2012. [Google Scholar]
- Cotula, L.; Vermeulen, S.; Leonard, R.; Keeley, J. Land Grab or Development Opportunity? Agricultural Investment and International Land Deals in Africa; FAO: Rome, Italy; IIED: Edinburgh, UK; IFAD: Rome, Italy, 2009. [Google Scholar]
- Conigliani, C.; Cuffaro, N.; D’Agostini, G. Large-scale land investments and forests in Africa. Land Use Policy 2018, 75, 651–660. [Google Scholar] [CrossRef]
- Alesina, A.; Rodrik, D. Distributive Politics and Economic Growth. Q. J. Econ. 1994, 109, 465–490. [Google Scholar] [CrossRef] [Green Version]
- Persson, T.; Tabellini, G. Is Inequality Harmful for Growth? Am. Econ. Rev. 1994, 84, 600–621. [Google Scholar]
- Alesina, A.; Perotti, R. Income distribution, political instability and investment. Eur. Econ. Rev. 1996, 40, 1203–1228. [Google Scholar] [CrossRef]
- Brueckner, M.; Lederman, D. Inequality and economic growth: The role of initial income. J. Econ. Growth 2018, 23, 341–366. [Google Scholar] [CrossRef]
- Weede, E. Income inequality, democracy and growth reconsidered. Eur. J. Polit. Econ. 1997, 13, 751–764. [Google Scholar] [CrossRef]
- Bourguignon, F.; Verdier, T. Oligarchy, Democracy, Inequality and Growth. J. Dev. Econ. 2000, 62, 285–313. [Google Scholar] [CrossRef]
- Galor, O.; Zeira, J. Income Distribution and Macroeconomics. Rev. Econ. Stud. 1993, 60, 35–52. [Google Scholar] [CrossRef]
- Perotti, R. Political equilibrium, income distribution, and growth. Rev. Econ. Stud. 1993, 60, 755–776. [Google Scholar] [CrossRef]
- Banerjee, A.; Newmann, A. Risk—Bearing and the theory of income distribution. Rev. Econ. Stud. 1991, 58, 211–236. [Google Scholar] [CrossRef]
- Benabou, R. Inequality and Growth; CEPR Discussion Paper No. 1450; Centre for Economic Policy Research: London, UK, 1996. [Google Scholar]
- Piketty, T. The dynamics of wealth distribution and the interest rate with credit rationing. Rev. Econ. Stud. 1997, 64, 173–189. [Google Scholar] [CrossRef]
- Keefer, P.; Knack, S. Polarization, Politics and Property Rights: Links between Inequality and Growth. Public Choice 2002, 111, 127–154. [Google Scholar] [CrossRef]
- Lundberg, M.; Squire, L. The Simultaneous Evolution of Growth and Inequality. Econ. J. 2003, 113, 326–344. [Google Scholar] [CrossRef]
- Benjamin, D.; Brandt, L.; Giles, J. Inequality and Growth in Rural China: Does Higher Inequality Impede Growth? IZA Discussion Paper No. 2344; Institute of Labor Economics: Bonn, Germany, 2006. [Google Scholar]
- Kuznets, S. Economic growth and income inequality. Am. Econ. Rev. 1955, 45, 1–28. [Google Scholar]
- Carter, M.R. Land Ownership Inequality and the Income Distribution Consequences of Economic Growth; Working Papers No. 201; UNU World Institute for Development Economics Research: Helsinki, Finland, 2000. [Google Scholar]
- Deininger, K.; Squire, L. New ways of looking at old issues: Inequality and growth. J. Dev. Econ. 1998, 57, 259–287. [Google Scholar] [CrossRef]
- Lundberg, M.; Squire, L. The Simultaneous Evolution of Growth and Inequality; The World Bank, 1999. Available online: http://citeseerx.ist.psu.edu/viewdoc/download?doi=10.1.1.199.2127&rep=rep1&type=pdf (accessed on 14 January 2016).
- Birdsall, N.; Londoño, J.L. Asset inequality matters: An assessment of the World Bank’s approach to poverty reduction. Am. Econ. Rev. 1997, 87, 32–37. [Google Scholar]
- Birdsall, N.; Londoño, J.L. Asset Inequality Does Matter: Lessons from Latin America; OCE Working Paper. Inter America Development Bank, 1997. Available online: https://papers.ssrn.com/sol3/papers.cfm?abstract_id=1815972 (accessed on 20 June 2015).
- Deininger, K.; Squire, L. Measuring income inequality: A new data-base. World Bank Econ. Rev. 1996, 10, 565–591. [Google Scholar] [CrossRef]
- Caselli, M. Does High Inequality in Developing Countries Lead to Slow Economic Growth? Undergrad. Econ. Rev. 2005, 2, 2. [Google Scholar]
- Li, H.; Zou, H. Income Inequality is not harmful for growth: Theory and Evidence. Rev. Dev. Econ. 1998, 2, 318–334. [Google Scholar] [CrossRef]
- Balisacan, A.M.; Fuwa, N. Growth, Inequality and Politics Revisited: A Developing-country Case. Econ. Lett. 2003, 79, 53–58. [Google Scholar] [CrossRef]
- Vollrath, D. Land Distribution and International Agricultural Productivity. 2004. Available online: https://ssrn.com/abstract=694768 (accessed on 3 September 2015).[Green Version]
- Vollrath, D. Land Distribution and International Agricultural Productivity. Am. J. Agric. Econ. 2007, 89, 202–216. [Google Scholar] [CrossRef] [Green Version]
- Deininger, K.; Olinto, P. Asset Distribution, Inequality, and Growth; Policy Research Working Paper No. 2375; World Bank: Washington, DC, USA, 2000; Available online: https://openknowledge.worldbank.org/handle/10986/19830 (accessed on 5 September 2015).
- Fort, R.; Ruben, R. Land Inequality and Economic Growth: A Dynamic Panel Data Approach. Presented at the International Association of Agricultural Economists Conference, Gold Coast, Australia, 12–18 August 2006; Available online: http://ageconsearch.umn.edu/record/25582/files/cp060160.pdf (accessed on 27 March 2016).
- Fort, R. Land inequality and economic growth: A dynamic panel data approach. Agric. Econ. 2007, 37, 159–165. [Google Scholar] [CrossRef]
- Mo, P.H. Land Distribution inequality and Economic growth: Transmission channels and effects. Pac. Econ. Rev. 2003, 8, 171–181. [Google Scholar] [CrossRef]
- Acemoglu, D.; Johnson, S.; Robinson, J.A. The colonial origins of comparative development: An empirical investigation. Am. Econ. Rev. 2001, 91, 1369–1401. [Google Scholar] [CrossRef]
- Acemoglu, D.; Robinson, J.A. Why Nations Fail; Crown Business: New York, NY, USA, 2012. [Google Scholar]
- Engerman, S.L.; Sokoloff, K.L. Factor Endowments, Institutions, and Differential Paths of Growth among New World Economies: A View from Economic Historians of the United States. In How Latin America Fell Behind; Haber, S., Ed.; Stanford University Press: Stanford, CA, USA, 1997. [Google Scholar]
- Easterly, W. Inequality Does Causes Underdevelopment: New Evidence. Center for Global Development Working Paper No. 1. , 2002. Available online: https://www.cgdev.org/sites/default/files/2789_file_cgd_wp001.pdf (accessed on 13 May 2017).
- Easterly, W. Inequality does cause underdevelopment: Insights from a new instrument. J. Dev. Econ. 2007, 84, 755–776. [Google Scholar] [CrossRef] [Green Version]
- Frankema, E. The Colonial Origins of Inequality: Exploring the Causes and Consequences of Land Distribution. In Poverty, Inequality, and Policy in Latin America; Klasen, S., Nowak-Lehmann, F., Eds.; MIT Press: Cambridge, MA, USA, 2013. [Google Scholar]
- Nunn, N. Slavery, Inequality, and Economic Development in the Americas: An Examination of the Engerman—Sokoloff Hypothesis. MPRA Paper 4080. University of British Columbia, 2007. Available online: https://scholar.harvard.edu/nunn/publications/slavery-inequality-and-economic-development-americas-examination-engerman-sokolof (accessed on 28 October 2016).
- Glass, G. Primary, Secondary, and Meta-Analysis of Research. Educ. Res. 1976, 10, 3–8. [Google Scholar] [CrossRef]
- Doucouliagos, C. Publication bias in the economic freedom and economic growth literature. J. Econ. Surv. 2005, 19, 367–387. [Google Scholar] [CrossRef]
- Doucouliagos, C.; Paldam, M. The ineffectiveness of development aid on growth: An update. Eur. J. Polit. Econ. 2011, 27, 399–404. [Google Scholar] [CrossRef]
- Doucouliagos, C.; Paldam, M. The Robust Result in Meta-Analysis of Aid Effectiveness: A Response to Mekasha and Tarp. J. Dev. Stud. 2013, 49, 584–587. [Google Scholar] [CrossRef]
- Doucouliagos, C.; Paldam, M. Aid effectiveness on growth. A meta study. Eur. J. Polit. Econ. 2008, 24, 1–24. [Google Scholar] [CrossRef]
- Doucouliagos, C.; Paldam, M. Conditional aid effectiveness. A meta study. J. Int. Dev. 2010, 22, 391–410. [Google Scholar] [CrossRef]
- Mekasha, T.J.; Tarp, F. Aid and Growth: What Meta-Analysis Reveals. J. Dev. Stud. 2013, 49, 564–583. [Google Scholar] [CrossRef] [Green Version]
- Askarov, Z.; Doucouliagos, C. Development aid and growth in transition countries. World Dev. 2015, 66, 383–399. [Google Scholar] [CrossRef]
- Havranek, T.; Horvath, R.; Zeynalov, A. Natural Resources and Economic Growth: A Meta-Analysis. World Dev. 2016, 88, 134–151. [Google Scholar] [CrossRef] [Green Version]
- Shadish, W. A review and critique of controlled studies of the effectiveness of preventive child health care. Health Policy Quart. 1982, 2, 24–52. [Google Scholar]
- Light, R.; Pillemer, D. Summing Up—The Science of Reviewing Research; Harvard University Press: Cambridge, MA, USA, 1984. [Google Scholar]
- Doucouliagos, C. Worker participation and productivity in labour-managed and participatory capitalist firms: A Meta-Analysis. Ind. Lab. Relat. Rev. 1995, 49, 58–77. [Google Scholar] [CrossRef]
- Stanley, T.D.; Doucouliagos, C. Meta-Regression Analysis in Economics and Business; Routledge: New York, NY, USA, 2012. [Google Scholar]
- Hedges, L.; Olkin, I. Statistical Methods for Meta-Analysis; Academic Press: New York, NY, USA, 1985. [Google Scholar]
- Higgins, J.; Thompson, S. Quantifying heterogeneity in a Meta-Analysis. Stat. Med. 2002, 21, 1539–1558. [Google Scholar] [CrossRef] [PubMed]
- Sutton, A.; Duval, S.; Tweedie, R.; Abrams, K.; Jones, D. Empirical Assessment of effect of publication bias on meta-analyses. Br. Med. J. 2000, 320, 1574–1577. [Google Scholar] [CrossRef]
- Stanley, T.D.; Doucouliagos, H.; Steel, P. Does ICT Generate Economic Growth? A Meta-Regression Analysis. J. Econ. Surv. 2018, 32, 705–726. [Google Scholar] [CrossRef]
- Stanley, T.D.; Doucouliagos, H. Neither fixed nor random: Weighted least squares Meta-Analysis. Stat. Med. 2015, 34, 2116–2127. [Google Scholar] [CrossRef]
- Egger, M.; Smith, G.; Scheider, M.; Minder, C. Bias in Meta-Analysis detected by a simple, graphical test. Br. Med. J. 1997, 316, 629–634. [Google Scholar] [CrossRef]
- Stanley, T.D.; Doucouliagos, H.; Jarrell, S. Meta-regression analyses as the socio-economics of economics research. J. Behav. Exp. Econ. 2008, 37, 276–292. [Google Scholar] [CrossRef]
- Disdier, A.-C.; Head, K. The puzzling persistence of the distance effect on bilateral trade. Rev. Econ. Stat. 2008, 90, 37–48. [Google Scholar] [CrossRef]
- Cipollina, M.; Salvatici, L. Reciprocal trade agreements in gravity models: A Meta-Analysis. Rev. Int. Econ. 2010, 18, 63–80. [Google Scholar] [CrossRef]
- Stanley, T.D.; Doucouliagos, H. Meta-regression approximations to reduce publication selection bias. Res. Synth. Methods 2014, 5, 60–78. [Google Scholar] [CrossRef]
- Li, H.; Xu, C.L.; Zou, H. Corruption, Income Distribution, and Growth. Econ. Polit. 2000, 12, 155–181. [Google Scholar] [CrossRef]
- Li, H.; Squire, L.; Zou, H. Explaining international and intertemporal variations in income inequality. Econ. J. 1998, 108, 26–43. [Google Scholar] [CrossRef]
- Knowles, S. Inequality and economic growth: The empirical relationship reconsidered in the light of comparable data. J. Dev. Stud. 2005, 41, 135–139. [Google Scholar] [CrossRef]
- GRAIN. 2010. Available online: http://www.grain.org/articles/?id=64 (accessed on 15 May 2017).
- Anseeuw, W.; Boche, M.; Breu, T.; Giger, M.; Lay, J.; Messerli, P.; Nolte, K. Transnational Land Deals for Agriculture in the Global South. Analytical Report Based on the Land Matrix Database; CDE: Bern, Switzerland; CIRAD: Montpellier, France; GIGA: Hamburg, Germany, 2012. [Google Scholar]
- Deininger, K.; Byerlee, D. Rising Global Interest in Farmland: Can It Yield Sustainable and Equitable Benefits? World Bank: Washington, DC, USA, 2011. [Google Scholar]
- GTZ. Foreign Direct Investment (FDI) in Land in Developing Countries; Deutsche Gesellschaft für Technische Zusammenarbeit: Bonn, Germany, 2009. [Google Scholar]
- Oxfam. Land and Power. The Growing Scandal Surrounding the New Wave of Investment in Land. 2011. Available online: www.oxfam.org/grow (accessed on 15 April 2013).
- Chamberlin, J.; Jayne, T.S.; Headey, D. Scarcity amid Abundance? Reassessing the potential for cropland expansion in Africa. Food Policy 2014, 48, 51–65. [Google Scholar] [CrossRef]
- Jayne, T.S.; Chamberlin, J.; Headey, D. Land pressures, the evolution of farming systems, and development strategies in Africa: A synthesis. Food Policy 2014, 48, 1–17. [Google Scholar] [CrossRef]
- HLPE. Investing in Smallholder Agriculture for Food Security; A Report by the High Level Panel of Experts on Food Security and Nutrition of the Committee on World Food Security; FAO: Rome, Italy, 2013. [Google Scholar]
- Lowder, S.; Skoet, J.; Raney, T. The Number, Size and Distribution of Farms, Smallholder Farms and Family Farms Worldwide. World Dev. 2016, 87, 16–19. [Google Scholar] [CrossRef]
- United Nations. Department of Economic and Social Affairs, Population Division. World Urbanization Prospects: The 2014 Revision. 2014. Available online: https://esa.un.org/unpd/wup/publications/files/wup2014-report.pdf (accessed on 14 June 2016).
- Headey, D.D.; Jayne, T.S. Adaptation to Land Constraints: Is Africa Different. Food Policy 2014, 48, 18–33. [Google Scholar] [CrossRef]
- Arezki, R.; Deininger, K.; Selod, H. What Drives the Global Land Rush? IMF Working Paper, WP/11/251. 2011. Available online: http://documents.worldbank.org/curated/en/229581468337294753/What-drives-the-global-land-rush (accessed on 21 May 2014).
- FAO. Trends and Impact of Foreign Direct Investments in Developing Country Agriculture. Evidence from Case Studies. Rome, November 2012. Available online: http://www.fao.org/docrep/017/i3112e/i3112e.pdf (accessed on 14 April 2013).
- Cuffaro, N.; Giovannetti, G.; Monni, S. Foreign Acquisitions of Land in Developing Countries. Risks, Opportunities and New Actors. QA Rivista dell’Associazione Rossi-Doria 2012, 2, 9–36. [Google Scholar] [CrossRef]
- Herbst, J. States and Power in Africa; Princeton University Press: Princeton, NJ, USA, 2000. [Google Scholar]
- Holden, S.; Otsuka, K. The roles of land tenure reforms and land markets in the context of population growth and land use intensification in Africa. Food Policy 2014, 48, 88–97. [Google Scholar] [CrossRef]
- Cotula, L. Changes in “Customary” Land Tenure System in Africa; IIED: London, UK; FAO: Rome, Italy, 2007. [Google Scholar]
- Cuffaro, N. Population, Economic Growth and Agriculture in Less Developed Countries; Routledge: London, UK; New York, NY, USA, 2002. [Google Scholar]
- Alden Wily, L. “The Law is to Blame”: The Vulnerable Status of Common Property Rights in Sub-Saharan Africa. Dev. Chang. 2011, 42, 733–757. [Google Scholar] [CrossRef]
- Cotula, L. Commercial Pressures and Legal Rights: The Law Regulating Agricultural Investment in Africa. QA Rivistadell’Associazione Rossi-Doria 2013, 3, 165–196. [Google Scholar] [CrossRef]
Figure 1.
Heterogeneity in the estimates of growth-inequality (PCC; n = 180).

Figure 2.
Funnel plot of growth-inequality PCCs (n = 180). Each data point represents the estimated effects of land inequality on economic growth. The value of the weighted average PCC is indicated by the vertical continuous line.
Figure 2.
Funnel plot of growth-inequality PCCs (n = 180). Each data point represents the estimated effects of land inequality on economic growth. The value of the weighted average PCC is indicated by the vertical continuous line.

Figure 3.
Total acquisitions (number of contracts concluded) by region.

Table 1.
Basic MA.
| PCC | Z-Transformed Correlation | |||||
|---|---|---|---|---|---|---|
| Mean | 95% Confidence Interval | Mean | 95% Confidence Interval | |||
| Simple mean | −0.19 *** | −0.22 | −0.16 | −0.20 *** | −0.23 | −0.17 |
| FEE | −0.13 *** | −0.14 | −0.12 | −0.13 *** | −0.14 | −0.12 |
| REE | −0.17 *** | −0.20 | −0.15 | −0.18 *** | −0.21 | −0.16 |
| WLS | −0.13 *** | −0.15 | −0.10 | −0.13 *** | −0.16 | −0.11 |
Notes: No. of obs. = 180. No. of studies = 22. Weights: PCC precision squared, (); *** p < 0.01.
Table 2.
Publication selection: FAT-PET MA model.
| Weighted Least Squares Model | Fixed-Effect Panel Model | Random-Effect Panel Model | Multilevel Mixed-Effect Model | |
|---|---|---|---|---|
| Standard Error | −1.29 *** | −0.23 | −0.71 | −0.789 |
| (FAT): | (0.45) | (0.6) | (0.51) | (0.50) |
| Constant | −0.05 | −0.17 *** | −0.10 | −0.09 |
| (PET): | (0.04) | (0.06) | (0.07) | (0.06) |
| Observations | 180 | 180 | 180 | 180 |
| N. of studies | 22 | 22 | 22 | 22 |
Notes: Weights: PCC precision squared, (); Robust standard errors adjusted for studies/clusters are reported in parentheses; *** p-value < 0.01.
Table 3.
PEESE corrections for publication selection.
| Weighted Least Squares Model | Fixed-Effect Panel Model | Random-Effect Panel Model | Multilevel Mixed-Effect Model | |
|---|---|---|---|---|
| −0.09 *** | −0.18 *** | −0.13 *** | −0.13 *** | |
| 95% C.I. | [−0.14,−0.03] | [−0.25,−0.11] | [−0.22,−0.04] | [−0.22,−0.04] |
| Observations | 180 | 180 | 180 | 180 |
| Adjusted R2 | 0.11 | - | - | - |
| N. of studies | 22 | 22 | 22 | 22 |
Notes: Weights: PCC precision squared, (); Robust standard errors adjusted for studies/clusters are reported in parentheses; *** p-value < 0.01.
Table 4.
Multiple WLS MRA results.
| Publication Selection | Simple MRA | ||
|---|---|---|---|
| Weighted Least Squares Model | WLS—PEESE Correction | ||
| Standard Error | 0.70 | ||
| (FAT): | (1.06) | ||
| Standard Error Squared | 3.5 | ||
| (PEESE): | (4.60) | ||
| Constant | −0.44 ** | −0.41 *** | −0.33 *** |
| (PET): | (0.18) | (0.12) | (0.04) |
| Country dummies | |||
| Developed | 0.11 ** | 0.10 ** | 0.14 *** |
| (0.04) | (0.05) | (0.01) | |
| Developing | −0.16 *** | −0.17 *** | −0.14 *** |
| (0.04) | (0.04) | (0.01) | |
| Controls for theoretical framework | |||
| Endogenous HC models | −0.37 *** | −0.35 *** | −0.33 *** |
| (0.09) | (0.06) | (0.06) | |
| Political Economy models | −0.31 *** | −0.29 *** | −0.28 *** |
| (0.07) | (0.06) | (0.05) | |
| Methodological dummies | |||
| Dummies for the dependent variable | |||
| GDP | −0.15 *** | −0.15 *** | −0.13 *** |
| (0.03) | (0.03) | (0.00) | |
| Agricultural Production | −0.08 | −0.08 | −0.06 |
| (0.05) | (0.05) | (0.04) | |
| Dummies for structure of data | |||
| Panel Data | 0.15 ** | 0.17 ** | 0.13 ** |
| (0.07) | (0.07) | (0.05) | |
| Dummies for estimators | |||
| 2SLS | 0.14 *** | 0.13 *** | 0.11 *** |
| (0.04) | (0.03) | (0.03) | |
| GMM/AR | 0.04 | 0.03 | 0.01 |
| (0.05) | (0.04) | (0.04) | |
| IV | 0.07 | 0.07 | 0.06 |
| (0.05) | (0.04) | (0.04) | |
| FE | 0.09 * | 0.08 ** | 0.07 ** |
| (0.05) | (0.03) | (0.03) | |
| RE/Mixed-effect | 0.07 | 0.06 | 0.04 |
| (0.05) | (0.04) | (0.04) | |
| Controls for studies’ characteristics | |||
| Sources for the variable “growth” | |||
| World Bank | 0.37 *** | 0.36 *** | 0.37 *** |
| (0.01) | (0.01) | (0.00) | |
| Sources for the variable “land-Gini” | |||
| FAO | 0.29 * | 0.27 ** | 0.19 *** |
| (0.15) | (0.11) | (0.05) | |
| National Statistic Office | 0.05 | 0.04 | −0.05 |
| (0.17) | (0.13) | (0.04) | |
| World Bank National Accounts | −0.22 * | −0.22 ** | −0.29 *** |
| (0.11) | (0.10) | (0.04) | |
| Dummy for published | −0.12** | −0.11*** | −0.09*** |
| (0.05) | (0.04) | (0.03) | |
| Period dummies | Yes | Yes | Yes |
| Observations | 180 | 180 | 180 |
| Adjusted R2 | 0.37 | 0.37 | 0.38 |
| No. of studies | 22 | 22 | 22 |
Notes: Weights: PCC precision squared, (); Robust Standard errors adjusted for studies/clusters are reported in parentheses; *** p-value < 0.01, ** p-value < 0.05, * p-value < 0.1. The omitted group as a control for Country dummies was the dummy sample of countries, corresponding to the case of analyses, including both developed and developing countries. The omitted category for Controls for theoretical framework was a dummy related to the set of the empirically oriented literature on distribution. Other omitted dummies: income for Dependent Variable, cross-section/pooled data for Structure of data, OLS/pooled estimator for Estimator dummies, and other sources for variables “growth” and “land-Gini”.
Table 5.
LSLAs in Africa including deal counts and areas acquired.
| Investors | No. of Deals | Average Size (1000 ha) | Percentage of Area (%) |
|---|---|---|---|
| National | 174 | 48 | 34 |
| International | 231 | 52 | 49 |
| Mixed | 110 | 37 | 16 |
| Unknown | 2 | 130 | 1.5 |
| Total | 517 | 48 | 100 |
Notes: Authors elaboration on Land Matrix accessed June 2017.
© 2018 by the authors. Licensee MDPI, Basel, Switzerland. This article is an open access article distributed under the terms and conditions of the Creative Commons Attribution (CC BY) license (http://creativecommons.org/licenses/by/4.0/).
Share and Cite
MDPI and ACS Style
Cipollina, M.; Cuffaro, N.; D’Agostino, G. Land Inequality and Economic Growth: A Meta-Analysis. Sustainability 2018, 10, 4655. https://doi.org/10.3390/su10124655
AMA Style
Cipollina M, Cuffaro N, D’Agostino G. Land Inequality and Economic Growth: A Meta-Analysis. Sustainability. 2018; 10(12):4655. https://doi.org/10.3390/su10124655
Chicago/Turabian StyleCipollina, Maria, Nadia Cuffaro, and Giovanna D’Agostino. 2018. "Land Inequality and Economic Growth: A Meta-Analysis" Sustainability 10, no. 12: 4655. https://doi.org/10.3390/su10124655
Note that from the first issue of 2016, this journal uses article numbers instead of page numbers. See further details here.