Research on the Optimization of Regional Green Infrastructure Network

1
The College of Environment and Planning, Henan University, Kaifeng 475004, China
2
The College of Civil Engineering and Architecture, Henan University, Kaifeng 475004, China
*
Author to whom correspondence should be addressed.
Sustainability 2018, 10(12), 4649; https://doi.org/10.3390/su10124649
Submission received: 31 October 2018
/
Revised: 26 November 2018
/
Accepted: 5 December 2018
/
Published: 6 December 2018
Abstract
:With the rapid rate of urbanization, green infrastructure land is increasingly being converted to urban construction land, and the fragmentation of regional green infrastructure (GI) networks is intensifying. The connectivity of a GI network is of paramount importance for maintaining both regional biodiversity and regional ecosystem service capacity, among others. In this paper, an innovative approach to planning a GI network is presented. The proposed approach is based on the Morphological Spatial Pattern Analysis (MSPA) method, minimum path method, and circuit theory. Using the Zhengzhou–Kaifeng metropolitan area in China as a case study, we argue that the combination of the MSPA method and circuit theory can more fully and comprehensively identify the components of a GI network and its key areas. The methodology consists of three steps: (i) Identifying the cores and bridges of the GI by the MSPA method based on land use data, followed by determining the hubs of the GI network by assessing the connectivity of the core area; (ii) establishing potential connecting corridors between hubs by the minimum path method; (iii) identifying the “pinch point” area of the potential connecting corridors based on current density by applying circuit theory. This approach not only makes identification of the “hubs” and “links” in the green infrastructure network more scientific and comprehensive, but it also further identifies “pinch point” areas of the connecting corridors that require priority protection or recovery. The research results can be used as a practical reference for urban planners when planning urban land use.
1. Introduction
With the rapid development of urbanization, the changing pattern of the country and natural areas surrounding cities is gradually reversing the direction of the relationship between cities and natural areas [1,2]. To reverse this trend, management and development of green infrastructure is required and human behavior plays a crucial role in driving such processes [3]. All of nature should be connected to form a system, and green infrastructure (GI) is truly considered to be the infrastructure on which all sustainable development must rely on. Landscape fragmentation is the main motivation for using GI to protect the urban environment [4]. GI refers to a network of natural areas and other open spaces that preserve the value and function of natural ecosystems, maintains clean air and water, and provides a wide range of benefits for human and wildlife survival [5]. Expanding GI is one of the main strategies to enhance urban sustainability [6], and it is considered an approach to achieving regional ecological security patterns using landscape ecology principles [7]. A rational layout of GI can reduce the need for gray infrastructure, save national public resource investment, and reduce the region’s sensitivity to natural disasters. An interconnected GI is conducive to human health, wildlife breeding, and social sustainable development [8]. GI has multiple functions as a national natural life support system [9,10]. It not only protects natural and historical cultural heritage, maintains and enhances biodiversity, improves environmental quality, and helps reduce flooding; it also provides recreational facilities for people, enhances the sense of community and ecological security, and helps reduce crime, fear, and antisocial behavior [11,12,13,14,15,16]. Cities are expanding green infrastructure to enhance resilience and ecosystem services [17]. Thus, GI can promote smart growth and sustainable development in cities.
In terms of space, GI is a natural and artificial green space network system composed of hubs and links [18]. A hub typically describes a large area of natural elements that provide habitats for wildlife growth or pathways, and links are linear natural features connecting the hubs. The connected hubs form a network that can be used to guide land use decisions [19]. The core objective of GI network construction is to: (1) Find potential hubs and connecting corridors that connect various elements, and (2) determine the GI elements and patterns that enable the interconnected network to realize its overall function [20].
An increasing number of techniques and theories are being applied to GI network construction research, mainly including the overlay analysis method, spatial analysis method, graph-based analysis method, and morphological spatial pattern analysis method (MSPA). The principles and characteristics of these methods are described in detail in Table 1. Recently, other methods based on ecosystem services have received attention, wherein each green infrastructure patch serves to identify GI elements. This method is mainly used to evaluate the coupling relationship between green infrastructure and ecosystem services, and it requires a large amount of supporting data [17,21,22,23,24,25].
Each of the above methods has its own advantages and disadvantages, and the methods can be used in combination to complement each other. It is feasible to identify the “hubs” and “links” of a GI network using the above methods together.
Landscape connectivity includes structural connectivity and functional connectivity. MSPA is an image processing method that uses mathematical morphology principles, such as expansion, corrosion, open operation, closed operation, and other methods, to measure and segment the spatial pattern of raster images [36]. After reclassifying the land cover maps into the foreground and background, MSPA uses a series of image processing rules to identify the cores, connections, and other features associated with the foreground [35]. After image processing, MSPA divides the foreground into seven categories that do not overlap with each other: Core, bridge, loop, branch, edge, perforation, and islet (Table 2).
MSPA not only identifies the location of the hubs and corridors, but also can identify the type of corridor, which emphasizes structural connections, while the minimum path method can reflect the functional connectivity of the landscape by setting resistance values for different habitat patches to a certain extent. The original intention of this paper is to construct a framework for urban planning designers based on the actual needs of planning and design practice, which can quickly identify the GI elements relying on land cover data and determine the land used for a GI network. Therefore, we choose the MSPA method and minimum path method to construct the GI network.
However, none of the above methods can additionally determine the location and pattern of key areas in the GI network that need priority protection. McRac [42] was the first to integrate the physics-derived circuit theory with the field of landscape ecology and landscape genetics. He regarded the landscape as a conductive surface and simulated the migration and diffusion process of individual species or genes in the landscape by using the characteristics of electrons flowing randomly in a circuit. From this perspective, it was possible to predict the laws defining species diffusion and migration and identify multiple alternative paths of a certain width on the landscape surface. Circuit theory can determine the relative importance of habitat patches and corridors based on the intensity of the current between the source and ground, identify all potential corridors in the study area and their relative importance, and integrate structural and functional corridors into cities [43,44,45,46,47]. This method provides a simple and easy framework for optimizing the GI network pattern in a high-density built-up area using less data and a simple process.
Based on the above methods, this study aims to develop a framework for urban planning designers for identifying the GI network elements and the location of the key “pinch point” area of the corridors. On this basis, the key issues to be addressed in this paper are: (i) How to quickly identify the hubs and connecting corridors of the GI network and clearly understand the characteristics of the time and spatial changes in the GI network structure pattern; and (ii) how to determine the protection priority of the GI network to guide urban land planning and design practice. Taking the Zhengzhou–Kaifeng metropolitan area (China) as a case study, we aim to reduce the adverse impact of urban expansion on the environment and maximize the ecological services provided by rationally arranging the GI elements.
2. Materials and Methods
The Zhengzhou–Kaifeng metropolitan area, in the core region of Central China, is the largest scale, most attractive, and widest covered metropolitan area of Henan province (Figure 1). With the accelerated development of Zhengzhou–Kaifeng and the integration and the construction of the Zhengzhou–Kaifeng New District, the Zhengzhou–Kaifeng metropolitan area, which is the core economic growth pole of Central China, has become a typical “economic hot region” and “ecological sensitive region” for studying the process of urbanization. Under the background of the current accelerated process of urbanization, determining the approach to reasonably allocating GI elements and safeguarding the regional ecological environment and safety while maintaining rapid economic development has become a burning issue to be settled for the Zhengzhou–Kaifeng metropolitan area. The geographical range of the Zhengzhou–Kaifeng metropolitan area is 113°27′–114°30′ east longitude and 34°26′–34°58′ north latitude. The study area includes Zhengzhou city, Kaifeng city, and Zhongmou county, which is between the two cities [48]. The total area of the study region is 2994.76 km2. The terrain is generally high in the southwest and low in the northeast. This area has a warm temperate continental climate, with a mean annual temperature of about 14.4 °C and a mean annual precipitation rate of approximately 628.1 mm. The vegetation in the study area is located in a warm temperate deciduous broad-leaved forest belt that contains many kinds of plants. However, the natural vegetation in the study area has been almost completely destroyed because of the repeated flooding of the Yellow River and a high degree of agricultural cultivation, and secondary vegetation only appears in local areas, such as mounds, river beaches, and lakes.
This study used summer Landsat image data at different stages—2000, 2009, and 2014—with a strip number of (124, 36). Areas in the three remote sensing images were interpreted as cultivated land, forest land, water area, construction land, bare land, and unused land. Because the purpose of this paper is to build a regional GI network based on land use data, this paper believes that the type of land that can play the role of a green infrastructure ecological service can be considered as green infrastructure land, so the cultivated land, forest land, and water areas were considered as green infrastructure land in this study. At the same time, administrative maps of Zhengzhou, Kaifeng, and Zhongmou were used to analyze the distribution of GI land in different administrative regions.
These features make the Zhengzhou–Kaifeng metropolitan area suitable for our research study, which aims to scientifically identify GI elements and key areas of GI networks to rationally plan regional GI and prioritize the protection and recovery of key “pinch point” areas. Our methodological approach is discussed in the three following subsections. In the first section, we analyze the components of the green infrastructure network based on MSPA and the trends of the GI network between 2000 and 2014. Secondly, we present our construction of potential connecting corridors between the hubs of the GI based on minimum path methods. In the third subsection, we identify the “pinch point” area in the GI network’s connecting corridors based on circuit theory.
2.1. Analysis of the Components of the Green Infrastructure Network Based on MSPA
First, the cultivated land, forest land, water area, and other green infrastructure land types in the land cover map obtained by remote sensing interpretation were set as the foreground, and the rest of the land was set as the background. Then, the image was converted into a binary raster file in TIFF format. Next, in the Guidos Toolbox analysis software platform, seven types of non-overlapping landscape types were obtained through data analysis using the eight-neighbor analysis method, with the edge width set to 1 pixel (Figure 2). Finally, the TIFF map obtained by MSPA was imported into GIS software for geo-registration and analysis, and the area of each landscape type and its proportion of the whole landscape were classified and calculated (Table 3).
The MSPA method is very sensitive to scale. Different grid pixel sizes will result in different analysis results, which affects the area of the core and the bridge. Studies have shown that a 30 m wide corridor can basically meet the functional requirements for animal and plant migration and transmission and biodiversity conservation [49]. This study used a grid size of 30 × 30 m, which meets the research data accuracy requirements with respect to the landscape pattern characteristics of the Zhengzhou–Kaifeng metropolitan area.
2.2. Building Potential Connecting Corridors between Hubs of GI Based on the Minimum Path Method
The Linkage Mapper tool [50], developed by McRae et al., creates a cost-weighted distance surface based on the cost-weighted distance of each cell from the nearest “source” based on the ARCGIS software platform and calculates the minimum cost-weighted distance. It can effectively simulate potential horizontal connecting corridors between ecological sources.
First, the core area obtained by MSPA was evaluated by the CONEFOR software, and the core areas with high connectivity were selected as the hubs of the green infrastructure network. Then, a landscape resistance model of the study area was constructed based on the distribution of the site resistance values of different landscape types obtained by MSPA (Figure 3); the resistance values were determined by referring to the existing research literature [39] and expert opinions (Table 4). Finally, the minimum paths between the core areas of the GI were simulated by the Linkage Mapper tool, and the connecting corridors in the GI network plan of the study area were finally determined, combined with the distribution of the bridge area obtained by MSPA (Figure 4).
2.3. Identifying the “Pinch Point” Area in the GI Network’s Connecting Corridors Based on Circuit Theory
The circuit theory connection model transforms the urban landscape into a conductive surface based on the random walk theory. It assigns a lower resistance to the type of land cover that favors an ecological process, with biological species considered as random walkers. Conversely, the land cover type that hinders the ecological process is given a higher electrical resistance [42,43,44]. So, a heterogeneous urban landscape is converted into nodes and resistors in the circuit. Nodes represent the hubs of a GI network. Resistance represents the extent to which land cover types are resistant to biological flows in the GI network. For a certain amount of electricity, a large current density is assigned to a landscape patch with a small resistance value, and, conversely, a small current density is assigned to a landscape patch with a large resistance value. In this way, areas with a higher current density will appear in the entire heterogeneous landscape. That is, a species is more likely to pass through this area during its movement, or the selection frequency of this area is higher. It may also be an area through which the species must pass when moving between the two patches, and there is no alternative path. If the type of cover in the area is removed or changed, an ecological process will be blocked or affected in other ways [45].
Therefore, the area has a significant impact on the ecological connectivity of the entire landscape and is the “bottleneck point” affecting the connectivity of the landscape. This is also known as the “pinch point”. The expression of heterogeneous landscape data by circuits and the identification of the “pinch point” area in the corridor using current density have important theoretical and practical value to the planning and design of the connecting corridors during GI planning and regional GI network protection planning.
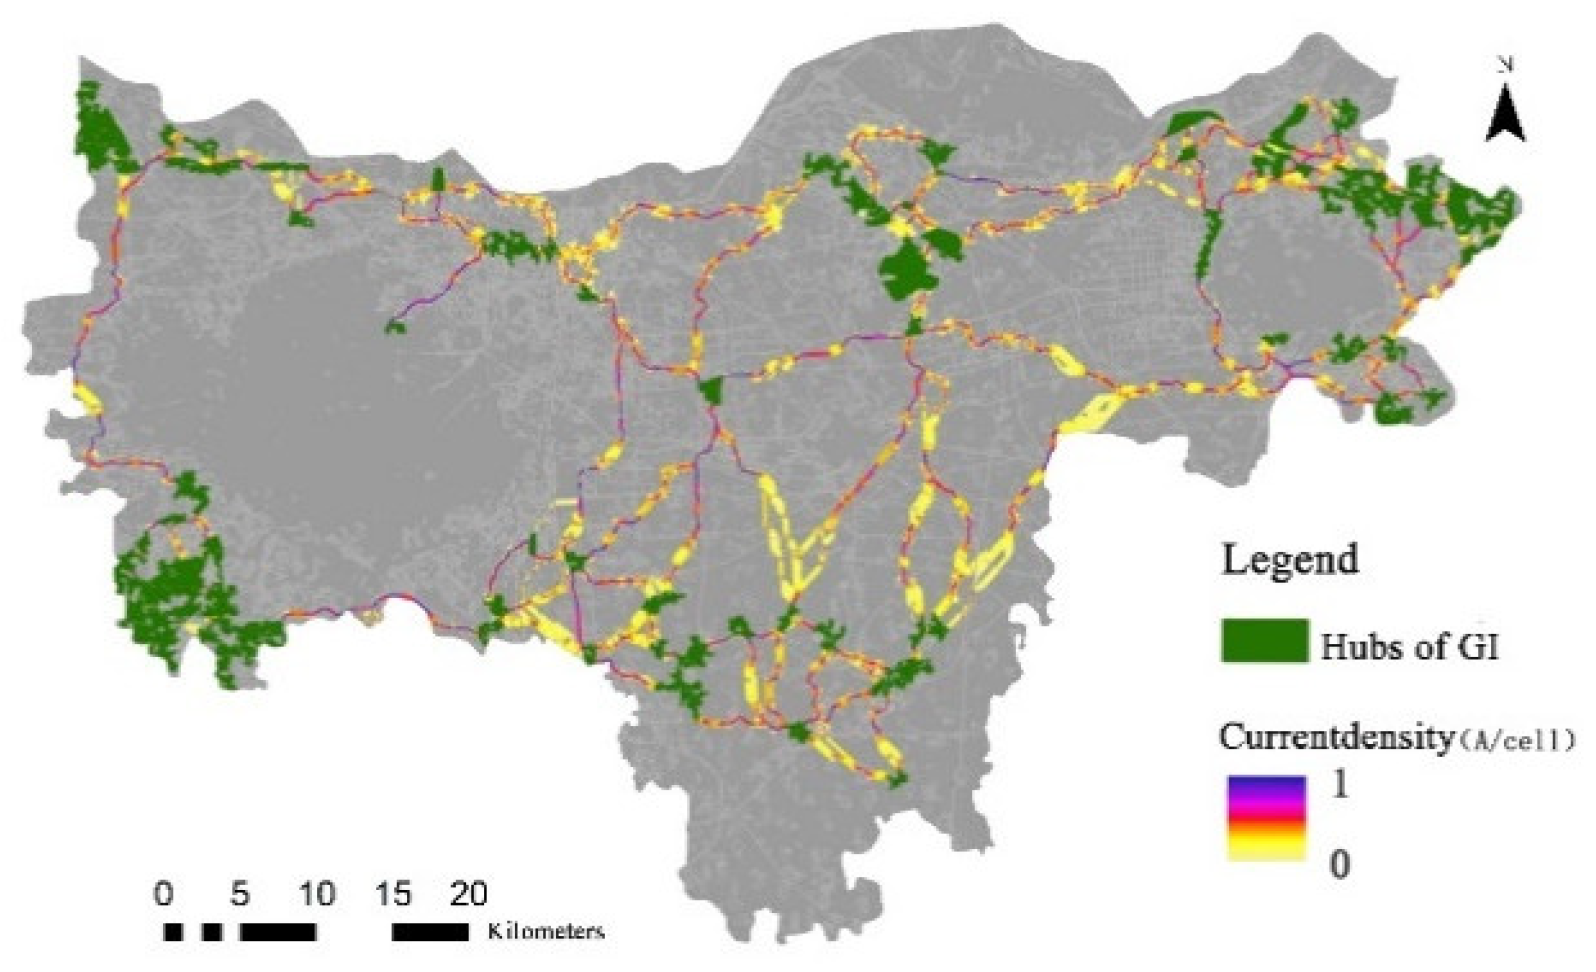
The current density through each corridor was calculated by the Pinchpoint Mapper tool, analyzes the corridor importance and identifies the “pinch point” area in the landscape by the current density in each corridor. The Pinchpoint Mapper calculation mode selects the “all to one model” calculation mode to obtain the cumulative current value of each raster cell. The area with the higher current density in each connecting corridor is the “pinch point” area of the corridor. The importance of the connection of the corridor is determined according to the number and location of the distribution of the “pinch point” areas in each corridor (Figure 5).
3. Results
3.1. Analysis of Spatial and Temporal Changes in the GI Network Pattern Based on MSPA
It can be seen from Table 3 that the total area of GI land in the study area has continued to decline since 2000, and the decline in core areas has become more apparent, especially since 2009, with the rapid development of Zhengzhou–Kaifeng integration, as a large amount of GI land has been converted into construction land. The patch area of the largest core area of green infrastructure in the Zhengzhou–Kaifeng metropolitan area decreased from 191 km2 in 2000 to 31 km2 in 2014, and the number of isolated patches gradually increased. The areas of the bridge, edge, loop, and branch land types first decreased and then increased. It can be seen that the GI area of the Zhengzhou–Kaifeng metropolitan area is gradually decreasing, the fragmentation is becoming ever more serious, and the landscape connectivity is becoming decreasingly lower. Nearly half of the study area can be used as GI land, but it is severely fragmented and mostly cultivated. The core area is mainly distributed in the strip along the Yellow River, north of the study area, with good spatial connectivity and at a large distance from the core development area of the city. The Zhongmou County area at the junction of Zhengzhou and Kaifeng in the central part of the study area is also a concentrated zone of the core area. Zhongmou is in the core development and expansion area of the Zhengzhou–Kaifeng metropolitan area and plays an important role in maintaining the landscape connectivity of the entire study area. However, the degree of fragmentation in this area is high, and the risk of converting GI land into construction land is also high (Figure 2).
3.2. Analysis of GI Network Construction Based on the Minimum Path Method
Based on the minimum path method, a total of 165 connecting corridors were identified between the two GI hubs in the study area, with a total area of 836.82 km2, accounting for 27.94% of the total study area. The type of connecting corridor is mainly cultivated land. The relative resistance of the minimum path between adjacent GI hubs in Zhengzhou City is relatively large, while along the Yellow River area to the north, the relative resistance of the minimum cost path between adjacent GI hubs is small. The connectivity of the study area in the east-west direction is only maintained by the connectivity of the northern Yellow River water system, and there is almost no connection in the south. The connectivity of the study area in the north-south direction is mainly concentrated in the Zhongmou area. However, with the advancement of Zhengzhou–Kaifeng integration, the Zhongmou area, which is between the two cities, is facing pressure to conserve land use types. Farmland, woodland, and wetland constitute the main types of landscape connecting corridors. Among them, farmland accounts for 65.98% of the total area of the GI network, and the type of regional connecting corridor is relatively simple. It is necessary to further increase the number of connected corridors, such as forest land, wetland, and water, and improve the ability of regional GI to provide ecosystem services (Figure 4).
3.3. Analysis of the Identification of the “Pinch Point” Area Based on Circuit Theory
The identification of the “pinch point” area in the regional GI network according to circuit theory plays a crucial role in maintaining the connectivity of the entire GI network. The areas with higher current density in the study area are mainly concentrated in the east-west linking corridor along the Yellow River in the north and the north-south corridor in the area along Zhongmou County. As an important regional GI connecting corridor, the northern part along the Yellow River and the central part along Zhongmou County play important roles in maintaining regional ecological security and providing important ecosystem services. It is necessary to strengthen the protection of these areas (Figure 5).
In the Pinchpoint Mapper tool, there are two “adjacent pair model” and “all to one model” modes to simulate the “pinch point” area in the corridors. The “adjacent pair model” mode calculates the “pinch point” between two adjacent core areas. The “all to one model” mode calculates the “pinch point” between a core area and all other core areas. Through simulation analysis, we find that the “pinch point” area obtained by the “adjacent pair model” calculation mode has no value for maintaining the connectivity of the whole landscape because the organism can move between the two core areas and bypass other core areas. Therefore, only the “pinch point” area obtained through the “all to one” mode is valuable for maintaining connectivity throughout the landscape. At the same time, we found that the current density in the “pinch point” area decreased when the width of the corridor was increased, but the position of the “pinch point” area did not change significantly. We found that with the increase of the corridor width, the movement of organisms between the core areas has more possibilities, which causes current shunting and results in a decrease in current density of the “pinch point” area, but the position does not change. Thus, it has little effect on the connectivity of the entire landscape to increase the width of the corridor.
4. Conclusions
The key to GI network planning is the determination of “hubs” and “links”. However, the current research on GI has not yet established a recognized standard for the identification of “hubs” and “links”. In this study, we proposed a framework for constructing a regional GI network that is based on three steps. The first concerns the identification of GI elements based on MSPA, followed by the characterization of GI spatial and temporal changes. In the second step, the potential connecting corridors of the GI network are constructed by the minimum path method. The third step further identifies, by means of circuit theory, the key “pinch point” area of the potential connecting corridors identified in the second step.
In relation to the first step, an outcome of the study was that the decrease in the area of green infrastructure land in the Zhengzhou–Kaifeng metropolitan area is accelerating, and the fragmentation is becoming progressively more serious with the rapid development of urbanization, which is consistent with the conclusions of other, similar research [38]. If construction funds are limited and the overall land area of green infrastructure continues to decrease, it is of great significance to rationally allocate GI elements and give priority to protecting the key “pinch point” areas that are vital to the regional ecological environment, thus reducing the negative impact of urban expansion on the urban ecological environment. During the planning process, it is necessary to protect important “core” areas and “bridge” areas and improve the ecological quality of these two areas. It is effective to repair the broken patches in the bridging area, set stepping stones, and restore some small connections between the patches while preserving the existing large-area core areas. Meanwhile, the number of spotted patches is appropriately increased to reduce the distance between the patches in areas where corridors cannot be connected, which improves the functional connectivity and gradually reduces the fragmentation of regional green infrastructure.
A second, not surprising, outcome was that regional landscape connectivity and urbanization level were positively correlated. In the study area, there are fewer connecting corridors in Zhengzhou City, where the economy is more developed, while the Zhongmou district has a lower level of urbanization and better connectivity with more connecting corridors. The connectivity in the east-west direction of the region is interrupted at the urban built-up area. In order to reduce the impact of urbanization development on the overall connectivity of the region, planners can take advantage of the opportunity provided by the transformation of the old city to set up some small green patches and connecting corridors of a certain width in the built-up area to increase the overall connectivity of the area.
A third striking outcome was that the existing important ecological connecting corridors with good connectivity are critical to maintaining the ecological environment of the entire region. In this study, it was found that the current density in the northern part of the Yellow River region and the middle part of Zhongmou County is generally higher. It can be seen that the better the ecological quality of the patch, the greater the importance to the region, and, once it is destroyed, very serious consequences will arise. Therefore, planning and design should strengthen the protection of key “pinch point” areas, delineate the ecological red line, strictly control the construction activities and the development intensity of areas with a high current density in the connecting corridors, and set different development levels according to the current density value. For areas with a low current density, facilities with different functions can be selectively constructed, and other uses, such as recreation and entertainment, can be established without destroying ecological functions, forming a composite green infrastructure network system.
In this study, we attempted to apply circuit theory to the study of regional GI network construction. The MSPA method, minimum path method, and a circuit-based landscape connection model were used to effectively identify the “hubs” and “links” of the GI network, and to determine the priority protection level and critical areas of the connecting corridor. This approach avoids subjectivity in the determination of the “hubs” and “links” of the GI network. GI elements and key areas that have a significant impact on landscape connectivity were scientifically identified by MSPA and current density. This affords obvious advantages to the study of the importance of connecting corridors, provides a new research concept for GI network planning, and verifies the feasibility and practicability of circuit theory application to GI network planning.
In terms of the future direction and further development of this research, we highlight the following items. First, the MSPA method is very sensitive to scale changes. Different grid pixel sizes will result in different analysis results, which affects the area of the core and bridge areas. Therefore, it is necessary to select the appropriate MSPA parameters on the basis of the research purpose and the study region for practical applications.
Secondly, the value of the resistance surface is mainly determined by the type of land cover and the type of GI form obtained by MSPA when the minimum path method is used to create the regional potential connecting corridor in the second step. Actually, there is a big difference in the actual resistance encountered when a particular species passes through different cover types. Therefore, more data should be integrated to determine resistance values and improve the method in the future.
Last, but not least, the landscape connection model based on circuit theory abstracts and simplifies the movements of species in the real landscape environment, and it is based on corresponding theoretical assumptions. In the future, regional species’ characteristics should be further studied to modify and improve the model. The application of circuit theory to the field of landscape ecological planning should be further promoted. The research results can provide a scientific basis for the protection planning and connecting corridor design of highly fragmented urban GI networks. It has important theoretical guiding significance and application values.
Author Contributions
Conceptualization, M.Q.; Data curation, X.S.; Methodology, X.S.; Resources, M.Q.; Software, X.S.; Writing—original draft, X.S.
Funding
This research received no external funding.
Conflicts of Interest
The authors declare no conflict of interest.
References
- Bengston, D.N.; Fletcher, J.O.; Nelson, K.C. Public policies for managing urban growth and protecting open space: Policy instruments and lessons learned in the United States. Landsc. Urban Plan. 2004, 69, 271–286. [Google Scholar] [CrossRef]
- Li, K.R. Green Infrastructure: Concept, Theory and Practice. Chin. Landsc. Archit. 2009, 25, 88–90. [Google Scholar]
- Noël, P.H.; Cai, X.M. On the role of individuals in models of coupled human and natural systems: Lessons from a case study in the republican river basin. Environ. Model. Softw. 2017, 92, 1–16. [Google Scholar] [CrossRef]
- Weber, T.; Sloan, A.; Wolf, J. Maryland’s Green Infrastructure Assessment: Development of a comprehensive approach to land conservation. Landsc. Urban Plan. 2006, 77, 94–110. [Google Scholar] [CrossRef]
- Benedict, M.; McMahon, E. Green Infrastructure: Linking Landscapes and Communities; Island Press: Washington, DC, USA, 2006. [Google Scholar]
- Lennon, M.; Scott, M. Delivering ecosystems services via spatial planning: Reviewing the possibilities and implications of a green infrastructure approach. Town Plan. Archit. 2014, 85, 563–588. [Google Scholar] [CrossRef]
- Liu, S.; He, B. Construction of Regional Green Infrastructure Based on MSPA—Case Study on Suzhou-Wuxi-Changzhou Area. Landsc. Archit. 2017, 8, 98–104. [Google Scholar]
- Wu, W.; Fu, X.E. The Concept of Green Infrastructure and Review of Its Research Development. Int. Urban Plan. 2009, 24, 67–71. [Google Scholar]
- Lovell, S.T.; Taylor, J.R. Supplying urban ecosystem services through multifunctional green infrastructure in the United States. Landsc. Ecol. 2013, 28, 1447–1463. [Google Scholar] [CrossRef]
- Hansen, R.; Pauleit, S. From multifunctionality to multiple ecosystem services? A conceptual framework for multifunctionality in green infrastructure planning for urban areas. AMBIO 2014, 43, 516–529. [Google Scholar] [CrossRef]
- Tzoulas, K.; Korpela, K.; Venn, S.; Yli-Pelkonen, V.; Kaźmierczak, A.; Niemela, J.; James, P. Promoting ecosystem and human health in urban areas using Green Infrastructure: A literature review. Landsc. Urban Plan. 2007, 81, 167–178. [Google Scholar] [CrossRef] [Green Version]
- Albert, C.; Von Haaren, C. Implications of Applying the Green Infrastructure Concept in Landscape Planning for Ecosystem Services in Peri-Urban Areas: An Expert Survey and Case Study. Plan. Pract. Res. 2014, 32, 227–242. [Google Scholar] [CrossRef]
- Andersson, E.; Barthel, S.; Borgström, S.; Colding, J.; Elmqvist, T.; Folke, C.; Folke, C.; Gren, A. Reconnecting Cities to the Biosphere: Stewardship of Green Infrastructure and Urban Ecosystem Services. AMBIO 2014, 43, 445–453. [Google Scholar] [CrossRef] [PubMed] [Green Version]
- Coutts, C.; Hahn, M. Green Infrastructure, Ecosystem Services, and Human Health. Int. J. Environ. Res. Public Health 2015, 12, 9768–9798. [Google Scholar] [CrossRef] [Green Version]
- Maes, J.; Barbosa, A.; Baranzelli, C.; Zulian, G.; Batista, E.; Silva, F.; Vandecasteele, I.; Hiederer, R.; Liquete, C.; Paracchini, M.L.; et al. More green infrastructure is required to maintain ecosystem services under current trends in land-use change in Europe. Landsc. Ecol. 2015, 30, 517–534. [Google Scholar] [CrossRef] [PubMed]
- Ignatieva, M.; Stewart, G.H.; Meurk, C. Planning and design of ecological networks in urban areas. Landsc. Ecol. Eng. 2010, 7, 17–25. [Google Scholar] [CrossRef]
- Meerow, S.; Newell, J.P. Spatial planning for multifunctional green infrastructure: Growing resilience in Detroit. Landsc. Urban Plan. 2017, 159, 62–75. [Google Scholar] [CrossRef]
- Williamson, K.S. Growing with Green Infrastructure; Heritage Conservancy: Doylestown, PA, USA, 2003. [Google Scholar]
- Wickham, J.D.; Riitters, K.H.; Wade, T.G. A national assessment of green infrastructure and change for the conterminous United States using morphological image processing. Landsc. Urban Plan. 2010, 94, 186–195. [Google Scholar] [CrossRef]
- Pei, D. Review of Green Infrastructure Planning Methods. City Plan. Rev. 2012, 36, 84–90. [Google Scholar]
- Cannas, I.; Lai, S.; Leone, F.; Zoppi, C. Green Infrastructure and Ecological Corridors: A Regional Study Concerning Sardinia. Sustainability 2018, 10, 1265. [Google Scholar] [CrossRef]
- Snall, T.; Lehtomaki, J.; Arponen, A.; Elith, J.; Moilanen, A. Green Infrastructure Design Based on Spatial Conservation Prioritization and Modeling of Biodiversity Features and Ecosystem Services. Environ. Manag. 2016, 57, 251–256. [Google Scholar] [CrossRef]
- Taylor, L.; Hochuli, D.F. Creating better cities: How biodiversity and ecosystem functioning enhance urban residents’ wellbeing. Urban Ecosyst. 2014, 18, 747–762. [Google Scholar] [CrossRef]
- Liquete, C.; Kleeschulte, S.; Dige, G.; Maes, J.; Grizzetti, B.; Olah, B.; Zulian, G. Mapping green infrastructure based on ecosystem services and ecological networks: A Pan-European case study. Environ. Sci. Policy 2015, 54, 268–280. [Google Scholar] [CrossRef] [Green Version]
- Pan, H.Z.; Deal, B.; Destouni, G.; Zhang, Y.L.; Kalantari, Z. Sociohydrology modeling for complex urban environments in support of integrated land and water resource management practices. Land Degrad. Dev. 2017, 29, 3639–3652. [Google Scholar] [CrossRef]
- Adriaensen, F.; Chardon, J.P.; Blust, G.D.; Swinnen, E.; Villalba, S.; Gulinck, H. The application of ‘least-cost’ modelling as a functional landscape model. Landsc. Urban Plan. 2003, 64, 233–247. [Google Scholar] [CrossRef]
- Yu, K.J.; Li, B.; Li, D.H. Ecological infrastructure for the protection of natural and cultural heritage areas—Taking Wuyi Mountain in Fujian as an example. Urban Plan. 2008, 10, 88–91. [Google Scholar]
- Walmsley, A. Greenways: Multiplying and diversifying in the 21st century. Landsc. Urban Plan. 2006, 76, 252–290. [Google Scholar] [CrossRef]
- Mcharg, I.L. Human ecological planning at pennsylvania. Landsc. Plan. 1981, 8, 109–120. [Google Scholar] [CrossRef]
- Zhang, Y.; Li, L.; Wu, G.S.; Zhou, Y.; Qin, S.P.; Wang, X.M. Analysis of landscape connectivity of the Yunnan snub-nosed monkeys (Rhinopithecus bieti) based on habitat patches. Acta Ecol. Sin. 2016, 36, 51–58. [Google Scholar]
- Kong, F.; Yin, H.; Nakagoshi, N.; Zong, Y. Urban green space network development for biodiversity conservation: Identification based on graph theory and gravity modeling. Landsc. Urban Plan. 2010, 95, 16–27. [Google Scholar] [CrossRef]
- Hong, S.H.; Han, B.H.; Choi, S.H.; Sung, C.Y.; Lee, K.J. Planning an ecological network using the predicted movement paths of urban birds. Landsc. Ecol. Eng. 2013, 9, 165–174. [Google Scholar] [CrossRef]
- Koen, E.L.; Bowman, J.; Walpole, A.A. The effect of cost surface parameterization on landscape resistance estimates. Mol. Ecol. Resour. 2012, 12, 686–696. [Google Scholar] [CrossRef] [PubMed]
- Zetterberg, A.; Mortberg, U.M.; Balfors, B. Making graph theory operational for landscape ecological assessments, planning, and design. Landsc. Urban Plan. 2010, 95, 181–191. [Google Scholar] [CrossRef]
- Vogt, P.; Riitters, K.H.; Iwanowski, M.; Estreguil, C.; Jacek, K.; Soille, P. Mapping landscape corridors. Ecol. Indic. 2007, 7, 481–488. [Google Scholar] [CrossRef] [Green Version]
- Soille, P.; Vogt, P. Morphological segmentation of binary patterns. Pattern Recognit. Lett. 2009, 30, 456–459. [Google Scholar] [CrossRef]
- Wang, Y.; Lin, J. The Transformation of Planning Ideas and the Exploration of Planning Methods of Urban Green Space Ecological Network Based on MSPA. Chin. Landsc. Archit. 2017, 33, 68–73. [Google Scholar]
- Yu, Y.P.; Yin, H.W.; Kong, F.H.; Wang, J.J.; Xu, W.B. Analysis of the temporal and spatial pattern of the green infrastructure network in Nanjing based on MSPA. Chin. J. Ecol. 2016, 35, 1608–1616. [Google Scholar]
- Xu, F.; Yin, H.W.; Kong, F.H.; Xu, J.G. Developing ecological networks based on mspa and the least-cost path method: A case study in bazhong western new district. Acta Ecol. Sin. 2015, 35, 6425–6434. [Google Scholar]
- Vogt, P.; Ferrari, J.R.; Lookingbill, T.R.; Gardner, R.H.; Riitters, K.H.; Ostapowicz, K. Mapping functional connectivity. Ecol. Indic. 2009, 9, 64–71. [Google Scholar] [CrossRef]
- Cao, Y.K.; Fu, M.C.; Xie, M.M.; Gao, Y.; Yao, S.Y. Landscape connectivity dynamics of urban green landscape based on morphological spatial pattern analysis (MSPA) and linear spectral mixture model (LSMM) in Shenzhen. Acta Ecol. Sin. 2015, 35, 526–536. [Google Scholar]
- McRae, B.H. Isolation by resistance. Evolution 2006, 60, 1551–1561. [Google Scholar] [CrossRef]
- McRae, B.H.; Beier, P. Circuit theory predicts gene flow in plant and animal populations. Proc. Natl. Acad. Sci. USA 2007, 104, 19885–19890. [Google Scholar] [CrossRef] [PubMed] [Green Version]
- McRae, B.H.; Dickson, B.G.; Keitt, T.H.; Shah, V.B. Using circuit theory to model connectivity in ecology, evolution, and conservation. Ecology 2008, 89, 2712–2724. [Google Scholar] [CrossRef]
- Song, L.L.; Qin, M.Z. Identification of Ecological Corridors and its Importance by Integrating Circuit Theory. Chin. J. Appl. Ecol. 2016, 27, 3344–3352. [Google Scholar]
- Li, H.; Li, L.; Wu, G.S.; Zhou, Y.; Li, W.W.; Mei, Z.W. Analysis of the landscape-level connectivity of the Yunnan snub-nosed monkey habitat based on circuit theory. Acta Ecol. Sin. 2018, 38, 2221–2228. [Google Scholar]
- Liu, J.; Yin, H.W.; Kong, F.H.; Li, M.H. Structure optimization of circuit theory-based green infrastructure in Nanjing, China. Acta Ecol. Sin. 2018, 38, 4363–4372. [Google Scholar]
- Zhang, L.J.; Qin, Y.C.; Zhang, J.P.; Zhang, Y. Evolution Mechanisms of Primary Energy-related Carbon Emissions in Zhengzhou-Kaifeng Metropolitan Area. Sci. Geogr. Sin. 2012, 32, 314–321. [Google Scholar]
- Zhu, Q.; Yu, K.J.; Li, D.H. The Width of Ecological Corridor in Landscape Planning. Acta Ecol. Sin. 2005, 25, 2406–2412. [Google Scholar]
- Linkage Mapper Is a GIS Tool That Analyzes Habitat Connectivity. Available online: http://www.circuitscape.org/linkagemapper (accessed on 15 March 2018).
Figure 1.
Location map of the Zhengzhou–Kaifeng metropolitan area.

Figure 2.
Results of MSPA.
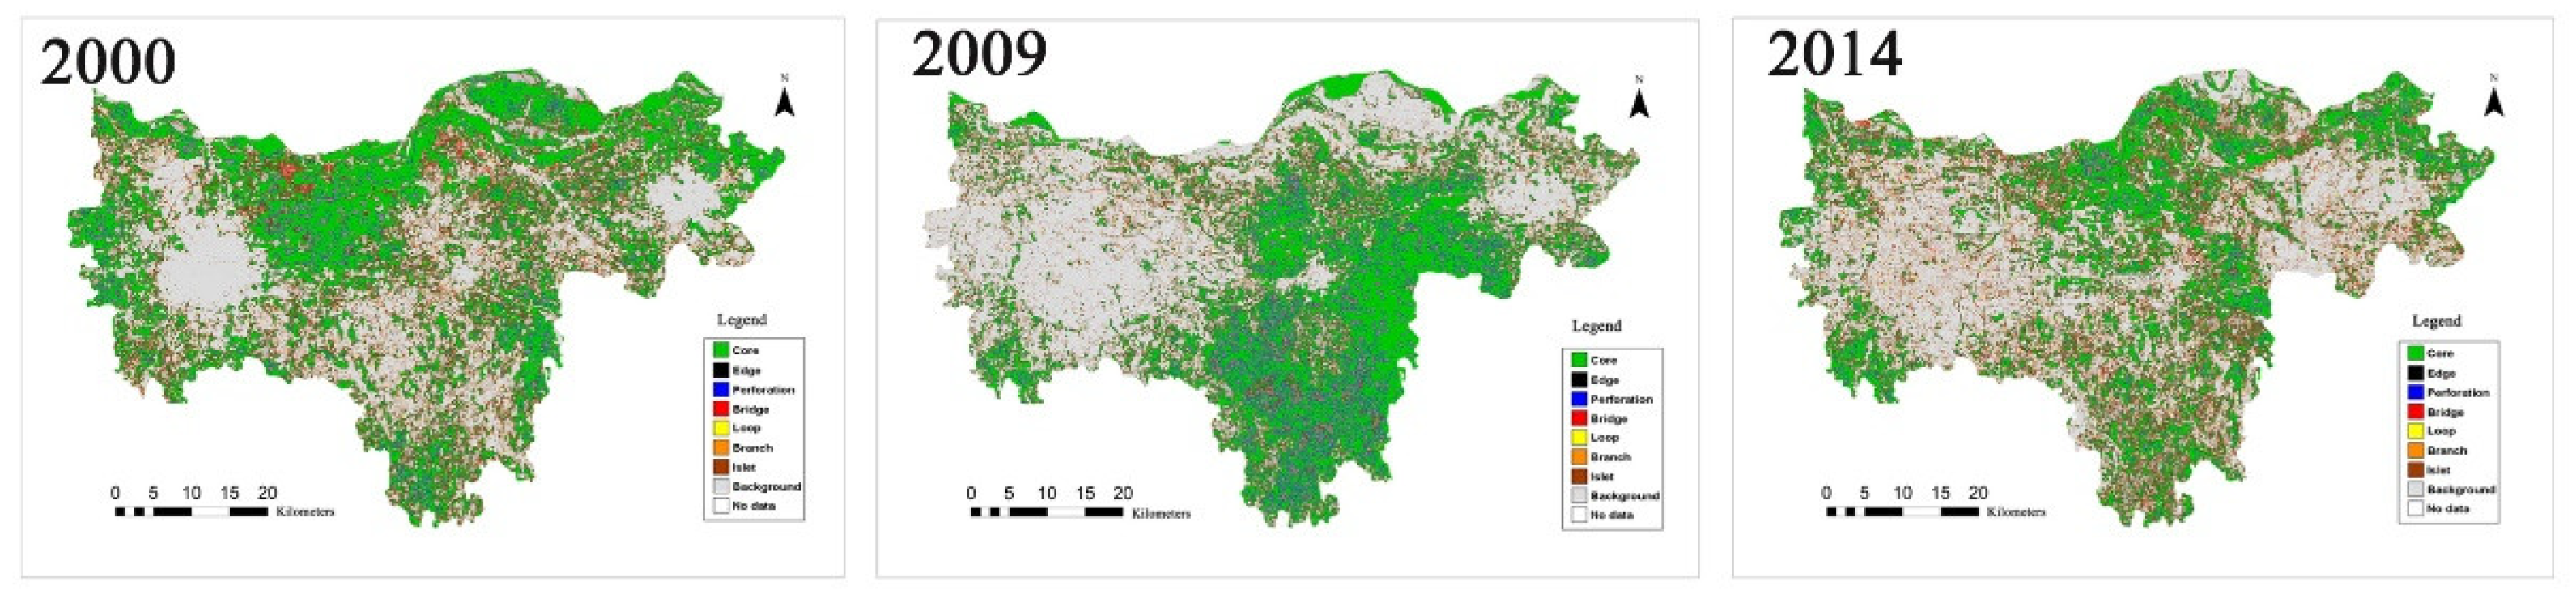
Figure 3.
Resistance value analysis of the study area.

Figure 4.
Zhengzhou–Kaifeng metropolitan GI network planning map.
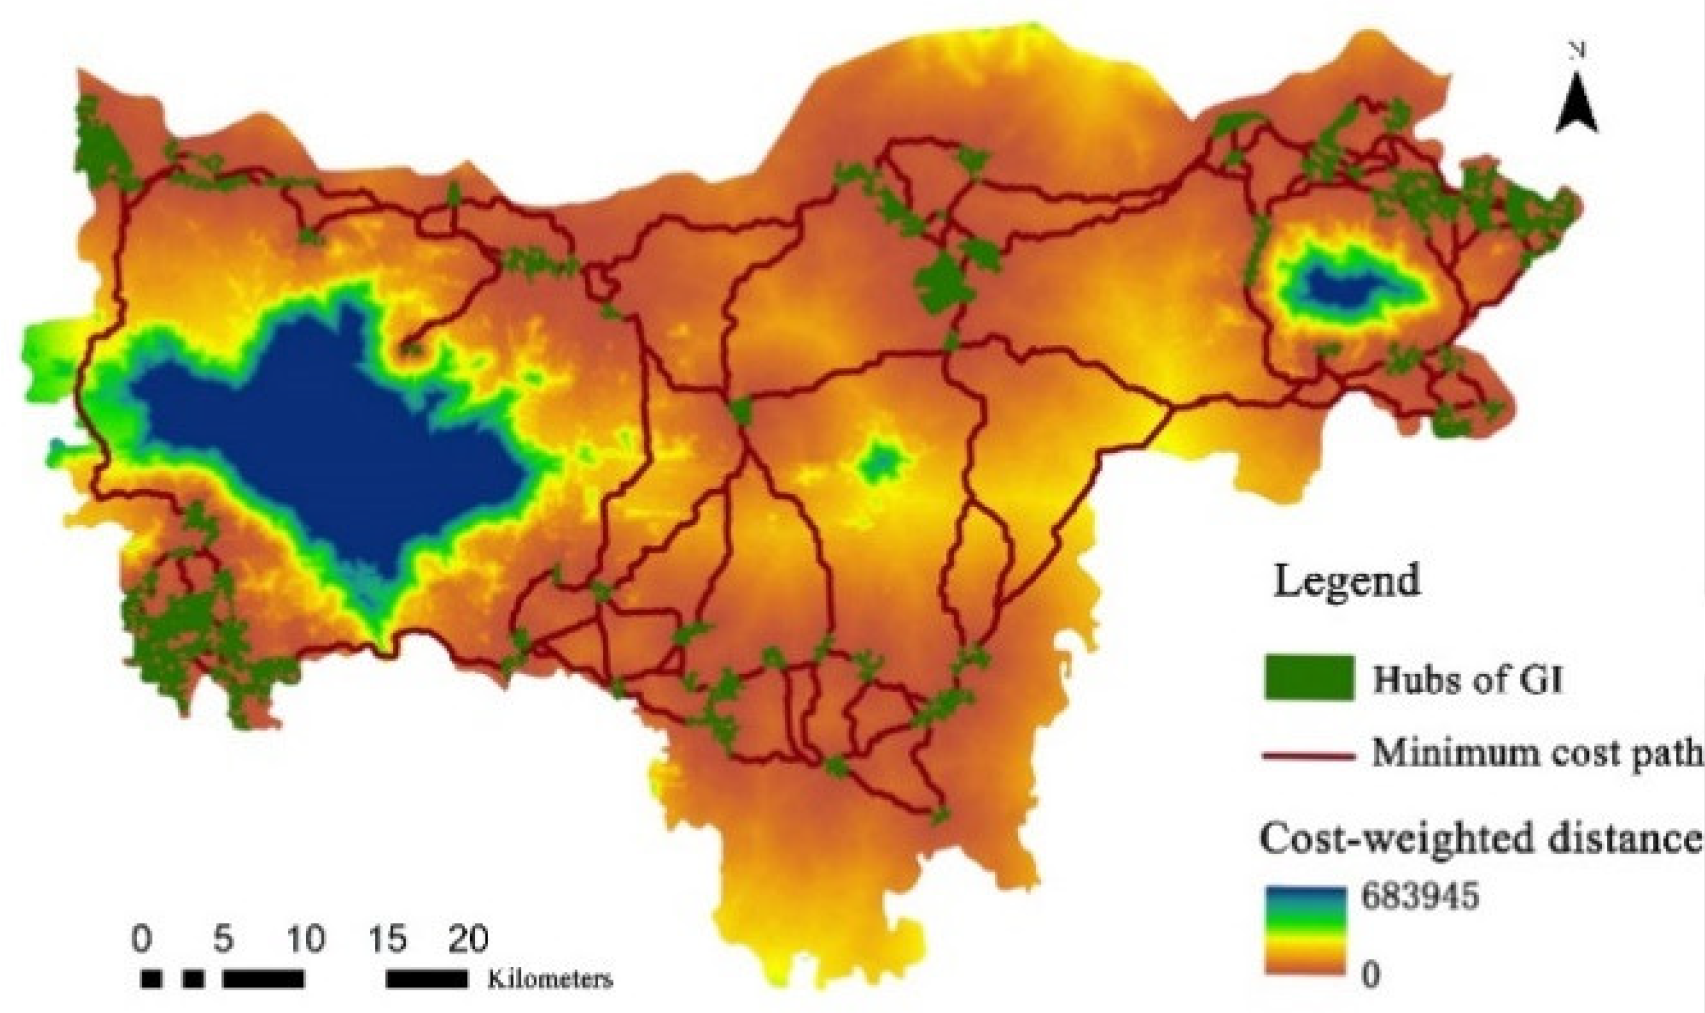
Figure 5.
The current density map of the GI network’s connecting corridors.


Table 1.
Main methods used by GI network construction.
| Name | Principles and Methods | Characteristics |
|---|---|---|
| Overlay Analysis [20,26,27,28] | Emphasizes the vertical processes and connections between geology-soil-water temperature-vegetation-animals and human activities and land use in the landscape unit based on human ecological planning theory [29]; uses “the layered cake” superposition technique to identify the “hubs” and “links” of the GI network through GIS techniques. | Judges connectivity according to the suitability of the corridor; needs a large amount of data; convenient and practical in small venues or inaccurate GI requirements. |
| Spatial Analysis [30,31,32,33] | Emphasizes the horizontal ecological process to form a network pattern by simulating horizontal motion based on landscape ecology and GIS techniques; uses the minimum path model to determine the location and pattern of the corridor. | Considers that the horizontal movement “resistance” is smaller and the connectivity is stronger; needs more detailed data on species surveys; emphasizes both structural and functional connections; suitable for emphasizing biodiversity conservation |
| Graph-based Analysis [31,34] | Simplifies the landscape into a network diagram of nodes and connections based on graph theory and network analysis; uses the connectivity index to quantify landscape connectivity. | Believes that the network connectivity index is large, the cost is low, and the connectivity is strong; suitable for rapid research on landscape scales. |
| Morphological Spatial Pattern Analysis (MSPA) [7,19,35,36,37,38,39,40,41] | Regards GI as the foreground corresponding to the background. Constructs a GI network based on the “core” and “bridge” obtained from the analysis of geometric characteristics. | Determines connectivity based on topological relationships between the foreground and background. Emphasizes structural connections; Relies only on land cover data without the need for multiple layers of data overlay. |
Table 2.
Composition of landscape types and their ecological meaning in MSPA.
| Landscape Type | Landscape Features | Ecological Meaning in Green Infrastructure |
|---|---|---|
| Core | A collection of large, interconnected foreground pixels. | Large-scale natural patches with high connectivity, which is equivalent to the hubs of a green infrastructure network. |
| Bridge | A linear foreground pixel set between two cores with a high degree of connectivity. | Striped ecological land between core areas with high connectivity, which is equivalent to the connecting corridor of the green infrastructure network. |
| Islet | A collection of foreground cells whose area is smaller than the core zone threshold and is not connected to other foreground cells. | Small natural patches that are not connected to each other. |
| Perforation | Background pixels inside the core area. | Unnatural patch inside the core area. |
| Edge | Transition pixel between the foreground and background. | The transition zone between green infrastructure and non-green infrastructure. |
| Loop | A collection of linear foreground cells with both ends connected to the edge of the same core. | Connecting corridor inside a large natural patch. |
| Branch | A collection of linear foreground pixels with only one end connected to the core or bridge. | Striped ecological land with low connectivity. |
Table 3.
Area changes of MSPA landscape types of the study area green infrastructure from 2000 to 2014.
Table 3.
Area changes of MSPA landscape types of the study area green infrastructure from 2000 to 2014.
| Landscape Type | Years | Area/km2 | Proportion of Total GI Area |
|---|---|---|---|
| Core | 2000 | 972.35 | 58.75 |
| 2009 | 912.64 | 62.94 | |
| 2014 | 717.17 | 49.86 | |
| Bridge | 2000 | 112.78 | 6.82 |
| 2009 | 42.56 | 2.93 | |
| 2014 | 125.58 | 8.73 | |
| Islet | 2000 | 37.64 | 2.27 |
| 2009 | 41.57 | 2.87 | |
| 2014 | 63.25 | 4.40 | |
| Perforation | 2000 | 69.19 | 4.18 |
| 2009 | 107.20 | 7.39 | |
| 2014 | 43.95 | 3.06 | |
| Edge | 2000 | 320.67 | 19.38 |
| 2009 | 247.74 | 17.08 | |
| 2014 | 334.03 | 23.23 | |
| Loop | 2000 | 49.61 | 3.00 |
| 2009 | 25.63 | 1.77 | |
| 2014 | 45.78 | 3.18 | |
| Branch | 2000 | 92.59 | 5.60 |
| 2009 | 72.80 | 5.02 | |
| 2014 | 108.43 | 7.54 | |
| GI total area | 2000 | 1654.83 | 100 |
| 2009 | 1450.14 | 100 | |
| 2014 | 1438.19 | 100 |
Table 4.
The resistance values of MSPA landscape types.
| Landscape Type | Core | Bridge | Islet | Perforation | Edge | Loop | Branch | Background |
|---|---|---|---|---|---|---|---|---|
| Landscape resistance (1–100) | 1 | 10 | 15 | 80 | 30 | 30 | 60 | 100 |
© 2018 by the authors. Licensee MDPI, Basel, Switzerland. This article is an open access article distributed under the terms and conditions of the Creative Commons Attribution (CC BY) license (http://creativecommons.org/licenses/by/4.0/).
Share and Cite
MDPI and ACS Style
Shi, X.; Qin, M. Research on the Optimization of Regional Green Infrastructure Network. Sustainability 2018, 10, 4649. https://doi.org/10.3390/su10124649
AMA Style
Shi X, Qin M. Research on the Optimization of Regional Green Infrastructure Network. Sustainability. 2018; 10(12):4649. https://doi.org/10.3390/su10124649
Chicago/Turabian StyleShi, Xuemin, and Mingzhou Qin. 2018. "Research on the Optimization of Regional Green Infrastructure Network" Sustainability 10, no. 12: 4649. https://doi.org/10.3390/su10124649
Note that from the first issue of 2016, this journal uses article numbers instead of page numbers. See further details here.