Assessing Carbon Footprint and Inter-Regional Carbon Transfer in China Based on a Multi-Regional Input-Output Model


Guangdong Key Laboratory for Urbanization and Geo-simulation, School of Geography and Planning, Sun Yat-sen University, Guangzhou 510275, China
*
Author to whom correspondence should be addressed.
Sustainability 2018, 10(12), 4626; https://doi.org/10.3390/su10124626
Submission received: 1 November 2018
/
Revised: 30 November 2018
/
Accepted: 4 December 2018
/
Published: 6 December 2018
Abstract
:China has been the largest carbon emitter in the world since 2007 and is thus confronted with huge emission reduction pressures. The regional differences in socio-economic development lead to complex inter-provincial carbon transfer in China, which hinders the determination of the emission reduction responsibilities for the various provinces. Based on the latest multi-regional input-output data, this study analyzes the carbon footprint, inter-provincial carbon transfer, and the corresponding variations of 30 provinces in China from 2007 to 2010. The results show that the domestic carbon footprint increased from 4578 Mt in 2007 to 6252 Mt in 2010. Provinces with high carbon footprints were mainly found in central China, such as Shandong, Jiangsu, and Henan. Carbon footprints of the developed coastal provinces were greater than those of less developed provinces in Northwestern China. Per capita GDP (Gross Domestic Product) was positively correlated to the per capita carbon footprint, indicating a positive relationship between the economic development level and corresponding carbon emissions. Provincial carbon inflows were found to have increased steadily (ranging between 32% and 41%) from 2007 to 2010. The increases in direct carbon emissions varied largely among different provinces, ranging from below 30% in the developed provinces to more than 60% in the moderately developed provinces (e.g., Sichuan and Chongqing). The embodied carbon transferred from moderately developed or remote provinces to those developed ones. In other words, the carbon emission pressures of the developed provinces were shifted to the less developed provinces. The major paths of carbon flow include the transfers from Hebei to Jiangsu (32.07 Mt), Hebei to Beijing (26.78 Mt), Hebei to Zhejiang (25.60 Mt), and Liaoning to Jilin (27.60 Mt).
1. Introduction
Global warming due to CO2 emissions has already become one of the most important environmental issues currently faced by human society [1]. With its rapid economic development, the total carbon emissions in China have intensively increased over the past three decades [2]. China became the largest carbon dioxide producer by 2007 [3,4] and contributed 75% to the global carbon emission growth from 2010 to 2012 [5]. To alleviate this situation, the Chinese government has been actively formulating energy-saving and emission reduction policies. As proposed at the Paris Climate Change Conference in 2015, by 2030, China will take actions to reduce the carbon dioxide emissions per unit GDP by 60–65% compared with those in 2005.
To achieve this goal, emission reduction responsibilities must be assigned to various regions according to the local conditions [6]. However, the assignment of reduction responsibilities is not easy due to the continuous progress of marketization and regional integration, which have led to an increasing spatial separation between production and consumption [7]. Moreover, most of the final goods or services consumed in areas with high levels of urbanization and industrialization are not produced locally [6]. In other words, carbon emissions are transferred from one region to another through the inter-regional trade of goods and services. Carbon emissions are often transferred from the more developed regions with higher environmental standards to the less developed areas [8]. Therefore, in addition to the direct carbon emissions, the inter-regional transfer of carbon emissions calls for more attention to the proper allocation of emission reduction responsibility.
The carbon footprint is considered a more adequate indicator to reflect consumers’ responsibilities for global warming [9]. Despite the various definitions of carbon footprint [10], this study focuses mainly on the regional carbon footprint. The regional carbon footprint refers to the total carbon emissions required by a country, region, or city to meet the final consumption requirement, which includes direct and indirect carbon emissions caused by production processes to produce the goods used for final consumption [6]. Direct carbon emissions refer to those caused by the burning of fossil fuels in processes including energy consumption and transportation, while indirect carbon emissions (embodied carbon emissions) refer to those produced in the production and manufacture of products and services imported from other areas [11,12]. In this paper, the carbon footprint is defined as the sum of direct carbon emissions required by local needs and the indirect carbon emissions transferred from other regions [11].
The Multi-Regional Input-Output (MRIO) model is commonly used to assess the upstream carbon footprint associated with downstream economic consumption and the embodied carbon in traded goods [11]. This method considers the economic activities and industrial linkages between regions and can explain the investment change in a region induced by the final consumption in another region. MRIO has been widely used to estimate the carbon footprint at different scales [6,11]. Moreover, it is able to reflect the economic links between sectors and delineate the inter-regional supply chain [6,13,14], enabling the study of the regional distribution and transfer of carbon emissions [13]. Empirical studies have applied the MRIO model to reflect the influences of inter-regional trade on China’s carbon footprint. For instance, Zhong et al. [1] indicated that approximately 60.02% of China’s production-related carbon emissions are embodied in inter-provincial trade. Zhang et al. [15] described the variation in carbon footprints at the provincial scale from 2002 to 2007 in China. Guo et al. [14] analyzed the characteristics of China’s embodied emissions during 2002–2005 and observed the transferring patterns from Eastern China to central China. Kanemoto et al. [16] found that China’s rapidly increased carbon footprint did not have a tendency of spatial expansion globally, although China had increasingly contributed to the global economy.
The above-mentioned studies have contributed significantly to the understanding of China’s carbon footprint and domestic embodied carbon transfers. This study attempts to enrich the knowledge on China’s carbon emissions embodied in domestic trade. We use the provincial inter-regional input-output data of China for the years 2007 and 2010. Based on these data, the MRIO model is applied to delineate the patterns of carbon transfers among regions and determine the national carbon footprint as well.
2. Materials and Methods
2.1. MRIO Model
First proposed by Leontief [17], the MRIO model is able to track the environmental impacts of complex trade relations between different sectors and regions [11]. It has been frequently applied to investigate many environmental issues, such as the regional carbon footprint [6,18,19,20], air pollution [21], the water footprint [22,23], land displacement [24,25], and biodiversity loss [26,27]. In this study, the MRIO model is used to estimate the quantity of carbon footprint and embodied carbon flows through domestic trades among different regions.
The mathematical structure of a MRIO model consists of () linear equations, in which n refers to the number of regions and m refers to the number of sectors. It can be formulated in a balance form as follows:
where is the total output of the i-sector in the r-region, which is the sum of intermediate input and final consumption. More specifically, represents the intermediate input from the i-sector in the r-region to the j-sector in the s-region; denotes the final consumption, which refers to the amount of final product supplied by the i-sector in the r-region and consumed in the s-region. The direct consumption coefficient is introduced as follows:
where denotes the number of units of input by the i-sector in the r-region required to satisfy the needs of 1 unit of output by the j-sector in the s-region, and 0 ≤ <1. Thus, Equation (1) can be rearranged into
Equation (3) can be written in the form of a matrix:
where X is the matrix of and Y is the matrix of ; A is the intermediate input coefficient matrix. The matrix A, also referred to as the technical coefficient matrix, is a fixed constant matrix with the elements of . Due to the properties of A, (I − A) is a non-singular matrix and thus is reversible. Therefore, Equation (4) can be rewritten as
where is the Leontief inverse matrix, denoted by B==; represents the necessary amount of output by the i-sector in the r-region for one unit of final consumption by the j-sector in the s-region.
2.2. Inter-Regional Carbon Transfer Accounting
By multiplying both sides of Equation (5) with the carbon intensity (i.e., carbon emissions per unit of economic output), the carbon emissions can be linked to the MRIO model:
where is a diagonalized matrix with the elements being the sectoral carbon intensity of each region; is the carbon emission matrix that represents the carbon emissions generated by the i-sector in the r-region. The total carbon footprint of the r-region is expressed by (Equation (7)), which includes the direct carbon emissions generated in the r-region to meet local demands (), as well as the embodied carbon emissions in the imported products from all other regions (). Similarly, represents the carbon emissions transferred from the r-region to the s-region:
2.3. Data Sources and Processing
In this study, the inter-regional input-output tables of China for the years 2007 and 2010 were obtained from Liu [28] and Liu et al. [29]. These tables provide data for the 30 provincial units in China (hereinafter collectively referred to as provinces), including 22 provinces, 4 cities, and 4 autonomous regions. The data for Tibet, Hong Kong, Macau, and Taiwan are absent and thus, these regions were not included in this study. Six economic sectors are included in the data: (1) agriculture, forestry, animal husbandry and fisheries; (2) industry; (3) construction; (4) transportation and warehousing; (5) wholesale and retail trade; and (6) services, which are consistent with those in the China Energy Statistical Yearbook.
Each sector’s carbon intensity was derived by dividing the sectoral carbon emissions by the corresponding sectoral outputs. The carbon emissions by sector per province were estimated based on the provincial energy balance tables in the China Energy Statistical Yearbook 2007 and the China Energy Statistical Yearbook 2010. These data provide the energy consumption of different sources, such as raw coal, oil, and natural gas, by province and by sector. The average low calorific capacity data were also obtained from the China Energy Statistical Yearbook 2010. The carbon emission factors of the corresponding energy sources were set mainly according to the recommended values in the 2006 IPCC Guidelines for National Greenhouse Gas Inventories [30], except that the emission factors for electricity and thermal energy were determined based on the 2010 Average Regional CO2 Emission Factor of Regional and Provincial Power Grids of China. The other data used in this paper, such as the provincial population and GDP, were collected from the National Bureau of Statistics of China.
3. Results
3.1. Provincial Carbon Footprints and Changes
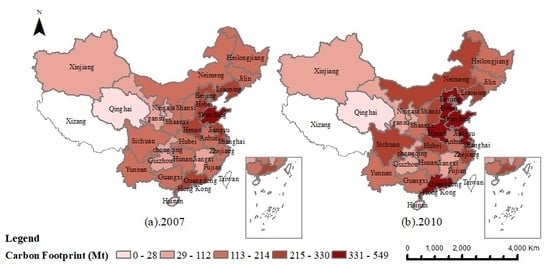
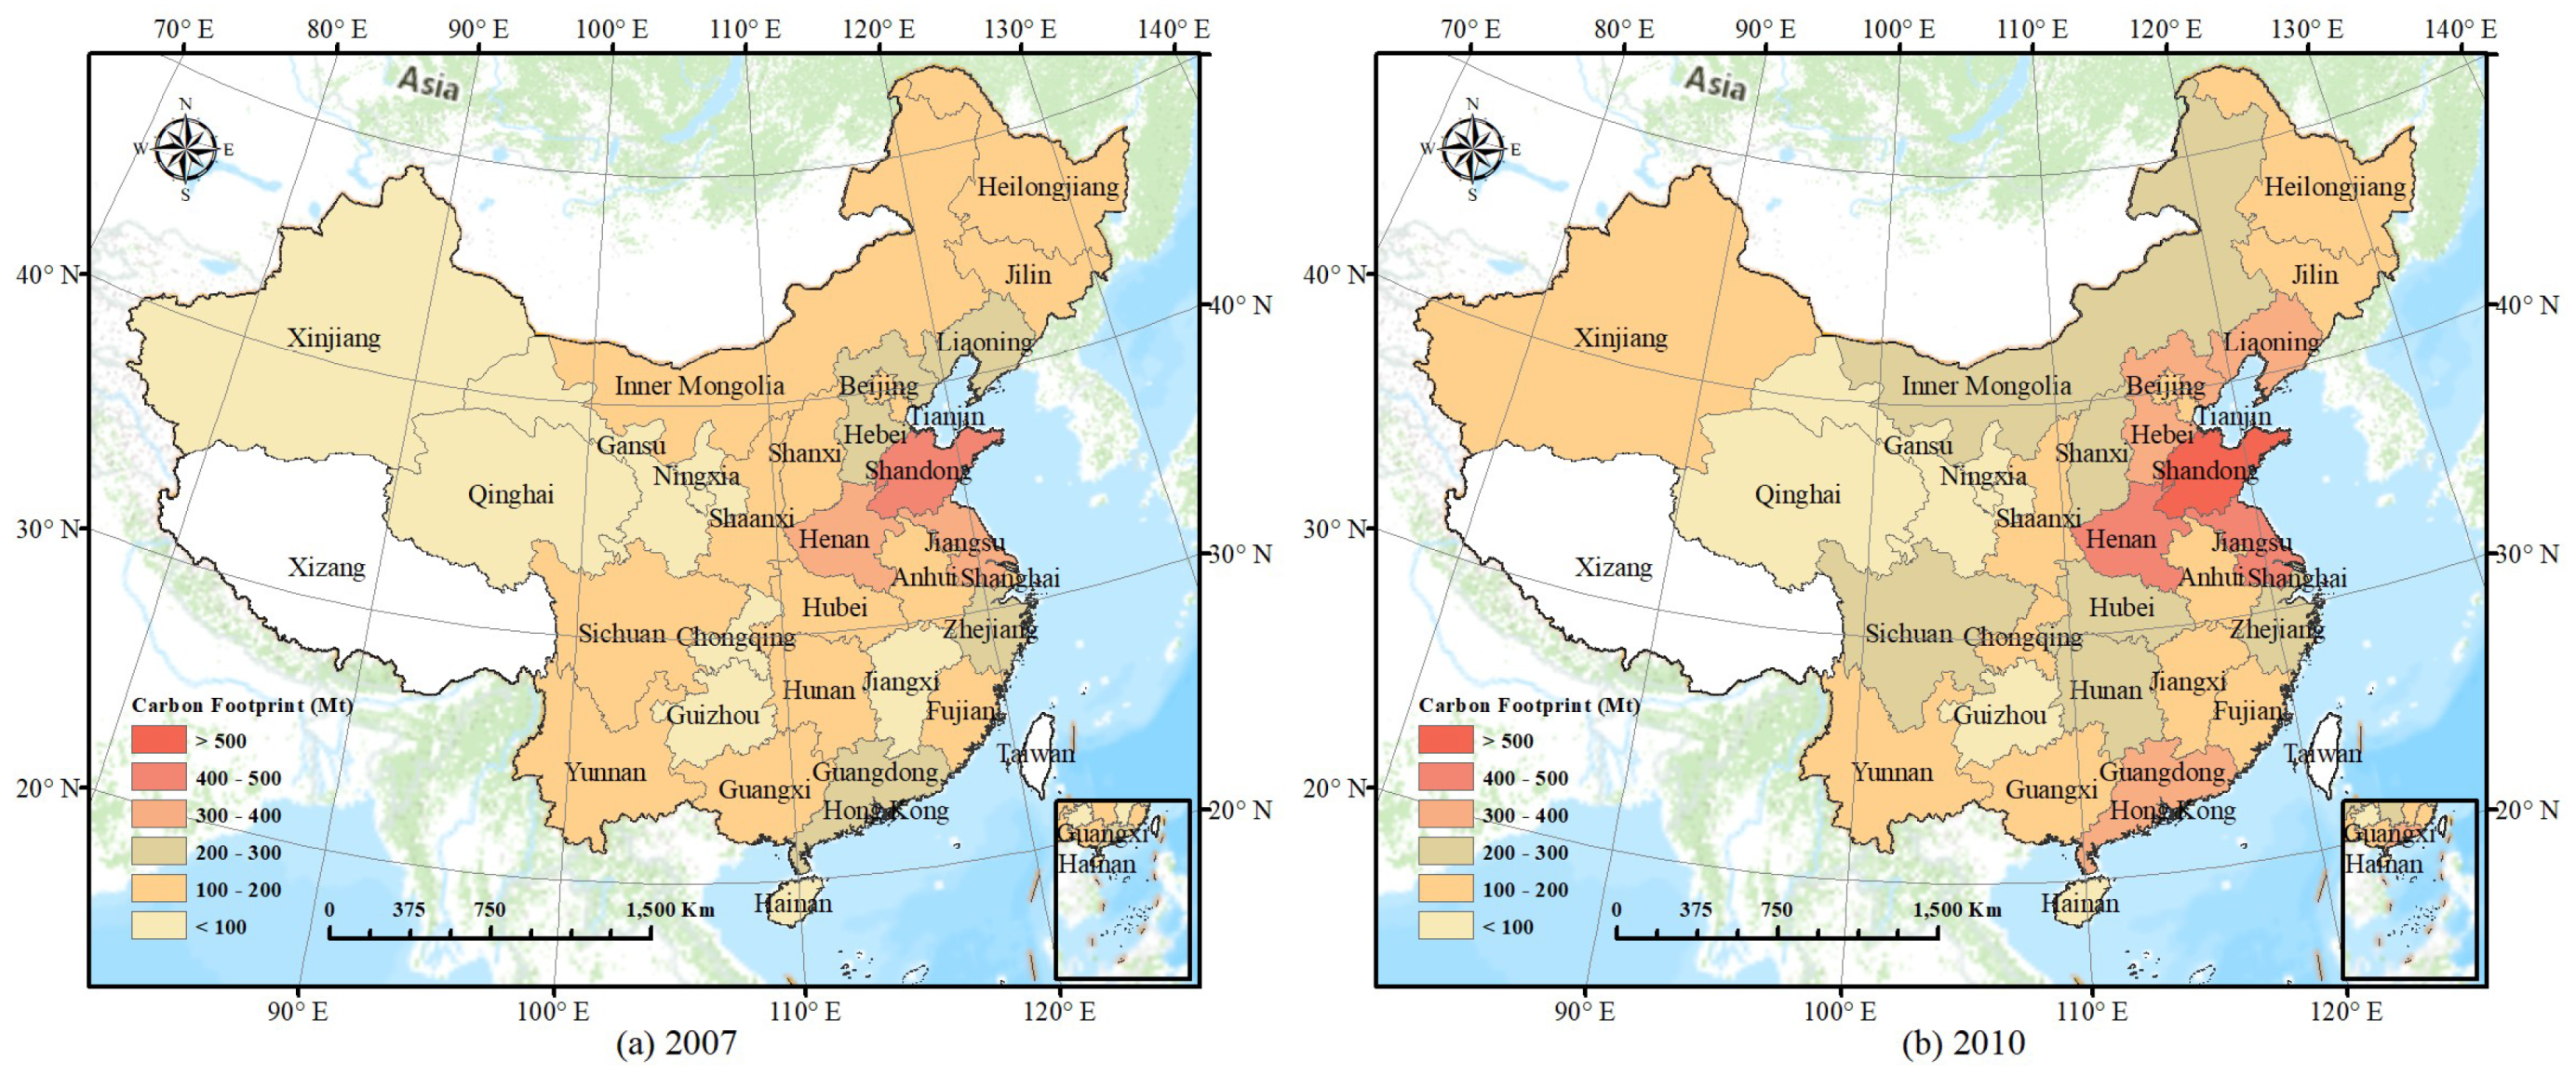
The total carbon footprint in China increased from 4578 Mt in 2007 to 6252 Mt in 2010, with an average annual growth rate of 12.19% (Table 1). The provinces with the largest carbon footprints included Shandong, Jiangsu, Hebei, and Liaoning in Eastern China, Henan in central China, and Guangdong in Southern China, whereas those with smaller carbon footprints were Qinghai, Ningxia, and Gansu in Northwestern China and Guizhou, and Jiangxi and Hainan in Southern China. The economically developed coastal provinces have greater carbon footprints (Figure 1). For example, the carbon footprints of Guangdong, Jiangsu, and Shanghai were, respectively, as large as 387.69 Mt, 426.70 Mt, and 214.02 Mt in 2010, while those of Gansu and Guizhou were only 93.58 Mt and 99.95 Mt, respectively. For both years 2007 and 2010, Shandong featured the largest carbon footprint (more than 500 Mt), while Guizhou, Jiangxi, Gansu, Ningxia, Qinghai and Hainan had the smallest carbon footprints (below 100 Mt) (Figure 1).
As shown in Table 1, the increase in carbon footprint from 2007 to 2010 was large in Shandong, Liaoning, Hebei, and Henan. The increase was relatively small in Northwestern China, approximately 20 Mt on average. Sichuan had the biggest growth rate (55.90%), which was approximately twice that of Shanxi (26.86%). Moreover, the carbon footprints of Liaoning and Chongqing increased by more than 50%, while those of Shanxi, Hunan, and Heilongjiang increased slowly.
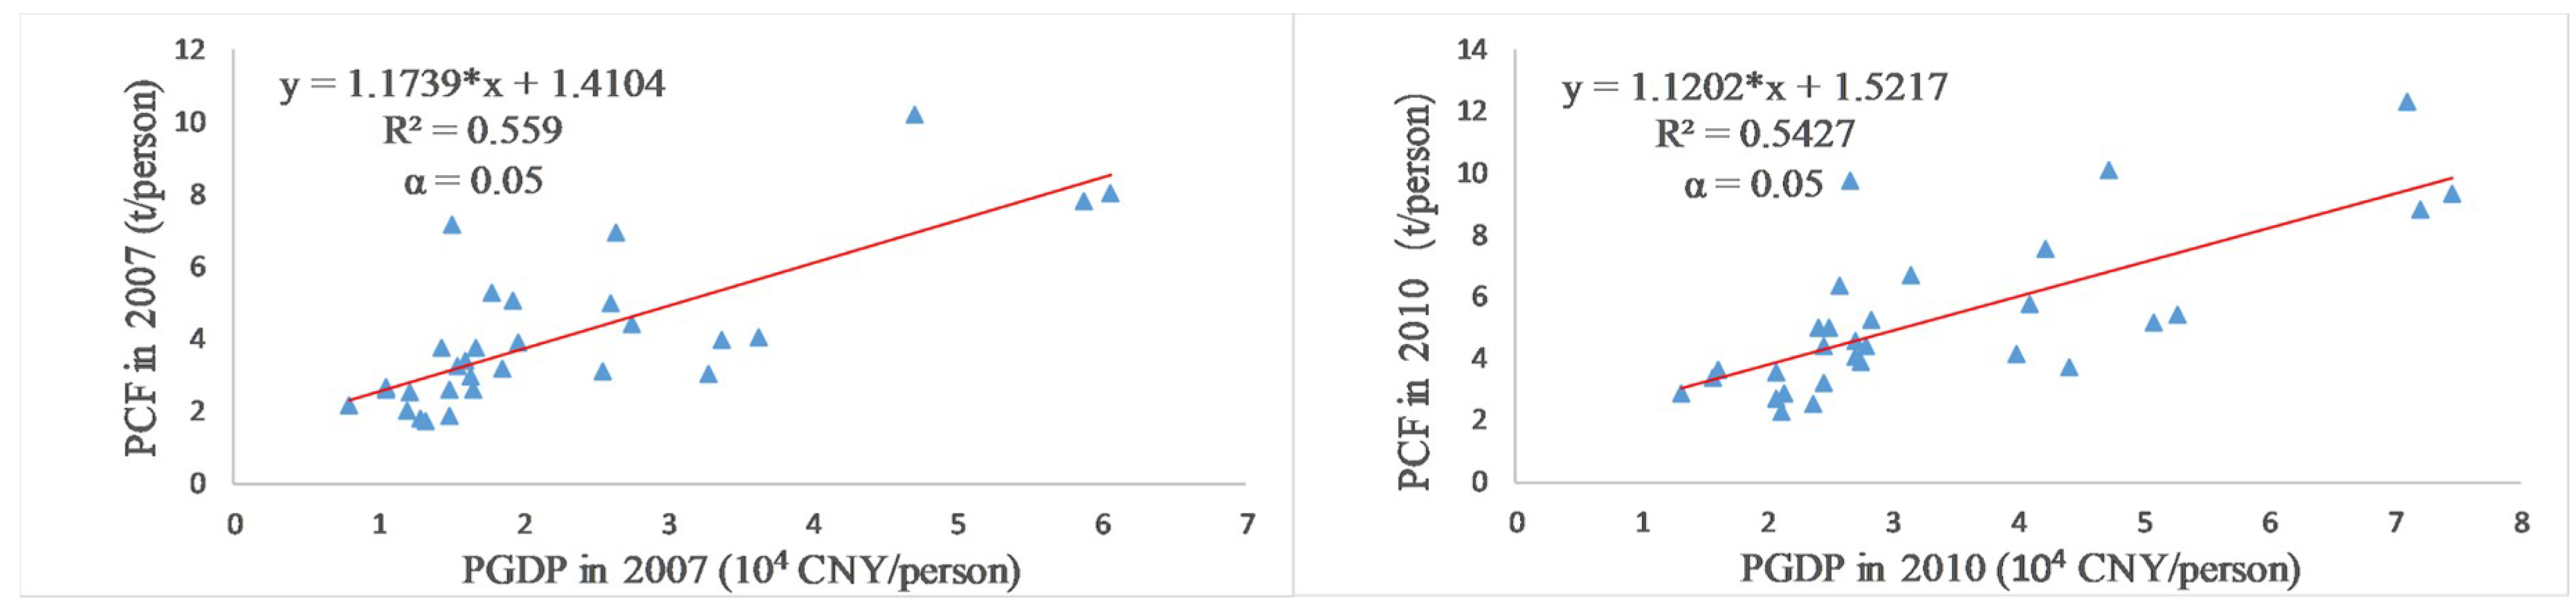
Table 2 shows the per capita carbon footprint aligned with the provincial socio-economic conditions. Tianjin, Inner Mongolia, Jiangsu, Liaoning, and Zhejiang experienced rapid economic development from 2007 to 2010. Specifically, Tianjin’s per capita GDP growth ranked first, with an increase of 24 thousand CNY/person, while the per capita carbon footprint increased by 2.06 t/person. Liaoning’s per capita GDP increased by 16 thousand CNY/person, and its per capita carbon footprint increased from 5.02 t/person in 2007 to 7.54 t/person in 2010. The Spearman’s rank correlation coefficient between the per capita GDP and the per capita carbon footprint was calculated using MATLAB, yielding 0.7735 for the year 2007 and 0.7651 for the year 2010. The regression analysis further suggested the positive impacts of per capita GDP on the per capita carbon footprint (Table 3; Figure 2).
3.2. Direct Carbon Emissions and Embodied Carbon Emissions
Figure 3 shows the direct carbon emissions and embodied carbon emissions in the provinces of China for the years 2007 and 2010. Nine economically developed provinces, namely Beijing, Tianjin, Guangdong, Shanghai, Shaanxi, Guangxi, Zhejiang, Anhui, and Jilin, had more embodied carbon emissions transferred from other regions than direct carbon emissions, which implies a potential shift of emission reduction pressure to other provinces. Shanghai, Beijing, and Tianjin, which feature high per capita GDP and large consumption needs, had the largest shares of embodied carbon emissions (approximately 70%) of their provincial total. The other 21 provinces had greater direct carbon emissions than inter-provincial embodied carbon emissions. In other words, they were able to meet most of their own consumption demand through local production.
From 2007 to 2010, all provinces experienced a steady increase in inter-provincial embodied carbon emissions (32–41%). However, the increase in direct carbon emissions varied among provinces with different development levels (18–66%) (Table 4). This is similar to the findings of Kanemoto et al. [16] on carbon emissions in China. The growth rates of direct carbon emissions in developed regions, such as in Beijing (23.06%) and Shanghai (18.23%), were below 30%. In contrast, some less developed provinces exhibited large growth of direct carbon emissions of more than 60% (e.g., Sichuan (66.31%), Chongqing (65.97%) and Liaoning (63.96%)).
3.3. Embodied Carbon Composition in Inter-Provincial Trade
In 2007, the provincial carbon emissions embodied in trade were 2027.78 Mt, accounting for 44.29% of the national carbon footprint. In 2010, the embodied carbon emissions increased to 2734.86 Mt, accounting for 43.74% of the national carbon footprint. Figure 4 shows the sectoral composition of the carbon footprint. The industry sector contributed approximately 80% of carbon emissions to the total amount of carbon footprint in both 2007 and 2010. The second largest sector of carbon was the transportation and warehousing sector, which accounted for 8% of the total in both 2007 and 2010. The other services sector contributed 4% in 2007 and 5% in 2010, while the wholesale and retail trade sector contributed 3% in both years. The agriculture, forestry, animal husbandry, and fisheries sector contributed 3% in 2007 and 2% in 2010, and the construction sector held constant at 2% in both years.
Figure 5 and Figure 6 demonstrate the inter-provincial carbon inflows and outflows of each sector for each province in both 2007 and 2010. The inter-provincial carbon emission inflows were mainly concentrated in the industrially developed provinces, such as Guangdong, Hebei, Henan, Jiangsu, and Zhejiang. The inter-provincial carbon emission inflows were small (less than 30 Mt) in Western China, such as in Qinghai, Ningxia, and Gansu. As one of the four pilot provinces selected by the National Development and Reform Commission to implement carbon emission trade policy [31], Guangdong had an inter-provincial carbon emission inflow of 160.75 Mt in 2007, ranking in first place of all provinces. In 2010, the carbon inflow of Guangdong Province further increased by 34% compared to that in 2007.
The inter-provincial carbon outflows were mainly concentrated in the resource-rich provinces (such as Hebei, Henan, Shanxi, and Inner Mongolia) as well as the manufacturing-intensive provinces (such as Shandong, Jiangsu, and Guangdong). The top five provinces with the largest carbon emission outflows in 2007 were Hebei (254.51 Mt), Henan (142.77 Mt), Shandong (130.06 Mt), Shanxi (116.09 Mt), and Jiangsu (109.31 Mt), while those in 2010 were Hebei (353.53 Mt), Henan (183.68 Mt), Shandong (169.47 Mt), Liaoning (160.25 Mt), and Jiangsu (155.76 Mt). The inter-provincial carbon emission outflows from Hebei were the greatest—almost double the amount of outflow by Henan (ranked in second place).
3.4. Inter-Regional Carbon Transfer
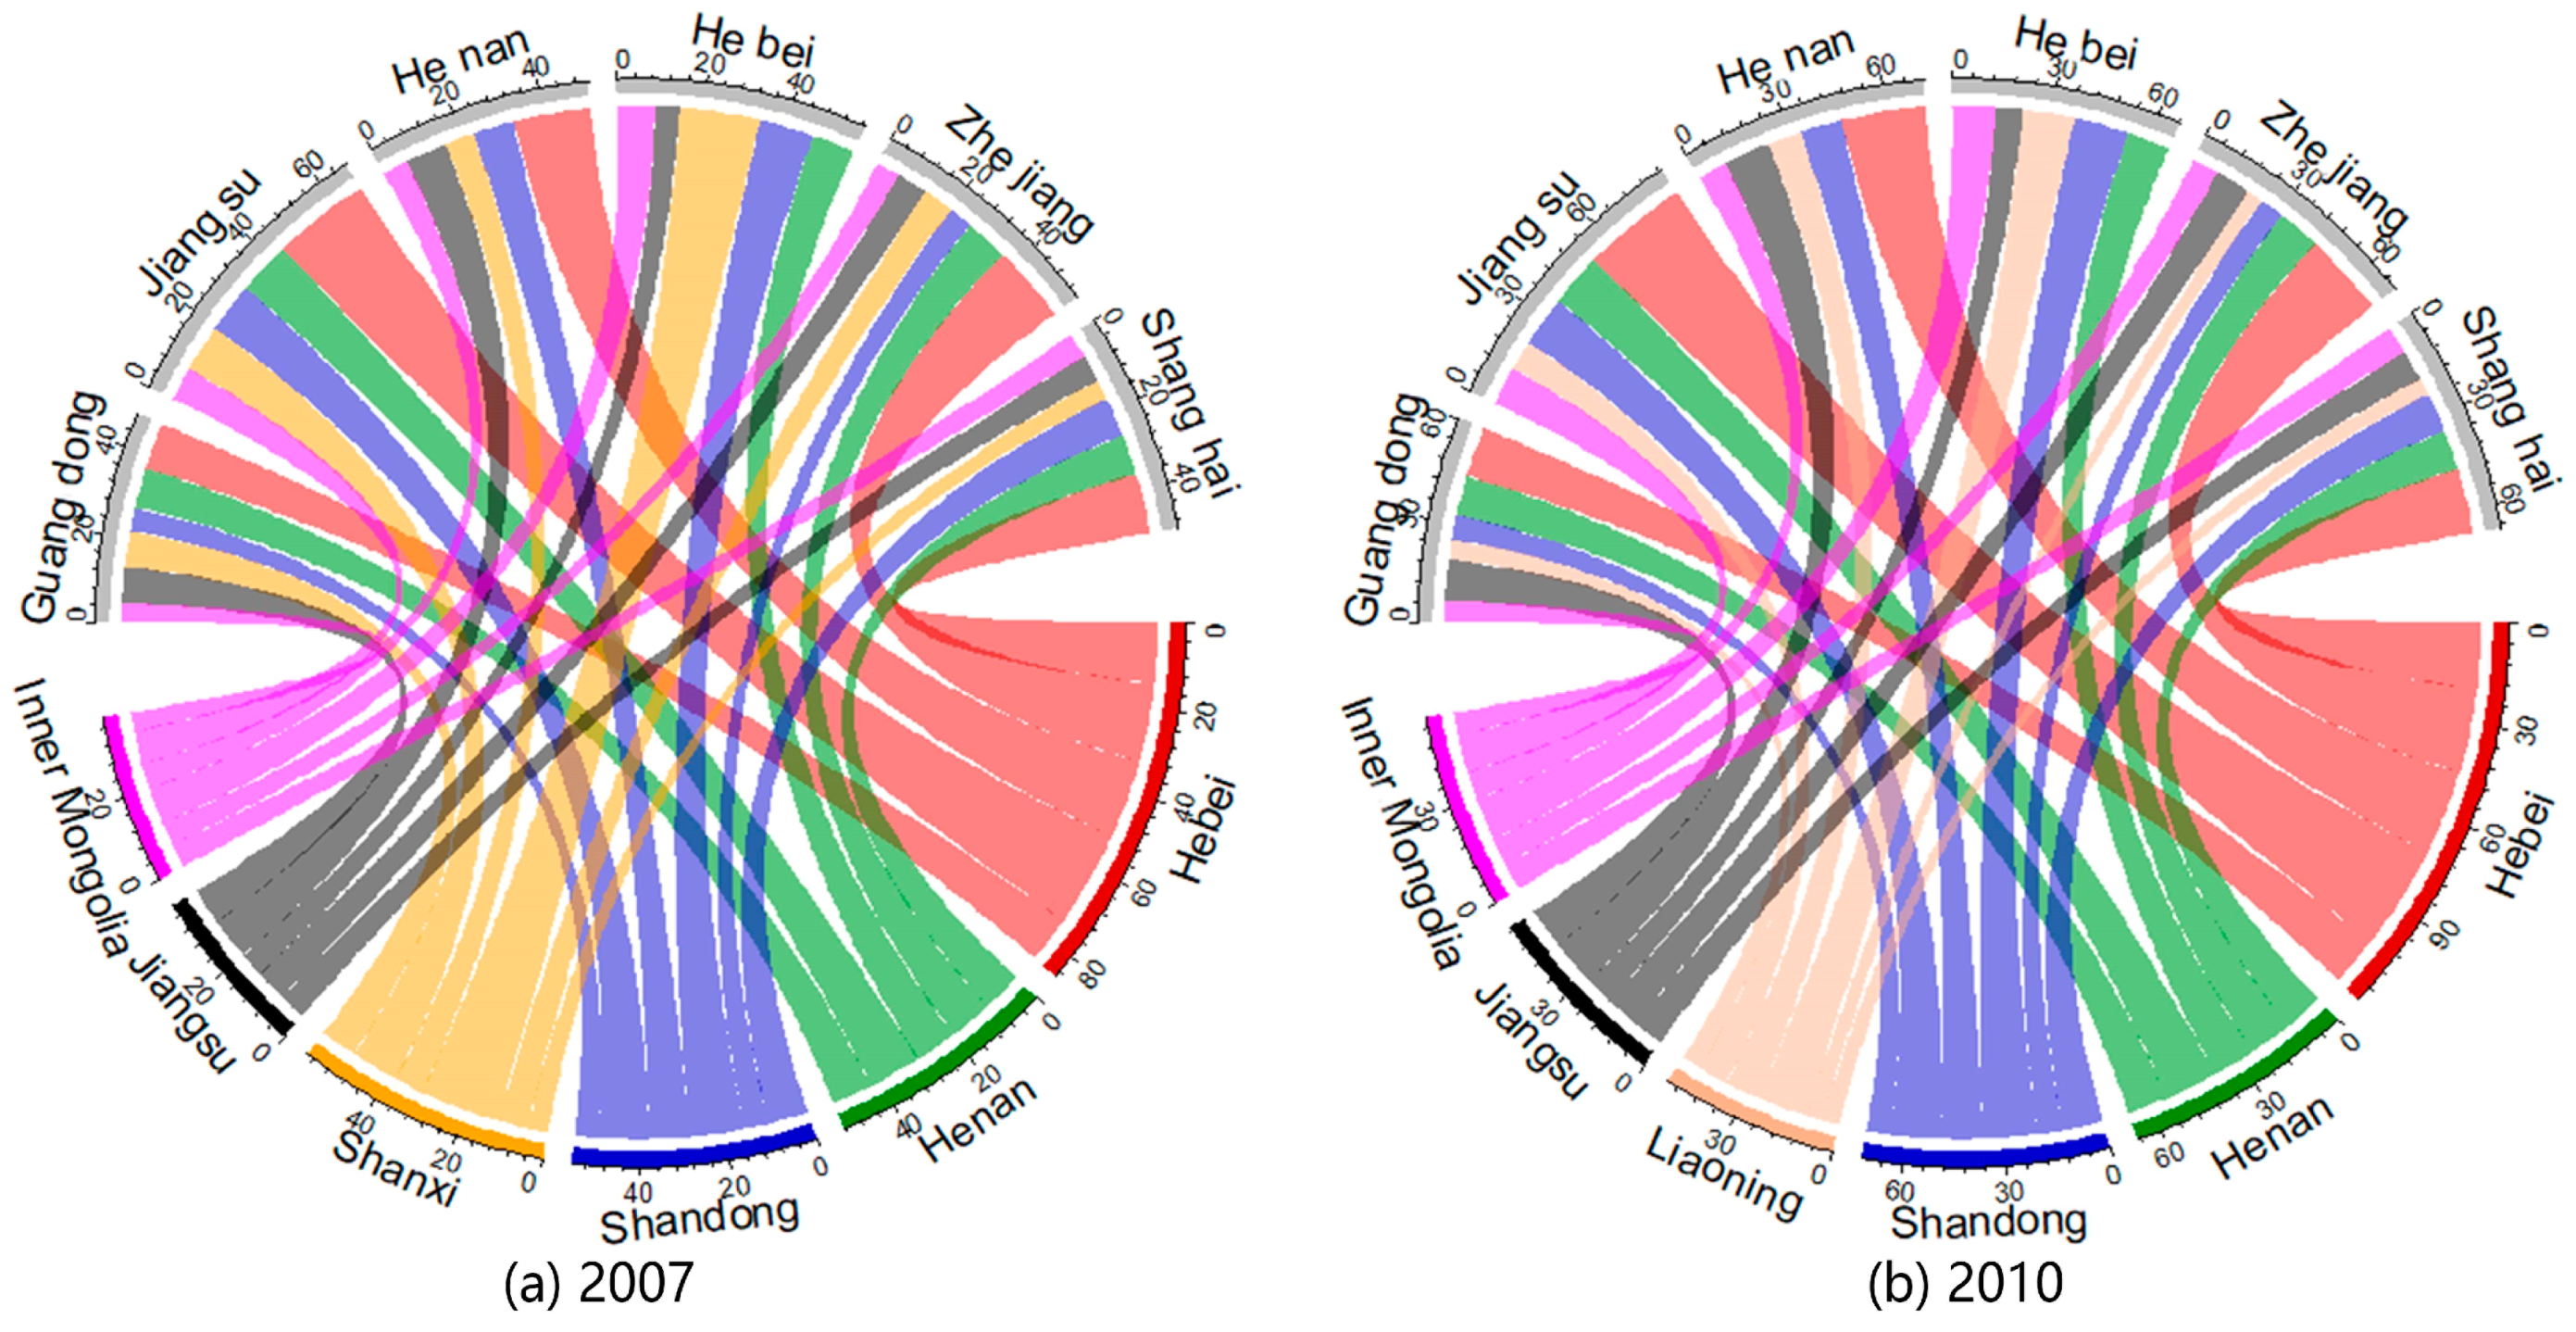
The embodied carbon was transferred from the moderately developed or remote provinces to the developed provinces, implying that the carbon emission pressure of the developed provinces was shifted to the other provinces. According to the results of MRIO model, the carbon flow from Hebei to Jiangsu was the largest (23.08 Mt) in 2007, followed by the flow from Hebei to Beijing (19.28 Mt), Shanxi to Hebei (18.94 Mt), Hebei to Henan (18.51 Mt), Hebei to Zhejiang (18.44 Mt), Hebei to Shandong (17.64 Mt), and Liaoning to Jilin (16.45 Mt). In 2010, the carbon flow from Hebei to Jiangsu was still the largest (32.07 Mt), followed by that from Liaoning to Jilin (27.60 Mt), Hebei to Beijing (26.78 Mt), Hebei to Henan (25.75), Hebei to Zhejiang (25.60 Mt), Hebei to Shandong (24.48 Mt), and Liaoning to Heilongjiang (20.82 Mt).
Figure 7 shows the inter-regional carbon flows among six major provinces for the years 2007 and 2010, respectively. In this figure, the width of the strip indicates the intensity of carbon flow, and the flow direction is from the lower-half to the upper-half. In 2007, the carbon emission outflows of Hebei, Henan, Shandong, and Shanxi accounted for 31.73% of the national total. The carbon emissions of Hebei were mainly transferred to Jiangsu and Henan, while those of Shanxi were mainly exported to Hebei. Most of the carbon inflows to Jiangsu, Henan, Zhejiang, and Shanghai were from Hebei, while the sources of carbon inflows for Guangdong were diversified. In 2010, most carbon outflows from Hebei mainly went to Jiangsu, followed by Henan and Shanghai. The carbon emission outflows of Jiangsu, Henan, Zhejiang, and Shanghai contributed substantially to the carbon inflows of Hebei.
4. Discussion
In this study, we quantified the carbon footprints of China’s provinces for the years 2007 and 2010. We found that approximately 55% of the provincial carbon footprints in both 2007 and 2010 were local direct carbon emissions. This result is in line with the previous finding that direct carbon emissions account for a dominant share of domestic carbon footprints in China [1]. Given the relatively large carbon footprint, the per capita carbon footprint for most of the provinces are low compared to those of developed countries [15,32]. Moreover, we also found that economic development, as indicated by the growth of per capita GDP, was faster than the increase of per capita carbon footprint in China from 2007 to 2010 (Table 2), implying China’s effective efforts in carbon emission reduction while maintaining economic growth. This finding is also consistent with those in previous studies [33]. On the other hand, as demonstrated by previous studies with complementary sectoral data [15,34], China’s domestic carbon footprint is largely related to the investment activities and urban household consumption. Considering that China is still in the progress of rapid urbanization, the carbon footprint is expected to grow due to the changing lifestyles and corresponding expansion of production/investment activities to satisfy the increased consumption needs. Therefore, policies aimed at curbing carbon footprint growth can be promoted from the perspectives of, for instance, encouraging the use of low carbon materials and increasing recycling rates of intermediate goods in the production procedures as well as enhancing the decarbonization of household consumption activities [33].
In our analysis, we identified the quantities of carbon emissions due to consumption in local economic sectors and those in other regions, respectively. The derived inter-regional carbon transfers also revealed the major linkages between different domestic regions and economic sectors. These results may shed light on the identification of primary sources that have substantial potential for mitigating carbon emissions. The presented analysis can also be integrated into the policy development of carbon mitigation across different geographic regions and provide useful information to guide relevant decision making from a consumption point of view. Nevertheless, our study suffers from some limitations. The inter-regional trade data is for the years 2007 and 2010 and may not reflect the most up-to-date situation. In this study, we focused mainly on the domestic carbon footprint and inter-regional carbon flows, lacking the analysis between domestic provinces and foreign countries/regions. As China becomes increasingly important in a globalized economy, in our future work, it will be feasible to integrate the domestic inter-regional trade data with the international trade data and mimic the impacts of foreign consumption on China’s carbon emissions.
5. Conclusions
By using the MRIO model, we conducted an analysis of China’s domestic carbon footprint and inter-regional carbon transfer among 30 provincial units. Several results were obtained from this analysis, as follows.
(1) The total carbon footprint of inter-provincial trade in China increased from 4578 Mt in 2007 to 6252 Mt in 2010, with an average annual growth rate of 12.19%. The carbon footprint was highly different among the various provinces of China. The top four provinces with the largest carbon footprints were Shandong, Jiangsu, Henan, and Guangdong, and the three provinces with the smallest carbon footprints were Hainan, Qinghai, and Ningxia.
(2) Carbon emission inflows in economically developed coastal areas were larger and mainly from moderately developed or inland provinces. Carbon emissions were transferred from less developed provinces to the developed ones through importing carbon-intensive products, which implies the potential transfer of emission reduction responsibilities. Hebei played an important role in the inter-provincial carbon emission outflows throughout China. The largest transfer flow throughout the country was from Hebei to Jiangsu.
(3) From 2007 to 2010, the carbon footprints of moderately developed provinces such as Sichuan, Chongqing, and Liaoning grew rapidly. Moreover, economic development, as indicated by the growth of per capita GDP, was faster than the increase of per capita carbon footprint in China from 2007 to 2010, implying China’s effective efforts in carbon emission reduction while maintaining economic growth.
Author Contributions
Conceptualization, M.H. and Y.C.; Methodology, M.H. and Y.C.; Software, M.H.; Validation, M.H., Y.C. and Y.Z.; Formal Analysis, M.H.; Resources, M.H. and Y.C.; Data Curation, M.H. and Y.Z.; Writing-Original Draft Preparation, M.H.; Writing-Review & Editing, M.H. and Y.C.; Visualization, M.H.; Funding Acquisition, Y.C.
Funding
This research was supported by the National Key R&D Program of China (2017YFA0604401), the National Natural Science Foundation of China (Grant No. 41871306 and 41601420), the Key National Natural Science Foundation of China (Grant No. 41531176) and the research fund from Shenzhen Key Laboratory of Spatial Smart Sensing and Service.
Acknowledgments
We sincerely thank the anonymous reviewers for their useful comments and suggestions.
Conflicts of Interest
The authors declare no conflict of interest.
References
- Zhong, Z.; Huang, R.; Tang, Q.; Cong, X.; Wang, Z. China’s provincial CO2 emissions embodied in trade with implications for regional climate policy. Front. Earth. Sci-PRC. 2015, 9, 77–90. [Google Scholar] [CrossRef]
- Qi, T.; Winchester, N.; Karplus, V.J.; Zhang, X. Will economic restructuring in China reduce trade-embodied CO2 emissions? Energy Econ. 2014, 42, 204–212. [Google Scholar] [CrossRef]
- Dong, L.; Liang, H. Spatial analysis on China’s regional air pollutants and CO2 emissions: Emission pattern and regional disparity. Atmos. Environ. 2014, 92, 280–291. [Google Scholar] [CrossRef]
- Mi, Z.; Zhang, Y.; Guan, D.; Shan, Y.; Liu, Z.; Cong, R.; Yuan, X.C.; Wei, Y.M. Consumption-based emission accounting for Chinese cities. Appl. Energ. 2016, 184, 1073–1081. [Google Scholar] [CrossRef] [Green Version]
- Liu, Z.; Guan, D.; Wei, W.; Davis, S.J.; Ciais, P.; Bai, J.; Peng, S.; Zhang, Q.; Hubacek, K.; Marland, G. Reduced carbon emission estimates from fossil fuel combustion and cement production in China. Nature 2015, 524, 335. [Google Scholar] [CrossRef] [PubMed]
- Zhang, B.; Qiao, H.; Chen, Z.; Chen, B. Growth in embodied energy transfers via China’s domestic trade: Evidence from multi-regional input-output analysis. Appl. Energy 2016, 184, 1093–1105. [Google Scholar] [CrossRef]
- Wiedmann, T.; Lenzen, M. Environmental and social footprints of international trade. Nat. Geosci. 2018, 11, 314–321. [Google Scholar] [CrossRef]
- Duan, C.; Chen, B.; Feng, K.; Liu, Z.; Hayat, T.; Alsaedi, A.; Ahmad, B. Interregional carbon flows of China. Appl. Energ. 2018. [Google Scholar] [CrossRef]
- Wright, L.A.; Coello, J.; Kemp, S.; Williams, I. Carbon footprinting for climate change management in cities. Carbon. Manag. 2011, 2, 49–60. [Google Scholar] [CrossRef]
- Wiedmann, T.; Minx, J. A definition of “carbon footprint”. In Ecological Economics Research Trends; Pertsova, C.C., Ed.; Nova Science Publishers: New York, 2008; Volume 1, pp. 1–11. [Google Scholar]
- Kitzes, J. An introduction to environmentally-extended input-output analysis. Resources. 2013, 2, 489–503. [Google Scholar] [CrossRef]
- Schandl, H.; Hatfield-Dodds, S.; Wiedmann, T.; Geschke, A.; Cai, Y.; West, J.; Newth, D.; Baynes, T.; Lenzen, M.; Owen, A. Decoupling global environmental pressure and economic growth: Scenarios for energy use, materials use and carbon emissions. J. Clean. Prod. 2016, 132, 45–56. [Google Scholar] [CrossRef]
- Tukker, A.; Poliakov, E.; Heijungs, R.; Hawkins, T.; Neuwahl, F.; Rueda-Cantuche, J.M.; Giljum, S.; Moll, S.; Oosterhaven, J.; Bouwmeester, M. Towards a global multi-regional environmentally extended input-output database. Ecol. Econ. 2009, 68, 1928–1937. [Google Scholar] [CrossRef]
- Guo, J.E.; Zhang, Z.; Meng, L. China’s provincial CO2 emissions embodied in international and interprovincial trade. Energ. Policy. 2012, 42, 486–497. [Google Scholar] [CrossRef]
- Zhang, Y.; Wang, H.; Liang, S.; Xu, M.; Liu, W.; Li, S.; Zhang, R.; Nielsen, C.P.; Bi, J. Temporal and spatial variations in consumption-based carbon dioxide emissions in China. Renew. Sust. Energ. Rev. 2014, 40, 60–68. [Google Scholar] [CrossRef]
- Kanemoto, K.; Moran, D.; Hertwich, E.G. Mapping the Carbon Footprint of Nations. Environ. Sci. Technol. 2016, 50, 10512–10517. [Google Scholar] [CrossRef] [PubMed]
- Leontief, W.W. Quantitative Input and Output Relations in the Economic Systems of the United States. Rev. Econ. Stat. 1936, 18, 105–125. [Google Scholar] [CrossRef]
- Hasegawa, R.; Kagawa, S.; Tsukui, M. Carbon footprint analysis through constructing a multi-region input-output table: A case study of Japan. J. Econ. Struct. 2015, 4, 5. [Google Scholar] [CrossRef]
- Davis, S.J.; Caldeira, K. Consumption-based accounting of CO2 emissions. P. Natl. Acad. Sci. 2010, 107, 5687–5692. [Google Scholar] [CrossRef]
- Wiedmann, T. A first empirical comparison of energy Footprints embodied in trade-MRIO versus PLUM. Ecol. Econ. 2009, 68, 1975–1990. [Google Scholar] [CrossRef]
- Xu, Z.; Junguo, L.; Qingying, L.; R, T.M.; Dabo, G.; Klaus, H. Physical and virtual water transfers for regional water stress alleviation in China. P. Natl. Acad. Sci. 2015, 112, 1031–1035. [Google Scholar] [CrossRef] [Green Version]
- Zhang, Z.; Yang, H.; Shi, M. Analyses of water footprint of Beijing in an interregional input–output framework. Ecol. Econ. 2011, 70, 2494–2502. [Google Scholar] [CrossRef]
- Han, M.; Dunford, M.; Chen, G.; Liu, W.; Li, Y.; Liu, S. Global water transfers embodied in Mainland China’s foreign trade: Production- and consumption-based perspectives. J. Clean. Prod. 2017, 161, 188–199. [Google Scholar] [CrossRef]
- Costello, C.; Griffin, W.M.; Matthews, H.S.; Weber, C.L. Inventory development and input-output model of U.S. land use: Relating land in production to consumption. Environ. Sci. Technol. 2011, 45, 4937–4943. [Google Scholar] [CrossRef] [PubMed]
- Weinzettel, J.; Hertwich, E.G.; Peters, G.P.; Steen-Olsen, K.; Galli, A. Affluence drives the global displacement of land use. Global. Environ. Chang. 2013, 23, 433–438. [Google Scholar] [CrossRef]
- Lenzen, M.; Moran, D.; Kanemoto, K.; Foran, B.; Lobefaro, L.; Geschke, A. International trade drives biodiversity threats in developing nations. Nature 2012, 486, 109–112. [Google Scholar] [CrossRef] [PubMed]
- Chen, Y.; Li, X.; Liu, X.; Zhang, Y.; Huang, M. Tele-connecting China’s future urban growth to impacts on ecosystem services under the shared socioeconomic pathways. Sci. Total. Environ. 2019, 652, 765–779. [Google Scholar] [CrossRef] [PubMed]
- Liu, W.; Chen, J.; Tang, Z.; Liu, H.; Han, D.; Li, F. China’s 30 Provincial Multi-regional Input-Output Table Theory and Practice in 2007; China Statistics Press: Beijing, China, 2012. [Google Scholar]
- Liu, W.; Tang, Z.; Chen, J. China’s 30 Provincial Multi-regional Input-output Table Theory and Practice in 2010. China Statistics Press: Beijing, China, 2014.
- IPCC. 2006 IPCC Guidelines for National Greenhouse Gas Inventories. Available online: https://www.ipcc-nggip.iges.or.jp/support/Primer_2006GLs.pdf (accessed on 4 December 2018).
- Wang, P.; Dai, H.C.; Ren, S.Y.; Zhao, D.Q.; Masui, T. Achieving Copenhagen target through carbon emission trading: Economic impacts assessment in Guangdong Province of China. Energy 2015, 79, 212–227. [Google Scholar] [CrossRef]
- Steen-Olsen, K.; Weinzettel, J.; Cranston, G.; Ercin, A.E.; Hertwich, E.G. Carbon, land, and water footprint accounts for the European Union: Consumption, production, and displacements through international trade. Environ. Sci. Technol. 2012, 46, 10883–10891. [Google Scholar] [CrossRef]
- Tian, X.; Chang, M.; Lin, C.; Tanikawa, H. China’s carbon footprint: A regional perspective on the effect of transitions in consumption and production patterns. Appl. Energ. 2014, 123, 19–28. [Google Scholar] [CrossRef]
- Chen, G.; Zhang, B. Greenhouse gas emissions in China 2007: Inventory and input–output analysis. Energ. Policy. 2010, 38, 6180–6193. [Google Scholar] [CrossRef]
Figure 1.
Distribution of carbon footprints in (a) 2007 and (b) 2010 for each provincial unit of China (Note: Mt = 106 tons). Tibet, Taiwan, Hong Kong, and Macao contained no data.
Figure 1.
Distribution of carbon footprints in (a) 2007 and (b) 2010 for each provincial unit of China (Note: Mt = 106 tons). Tibet, Taiwan, Hong Kong, and Macao contained no data.

Figure 2.
Scatter-plots of PGDP against PCF in 2007 and 2010.

Figure 3.
The composition of the carbon footprint in 2007 (left) and 2010 (right).

Figure 4.
The proportions of direct and indirect carbon emissions in 2007 (a) and 2010 (b): a. the agriculture, forestry, animal husbandry, and fisheries sector; b. the industry sector; c. the construction sector; d. the transportation and warehousing sector; e. the wholesale and retail trade sector; f. the other services sector; g. indirect carbon emissions or embodied carbon emissions in inter-provincial trade.

Figure 5.
The inter-regional inflows and outflows of embodied carbon emissions in 2007.

Figure 6.
The inter-regional inflows and outflows of embodied carbon emissions in 2010.

Figure 7.
The carbon transfers among six provinces with the largest inter-provincial carbon emission inflows and outflows in 2007 (a) and 2010 (b) (the strip width indicates the intensity of inter-regional carbon transfer, with the flow direction from the lower-half to the upper-half).
Figure 7.
The carbon transfers among six provinces with the largest inter-provincial carbon emission inflows and outflows in 2007 (a) and 2010 (b) (the strip width indicates the intensity of inter-regional carbon transfer, with the flow direction from the lower-half to the upper-half).


Table 1.
The carbon footprints (unit: Mt) and rankings of provinces in 2007 and 2010.
| 2007 | 2010 | Change in Rank | Growth (%) | |||
|---|---|---|---|---|---|---|
| Province | CF (Mt) | Rank | CF (Mt) | Rank | ||
| Total | 4578.27 | - | 6251.67 | - | - | 36.57 |
| Shandong | 413.35 | 1 | 548.85 | 1 | - | 32.78 |
| Henan | 315.70 | 2 | 415.53 | 3 | 1 | 31.62 |
| Jiangsu | 309.56 | 3 | 426.70 | 2 | −1 | 37.84 |
| Guangdong | 292.54 | 4 | 387.69 | 4 | - | 32.53 |
| Hebei | 272.66 | 5 | 375.21 | 5 | - | 37.61 |
| Liaoning | 215.84 | 6 | 329.97 | 6 | - | 52.88 |
| Zhejiang | 210.13 | 7 | 283.08 | 7 | - | 34.72 |
| Shanxi | 179.93 | 8 | 228.26 | 11 | 3 | 26.86 |
| Hubei | 170.85 | 9 | 249.73 | 8 | −1 | 46.16 |
| Inner Mongolia | 169.05 | 10 | 248.76 | 9 | −1 | 47.15 |
| Shanghai | 165.81 | 11 | 214.02 | 12 | 1 | 29.08 |
| Hunan | 164.12 | 12 | 208.47 | 13 | 1 | 27.03 |
| Sichuan | 147.40 | 13 | 229.80 | 10 | −3 | 55.90 |
| Jilin | 137.32 | 14 | 184.04 | 14 | - | 34.02 |
| Beijing | 131.34 | 15 | 172.50 | 15 | - | 31.34 |
| Anhui | 124.79 | 16 | 162.89 | 18 | 2 | 30.53 |
| Shaanxi | 121.66 | 17 | 170.21 | 16 | −1 | 39.90 |
| Heilongjiang | 121.45 | 18 | 154.99 | 21 | 3 | 27.62 |
| Guangxi | 119.29 | 19 | 164.75 | 17 | −2 | 38.11 |
| Yunnan | 115.89 | 20 | 155.49 | 20 | - | 34.16 |
| Tianjin | 114.11 | 21 | 159.71 | 19 | −2 | 39.96 |
| Fujian | 112.10 | 22 | 153.92 | 22 | - | 37.30 |
| Xinjiang | 79.18 | 23 | 108.41 | 24 | 1 | 36.92 |
| Guizhou | 77.55 | 24 | 99.95 | 26 | 2 | 28.89 |
| Jiangxi | 74.32 | 25 | 100.72 | 25 | - | 35.53 |
| Chongqing | 74.11 | 26 | 112.42 | 23 | −3 | 51.69 |
| Gansu | 67.96 | 27 | 93.58 | 27 | - | 37.70 |
| Ningxia | 43.74 | 28 | 61.62 | 28 | - | 40.88 |
| Qinghai | 20.59 | 29 | 28.11 | 29 | - | 36.55 |
| Hainan | 15.95 | 30 | 22.28 | 30 | - | 39.71 |
Note: CF = carbon footprint.
Table 2.
The economic status and urbanization rates of provinces in China in 2007–2010.
| 2007 | 2010 | |||||
| Provinces | PGDP | PCF | Urban Rate | PGDP | PCF | Urban Rate |
| (104 CNY) | (t) | (%) | (104 CNY) | (t) | (%) | |
| Shanghai | 6.05 | 8.03 | 0.89 | 7.45 | 9.29 | 0.89 |
| Beijing | 5.88 | 7.84 | 0.84 | 7.19 | 8.79 | 0.86 |
| Tianjin | 4.71 | 10.23 | 0.76 | 7.10 | 12.29 | 0.80 |
| Zhejiang | 3.64 | 4.08 | 0.57 | 5.09 | 5.20 | 0.62 |
| Jiangsu | 3.37 | 4.01 | 0.53 | 5.26 | 5.42 | 0.61 |
| Guangdong | 3.29 | 3.03 | 0.63 | 4.41 | 3.71 | 0.66 |
| Shandong | 2.75 | 4.41 | 0.47 | 4.09 | 5.72 | 0.50 |
| Inner Mongolia | 2.64 | 6.96 | 0.50 | 4.72 | 10.06 | 0.56 |
| Liaoning | 2.60 | 5.02 | 0.59 | 4.22 | 7.54 | 0.62 |
| Fujian | 2.56 | 3.10 | 0.51 | 3.99 | 4.17 | 0.57 |
| Hebei | 1.96 | 3.93 | 0.40 | 2.83 | 5.22 | 0.44 |
| Jilin | 1.94 | 5.03 | 0.53 | 3.16 | 6.70 | 0.53 |
| Heilongjiang | 1.86 | 3.18 | 0.54 | 2.71 | 4.04 | 0.56 |
| Shanxi | 1.78 | 5.30 | 0.44 | 2.57 | 6.39 | 0.48 |
| Xinjiang | 1.68 | 3.78 | 0.39 | 2.49 | 4.96 | 0.43 |
| Chongqing | 1.66 | 2.63 | 0.48 | 2.75 | 3.90 | 0.53 |
| Hubei | 1.64 | 3.00 | 0.44 | 2.79 | 4.36 | 0.50 |
| Henan | 1.60 | 3.37 | 0.34 | 2.46 | 4.42 | 0.39 |
| Shaanxi | 1.55 | 3.28 | 0.41 | 2.71 | 4.56 | 0.46 |
| Ningxia | 1.51 | 7.17 | 0.44 | 2.67 | 9.74 | 0.48 |
| Hunan | 1.49 | 2.58 | 0.40 | 2.44 | 3.17 | 0.43 |
| Hainan | 1.48 | 1.89 | 0.47 | 2.38 | 2.56 | 0.50 |
| Qinghai | 1.44 | 3.73 | 0.40 | 2.40 | 4.99 | 0.45 |
| Jiangxi | 1.33 | 1.70 | 0.40 | 2.12 | 2.26 | 0.44 |
| Sichuan | 1.30 | 1.81 | 0.36 | 2.14 | 2.86 | 0.40 |
| Guangxi | 1.22 | 2.50 | 0.36 | 2.08 | 3.57 | 0.40 |
| Anhui | 1.20 | 2.04 | 0.39 | 2.07 | 2.73 | 0.43 |
| Gansu | 1.06 | 2.67 | 0.32 | 1.61 | 3.66 | 0.36 |
| Yunnan | 1.06 | 2.57 | 0.32 | 1.57 | 3.38 | 0.35 |
| Guizhou | 0.79 | 2.14 | 0.28 | 1.32 | 2.87 | 0.34 |
Note: PGDP = per capita GDP; PCF = per capita CF.
Table 3.
Regression analysis of PGDP and PCF in 2007 and 2010.
| 2007 | 2010 | |||
|---|---|---|---|---|
| p-value | p-value | |||
| Spearman’s rank coefficient | 0.7735 | - | 0.7651 | - |
| Intercept | 1.41** | 0.01 | 1.52** | 0.04 |
| PGDP | 1.17*** | 0.00 | 1.12*** | 0.00 |
Note: *** and ** indicate significant correlations at the 1% and 5% significance levels, respectively; PGDP = per capita GDP; PCF = per capita CF.
Table 4.
The growth of inflowing embodied carbon emissions and direct carbon emissions in China from 2007 to 2010.
Table 4.
The growth of inflowing embodied carbon emissions and direct carbon emissions in China from 2007 to 2010.
| Provinces | DCEG (%) | ECEG (%) | Provinces | DCEG (%) | ECEG (%) |
|---|---|---|---|---|---|
| Sichuan | 66.31 | 33.08 | Xinjiang | 37.75 | 35.86 |
| Chongqing | 65.97 | 35.97 | Jiangxi | 36.93 | 33.11 |
| Liaoning | 63.96 | 33.41 | Zhejiang | 35.41 | 34.14 |
| Inner Mongolia | 57.99 | 35.46 | Yunnan | 33.64 | 34.77 |
| Tianjin | 55.94 | 34.88 | Shandong | 32.44 | 34.06 |
| Hubei | 49.72 | 32.95 | Guangdong | 30.58 | 34.13 |
| Shaanxi | 49.11 | 35.39 | Henan | 29.41 | 34.91 |
| Guangxi | 43.71 | 32.51 | Jilin | 26.57 | 39.15 |
| Ningxia | 43.31 | 36.54 | Anhui | 25.94 | 35.08 |
| Jiangsu | 42.22 | 33.28 | Guizhou | 24.46 | 36.83 |
| Hainan | 42.14 | 34.01 | Hunan | 23.61 | 34.59 |
| Hebei | 40.85 | 33.39 | Beijing | 23.06 | 36.24 |
| Fujian | 40.55 | 33.2 | Shanxi | 22.07 | 36.56 |
| Qinghai | 39.08 | 34.35 | Shanghai | 18.23 | 34.28 |
| Gansu | 37.78 | 37.56 | Heilongjiang | 11.59 | 41.51 |
Note: DCEG = direct carbon emissions growth; ECEG = embodied carbon emissions growth.
© 2018 by the authors. Licensee MDPI, Basel, Switzerland. This article is an open access article distributed under the terms and conditions of the Creative Commons Attribution (CC BY) license (http://creativecommons.org/licenses/by/4.0/).
Share and Cite
MDPI and ACS Style
Huang, M.; Chen, Y.; Zhang, Y. Assessing Carbon Footprint and Inter-Regional Carbon Transfer in China Based on a Multi-Regional Input-Output Model. Sustainability 2018, 10, 4626. https://doi.org/10.3390/su10124626
AMA Style
Huang M, Chen Y, Zhang Y. Assessing Carbon Footprint and Inter-Regional Carbon Transfer in China Based on a Multi-Regional Input-Output Model. Sustainability. 2018; 10(12):4626. https://doi.org/10.3390/su10124626
Chicago/Turabian StyleHuang, Min, Yimin Chen, and Yuanying Zhang. 2018. "Assessing Carbon Footprint and Inter-Regional Carbon Transfer in China Based on a Multi-Regional Input-Output Model" Sustainability 10, no. 12: 4626. https://doi.org/10.3390/su10124626
Note that from the first issue of 2016, this journal uses article numbers instead of page numbers. See further details here.