Article

An Integrated Investigation of Spatiotemporal Habitat Quality Dynamics and Driving Forces in the Upper Basin of Miyun Reservoir, North China

1
State Key Laboratory of Water Environment Simulation, Beijing Normal University, Beijing 100875, China
2
Key Laboratory for Water and Sediment Sciences of Ministry of Education, Beijing Normal University, Beijing 100875, China
3
Beijing Engineering Research Center for Watershed Environmental Restoration and Integrated Ecological Regulation, Beijing Normal University, Beijing 100875, China
4
Department of Environmental Science and Engineering, Beijing Technology and Business University, Beijing 100048, China
*
Author to whom correspondence should be addressed.
Sustainability 2018, 10(12), 4625; https://doi.org/10.3390/su10124625
Submission received: 14 September 2018 / Revised: 28 November 2018 / Accepted: 2 December 2018 / Published: 6 December 2018

Abstract

:
Understanding changes in habitat quality and the driving forces of these changes at landscape scales is a critical part of effective ecosystem management. The present study investigated spatiotemporal habitat quality dynamics and related driving forces from 2005 to 2015 in the upper basin of Miyun Reservoir in North China by constructing an effective framework integrated InVEST and binary logistic regression models. This framework expanded the driving force analysis into an assessment of changes in habitat quality and intuitively verified the effectiveness of relevant environmental policies. The proposed method of combining the equidistant random sampling method and the method of introducing spatial lag variables in logistic regression equation can effectively solve spatial autocorrelation with a large enough number of sampling points. Overall, habitat quality improved during the study period. Spatially, a concentrated loss of habitat occurred in the southeastern part of the basin between the reservoir and mountainous areas, while other areas gradually recovered. Driving force analysis showed that lower elevation mountain land, gentle slopes, locations near rural land or roads, larger areas of grain cultivation, and areas with little population change had a higher likelihood of having changed in habitat quality in the upper basin of Miyun Reservoir. These results suggested that the present policy of protecting the ecosystem had a positive effect on improving habitat quality. In the future, the human activity management related to habitat quality needs to be strengthened. The present study would provide a reference for land use policy formulation and biodiversity conservation.

1. Introduction

The extent and quality of habitat conditions are often used as proxies for biodiversity [1]. High quality habitats provide ecosystem services of global importance, providing significant economic and aesthetic benefits to humans, as well as providing cultural value to human society, along with providing vital ecological processes in terrestrial ecosystems [2]. Nevertheless, habitats are increasingly threatened by human activities, such as the expansion of urbanized land and farmland [3,4,5], and climate change, which is one of the main causes of the current high rates of species extinction [6,7]. The quality of habitats depends on their own natural environment characteristics and impacts of human land use on them [8,9]. Therefore, under the influence of climate change and ecosystem management policies (such as protection of natural forest, and other environmental development projects), assessing changes in habitat quality and exploring their driving forces is a critical need, especially in important ecologically sensitive areas such as drinking water sources.
Habitat quality refers to the ability of ecosystems to provide suitable living conditions for individuals and clusters of species, and is based on the resources that can provide for the survival, reproduction, and sustainability of all species in an area. Habitat quality serves as an important indicator of ecosystem sustainability, while habitat degradation is one of the main causes of a decline in biodiversity. The higher the habitat quality, the better the ecosystem biodiversity. Mapping the extent and occurrence of habitats and identifying the effects of land use and management on habitats are critical parts of ecosystem management. The methods commonly used to evaluate habitat quality at a landscape scale can be classified into two types: (1) constructing an index system [10,11] and (2) the model-based evaluation method [12,13,14]. Most index system methods are descriptive and require large amounts of data. Many researchers have highlighted the role of the model approach in the spatial expression and prediction of future habitats. The model-based analysis methods mainly investigate the distribution of species and their environmental conditions to determine habitat suitability. In recent years, people have gradually realized the effects of the distribution of surrounding sources of threats to habitats and have gradually incorporated them into model studies; this area of research has become a new hot spot for the assessment of habitat suitability [15,16]. The Integrated Valuation of Environmental Services and Tradeoffs (InVEST) model developed by Stanford University and the University of Minnesota, World Wildlife Fund, and The Nature Conservancy is a coarse-filter assessment approach that models habitats or vegetation to identify priorities for conservation with various trade-offs among different conservation strategies. The InVEST model shows advantages in comparing the spatial patterns of biodiversity, ecosystem service functions, and identifies win-win regions that protect both natural systems and the human economy, along with providing future scenarios. The InVEST model can also analyze impacts of land use and land management on species habitat quality [12]. The data size required for the model is small, and the data is relatively easy to obtain. It is an excellent tool for analyzing habitat quality in areas where species distribution data are lacking. Terrado et al. [15] used monitored biodiversity data to verify the reliability of the InVEST model’s simulation results on habitat quality and its range. The InVEST model has successfully been used in many land use change studies to assess the effects of the results of change on habitat quality [1,8,12,14,15]. However, most previous studies have focused on evaluating changes in habitat quality but have not explored their driving forces.
A more comprehensive understanding of the underlying forces that drive changes in habitat quality (e.g., local climate change and socio-economic growth) will be required to reveal the driving mechanisms and basic processes involved in change. These driving factors influence the development path of habitat quality. Scholars have made an effort to understand the patterns and mechanisms of land use from natural and socio-economic perspectives [17,18]. Driving forces of land use change have generally been classified into three groups: biophysical, socio-economic, and spatial driving forces [19]. Although biophysical factors change little in a short time, they can indirectly affect changes in habitat types (e.g., soil type and local climate change factors) as well as influence human behavior and activities (e.g., landform factor). In regional ecosystems, differences in soil conditions, landform characteristics, precipitation, and temperature may significantly affect the spatial distribution of various habitat types. Socio-economic forces, such as population and relative wealth, can be the most important determinants of land cover change [3]. The main forces driving the conversion of natural habitats also include spatial factors, such as distance to a highway, rural land, and/or a town [20]. In practice, many of these factors interact to form a complex network of relationships that influence changes in habitat quality. The relative importance of each driving force factor varied with the area and timing of the research.
Many mathematical models have been applied to the identification of driving forces [21,22,23]. Among these methods, the logistic regression model is a more commonly used method. It considers that the dependent and independent variables are non-linear and also considers spatial variables, making it superior to other methods and allowing it to achieve a quantitative analysis of relationships between the transition and driving factors of land use [18]. Multiple logistic regression has been used to assess the probability of land cover change in a Caribbean tropical moist forest [3,17,24]. When using logistic analysis, one precondition assumes that the sampling point data are statistically independent from each other [25]. Spatial autocorrelation creates an unavoidable problem in spatial sampling data [26]. The independence of sample points from each other is one of the basic assumptions of the logistic model. At present, two main methods have been used to effectively eliminate spatial autocorrelation within sample data: (1) increasing the sampling distance [27,28,29] and (2) introducing spatial weights into logistic regression models [25,26,30]. However, in the actual processing, we found that increasing the sampling distance to avoid spatial autocorrelation will lead to a reduction in the number of effective sampling points, especially if the proportion of changes taking up the total sample size is small. The introduction of spatial weights in a logistic regression equation will increase the amount of computation and cannot effectively address the spatial autocorrelation in some cases, especially when the sample size is large. Therefore, a simple and rapid method to ensure that the number of samples is sufficient with avoiding spatial autocorrelation is needed. Current research on the driving forces of habitat quality change needs expanding, and the effects of exploratory variables may be different from those found in land use change.
In the present study, which analyzes the case of the upper basin of Miyun Reservoir, a typical drinking water source conservation area with important ecological functions helps us to understand of patterns and determinants of habitat changes. We used a combination of habitat quality assessment and statistical analysis models to evaluate spatiotemporal changes in habitat quality at the landscape scale and identify the important forces driving these changes. The objectives of the present study were (1) to quantitatively assess habitat quality in the upper basin of Miyun Reservoir using the spatially explicit habitat quality module of the InVEST model while using data covering 2005 to 2015, and (2) to identify the main forces driving the changes in habitat quality with an improved logistic regression model in the upper basin of this reservoir. This paper overcame the limitations of the analysis of habitat quality change in previous literature by expanding the driving force analysis into an assessment of changes in habitat quality and intuitively evaluated and verified the effectiveness of relevant environmental policies. At the same time, this paper combined the approach of equidistant random sampling and the method of introducing spatial lag variables in the regression equation to provide a new simple and rapid method for solving problems related to spatial autocorrelation. The research results confirmed that ecosystem management policies would have positive effects on improving habitat quality and would play an important role in the effective use of land resources and the protection of ecosystems in the future in this water source area.

2. Study Area

The upper basin of Miyun Reservoir lies northeast of Beijing at 40°24′–41°3′ N, 116°5′–117°30′ E. Middle to low elevation mountains and hilly terrain dominate the river basin and cover about 83.4% of the total area of the watershed. Between 300–700 mm of rain falls annually and this is unevenly distributed in space. Mainly secondary coniferous and broad-leaved mixed forests form a forest vegetation belt in this region and these are interspersed with some areas of grassland. These forests are mainly distributed in area with low levels of human activity in the middle and high elevation mountains. This study area, covering approximately 3452.55 km2, lies in the southeastern part of the upper basin of Miyun Reservoir in the area administered by the city of Beijing, and spans 21 townships in Miyun and Yanqing Counties as well as Huairou District (Figure 1). About 91.7% of the local population in the basin derives an income from agriculture with animal husbandry also providing some income.
Because Miyun Reservoir serves as a source of surface drinking water for Beijing, habitat quality in the drainage plays an important role in the quality of its water supply. A number of ecological restoration projects have been implemented in the upper reaches of Miyun Reservoir to improve environmental conditions. In June 2000, the 20-year Beijing-Tianjin Sandstorm Source Control Project was launched that included returning farmland to forest, grassland management, and ecological migration (human emigration from the area designed to support improvement of ecological conditions across the landscape). In order to control environmental problems such as soil erosion, the policy of returning farmland to forest was implemented in the basin in 2002. From 2009 to 2015, a cooperative project was implemented to improve ecologically-sound water conservation and forestation in Beijing and in Hebei Province including an afforestation project based on an ecologically reasonable forest protection system. The implementation of these projects has greatly improved the environmental conditions of the Miyun Reservoir drainage. Moreover, the rapid expansion of rural land and climate change indicates future pressure will be placed on efforts to maintain and protect habitat quality and biodiversity in the Miyun Reservoir basin. Identifying which biophysical and human factors are important and understanding how they are related to the changes in habitat quality are urgently needed.

3. Methods

The study aimed to assess habitat quality and to explain the relationship between changes in habitat quality and potential forces driving those changes. Changes in habitat quality were considered as habitat transformation at different levels. Desirable habitats would be affected by the forces driving change and would shift from low- to high-grade habitats. For example, the implementation of the project of returning farmland to forest would transform low-quality cultivated land into higher-grade forestland habitats. Taking the upper basin of Miyun Reservoir, which is the source of drinking water, as an example, the authors chose the years from 2005 to 2015 as the study period mainly considering the changes in habitat quality that occurred under the rapid development of the social economy and the implementation of ecologically-related policies. Figure 2 summarizes the overall research process and framework, including data preparation, habitat quality assessment, and the analysis of driving factors.

3.1. Description of the Habitat Quality Model

The Habitat Quality Module in the InVEST model was used to analyze habitat quality of the upper basin of the Miyun watershed in North China. The core of the model is that patterns in biodiversity are inherently spatial, and as such, can be estimated by analyzing land use and land cover maps in conjunction with spatial data related to threats to habitat integrity. The habitat was defined as “the resources and conditions present in an area that produces occupancy—including survival and reproduction—by a given organism [31]. Humans mainly affect habitats through a degree of land degradation caused by the threat source. The threat source in this model was quantified mainly from three aspects: (1) the relative effect of each threat (ωr); (2) the effect of the threat over space (irxy); and (3) the relative sensitivity of each habitat type to each threat (Sjr). The stress level Dxj of the grid x with land use type j was calculated as follows (see InVEST user’s guide for further details on this method):
D x j = r = 1 R y = 1 Y r ( ω r r = 1 R ω r ) r y i r x y θ x S j r
i r x y = 1 ( d x y d r max )   if   linear
i r x y = exp ( ( 2.99 d r max ) d x y )   if   exponential
where y and Yr indicate all grid cells and the set of grid cells on r’s raster map, respectively, θx is the level of accessibility in grid cell x, dxy is the linear distance between grid cells x and y, drmax is the maximum effective distance of threat r’s reach across space, Sjr indicates the sensitivity of land use and land cover (LULC, or habitat type) j to threat r, and ry indicates the effect of threat r that originates in grid cell y.
The quality of each grid’s habitat is determined by its own habitat conditions and the degree of habitat degradation in Equation (1). The results from the model are within the range of 0 to 1, with 1 representing the highest level of habitat quality. Habitat quality was calculated using Equation (4):
Q x j = H j ( 1 ( D x j z D x j z + k z ) )
where k is the half-saturation constant, and Hj is the habitat suitability of LULC type j.
Land use map of the upper basin of Miyun Reservoir were provided by the Data Center for Resources and Environmental Sciences, Chinese Academy of Sciences (http://www.resdc.cn). The land use data included 30 m resolution Landsat TM and Landsat OLI/TIRS interpretation data acquired in 2005 and 2015. Both images were classified into the following land use types: dryland, forestland, shrubland, open forestland, other woodland, river canal, reservoir pond, reservoir beach, rural urbanized land and other urbanized land, as well as high-, medium-, and low-cover grasslands (Figure 1). In this paper, the general biodiversity that includes all species was set the objective of biodiversity conservation. Then we defined dryland, reservoir beach land, rural urbanized land, and other urbanized land as the source of threats to habitats. Reservoir beach land was defined as a threat source because farmers often employed it as cultivated land and other urbanized land. The parameters that need to be defined based on the actual conditions in the upper basin of Miyun Reservoir include: (1) the maximum distance of the threat source on the habitat and (2) the weight of the threat source, (3) the suitability of the habitats, and (4) the sensitivity of the habitats to each threat source. The model parameter values are determined with reference to other research [8,14,15] (Table 1). The habitat suitability was determined according to three following principles. First, the closer habitats are to climax community, the higher the habitat suitability. Second, the more complex the system is, the higher suitability there will be. Third, a purely anthropomorphic environment does not have suitable habitats. It was assumed that high quality habitats are related to the habitats existing in a relatively complex and diverse landscape. Habitat quality scores can not be used to predict the persistence of species in landscape types, but can be interpreted as relative scores to reflect the ability of the ecosystem providing ecological services [12]; the higher the landscape score, the better it is favorable for the given conservation objective. Using the classification method of Yan et al. [14], the habitat quality score was divided into three levels: low (0–0.35), medium (0.35–0.83), and high (0.83–1).

3.2. Improvement of Logistic Multiple Regression Model for Analyzing Driving Forces

This study employed a binary logistic stepwise regression model to quantitatively analyze the driving forces of the evolution of habitats in the upper basin of Miyun Reservoir. Logistic regression models provide results in the form of event probabilities. The model assumes that X = (x1, x2, x3, ..., xn) is a set of variables related to the variable Y reflecting habitat quality change. The dependent variable takes the values 0 and 1, with 0 indicating that the change of habitat quality did not occur and 1 that the habitat quality changed. P is the probability that the habitat quality has changed. Then the corresponding logistic regression model is as follows:
Y = ln ( p 1 p ) = β 0 + β 1 x 1 + β 2 x 2 + , , + β k x k
p = exp ( Y ) 1 + exp ( Y )
where Y is the dependent variable; x 1, x 2, ..., x k are the driving factors that affect the change of the habitat quality: differences in annual average precipitation, annual average temperature, and population, etc.; β0 is the constant of the equation, and β1, β2, …, βk are the partial regression coefficients of the logistic regression, which represent the magnitude of the influence of the independent variable x i on Y.

3.2.1. Dependent Variables

Habitat quality data of the upper basin of Miyun Reservoir in the years 2005 and 2015 were obtained from the InVEST model. Change of habitat quality was defined as the difference between habitat quality in 2015 and that in 2005. The habitat-driven factors for improving habitat quality may be different from the driving factors for reducing habitat quality. Given the assessment results of habitat quality changes, the area of habitat quality improvement and degradation in the study area is relatively small, and it is difficult to obtain sufficient and effective sampling points. Therefore, the difference map between the 2015 habitat evaluation results and the 2005 habitat evaluation results was used to obtain the spatial distribution and quantity of habitat quality changes. This map provided the dependent variable (habitat quality change versus no change) for the regression models.

3.2.2. Independent Variables

Habitat quality in a watershed evolves using a very complex process, which is the result of internal and external driving forces such as natural and human activities. Based on the scientific nature, representativeness, and the availability of data, the driving force index system used in the present study to analyze the evolution of habitat quality was finally determined. The index system was divided into two levels. The first-level indicators include socio-economic, biophysical, and spatial factors (Table 2). Among them, the biophysical indicators included changes in both average temperature and precipitation between 2005 and 2015, as well as soil type, landform, and slope. Soil type and landform are multi-class categorical variables. The dummy variables of elevation were set as low-altitude plains (1), low-altitude hills (2), low-altitude mountains (3), and medium-altitude mountains (4). The dummy variables of soil were set as cinnamon soil (1), yellow loess soil (2), brown soil (3) and lake soil (4). The socioeconomic factors included household population, agricultural population, grain cultivation area, the total output value of both agriculture and forestry, and fiscal revenue. The climatic data included precipitation and temperature data with a spatial resolution of 90 m. Digital data capable of supporting the planned analysis were assembled from various data sources. Climatic, administrative boundary, and terrain dataset were provided by the Data Center for Resources and Environmental Sciences, Chinese Academy of Sciences (http://www.resdc.cn). The socio-economic data were calculated in units of administrative villages, and were collected from the statistics bureaus of Miyun County as well as Huairou and Yanqing districts. The road network was digitized from GoogleEarth and was projected to match the land use data. All data were processed into a 30 m spatial resolution with resampling technology using ArcGIS software. The spatial distance factor was calculated by Euclidean distance. Digitation and spatial analysis were performed with ArcGIS software 10.2 (ESRI, Redlands, CA, USA). Figure 3 shows several important independent variables. Spatial lag variable is a transformation spatial weight of the dependent variable and is commonly used in spatial regression models. In this study, spatial lag variable was included into the logistic regression model to capture spatial effects.

3.2.3. Sampling Design

Two major considerations affected model verification. One was the selection of the number of sampling points. When using logistic regression analysis, the ratio of a number of observations to the number of variables (EPV) has to be considered in order to achieve a desirable model [32,33]. Because of this concern about model stability, the value of EPV in the present study was at least greater than 25. The other consideration was sample point spatial autocorrelation. As mentioned above, the traditional methods of increasing the sampling distance or introducing spatial weights can solve the problem of spatial autocorrelation under certain conditions, but they have common problems that require considerable trial and error. This paper attempted to use a combination of distance control and random sampling; it also introduces spatial lag variables in the regression equation to ensure sufficient and effective sampling points while avoiding residual spatial autocorrelation in conventional logistic regression models. Our method is more suitable for solving the problem of spatial autocorrelation of sampling points in the case of enough sampling size being required for accurately detecting small spatial variations of dependent variables. In this paper, the number of pixels in the change of habitat quality accounted for 7.9% of the entire study area, which is a rather small proportion of the total. The specific approach included two following steps to effectively reduce the effects of space. The first step was a random selection of a sample of 5000 points with the stipulation that they were separated by a distance of at least 300 m. This distance to a certain extent lessened the effects of spatial autocorrelation. The number of sample points that changed was 420. Based on the number of sampling points mentioned earlier, a random re-sampling of 10% of the unchanged sample points was required. This yielded a sample of 842 cells when using our method. The second step was to include a spatial lag variable into the independent variable set. Based on the inverse distance weight method the space weight between the samples was determined, in which the spaced distance used Euclidean distance. Then GeoDa software was used to calculate spatial lag variables.

3.2.4. Regression Model Construction

The driving forces of habitat quality were analyzed based on binary logistic regression using SPSS 20 software. In order to eliminate the effects of dimension, the continuous variable data were standardized. The probability of a variable entering the equation was 0.05, and the probability of deleting it was 0.1. The logistic model’s efficiency to classify cells into habitat quality change and unchanged area was tested using an error matrix in the present study. The error matrix was based on the predicted probabilities using a cutoff value of 0.5. The conditional index was less than 10 and the value of the variance inflation factor was less than 5 as the criterion to determine the multicollinearity of the independent variables. The selected variables entered the logistic model using a forward conditional method [34]. The independence of variables was calculated by Moran’s I index and achieved a value of −0.012 while z value was −0.944 (p = 0.165), which indicated that the sampling point data are independent and satisfy the assumptions of the model. Moran’s I index was implemented in GeoDa software [35]. In the Hosmer–Lemeshow test, the significance level was 0.428 > 0.05, and the statistics were not significant, indicating that the model’s fitting effect was very good. Nagelkerke R2 is always interpreted as the proportion of explained variation [36]. The prediction accuracy of the model was 78.3%, and Nagelkerke R2 was 0.468.

4. Results and Discussion

4.1. Analysis of Changes in Habitat Quality

The evaluation value of habitat quality represents the level of landscape biodiversity. The score of habitat quality ranged from 0 to 1. The smaller the value, the lower the habitat quality. The spatial distribution of habitat quality in 2005 and 2015 was obtained based on the three levels of grading (Figure 4).
The upper basin of Miyun Reservoir generally had high quality habitats, but some local areas had low quality habitats (Figure 4). The low-grade habitats were mainly concentrated in the areas between the reservoir and the mountains in the southeastern part of the watershed where the terrain is relatively flat. These low-grade habitats were also relatively concentrated areas of cultivated and rural residential lands within the entire basin. High quality habitat was mainly concentrated in high-elevation areas and was widely distributed in the basin; most of them had implemented ecological protection policies, such as returning farmland to forest project. The areas with highly variable topography and steep slopes were reforested into forested grasslands. In addition, the vegetation that had many years to recover after reforestation was in better condition, which improved the overall habitat quality in the study area. Despite the increase in high quality habitat area, however, from a spatial point of view, obvious areas of low-grade habitats with degradation conditions still remained during this 10-year study period. This change was largely associated with that the area of reservoirs in 2015 and had been greatly reduced when compared with the extent of this type of area in 2005. In recent years, with a reduction in the amount of precipitation received and with the reservoir serving as a source of drinking water for Beijing, the area of the water held in the reservoirs has been shrinking. The exposed reservoir land had been reused by farmers, resulting in a severe degradation of habitat quality. In addition, the area of rural residential areas also increased to a large extent. In 2015, the spatial extent of rural residential area was 2.11 times that of 2005. The combined effects of climate change and human activities have caused the low concentration of contiguous habitats in the southeastern part of the basin.
The ecosystem in the upper basin of Miyun Reservoir mostly had high quality habitats. Generally, the quality of the habitats and biodiversity of the areas have been increasing in the 10-year study period. This trend could be related to the ecosystem management programs that have been implemented by the government. The Ministry of Forestry began implementing a policy of returning farmland to forest and grasslands in 2000. From 2009 to 2015, a cooperative project supporting the development of the forests designed to provide for ecologically-sound water conservation in the city of Beijing and in Hebei Province included an afforestation project that aims at accelerating the management of the upper basin of Miyun Reservoir as a means of developing a forest protection system. Returning farmland to forests and afforestation had increased the area of high habitat quality within the watershed from 58.22% in 2005 to 60.29% in 2015 (Table 3). Meanwhile, the spatial extent of medium-quality habitats had a decreasing trend from of 101.09 km2 in 10 years, with most of these areas being transformed into high quality habitats. Meanwhile, a slight increase was observed in the spatial extent of low quality habitats.
One can see that the changed habitat quality areas were mainly concentrated on the southeastern part with the most degraded habitats in the basin, while the improvement in habitat quality was scattered elsewhere (Figure 4c). The mountainous area upstream of the reservoir was dominated by grassland and woodland. For it was located in the area of ecological protection management, the quality of habitat has been improved. On the contrary, the reservoir beach land with a relatively flat terrain exhibited a deteriorating trend due to its ease of use. Figure 4 also shows that the floodplain area around the reservoir was the most important area that affected habitat degradation in the watershed. Strengthening the rational control of the use of the reservoir beach land would significantly improve the local trend toward habitat degradation in that area.

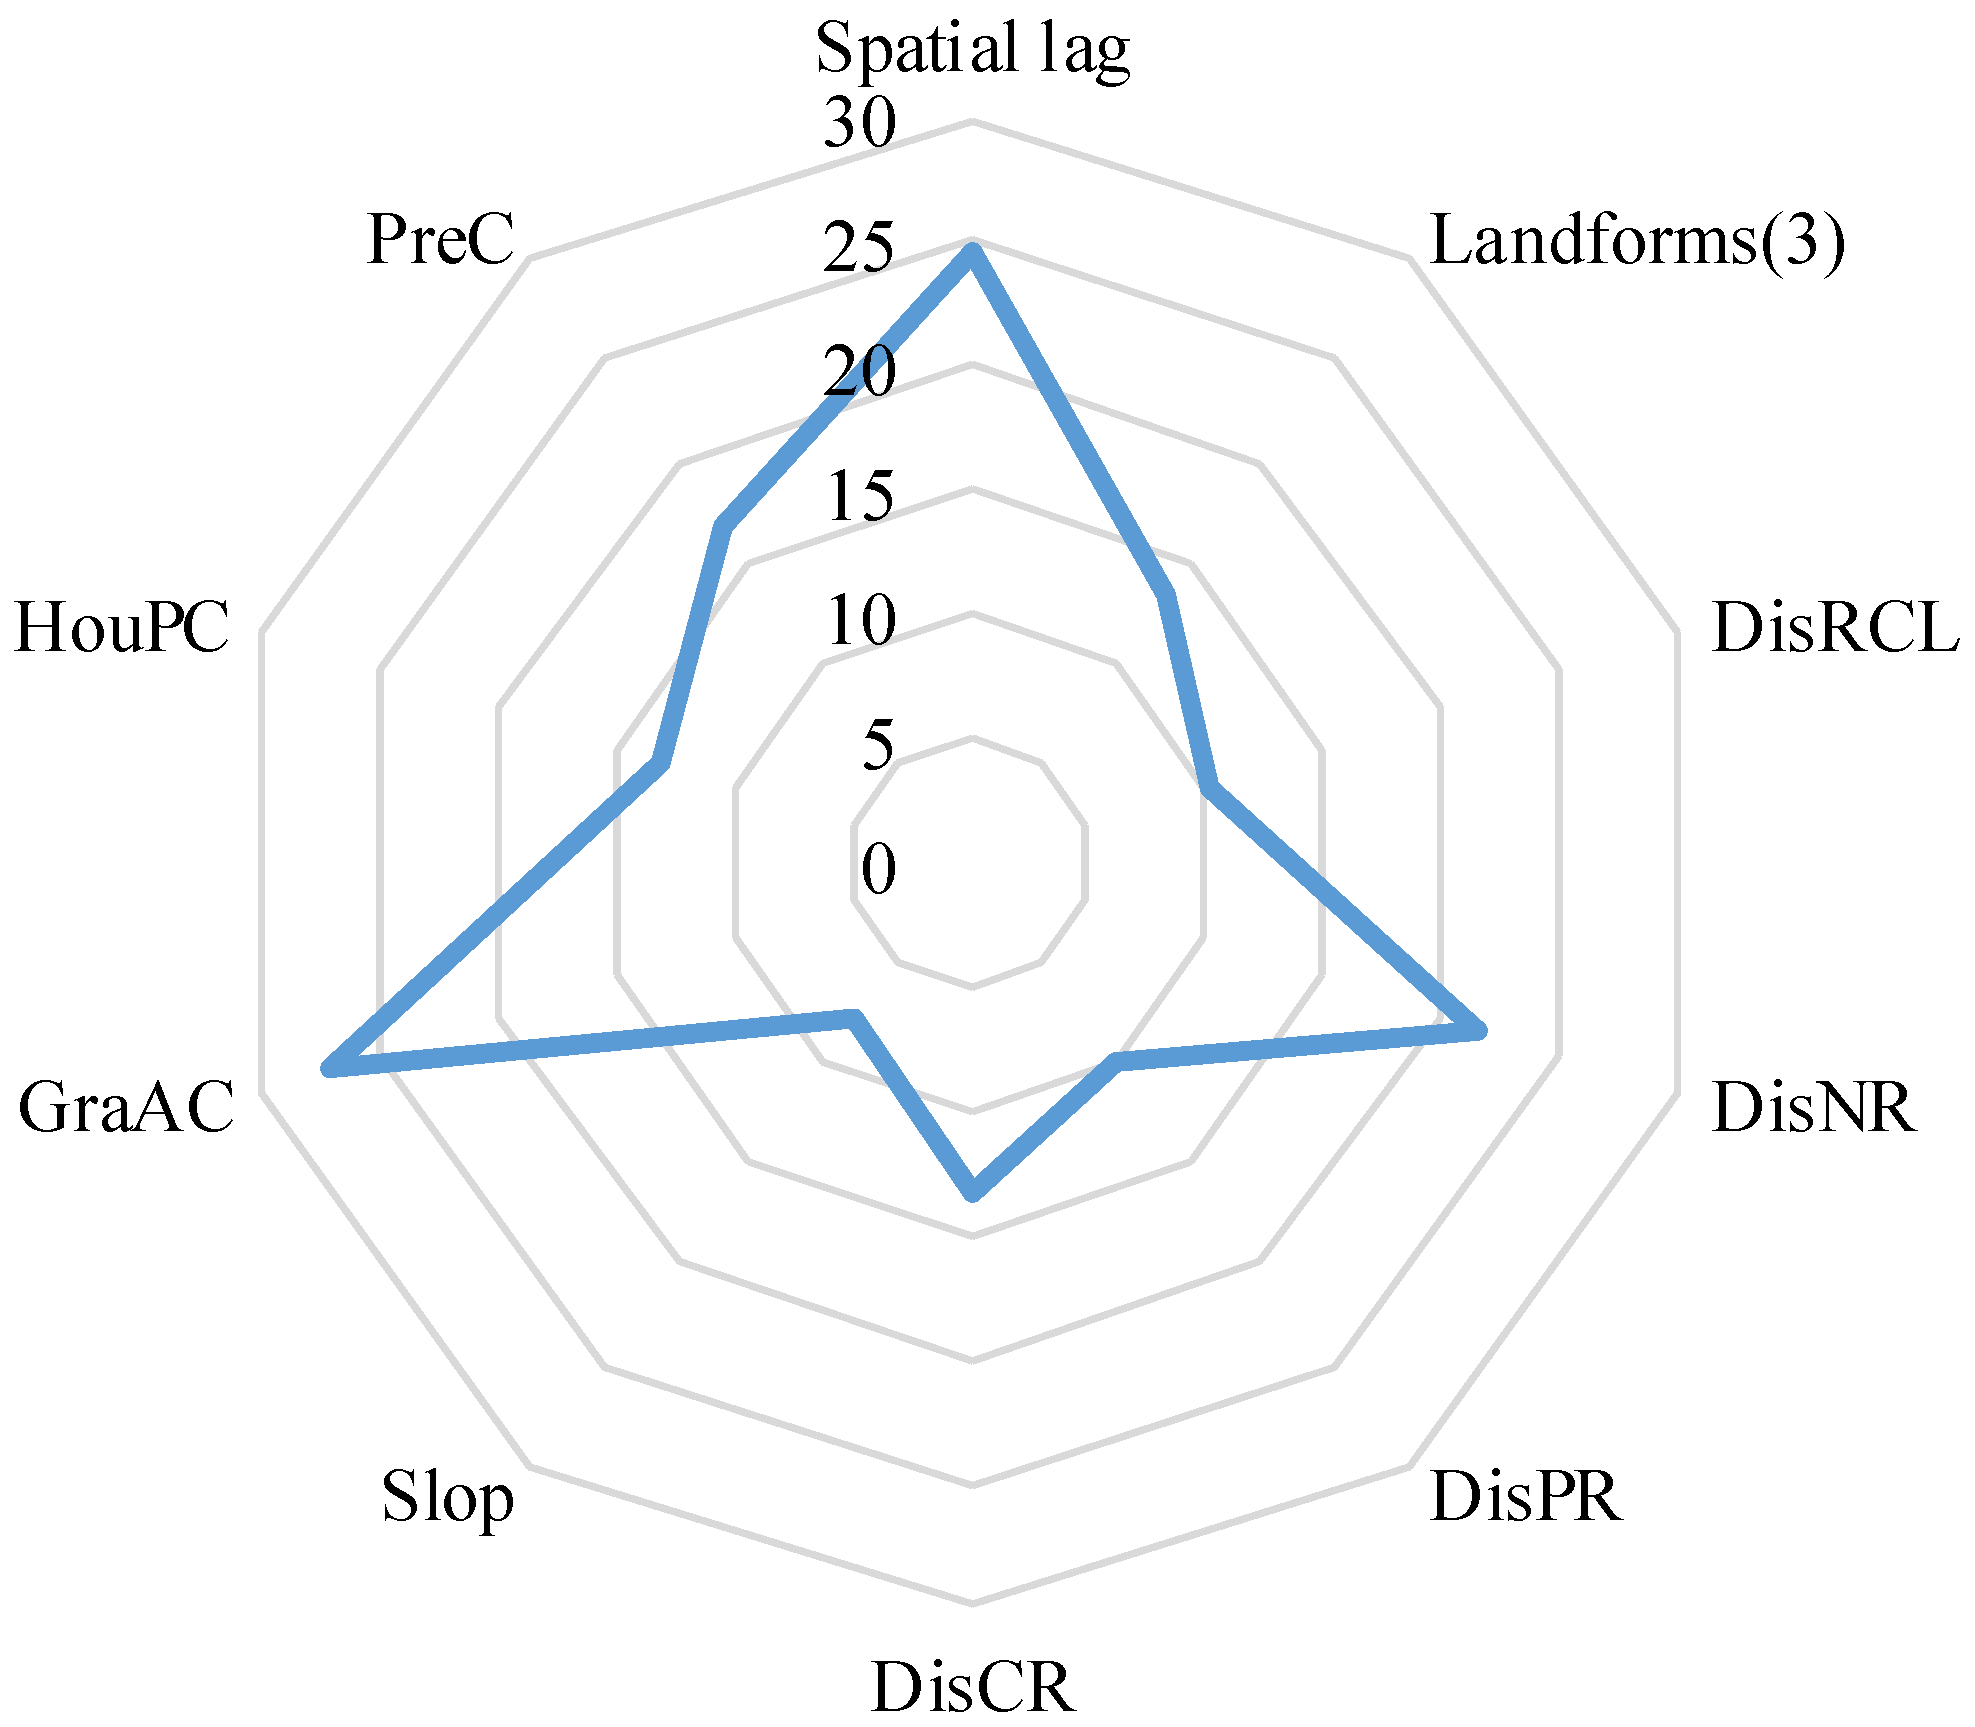
4.2. Analysis of Driving Forces of Changes in Habitat Quality

The overall quality of habitats in the upper basin of Miyun Reservoir showed a slight upward trend between 2005 and 2015. The binary logistic regression showed that several independent variables were significantly correlated with the possibility of habitat quality changes. The statistically significant variables of analytical results for the logistic regression models are presented in Table 4. The B is the model parameter. The Exp(B) is the e-based natural power exponent of the B coefficient, which is an important index to measure the degree of influence of the explanatory variable on the dependent variable, and is the ratio between the frequency of occurrence of the event and the frequency of non-occurrence. From the results of the logistic regression model, one can see that the change in habitat quality was influenced by socio-economic, biophysical, and spatial factors. The grain cultivation area in the upper basin of Miyun Reservoir had the greatest effect on habitat quality, with a Wald χ2 statistic of 26.90 (p < 0.05), followed by the distance to the nearest national road, the change in annual average precipitation, landform, distance to the nearest county road, and change in population, distance to the nearest rural settlements, distance to the nearest provincial road, and slope (Figure 5).
The influence of spatial factors on habitat quality was analyzed, and the results showed that change in habitat quality tends to occur in area relatively close to roads and urbanized rural land. Among them, the distance to the nearest national road was the most important factor in the change of habitat quality, followed by the distance to the nearest rural road (Figure 5). The negative coefficient for all statistically significant distance variables suggested that a relationship exists creating a greater likelihood of change in habitat quality in areas that are relatively close to roads and urbanized rural land. For example, for every 1 unit of normalized value increase in distance from the nearest national road, the probability of change in habitat quality would decrease by 0.521 times (Table 4). The habitat quality is closely linked to the shortest distance to roads and residential areas; that is, if these distances were shorter, the habitat quality would be more likely to be affected.
The effects of socio-economic factors on habitat quality were also analyzed. The results showed that a change in habitat quality was positively correlated with an increase in grain cultivation area and negatively correlated with an increase in household registration population. An increase in the grain cultivation area by 1 unit of normalized value resulted in an increase in the probability of habitat quality change of 2.056 times (Table 4). The statistically significant relationship of habitat quality and grain area representing the intensity of agricultural activities showed that agricultural activities had an adverse effect on ecosystem diversity. The amount of agricultural lands directly affected the quantity and quality of habitats. It can be seen that the areas with degraded habitats mostly occurred in areas where the area of grain cultivation increased, while habitat quality mostly improved in areas where the area of grain cultivation was reduced (Figure 3a). The increase in agricultural land leads to the degradation of the quality of the habitat, while also increasing the water safety risk of the water source due to increased water pollution and competition between agricultural water and drinking water [5]. The variable designated as the change of household registration population had an Exp (B) equal to 0.667 (Table 4); this indicated that as the population increased, the probability of habitat quality changes tended to decrease. Analysis of population data showed that positive changes in habitat quality were concentrated in areas where the population decreased, while habitat quality declined in areas where the population increased slightly (Figure 3b). This result was similar with that of Newman [3] who found that population density was negatively correlated with the probabilities of deforestation.
The influence of biophysical factors on the possibility of a change in habitat quality was analyzed. The results showed that habitat quality was more likely to change in areas with bigger interannual precipitation changes, lower elevation, and relatively gentler slope. The difference in annual precipitation was statistically significant, and was positively correlated with the possibility of a change in habitat quality. The Wald χ2 statistic was 16.80 (p < 0.05). A great increase or decrease in precipitation resulted in an obvious improvement (Figure 3c) or degradation of habitat quality, respectively. This may be related to the fact that the uneven spatial distribution of precipitation caused the habitats in the northern part of the basin with increasing precipitation to increase gradually, while the lack of adequate precipitation in the southern part of the basin caused the areas of the reservoir to shrink and the habitats to deteriorate. However, we also noticed that the change in annual average temperature did not pass the significance test of the equation. This was probably because the annual average temperature varied little, the effect of temperature on overall habitat quality was weakened. In terms of landform variables, changes in habitat quality were more likely to occur in low- than in mid-elevation mountainous regions. Slope also had a significant negative effect on habitat quality (Figure 3d). There biophysical factors analysis results confirm those found in a China study conducted by Li [35] who reported that precipitation and topography were the fundamental determinants of the spatial expansion of urban land. In general, distances that were relatively close to national or rural roads, as well as to rural residential sites, and municipal roads, with gentler slope, and the more of the landform was located in low-elevation mountainous areas, the bigger the possibility of changes in habitat quality.
Despite complexities in understanding the processes affecting habitat quality, it is critical to recognize any degradation occurring in important areas when developing ecosystem conservation and management policies. In this research, habitat quality was shown to have improved in this 10-year interval, and the corresponding trends for Beijing were identified for the period from 2000 to 2010 [37,38]. The implementation of the policy of returning farmland to forest has had a significant effect on improving the ecosystem of the study area. This was also revealed by Liu et al. [39], who analyzed the ecological and socioeconomic effects of returning farmland to forest, that the overall ecological effects of this program were beneficial, and socioeconomic effects were mostly positive. The area where habitat quality is degraded mainly occurs in the relatively flat area upstream of the reservoir due to the expansion of rural construction land and the increase of agricultural land. These results agree with the conclusion that rural construction land together with agricultural land was identified as major threats causing habitat loss for species [15,40]. Habitat degradation has a significant negative impact on freshwater ecosystems in water sources. The degradation of habitat quality due to the expansion of agricultural land increases the amount of sediment and nutrients entering the reservoir [40]. In addition, water used to support agricultural systems can reduce water storage and riparian habitat [41]. Similarly, habitat degradation due to increased rural construction land can lead to river pollution and thus reduce biodiversity [42].
Although the total number of habitat areas didn’t change much, there are still 7.9% of the regions that change each other. Therefore, we used logistic regression models to analyze the driving factors for changes in habitat quality. This paper combined the approach of equidistant random sampling and the method of introducing spatial lag variables in the logistic regression equation that considered the spatial residual autocorrelation. By using this method, Moran’s I index value was −0.012 while z value was −0.944 (p = 0.165 > 0.05), which indicates that the method was reasonable and effective. The present study showed the importance of the effects of climatic conditions on determining local changes in habitat quality. Changes in precipitation had a statistically significant effect on the change in habitat quality. A finding in support with this conclusion was made by Aide et al. [24] who found that climatic conditions have an important effect on the success or failure of reforestation efforts. The importance of regional climatic conditions in mid-scale changes in habitat quality should also not be ignored. As demonstrated in the present study, a future change in habitat quality would not only likely be restricted by climatic conditions but also likely depend on socio-economic factors. Nature characteristics of climate, landform, and slope, as relatively stable endogenous driving factors, all helped to determine the spatial distribution of habitats. Meanwhile, social and economic activities, as manageable external driving factors, tend to induce a degradation of habitat quality. For example, the logistic regression results confirm that road construction and unlimited rural land sprawl would be expected to have a significant negative effect on nearby habitats. These analytical results agree with those researchers [3,8,15] who demonstrated socio-economic factors, climatic and demographic factors were important drivers of land use change. In order to further improve the habitat quality of Miyun watershed, an effective way is to establish restricted development zones through environmental protection policies, especially in relatively flat areas around the reservoir.
Despite the advantages of InVEST model in determining habitat quality, the results of this research inevitably contained errors and uncertainties. For example, when the habitat quality was evaluated, the sensitivity of the habitat type to the threat source and the impact distance of the threat source were determined based on expert knowledge, and subjective judgment was inevitable. Therefore, more accurate data needs to be determined based on further actual surveys of specific watershed characteristics. A change of habitat quality is a complex process, and the accuracy of the model for analyzing its driving forces is often hampered by model and data problems. The accuracy of the model simulation results in the present study was 78.30%, indicating that the model construction process was still not perfect. Some variables could not be collected or quantified. For instance, the implementation of the policy in the Miyun basin played a significant role in the protection of the ecosystem, but it could not be directly represented by the spatial quantification of policy factors. Further research will be needed to show that habitat quality was reflected by the responses of specific species. This would play a more specific role in guiding the promotion and management of ecosystem diversity in the region. In addition, time scale was an important factor that should be considered when analyzing the driving forces. In different time spans, the variation of the independent variable itself was inconsistent.

5. Conclusions

Effective ecosystem management will require an understanding of how habitat quality is changing over space and time and of the driving forces of habitat quality change. The present study developed an analysis using an effective framework that combined habitat quality assessment and an analysis of the underlying driving forces. Using the characteristics of the Miyun watershed, the InVEST model was employed to evaluate the quality of habitats within the basin. From the socio-economic, biophysical, and spatial conditions, an index system for the driving forces of changes in habitat quality was constructed, and logistic regression models were used to reveal the driving forces that changed habitat quality between 2005 and 2015. When applying the logistic regression model for an analysis of those driving forces, spatial autocorrelation of sampled data is a problem that cannot be ignored. Based on previous research, this paper combined the equidistant random sampling method and the method of introducing spatial lag variables in logistic regression equation and this method had proven to be a rapid, simple, and reasonable method that avoided spatial autocorrelation. This research aimed to improve our understanding of the process of change in habitat quality by integrating the use of InVEST and logistical regression models in a watershed with intensive human activity.
The present study found that most of the habitats of the upper basin of Miyun Reservoir were of high quality. During the 10-year study, the overall habitat quality of the upper basin of the Reservoir had improved continuously, and the quantity of high-grade Miyun habitat had increased from 58.22% to 60.29%. Low-grade habitats also generally showed a slight increase from 14.29% to 15.15%. The habitat quality had benefited largely from the implementation of ecosystem management policies, such as returning farmland to forest. However, from a spatial point of view, local habitats had degraded significantly in some areas. The areas of local habitat degradation were mainly concentrated in the southeastern part of the basin and were associated with the reuse and development of reservoir beach area by farmers in the watershed.
The analysis of driving forces showed that lower elevation mountain land, gentler slopes, locations near rural land, locations close to roads, larger areas of grain cultivation, and fewer changes in population size had an increased likelihood of habitat quality conversion in the upper basin of Miyun Reservoir. This information played important roles in explaining the changes in habitat quality. In recent years, drastic changes in local climatic conditions have made it impossible to ignore climate change in the protection of this ecosystem. This research recommended that based on the adaptation of habitats to natural conditions, much more attention should be paid to the plans for future socio-economic activities in ecosystem management.

Author Contributions

Data curation, R.Y.; Methodology, S.Y., X.W., Y.C. and G.C.; Project administration, Z.Y.; Supervision, C.L.; Validation, X.W. and Y.C.; Writing—original draft, S.Y.; Writing—review & editing, X.W., C.L. and Z.Y.

Funding

This research was financially supported by National Natural Science Foundation of China (Grant No. 51439001, 51679008, 51721093), and the Chinese National key research and development program (Grant No. 2017YFC0404505, 2016YFC0401302).

Acknowledgments

The author would like to thank all participants who took time to complete the survey. Their support was fundamental for this study. The Author would also like to thank the editor and the anonymous referees for their critical feedback and valuable suggestions.

Conflicts of Interest

The author declares no conflict of interest.

References

  1. Baral, H.; Keenan, R.J.; Sharma, S.K.; Stork, N.E.; Kasel, S. Spatial assessment and mapping of biodiversity and conservation priorities in a heavily modified and fragmented production landscape in north-central Victoria, Australia. Ecol. Indic. 2014, 36, 552–562. [Google Scholar] [CrossRef]
  2. Gill, R.J.; Baldock, K.C.R.; Brown, M.J.F.; Cresswell, J.E.; Dicks, L.V.; Fountain, M.T.; Garratt, M.P.D.; Gough, L.A.; Heard, M.S.; Holland, J.M.; et al. Protecting an Ecosystem Service: Approaches to Understanding and Mitigating Threats to Wild Insect Pollinators. In Ecosystem Services: From Biodiversity to Society, Pt 2; Woodward, G., Bohan, D.A., Eds.; Elsevier Academic Press Inc.: San Diego, CA, USA, 2016; Volume 54, pp. 135–206. [Google Scholar]
  3. Newman, M.E.; McLaren, K.P.; Wilson, B.S. Long-term socio-economic and spatial pattern drivers of land cover change in a Caribbean tropical moist forest, the Cockpit Country, Jamaica. Agric. Ecosyst. Environ. 2014, 186, 185–200. [Google Scholar] [CrossRef]
  4. Roy, P.S.; Tomar, S. Biodiversity characterization at landscape level using geospatial modelling technique. Biol. Conserv. 2000, 95, 95–109. [Google Scholar] [CrossRef]
  5. Serra, P.; Pons, X.; Saurí, D. Land-cover and land-use change in a Mediterranean landscape: A spatial analysis of driving forces integrating biophysical and human factors. Appl. Geogr. 2008, 28, 189–209. [Google Scholar] [CrossRef]
  6. Brook, B.W.; Sodhi, N.S.; Bradshaw, C.J. Synergies among extinction drivers under global change. Trends Ecol. Evol. 2008, 23, 453–460. [Google Scholar] [CrossRef] [PubMed]
  7. Torres, R.; Gasparri, N.I.; Blendinger, P.G.; Grau, H.R. Land-use and land-cover effects on regional biodiversity distribution in a subtropical dry forest: A hierarchical integrative multi-taxa study. Reg. Environ. Chang. 2014, 14, 1549–1561. [Google Scholar] [CrossRef]
  8. Wu, C.-F.; Lin, Y.-P.; Chiang, L.-C.; Huang, T. Assessing highway’s impacts on landscape patterns and ecosystem services: A case study in Puli Township, Taiwan. Landsc. Urban Plan. 2014, 128, 60–71. [Google Scholar] [CrossRef]
  9. Fu, B.; Wang, S.; Su, C.; Forsius, M. Linking ecosystem processes and ecosystem services. Curr. Opin. Environ. Sustain. 2013, 5, 4–10. [Google Scholar] [CrossRef]
  10. Ding, Y.; Shan, B.; Zhao, Y. Assessment of River Habitat Quality in the Hai River Basin, Northern China. Int. J. Environ. Res. Public Health 2015, 12, 11699–11717. [Google Scholar] [CrossRef] [Green Version]
  11. Dong, Z.; Wang, Z.; Liu, D.; Li, L.; Ren, C.; Tang, X.; Jia, M.; Liu, C. Assessment of habitat suitability for waterbirds in the West Songnen Plain, China, using remote sensing and GIS. Ecol. Eng. 2013, 55, 94–100. [Google Scholar] [CrossRef]
  12. Polasky, S.; Nelson, E.; Pennington, D.; Johnson, K.A. The Impact of Land-Use Change on Ecosystem Services, Biodiversity and Returns to Landowners: A Case Study in the State of Minnesota. Environ. Resour. Econ. 2011, 48, 219–242. [Google Scholar] [CrossRef]
  13. Seoane, J.; Justribó, J.H.; García, F.; Retamar, J.; Rabadán, C.; Atienza, J.C. Habitat-suitability modelling to assess the effects of land-use changes on Dupont’s lark Chersophilus duponti: A case study in the Layna Important Bird Area. Biol. Conserv. 2006, 128, 241–252. [Google Scholar] [CrossRef] [Green Version]
  14. Yan, S.; Wang, X.; Cai, Y.; Li, C.; Yang, Z.; Yi, Y. Investigation of the spatio-temporal dynamics in landscape variations in a shallow lake based on a new Tendency-Pattern-Service conceptual framework. J. Clean. Prod. 2017, 161, 1074–1084. [Google Scholar] [CrossRef]
  15. Terrado, M.; Sabater, S.; Chaplin-Kramer, B.; Mandle, L.; Ziv, G.; Acuna, V. Model development for the assessment of terrestrial and aquatic habitat quality in conservation planning. Sci. Total Environ. 2016, 540, 63–70. [Google Scholar] [CrossRef] [PubMed] [Green Version]
  16. Tulloch, V.J.; Tulloch, A.I.; Visconti, P.; Halpern, B.S.; Watson, J.E.; Evans, M.C.; Auerbach, N.A.; Barnes, M.; Beger, M.; Chadès, I. Why do we map threats? Linking threat mapping with actions to make better conservation decisions. Front. Ecol. Environ. 2015, 13, 91–99. [Google Scholar] [CrossRef] [Green Version]
  17. Schmitt-Harsh, M. Landscape change in Guatemala: Driving forces of forest and coffee agroforest expansion and contraction from 1990 to 2010. Appl. Geogr. 2013, 40, 40–50. [Google Scholar] [CrossRef]
  18. Teferi, E.; Bewket, W.; Uhlenbrook, S.; Wenninger, J. Understanding recent land use and land cover dynamics in the source region of the Upper Blue Nile, Ethiopia: Spatially explicit statistical modeling of systematic transitions. Agric. Ecosyst. Environ. 2013, 165, 98–117. [Google Scholar] [CrossRef]
  19. Verburg, P.H.; Schot, P.P.; Dijst, M.J.; Veldkamp, A. Land use change modelling: Current practice and research priorities. GeoJournal 2004, 61, 309–324. [Google Scholar] [CrossRef]
  20. Zhou, N.; Hubacek, K.; Roberts, M. Analysis of spatial patterns of urban growth across South Asia using DMSP-OLS nighttime lights data. Appl. Geogr. 2015, 63, 292–303. [Google Scholar] [CrossRef]
  21. Hersperger, A.M.; Bürgi, M. Going beyond landscape change description: Quantifying the importance of driving forces of landscape change in a Central Europe case study. Land Use Policy 2009, 26, 640–648. [Google Scholar] [CrossRef]
  22. Pineda Jaimes, N.B.; Bosque Sendra, J.; Gómez Delgado, M.; Franco Plata, R. Exploring the driving forces behind deforestation in the state of Mexico (Mexico) using geographically weighted regression. Appl. Geogr. 2010, 30, 576–591. [Google Scholar] [CrossRef]
  23. Rudel, T.K. Tree farms: Driving forces and regional patterns in the global expansion of forest plantations. Land Use Policy 2009, 26, 545–550. [Google Scholar] [CrossRef]
  24. Aide, T.M.; Clark, M.L.; Grau, H.R.; Lopez-Carr, D.; Levy, M.A.; Redo, D.; Bonilla-Moheno, M.; Riner, G.; Andrade-Nunez, M.J.; Muniz, M. Deforestation and Reforestation of Latin America and the Caribbean (2001–2010). Biotropica 2013, 45, 262–271. [Google Scholar] [CrossRef]
  25. Augustin, N.H.; Mugglestone, M.A.; Buckland, S.T. An Autologistic Model for the Spatial Distribution of Wildlife. J. Appl. Ecol. 1996, 33, 339–347. [Google Scholar] [CrossRef]
  26. Bo, Y.-C.; Song, C.; Wang, J.-F.; Li, X.-W. Using an autologistic regression model to identify spatial risk factors and spatial risk patterns of hand, foot and mouth disease (HFMD) in Mainland China. BMC Public Health 2014, 14, 358. [Google Scholar] [CrossRef] [PubMed]
  27. Echeverria, C.; Coomes, D.A.; Hall, M.; Newton, A.C. Spatially explicit models to analyze forest loss and fragmentation between 1976 and 2020 in southern Chile. Ecol. Model. 2008, 212, 439–449. [Google Scholar] [CrossRef]
  28. Hu, Z.; Lo, C.P. Modeling urban growth in Atlanta using logistic regression. Comput. Environ. Urban Syst. 2007, 31, 667–688. [Google Scholar] [CrossRef]
  29. Monteiro, A.T.; Fava, F.; Hiltbrunner, E.; Della Marianna, G.; Bocchi, S. Assessment of land cover changes and spatial drivers behind loss of permanent meadows in the lowlands of Italian Alps. Landsc. Urban Plan. 2011, 100, 287–294. [Google Scholar] [CrossRef]
  30. Wijaya, S.; Tsuyuki, S. GIS-based modeling of Javan Hawk-Eagle distribution using logistic and autologistic regression models. Biol. Conserv. 2008, 141, 756–769. [Google Scholar]
  31. Hall, L.S.; Krausman, P.R.; Morrison, M.L. The habitat concept and a plea for standard terminology. Wildl. Soc. Bull. 1997, 25, 173–182. [Google Scholar]
  32. Courvoisier, D.S.; Combescure, C.; Agoritsas, T.; Gayet-Ageron, A.; Perneger, T.V. Performance of logistic regression modeling: Beyond the number of events per variable, the role of data structure. J. Clin. Epidemiol. 2011, 64, 993–1000. [Google Scholar] [CrossRef] [PubMed]
  33. Steyerberg, E.W.; Schemper, M.; Harrell, F.E. Logistic regression modeling and the number of events per variable: Selection bias dominates. J. Clin. Epidemiol. 2011, 64, 1464–1465. [Google Scholar] [CrossRef] [PubMed]
  34. Olaniyi, A.O.; Abdullah, A.M.; Ramli, M.F.; Alias, M.S. Assessment of drivers of coastal land use change in Malaysia. Ocean Coast. Manag. 2012, 67, 113–123. [Google Scholar] [CrossRef]
  35. Li, X.; Zhou, W.; Ouyang, Z. Forty years of urban expansion in Beijing: What is the relative importance of physical, socioeconomic, and neighborhood factors? Appl. Geogr. 2013, 38, 1–10. [Google Scholar] [CrossRef] [Green Version]
  36. Betts, M.G.; Diamond, A.W.; Forbes, G.J.; Villard, M.A.; Gunn, J.S. The importance of spatial autocorrelation, extent and resolution in predicting forest bird occurrence. Ecol. Model. 2006, 191, 197–224. [Google Scholar] [CrossRef] [Green Version]
  37. Chen, Y.; Qiao, F.; Jiang, L. Effects of Land Use Pattern Change on Regional Scale Habitat Quality Based on InVEST Modela Case Study in Beijing. Acta Sci. Nat. Univ. Pekin. 2016, 52, 553–562. [Google Scholar]
  38. Wu, J.; Cao, Q.; Shi, S.; Huang, X.; Lu, Z. Spatio-temporal variability of habitat quality in beijing-tianjin-hebei area based on land use change. Ying Yong Sheng Tai Xue Bao (J. Appl. Ecol.) 2015, 26, 3457–3466. [Google Scholar]
  39. Liu, J.; Li, S.; Ouyang, Z.; Tam, C.; Chen, X. Ecological and socioeconomic effects of China’s policies for ecosystem services. Proc. Natl. Acad. Sci. USA 2008, 105, 9477–9482. [Google Scholar] [CrossRef]
  40. Martinuzzi, S.; Januchowski-Hartley, S.R.; Pracheil, B.M.; McIntyre, P.B.; Plantinga, A.J.; Lewis, D.J.; Radeloff, V.C. Threats and opportunities for freshwater conservation under future land use change scenarios in the United States. Glob. Chang. Biol. 2014, 20, 113–124. [Google Scholar] [CrossRef]
  41. Scanlon, B.R.; Jolly, I.; Sophocleous, M.; Zhang, L. Global impacts of conversions from natural to agricultural ecosystems on water resources: Quantity versus quality. Water Resour. Res. 2007, 43. [Google Scholar] [CrossRef] [Green Version]
  42. King, R.S.; Baker, M.E.; Kazyak, P.F.; Weller, D.E. How novel is too novel? Stream community thresholds at exceptionally low levels of catchment urbanization. Ecol. Appl. 2011, 21, 1659–1678. [Google Scholar] [CrossRef] [PubMed] [Green Version]
Figure 1. Study area and land use change in the upper basin of Miyun Reservoir within Beijing administrative area from 2005 to 2015 (Source: http://www.resdc.cn).
Sustainability 10 04625 g001
Figure 2. Overall research process and framework.
Sustainability 10 04625 g002
Figure 3. Several important independent variables: spatial changes in (a) grain cultivation area, (b) household registration population and (c) annual precipitation from 2005–2015; (d) slope in the upper basin of Miyun Reservoir.
Sustainability 10 04625 g003
Figure 4. Habitat quality of the upper basin of Miyun Reservoir (a) in 2005, (b) in 2015, and (c) changes between 2005 and 2015.
Sustainability 10 04625 g004
Figure 5. The statistical significance of variables affecting the habitat quality in the upper basin of Miyun Reservoir. Note: The variable names in Figure 5 are the same as those in Table 2.
Sustainability 10 04625 g005
Table 1. Characteristic of threats to habitat quality and the relative sensitivity of habitat to threats considered in Miyun reservoir.
Max.dis
(km)
WeightSensitivity of Habitat to Threats
FLSLOFOWRPRBHGMGLG
Dryland40.80.70.60.50.40.70.80.60.50.4
Rural urbanized land510.80.70.60.50.80.70.70.60.5
Other urbanized land50.80.70.60.50.50.80.70.60.50.4
National road310.80.70.60.40.30.60.50.40.3
Provincial road20.70.70.60.50.30.20.50.40.30.2
Country road10.50.60.50.40.20.10.40.30.20.1
Note: Max.dis is the maximum impact distance of the threat source on the habitat; FL is forestland; SL is shrubland; OF is open forestland; OW is other woodland; RP is reservoir pond; RB is reservoir beach; HG is high- cover grasslands; MG is medium- cover grasslands, and LG is low-cover grasslands.
Table 2. Covariate and dependent variables in the binary logistic regression.
VariableDescriptionTypeUnit
Spatial lagSpatial lag variableContinuous-
Biophysical variables
PreCAnnual precipitation change (between 2005 and 2015)Continuous1 × 10−1 mm
TepCAverage temperature change (between 2005 and 2015)Continuous1 × 10−1 °C
SlopeSlope of surfaceContinuousDegree
SoilSoil typeCategorical1–4
LandformsTopography and landformsCategorical1–4
Socio-economic variables
FisCChange in fiscal revenueContinuous1 × 104 CNY
AgrCChange in agricultural populationContinuousPerson
HouPCChange in household registration populationContinuousPerson
GraACChange in grain production areaContinuousHa
AgrOVCChange in total agricultural output valueContinuous1 × 104 CNY
Spatial variables
DisRDistance to the reservoirContinuousm
DisRCLDistance to rural urbanized landContinuousm
DisNRDistance to nearest national roadContinuousm
DisPRDistance to nearest provincial roadContinuousm
DisCRDistance to nearest country roadContinuousm
Table 3. Statistical information on habitat quality in the upper basin of Miyun Reservoir.
Habitat Quality20052015Variation
Area (km2)PercentArea (km2)PercentArea (km2)Percent
High2010.1558.22%2081.6160.29%71.462.07%
Medium948.9927.49%847.924.56%−101.09−2.93%
Low493.4114.29%523.0415.15%29.630.86%
Table 4. Model estimation of the driving forces of changes in habitat quality in the upper basin of Miyun Reservoir (2005–2015).
VariableBS.E.dfSig.Exp (B)
Spatial lag1.1110.22410.0003.037
Landforms--40.008-
Landforms(1)−0.3830.24710.1210.682
Landforms(2)−0.4880.49310.3220.614
Landforms(3)−1.1620.31810.0000.313
DisRCL−0.3100.09810.0010.733
DisNR−0.6530.14110.0000.521
DisPR−0.3930.12410.0020.675
DisCR−0.3800.10410.0000.684
Slop−0.2780.10010.0050.757
GraAC0.7210.13910.0002.056
HouPC−0.3910.10810.0000.677
PreC0.6060.14810.0001.834
Constant0.3390.18310.0641.403
Note: The variable names in Table 4 are the same as those in Table 2.

