Case Report

Rapid Increase and Long-Term Slow Decrease in Soil C stock Due to Agricultural Development in Hokkaido Tokachi District

1
Hokkaido Agricultural Research Center, National Agriculture and Food Research Organization, Memuro Research Station (NARO/HARC/M), Shinsei, Memuro, Kasai, Hokkaido 082-0081, Japan
2
Ministry of Agriculture, Forestry and Fisheries, (MAFF), Chiyoda-ku, Tokyo 100-8950, Japan
3
Zukosha, Obihiro, Hokkaido 080-0048, Japan
*
Author to whom correspondence should be addressed.
Sustainability 2018, 10(12), 4587; https://doi.org/10.3390/su10124587
Submission received: 9 November 2018 / Revised: 30 November 2018 / Accepted: 30 November 2018 / Published: 4 December 2018

Abstract

:
Soil properties and functions are dramatically altered by changes in agricultural land use. However, little is known about how ecosystem C stock and its partitioning change with deforestation for agricultural land use, especially in cold humid areas. In this study, we investigated how agricultural development influences temporal changes in soil C pools in upland crop fields using a paired-plot approach. Ten pairs of control forest and agricultural development plots (2 to more than 80 years) were selected with the same crop rotation under humid temperate climate in Northeast Japan. We detected a net gain in soil C during the first 2 years of agricultural land development under the flat field condition. This gain in soil C was caused by an increase in the light fraction soil C, which represents plant residue derived-C due to agricultural development. Agricultural development resulted in the loss of soil C in fields without manure application. There was no difference in the ecosystem C stock among soil types or with the amount of manure applied. Agricultural development resulted in a slow decrease in soil C storage, indicating a slow rate of C decomposition under cool climate conditions.

1. Introduction

Land use change is the second largest contributor of C emission after fossil fuels [1]. Conversion of natural forests to agricultural land leads to significant changes in soil processes and properties and therefore changes in soil C. Agricultural land use depletes the organic C content compared with that of soils under natural vegetation, because tillage practices during cultivation enhance the decomposition of organic matter due to soil aerobic processes and soil aggregate destruction [2,3]. Moreover, the loss of C via crop harvest also reduces organic C content in cropland compared with that in other land uses such as forest. Several studies have showed that the conversion of forest to cropland reduces soil organic carbon (OC) stock. A global meta-analysis has showed that land use change from native forest to agricultural development reduced 42% of soil C [4]. Studies have also reported that the soil C content decreased by 25%–50% of the soil C stock [4,5,6]; 70% in Ethiopia [7] and 78% in the Philippines [8]. These estimates of the total C emissions might be uncertain because most studies depend on summing a robust data set [9]. Moreover, conclusive evidence regarding regional changes in C storage after land use change is limited.
Differences in land use might be attributed to differences in the mean annual temperature or precipitation, and both can significantly influence C mineralization. Previous studies have mostly focused on agricultural development in relatively low productivity regions due to water shortage and/or low soil fertility in different parts of the world [7]. Little is known about how ecosystem C stock and its partitioning change with deforestation for agricultural land use under cold humid climate. In Tokachi District in Northeast Japan, cool-season crops such as wheat and potatoes are grown during summer, under relatively cool climate. The production of wheat and potatoes in Tokachi District accounts for more than one fourth of the total annual production in Japan [10,11]. In the late 19th century, forests covered most of the area in Tokachi District, and with the commencement of colonization they were developed for agriculture. Later during the 1960’s, policies and farmers replaced the original remnant oak (Quercus dentata) forest with larch (Larix kaempferi) coniferous forests for use as windbreak forests [12]. Improvement in crop management enhanced crop productivity and farmers’ income in the region; therefore, a part of windbreak forest is currently replaced by farmland for large-scale and high-profitable farming. Reduction in cropland is a global issue. Recent studies have mostly focused on soil C change with land use change to abandoned land [13,14]. However, cropland area is gradually increasing in Hokkaido Tokachi District (from 253,710 to 254,520 ha from 2007 to 2017; [15]), providing an opportunity to investigate the change in soil C due to regional agricultural development under current climate condition.
The aims of this study was to determine the changes in C due to deforestation for agricultural land use during cultivation in cold humid area. We hypothesized that (1) agricultural development continuously reduces ecosystem C stock via rapid aerobic decomposition of original soil C and (2) later enhances C storage due to continuous manure application and crop residue input. We used the light fraction (LF) soil C as an indicator of soil quality, as it is mainly composed of partially decomposed fragments of plant residue that are not associated with mineral particles [16]. The LF soils highlight the increase in initial plant residue-associated C content upon agricultural development. To test these hypotheses, we used the paired-plot approach, in which one of the paired plots represented the initial conditions. The paired-plot approach enables faster assessment at different time spans since agricultural development and in different soil types.

2. Materials and Methods

2.1. Site Description and Experimental Design

The study was conducted in Tokachi District, which is currently the major upland agricultural band in Japan. The mean annual temperature and rainfall are 6.1 °C and 888 mm, respectively, at the Memuro Experiment Station (42°53′ N, 143°05′ E), which is at the center of Tokachi District [17]. Historical records show that most croplands were established during the past 100 y in Shikaoi, Nakasatsunai, Sarabetu, and northern and southern parts of Tokachi District. The Hokkaido Government had installed pipe drains in areas with poor soil drainage from 1970 to 2002 [18]. To avoid sites that experienced extreme changes in soil water flow, we investigated sites without the pipe drains. The cropping system studied is mainly a 4-year crop rotation system typical to Tokachi District, producing potatoes (Solanum tuberosum L.), winter wheat (Triticum aestivum L.), sugar beets (Beta vulgaris L. subsp. vulgaris), and beans such as soybeans (Glycine max (L.) Merr.) in rotation.
The 10 paired sites in seven areas including agricultural field and abandoned plots are located in Hokkaido, Northern Japan (Table 1). The active agricultural fields were conventionally cultivated for 2 to more than 80 years. The soil (FAO/UNESCO) is Andosol at 4 sites and Eutric Fluvisol at 3 sites. The studied regions are affected by volcanic tephra, and the soil parent material is largely alluvium and the materials transported by rivers and streams. Three areas had two different times since conversion to active agricultural fields adjacent to a windbreak forest.
We assumed the initial soil physical and chemical properties were the same in the forest (F) and agricultural sites before development. To determine the effects of agricultural development with meaningful land use comparisons, we selected pairs of plots with adjacent flat areas to avoid the influence of soil erosion and heterogeneity of soil properties. Furthermore, we avoided irrigated fields, because closed irrigation in humid and high soil C content fields easily decreases the C content in soil [19]. We used the paired-plot approach to evaluate temporal C changes following agricultural development. Studies employing the paired-plot approach have shown that the soil C content changes because of land conversion [20,21]. We sampled approximately 10 m from the border between F and agricultural development fields (AD), with three replicates each. This relatively small plot size ensures that comparable paired plots can be obtained, even at plots with high topographical and pedological heterogeneity [22]. We obtained aerial photographs captured at least once per decade from the National and Regional Policy Bureau in Japan (http://airphoto.gis.go.jp/aplis/Agreement.jsp) to evaluate the time since development. Some aerial photographs of recently developed plots were obtained from Google Earth 7.3.2 (Google Corporation 2013). Time-since-development was estimated as the midpoint between the photograph dates before and after the first development of agricultural land was observed. Site age was the investigation date minus the developed year.

2.2. Soil Sampling and Analyses

The effective soil layer thickness was not uniform because of the underlying gravel layer. Effective tillage depth has been recognized as approximately 0.30 m for agricultural fields in Tokachi District [23]. The morphological features of soil profiles were described at each pit and at each time point from 2016 to 2018, just before wheat harvest every year (mid August to September). The profile was described from the surface to the upper part of the gravel layer. A pit was dug with a shovel down to the clay layer to collect soil samples. The soil was then air-dried to constant mass after loosening. The bulk density of soil was calculated as the oven-dry mass by the volume of the core (100 mL) segment at each soil layer.
The soil C stock was estimated as described previously [14]. The C content was determined by the dry combustion method using an NC analyzer (Sumigraph NC-22; Sumika Chemical Analysis Services Ltd., Tokyo, Japan). C pools (Mg ha−1) for each soil layer were calculated by the minimum equivalent soil mass (ESM) approach instead of the simple bulk density method [24]. To account for changes in the soil bulk density and compaction, the C content is reported on a volumetric basis. We isolated the LF by mechanical shaking with heavy liquid to distinguish decaying plant litter from high-density fraction, which largely consists of microbially altered organic compounds that are strongly associated with soil minerals. The method of isolation of the LF has been described previously [14]. The soil C concentration (g C kg−1) was multiplied by the corresponding ESM to obtain C pools (Mg ha−1), and the total C pool was calculated by summing the C pool at each sampling depth within the soil profile. The LF soil C content was determined by following the same procedure used for measuring the soil C content. We estimated the changes in C pool from forest to agricultural field as ΔC.

2.3. Forest Floor and Manure Application

We collected litter from the soil surface at three quadrats (0.3 m × 0.3 m). The floor litter content was determined by dry weight after oven-drying at 80 °C for at least 48 h. The floor litter was separated into stem and other parts manually [25]. The C content in floor litter, was determined following the procedure used for soil samples and was multiplied by the mass (Mg C ha−1).
Interviews with farmers were conducted during the winter of 2017 and 2018. The farmers were asked for details regarding the cultivation management practices employed by them during the past 10 y. We obtained information on the amount and time of manure and crop residue applications and crop rotation cycles (Table 1). The C input from cattle manure for agricultural land, Cm (Mg C ha−1 y−1), was calculated as:
C m = M A × 0.23 × 0.365
where, MA is the regional manure application rate on a fresh weight basis (Mg ha−1 y−1), and 0.23 and 0.365 represent the dry matter content in fresh cattle manure and the C content in dry cattle manure in Hokkaido, respectively [26].

3. Results

3.1. Comparison of Soil Characters between the Forest and Agricultural Land Use Pairs

The horizon depth and bulk density of soils change with agricultural machinery management practices. The horizon depth was 0.30–0.75 m in F site and 0.24–0.57 m in AD site (Table 2). The horizon depth was deeper in the F site than in AD site at all sites. The soil bulk density was 0.52–0.78 Mgm−3 in F and 0.62–1.07 Mgm−3 in AD site. The soil C content was estimated on a volumetric basis to account for changes in the soil bulk density and compaction. The soil C content ranged from 101 to 353 Mg C ha−1 in F site and 86 to 341 Mg C ha−1 in AD site. Shorter and longer duration since development are represented as AD1 and AD2 at sites 3–5, and the results indicated less soil C stock in long-term AD fields than in short-term AD fields at each site. However, the soil C content did not always decrease with agricultural development. The floor litter at F site ranged from 3 to 15 Mg C ha−1, which was more than 10 % of C stocks in less soil C at sites 4 and 5.

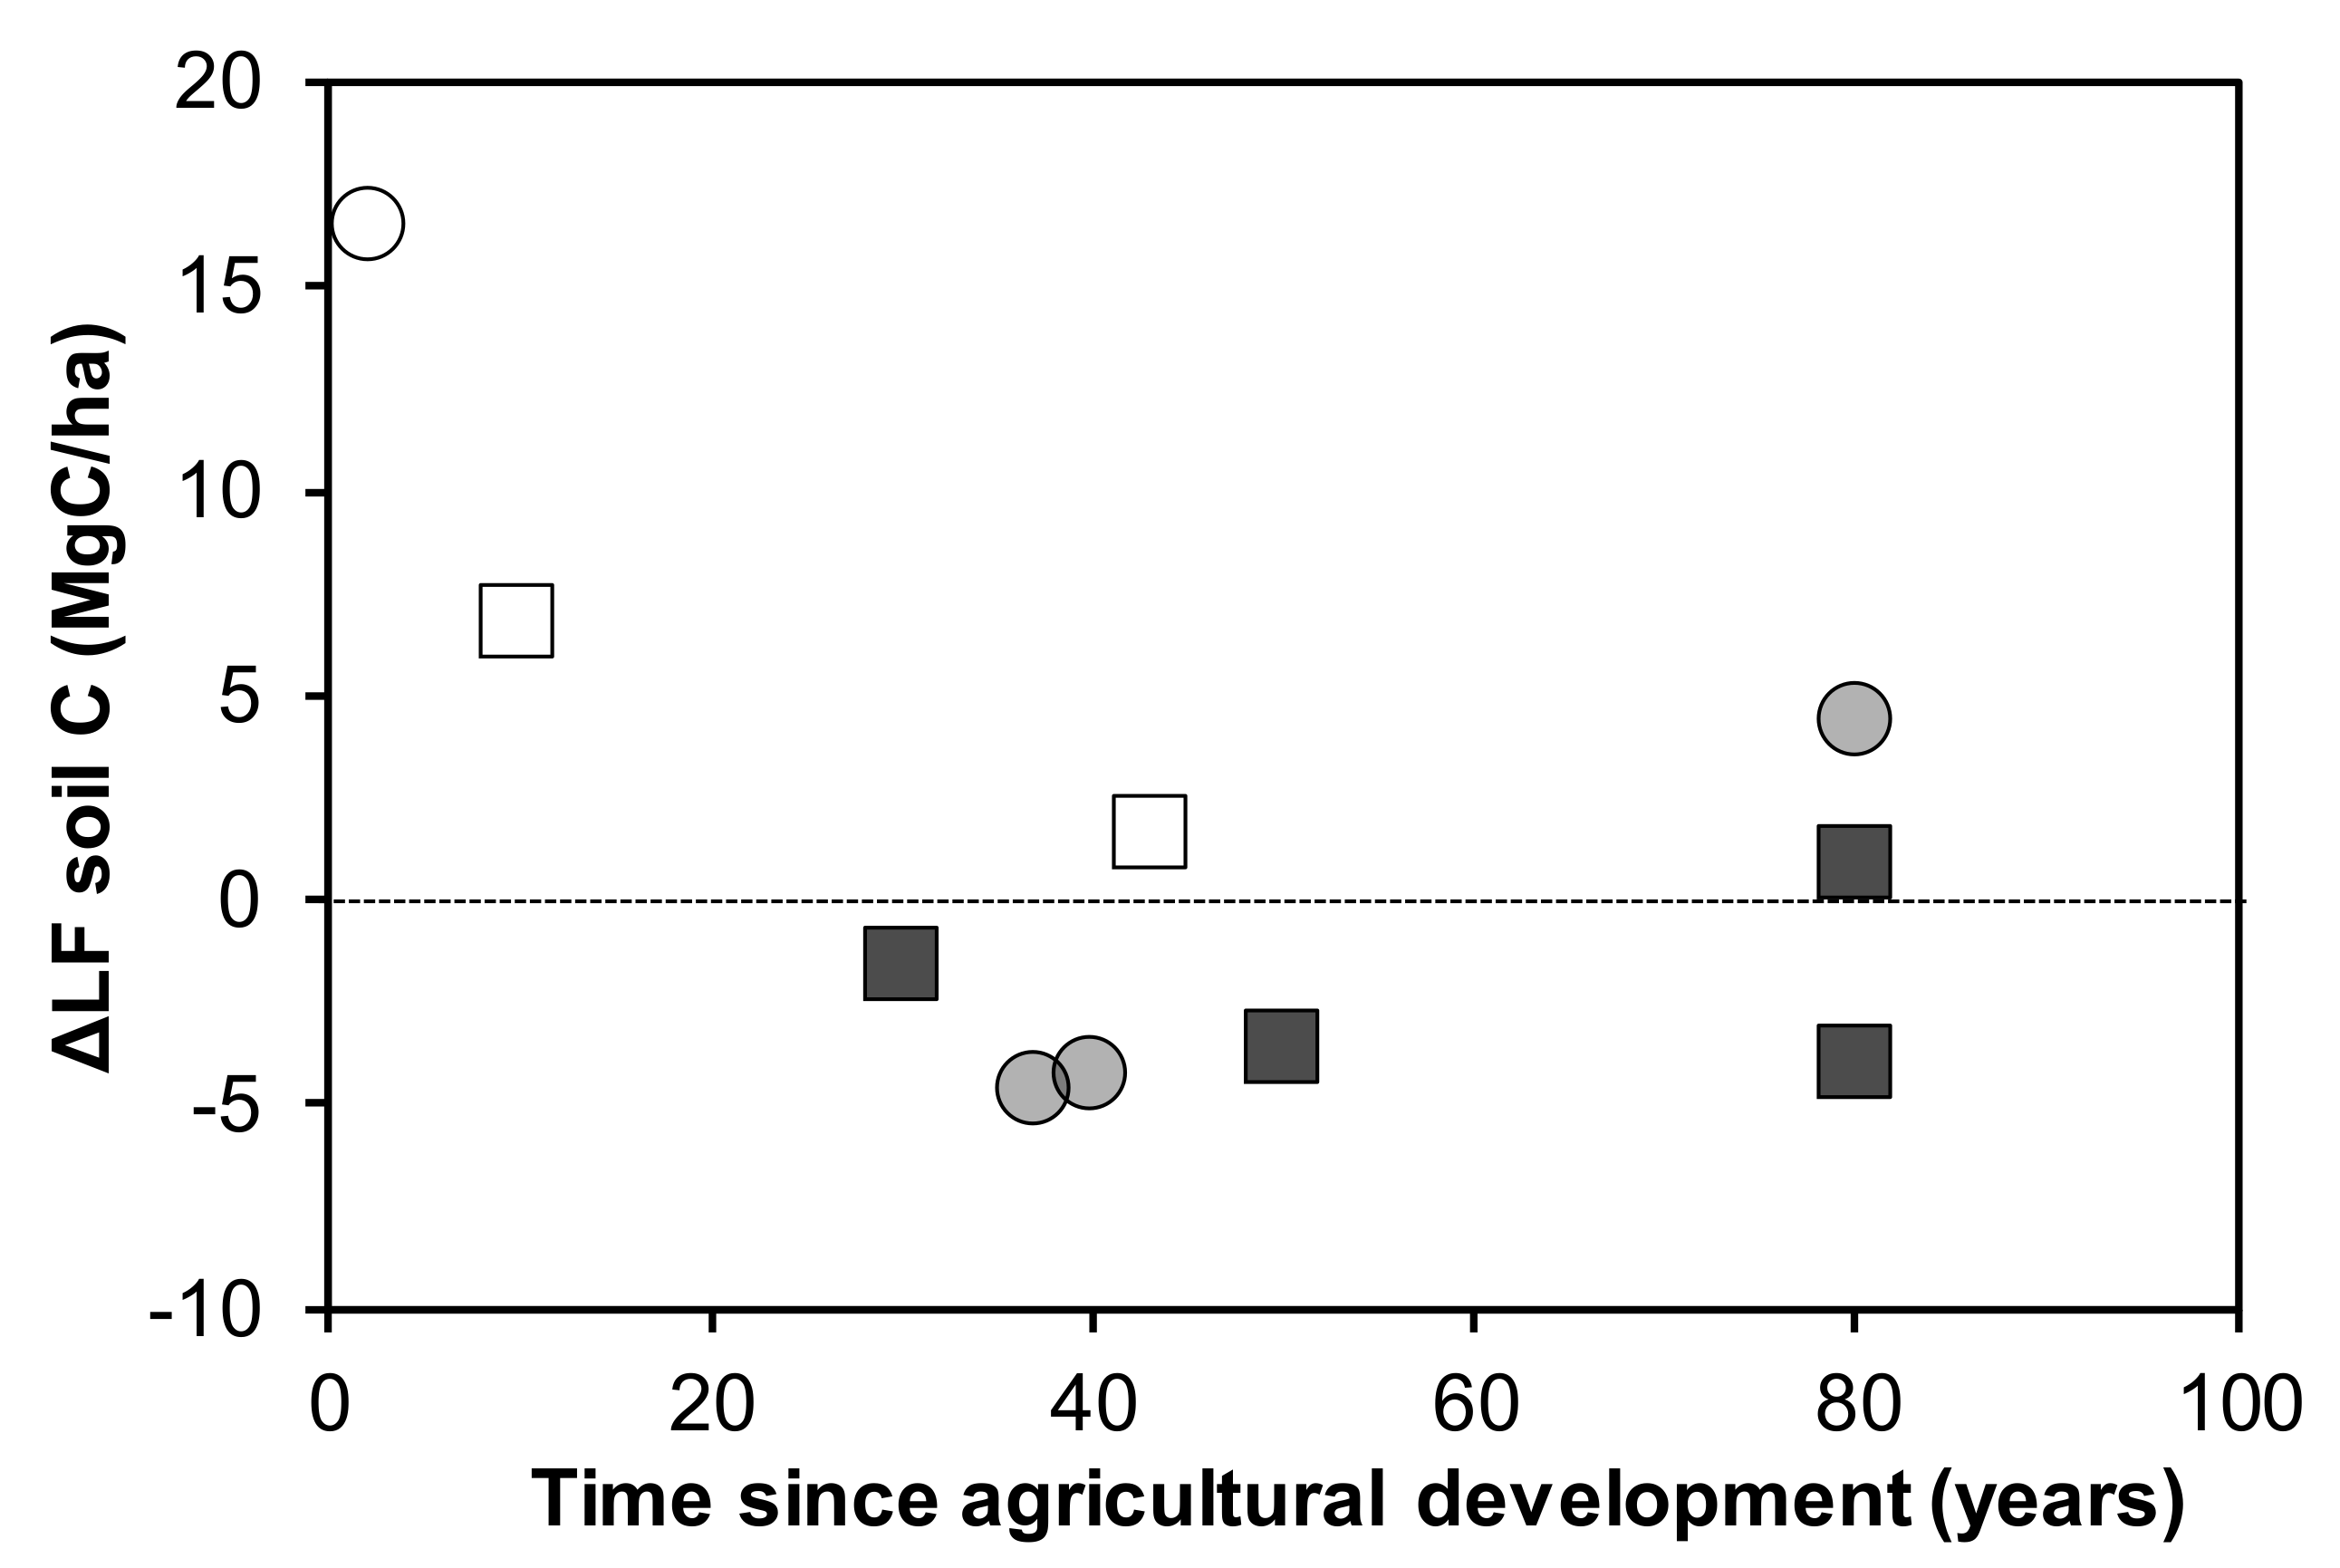
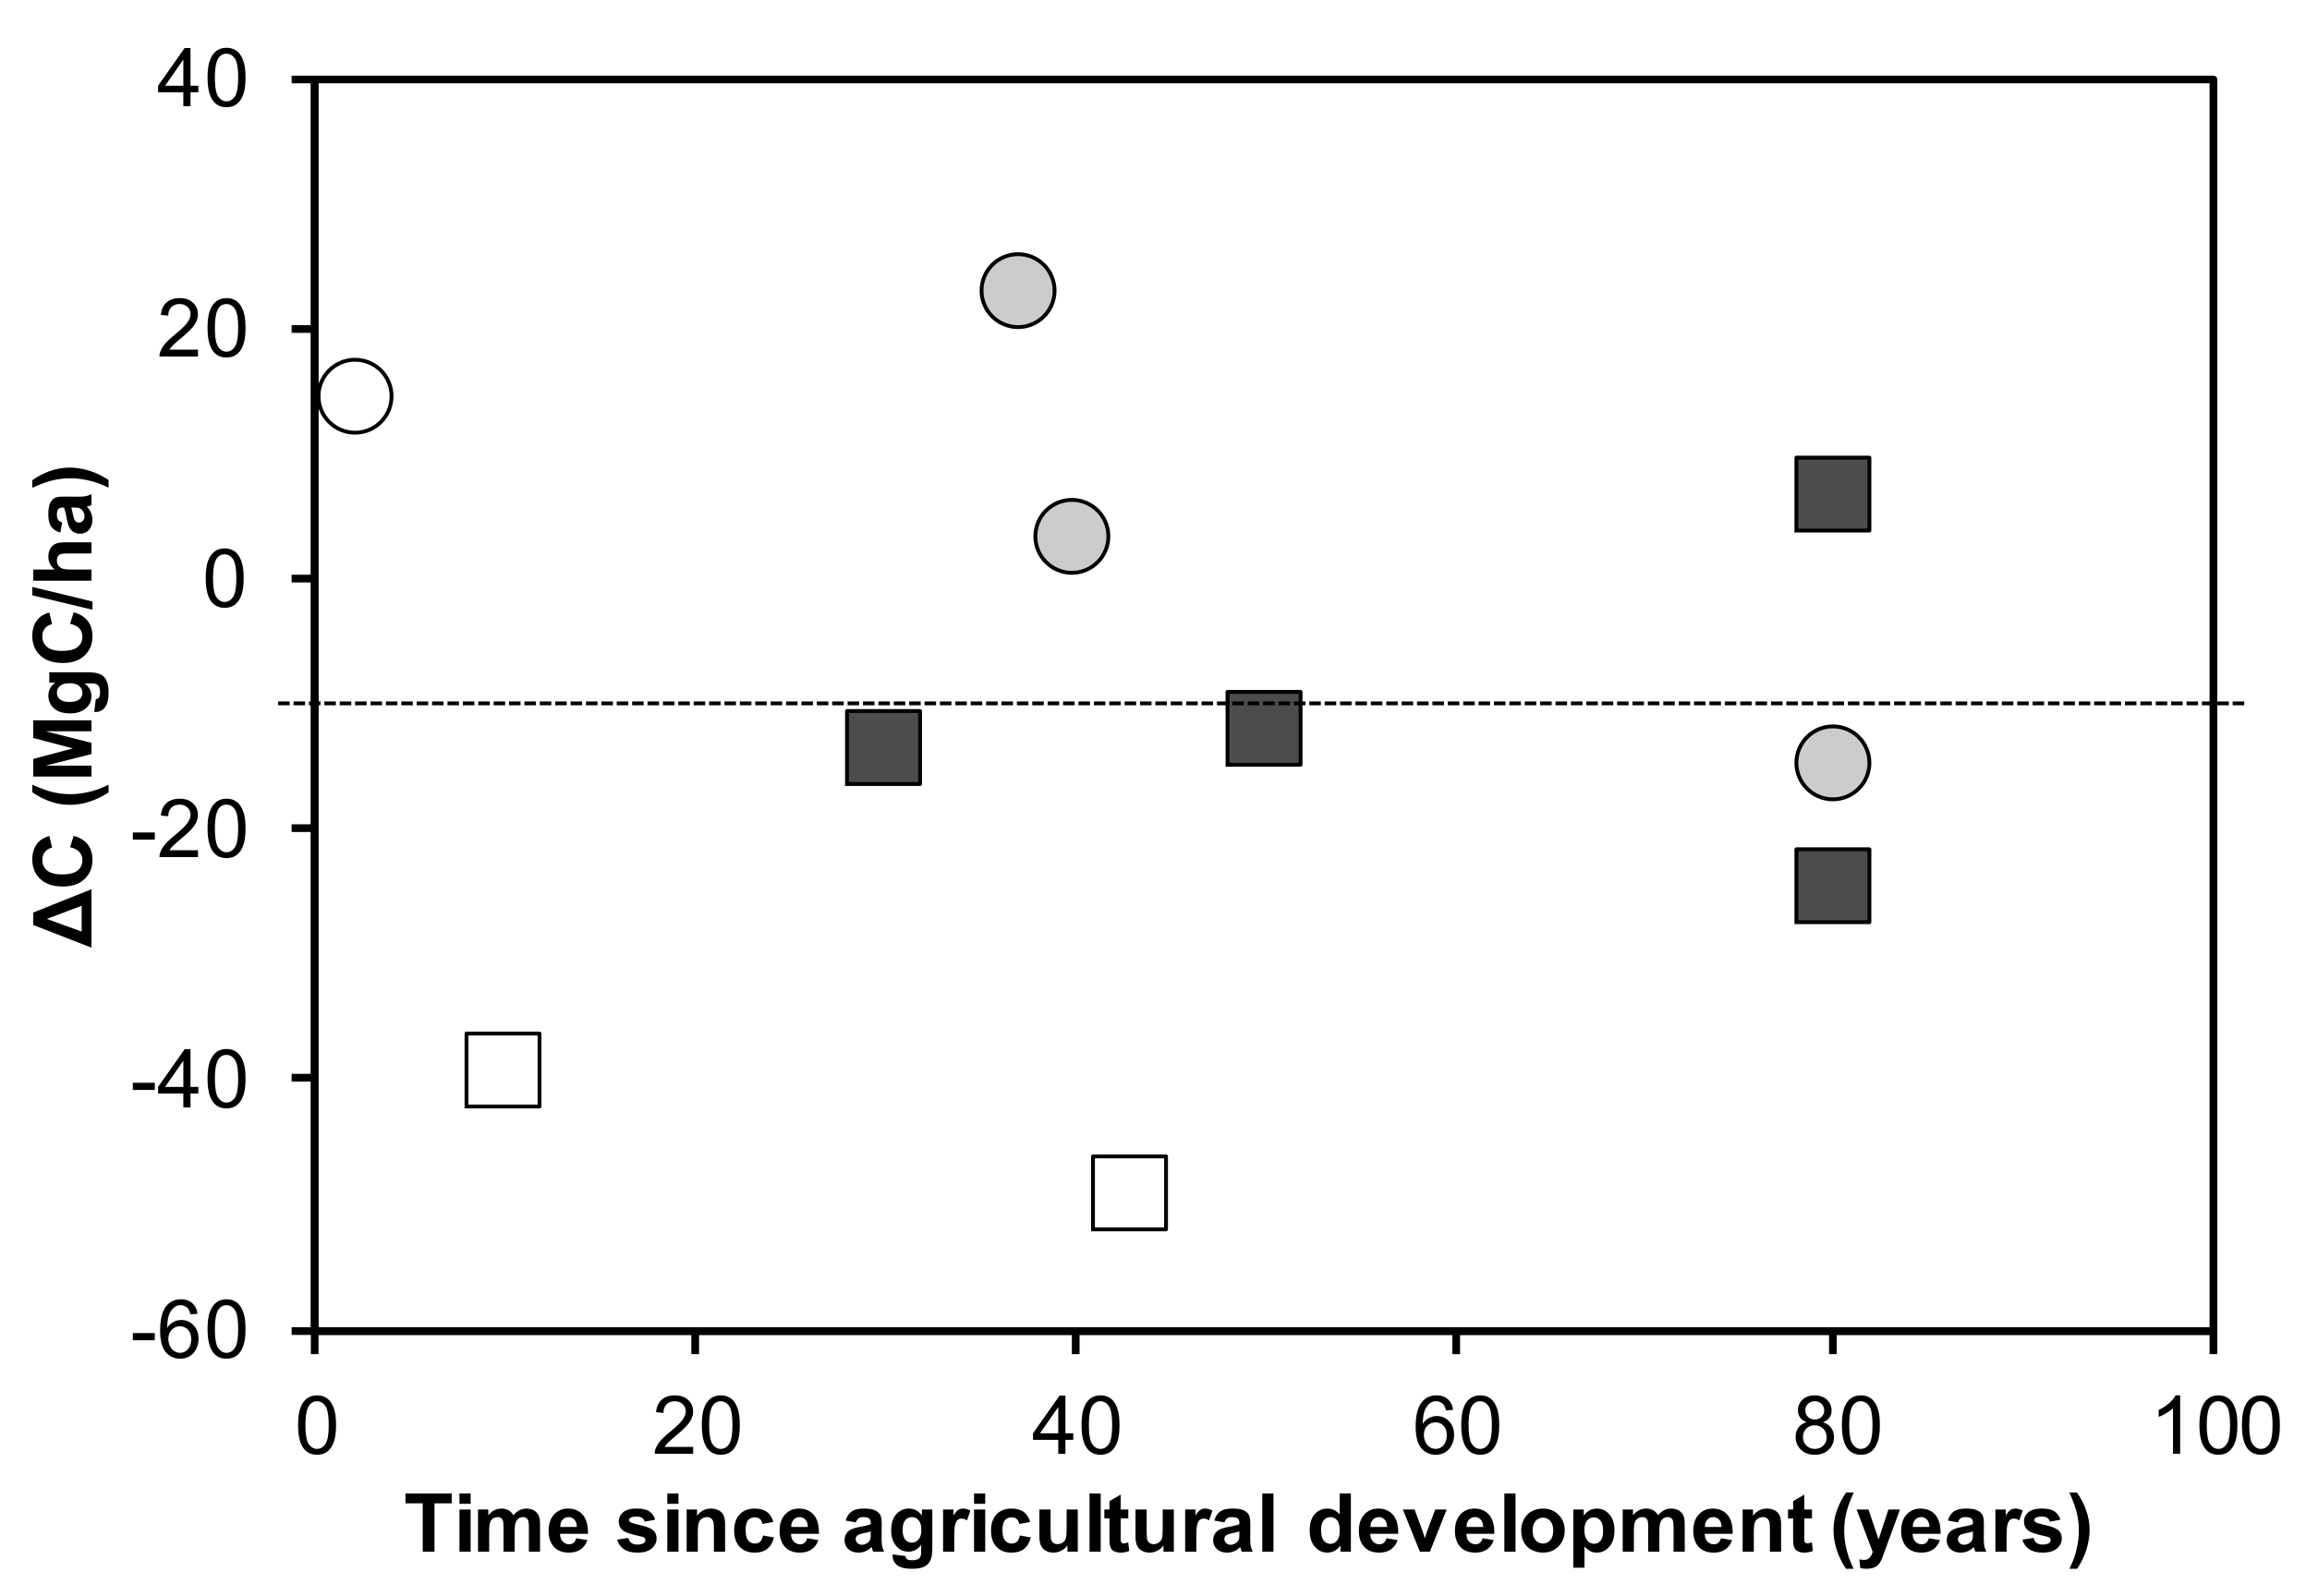
3.2. Changes in Soil C Pool with Time Since Agricultural Development

A comparison of soil C stock between the forest and agricultural land use pairs (initial condition vs. developed fields) during agricultural development revealed that the difference in soil carbon (ΔC) between forest and AD was relatively less in no manure application fields (Figure 1). The ΔC in no manure application fields was −39.4 and −49.3 Mg C ha−1 in 10- and 43-years AD fields, whereas, it was 14.7 Mg C ha−1 in 2-years AD field (Figure 1). There was no clear pattern of ΔC among soil types or amount of manure applied. The LF soil C has been used as an indicator of soil quality as it is mainly composed of partially decomposed fragments of plant residue that are not associated with mineral particles [16]. The amount of LF soil C and the ratio of LF to whole soil did not depend on the time since agricultural development (Appendix A). The maximum LF soil C content recorded was 16.8% in 2-years AD field (Appendix A). The LF soil C content within 10 years of agricultural development was clearly different from that with fewer years of succession (Figure 2). ΔLF soil C was within 5 Mg C ha−1 in > 30-years AD fields. The maximum ΔLF soil C content recorded was 20.4 Mg C ha−1 in 2-y AD field.

3.3. Comparison of Soil C Pools with Short/Long-Term Agricultural Development Pairs

Table 3 shows C stocks in F and short/long-term AD fields at a site. The content of LF soil C in F site was relatively low, with 2.1 and 2.8 Mg C ha−1. The LF soil C content of short-term AD fields was relatively higher, despite no manure application. At site 5, the sum of floor litter C and whole soil C content was 111.4 Mg C ha−1, which was approximately equivalent to the whole soil C content in 2-years AD (115.6 Mg C ha−1). Longer duration since development at AD2 represented lower soil C and LF soil C content than those at AD1 in both sites. However, the LF soil C content at AD2 was slightly higher than at F in both sites.

4. Discussion

4.1. Temporal Changes in Soil C Stock

In the present study, we estimated the soil C stocks assuming that they decrease over time with agricultural development to compare with those of the forest without manure application. The change in soil C stock does not always correspond with time since agricultural development. For example, a global meta-analysis showed that land use change from native forest to agricultural development reduced 42% of soil C content [4]. However, the C accrual rates differed among these studies; a common feature among these studies was a decrease in soil C content immediately after agricultural development. These results represent soil C change mainly under warm climate and in the arid region. The results of the present study showed that the decrease in the rate of soil C content without manure application was 25% (from 159.0 to 119.6 Mg C ha−1) over 10 years and 31% (from 159.0 to 119.6 Mg C ha−1) over 43 years at site 4 (Table 3), indicating a decomposition rate lower than that in other studies. A previous study has showed that approximately 50% of soil C content in the top soil (0–0.20-m depth) decreased under climate condition similar to that of the present study (8.6 °C of annual mean temperature and 612 mm of annual rainfall) in Cinnamon soil in China [27]. Several studies have suggested that the topsoil underestimate the soil C content change with agricultural development, leading to a biased assessment of land use effects on soil C stock [2,28]. The results of the present study are similar to those of a previous study in Bavaria, Germany [29], which suggested a <20% reduction in soil C content with land use change from forest to cropland at 8–9 °C of annual mean temperature and 700–900 mm of annual rainfall. Humid and cool environments might result in lower rate of organic matter decomposition under cultivation.
In the present study, the experimental plots selected were flat fields in order to avoid the loss of C through erosion, which is one of the reasons for the soil C gain after agricultural development. Although cooler climate leads to slower soil C change, a previous study in a boreal region of Alaska showed considerably higher soil C reduction (69%) after agricultural development [30]. Thawing in upland slope enhances rapid decrease in soil C due to erosion. Tokachi District often experiences winter soil frost, which later leads to erosion and run off in slope [31]. This implies that regional land use data should include flat and steep slope sites. Difference in sloping and flat crop lands on soil aggregation process and management practices has not been studied intensively [32]. It might be necessary to further evaluate the resulting effects on the soil C content at the regional scale.

4.2. Changes in Soil C Immediately after Agricultural Development

We hypothesized that the soil C stock initially declines after agricultural development. However, the results of the present study were contradictory. There was a rapid increase in the initial LF soil C gain, indicating that plant derived C is the major contributor to the increase in C content during agricultural development. This also indicates a net gain in soil C, which can last for several years after agricultural development. The increase in LF soil C contributed to the initial ecosystem C gain. During agricultural development, the C in floor litter and some above- and below-ground biomasses is incorporated into soils in the region.
There was a temporal decrease in LF soil C content in plot pairs (Table 2) and at all sites (Figure 2) after the initial period of agriculture development. In other words, the temporal loss in soil C exceeded the initial C input during the decadal agricultural land use. Agricultural land use results in the rapid decomposition of soil C that was initially stored under periodic aerobic conditions. The rate of soil C accrual observed in the present study was approximately 20 Mg C ha−1 as the initial LF soil C gain and further decomposed LF soil C was balanced during the later phase of agricultural development. The development of periodic anaerobic condition during cultivation increases organic decomposition, resulting in the loss of initially gained C under agricultural land use. The floor litter in F site was more than 10% of C stocks at sites 4 and 5. Plant-derived C strongly contribute to the C stock at less soil C stock sites. These results of LF soils highlight the increase in initial plant residue-associated C content upon agricultural development. Therefore, without erosion, soil C shows a net increase due to the accumulation of residual C immediately after land use change in cool region. C in floor litter and some above- and below-ground biomasses is incorporated into soils during agricultural development. Forest residue management is a new consideration to maintain the soil C stock upon agricultural development. The C benefits would be arising from incorporating forest residue upon agricultural development into the soil.

4.3. Effect of Regional Land Use Management

Manure application might slightly contribute to the maintenance of soil C stock after agricultural development in Northeast Japan. Studies have suggested that manure application to croplands is a promising management option to increase soil C stocks in Japan [26,33]. The formation of short-range ordered minerals and Al/Fe–humus complexes promote C accumulation in Andosols, covering more than 50% of the total upland cropland in Japan [34,35]. However, the substantial effect of enhanced manure application on soil C stock is debatable, because the amount of manure application does not correspond with the increase in soil C even in Andosols (Figure 1). A previous study, with 30-years continuous manure application experiment in Northeast Japan, suggested that regional soil C was balanced by the application mass of 2.5 Mg ha−1 (0.21 Mg C ha−1) [36]. The manure application rate in our study sites ranged from 0.10 to 0.42 Mg C ha−1, which was either too low or high to balance the soil C content. No clear pattern of ΔC the different manure application rates indicate that the substantial effect of manure application on soil C stock enhancement is debatable in this region. Therefore, the soil C content might reach equilibrium or potential level under a particular soil type and climate condition with agricultural development. Finer scale study of soil aggregation with soil management might help understand the C change processes [37,38]. The results pertaining to the changes in soil C components with agricultural development presented herein can help improve C budget models to predict suitable and sustainable C balance after land use change.
In Tokachi District, the production of cool-season crops such as wheat and potato is changing significantly depending on the seasonal increase in air temperature [10,11]. Farmers are introducing more hot-season crops such as nagaimo (Dioscorea polystachya) and green soy beans to compensate for the economic damage [15]. Moreover, wine production in Japan has shifted to cooler region, where the air temperature is suitable for the cultivation of authentic European wine grapes, promoting wider vineyards in Hokkaido [39,40]. Therefore, a part of the steep-sloped hillsides is used as vineyards instead of being protected by forest cover. The introduction of new crops due to global warming is accompanied by a change in optimal soil conditions. If climate warming augments regional change in land use because of improved agricultural opportunities and performance, it might enhance C loss. A comprehensive global warming policy that would be able to balance global warming adaptation and mitigation measures would be necessary in the future.
The temporal loss in soil C exceeded the initial C input during the long-term agricultural land use. However, estimates of the temporal C changes is uncertain because most studies depend on summing a robust land-use data set [9,41]. Temporal dynamics of soil C after land-use change is important for the estimates of the total C emission [25,42]. Estimation of plant derived C is contributed to fine simulation of temporal change of soil C stocks upon agricultural development. Contribution of plant-derived C, as net gain in soil C, can last for several years after agricultural development. Rapid increase and slow decrease in LF soils indicate the sustainable cycling of initial plant residue-associated C in agricultural land use. Recycling of organic matter and nutrients is a fundamentally important process that might significantly affect the C budget, as well as the availability of nutrient for crops. The initial ecosystem C gain could be a key process for sustainable cycling of organic matter source upon agricultural development.

5. Conclusions

We investigated changes in C storage due to deforestation for agricultural land use during cultivation in cold humid area. A gradual increasing cropland area in Hokkaido Tokachi District is providing an opportunity to investigate the change in C stocks under the current climate condition. We found that after a few years after agricultural development, the initial soil C gain was approximately 15 Mg C ha−1. Plant-derived-C is associated with temporal dynamics of soil C after land-use change. An increase in the initial LF soil C gain by approximately 20 Mg C ha−1 indicated that plant-derived-C is the major contributor for the increase in C content with agricultural development. Forest residue management is effective to maintain the soil C stock upon agricultural development. Irrespective of the amount of manure applied, the soil C content is balanced due to agricultural C input. Upon land use change, C and nutrients recycling is a fundamentally important process that might significantly affect the C budget. The temporal loss in soil C exceeded the initial C input during the decadal agricultural land use. Not only simple manure or crop residue information, but also initial C gain information is necessary for synthetic temporal C estimation.

Author Contributions

Conceptualization, S.S., K.W. and K.N.; methodology, S.S., K.W. and K.N.; validation, S.S., K.W., M.K. and K.N.; formal analysis, S.S. and K.N.; investigation, S.S., K.W., M.K. and K.N.; resources, S.S..; data curation, S.S., K.W., M.K. and K.N.; writing—original draft preparation, S.S. and K.N.; writing—review and editing, S.S.; visualization, S.S.; supervision, S.S.; project administration, S.S.; funding acquisition, S.S.

Funding

This research was funded by the Ministry of the Environment, Japan (Environment Research and Technology Development Fund 2-1601).

Acknowledgments

We thank Yasuhito Shrato (NARO/NIAES) for the support in planning the study, Shinji Imada (Japan Agricultural Cooporatives Shikaoi) and Yasushi Ozawa (Tokachi Agricultural Extension Center in Hokkaido) for their support in investigation, and Mieko Takasugi and Maiko Omote (NARO/HARC) for their technical support in soil analysis.

Conflicts of Interest

The authors declare no conflict of interest.

Appendix A

LF soil C (Mg ha−1) and the ratio of LF to whole soil C (%) in a forest (F) and agricultural development sites (AD) with shorter and longer duration since development represented as AD1 and AD2.
SiteLF Soil C (Mg ha−1)Ratio of LF to Whole Soil (%)Developed (Years)
No.FAD1AD2FAD1AD2AD1AD2
113.79.8-8.15.5->80-
29.55.9-2.71.7-50-
34.22.65.11.40.91.830>80
42.13.73.71.33.13.41043
52.819.47.22.816.88.42>80
69.65.3-6.93.7-42-
78.33.6-4.41.7-37-

References

  1. IPCC. Climate Change 2014: Synthesis Report. Contribution of Working Groups I, II and III to the Fifth Assessment Report of the Intergovernmental Panel on Climate Change; Pachauri, R.K., Meyer, L.A., Eds.; IPCC: Geneva, Switzerland, 2014. [Google Scholar]
  2. Murty, D.; Kirschbaum, M.U.F.; McMurtrie, R.E.; McGilvray, A. Does conversion of forest to agricultural land change soil carbon and nitrogen? A review of the literature. Glob. Change Biol. 2002, 8, 105–123. [Google Scholar] [CrossRef]
  3. Mehra, P.; Baker, J.; Sojka, R.E.; Bolan, N.; Desbiolles, J.; Kirkham, M.B.; Ross, C.; Gupta, R. A review of tillage practices and their potential to impact the soil carbon dynamics. Adv. Agron. 2018, 150, 185–230. [Google Scholar] [CrossRef]
  4. Guo, L.B.; Gifford, R.M. Soil carbon stocks and land use change: A meta analysis. Glob. Chang Biol. 2002, 8, 345–360. [Google Scholar] [CrossRef]
  5. Martinez-Mena, M.; Lopez, J.; Almagro, M.; Boix-Fayos, C.; Albaladejo, J. Effect of water erosion and cultivation on the soil carbon stock in a semiarid area of South-East Spain. Soil Tillage Res. 2008, 9, 119–129. [Google Scholar] [CrossRef]
  6. Don, A.; Schumacher, J.; Freibauer, A. Impact of tropical land-use change on soil organic carbon stocks—A meta-analysis. Glob. Change Biol. 2011, 17, 1658–1670. [Google Scholar] [CrossRef]
  7. Assefa, D.; Rewald, B.; Sandén, H.; Rosinger, C.; Abiyu, A.; Yitaferu, B.; Godbold, D.L. Deforestation and land use strongly effect soil organic carbon and nitrogen stock in Northwest Ethiopia. Catena 2017, 153, 89–99. [Google Scholar] [CrossRef]
  8. Ho, P.Y.; Dacanay, E.V.; Castelo, O.; Kasajima, I.; Ho, P.Y. Estimation of soil organic carbon turnover using natural 13C abundance in Asian tropics: A case study in the Philippines. Soil Sci. Plant Nutr. 2004, 50, 599–602. [Google Scholar] [CrossRef]
  9. Tubiello, F.N.; Salvatore, M.; Rossi, S.; Ferrara, A.; Fitton, N.; Smith, P. The FAOSTAT database of greenhouse gas emissions from agriculture. Environ. Res. Lett. 2013, 8, 015009. [Google Scholar] [CrossRef] [Green Version]
  10. Shimoda, S.; Hamasaki, T.; Hirota, T.; Kanno, H.; Nishio, Z. Sensitivity of wheat yield to temperature changes with regional sunlight characteristics in eastern Hokkaido. Int. J. Climatol. 2015, 35, 4176–4185. [Google Scholar] [CrossRef]
  11. Shimoda, S.; Kanno, H.; Hirota, T. Time series analysis of temperature and rainfall-based weather aggregation reveals significant correlations between climate turning points and potato (Solanum tuberosum L.) yield trend in Japan. Agric. For. Meteorol. 2018, 263, 147–155. [Google Scholar] [CrossRef]
  12. Yamanaka, S.; Akasaka, T.; Yamaura, Y.; Kaneko, M.; Nakamura, F. Time-lagged responses of indicator taxa to temporal landscape changes in agricultural landscapes. Ecol. Indic. 2015, 48, 593–598. [Google Scholar] [CrossRef]
  13. Novara, A.; Gristina, L.; Sala, G.; Galati, A.; Crescimanno, M.; Cerdà, A.; Badalamenti, E.; La Mantia, T. Agricultural land abandonment in Mediterranean environment provides ecosystem services via soil carbon sequestration. Sci. Total Environ. 2017, 576, 420–429. [Google Scholar] [CrossRef] [PubMed] [Green Version]
  14. Shimoda, S.; Koyanagi, F.T. Land use alters the plant-derived carbon and nitrogen pools in terraced rice paddies in a mountain village. Sustainability 2017, 9, 1973. [Google Scholar] [CrossRef]
  15. MAFF (Ministry of Agriculture, Forestry and Fisheries of Japan). Annual Report on Food, Agriculture and Rural Areas in Japan FY 2017; MAFF: Tokyo, Japan, 2018.
  16. Wagai, R.; Mayer, L.M.; Kitayama, K. Nature of the “occluded” low-density fraction in soil organic matter studies: A critical review. Soil Sci. Plant Nutr. 2009, 55, 13–25. [Google Scholar] [CrossRef] [Green Version]
  17. Shimoda, S.; Hirota, T. Planned snow compaction approach (yuki-fumi) contributes toward balancing wheat yield and frost-kill of unharvested volunteer potato tubers. Agric. For. Meteorol. 2018, 262, 361–369. [Google Scholar] [CrossRef]
  18. Niwa, K.; Seino, N.; Yokobori, J.; Kikuchi, K.; Hongo, C. Effect of soil type on the time-course of changes in sugar beet (Beta vulgaris L.) productivity in Tokachi District, Hokkaido, Japan. Soil Sci. Plant Nutr. 2008, 54, 928–937. [Google Scholar] [CrossRef]
  19. Niwa, K.; Nagata, O.; Wakabayashi, K.; Hongo, C. The effect of cultivation on changes in soil carbon stocks in the Andosols of Tokachi district, Hokkaido. Jpn. J. Soil Sci. Plant Nutr. 2015, 86, 515–521. [Google Scholar] [CrossRef]
  20. Zak, D.R.; Grigal, D.F.; Gleeson, S.; Tilman, D. Carbon and nitrogen cycling during old-field succession: Constraints on plant and microbial biomass. Biogeochemistry 1990, 11, 111–129. [Google Scholar] [CrossRef]
  21. Post, W.M.; Kwon, K.C. Soil carbon sequestration and land-use change: Processes and potential. Glob. Change Biol. 2000, 6, 317–328. [Google Scholar] [CrossRef]
  22. Poeplau, C.; Don, A. Sensitivity of soil organic carbon stocks and fractions to different land-use changes across Europe. Geoderma 2013, 192, 189–201. [Google Scholar] [CrossRef]
  23. Niwa, K.; Yokobori, J.; Hongo, C.; Nagata, O. Estimating soil carbon stocks in an upland area of Tokachi District, Hokkaido, Japan, by satellite remote sensing. Soil Sci. Plant Nutr. 2011, 57, 283–293. [Google Scholar] [CrossRef] [Green Version]
  24. Ellert, B.H.; Bettany, J.R. Calculation of organic matter and nutrients stored in soils under contrasting management regimes. Can. J. Soil Sci. 1995, 75, 529–538. [Google Scholar] [CrossRef] [Green Version]
  25. Shimoda, S. Plant-derived carbon and nitrogen addition due to mowing in the early stages of post agricultural succession. Ecol. Eng. 2017, 98, 24–31. [Google Scholar] [CrossRef]
  26. Koga, N.; Smith, P.; Yeluripati, J.B.; Shirato, Y.; Kimura, S.D.; Nemoto, M. Estimating net primary production and annual plant carbon inputs, and modelling future changes in soil carbon stocks in arable farmlands of northern Japan. Agric. Ecol. Environ. 2011, 144, 51–60. [Google Scholar] [CrossRef]
  27. Wei, X.; Shao, M.; Gale, W.J.; Zhang, X.; Li, L. Dynamics of aggregate-associated organic carbon following conversion of forest to cropland. Soil Biol. Biochem. 2013, 57, 876–883. [Google Scholar] [CrossRef]
  28. Baker, J.M.; Ochsner, T.E.; Venterea, R.T.; Griffis, T.J. Tillage and soil carbon sequestration—What do we really know? Agric. Ecosys. Environ. 2007, 118, 1–5. [Google Scholar] [CrossRef]
  29. Wiesmeier, M.; von Lützow, M.; Sporlein, P.; Geuß, U.; Hangen, E.; Reischl, A.; Schilling, B.; Kogel-Knabner, I. Land use effects on organic carbon storage in soils of Bavaria: The importance of soil types. Soil Tillage Res. 2015, 146, 296–302. [Google Scholar] [CrossRef]
  30. Grünzweig, J.M.; Valentine, D.W.; Chapin, F.S. Successional changes in carbon stocks after logging and deforestation for agriculture in interior Alaska: Implications for boreal climate feedbacks. Ecosystems 2015, 18, 132–145. [Google Scholar] [CrossRef]
  31. Iwata, Y.; Yanai, Y.; Yazaki, T.; Hirota, T. Effects of a snow-compaction treatment on soil freezing, snowmelt runoff, and soil nitrate movement: A field-scale paired-plot experiment. J. Hydrol. 2018, 567, 280–289. [Google Scholar] [CrossRef]
  32. Ghosh, B.H.; Meena, V.S.; Singh, R.J.; Alam, N.M.; Patra, S.; Bhattacharyya, R.; Sharma, N.K.; Dadhwal, K.S.; Mishra, P.K. Effects of fertilization on soil aggregation, carbon distribution and carbon management index of maize-wheat rotation in the north-western Indian Himalayas. Ecol. Indic. 2018, in press. [Google Scholar] [CrossRef]
  33. Yokozawa, M.; Shirato, Y.; Sakamoto, T.; Yonemura, S.; Nakai, M.; Ohkura, T. Use of the Roth C model to estimate the carbon sequestration potential of organic matter application in Japanese arable soils. Soil Sci. Plant Nutr. 2010, 56, 168–176. [Google Scholar] [CrossRef]
  34. Shirato, Y.; Hakamata, T.; Taniyama, I. Modified Rothamsted carbon model for andosols and its validation: Changing humus decomposition rate constant with pyrophosphate-extractable Al. Soil Sci. Plant Nutr. 2004, 50, 149–158. [Google Scholar] [CrossRef]
  35. Iwasaki, S.; Endo, Y.; Hatano, R. The effect of organic matter application on carbon sequestration and soil fertility in upland fields of different types of Andosols. Soil Sci. Plant Nutr. 2017, 63, 200–220. [Google Scholar] [CrossRef] [Green Version]
  36. Nakatsu, S.; Tamura, H. Effects of thirty years continuous application of organic materials (bark manure and crop residues) on total carbon, total nitrogen and physical characteristics of upland field soil in light colored andosol in Hokkaido. Jpn. J. Soil Sci. Plant Nutr. 2008, 79, 139–145. [Google Scholar]
  37. Young, I.M.; Crawford, J.W. Interactions and self-organization in the soil-microbe complex. Science 2004, 304, 1634–1637. [Google Scholar] [CrossRef] [PubMed]
  38. Wang, B.; Brewer, P.E.; Shugart, H.H.; Lerdau, M.T.; Allison, S.D. Soil aggregates as biogeochemical reactors and implications for soil-atmosphere exchange of greenhouse gases—A concept. Glob. Chan. Biol. 2018, in press. [Google Scholar] [CrossRef] [PubMed]
  39. Nemoto, M.; Hirota, T.; Sato, T. Prediction of climatic suitability for wine grape production under the climatic change in Hokkaido. J. Agric. Meteorol. 2016, 72, 167–172. [Google Scholar] [CrossRef]
  40. Iizumi, T.; Masutomi, Y.; Takimoto, T.; Hirota, T.; Yatagai, A.; Tatsumi, K.; Kobayashi, K.; Hasegawa, T. Emerging research topics in agricultural meteorology and assessment of climate change adaptation. J. Agric. Meteorol. 2018, 74, 54–59. [Google Scholar] [CrossRef] [Green Version]
  41. Yagasaki, Y.; Shirato, Y. Assessment on the rates and potentials of soil organic carbon sequestration in agricultural lands in Japan using a process-based model and spatially explicit land-use change inventories—Part 1: Historical trend and validation based on nation-wide soil monitoring. Biogeoscience 2014, 11, 4429–4442. [Google Scholar] [CrossRef] [Green Version]
  42. Poeplau, C.; Don, A.; Vesterdal, L.; Leifeld, J.; Van Wesemael, B.; Schumacher, J.; Gensior, A. Temporal dynamics of soil organic carbon after land-use change in the temperate zone—Carbon response functions as a model approach. Glob. Change Biol. 2011, 17, 2415–2427. [Google Scholar] [CrossRef]
Figure 1. Difference in soil carbon content (ΔC) between F and AD pairs with time since agricultural development. White, gray, and black symbols represent no manure application, 0.1–0.3 Mg C/ha/year manure application, and more than 0.3 Mg C/ha/year manure application, respectively. The circles and squares represent Andosol soil and lowland soils, respectively.
Sustainability 10 04587 g001
Figure 2. Difference in ΔLF soil C content between forest and agricultural development field pairs with time since agricultural development. White, gray, and black symbols represent no manure application, 0.1–0.3 Mg C/ha/year manure application, and more than 0.3 Mg C/ha/year manure application, respectively. The circles and squares represent Andosol soil and lowland soils, respectively.
Sustainability 10 04587 g002
Table 1. Longitude and latitude, soil type, forest species, time since agricultural development and annual manure application at each site.
SiteLongitude LatitudeSoil
Type
Forest
Species
Time Since
Developed (years)
Manure
(MgC ha−1 year−1)
NoNE
143.16143.02AndsolBirch (Betula pendula)>800.42
243.08142.96AndsolLarch (Larix kaempferi)500.33
343.08142.96AndsolAsh (Fraxinus mandshurica)30, >800.33
443.16143.04AndsolLarch10, 430
542.65143.14Lowland soilsLarch2, >800, 0.1
642.69143.19Lowland soilsLarch420.12
742.70143.22Lowland soilsOak·Birch370.10
Table 2. Horizon depth, bulk density (BD), and C content of soils at each site in two paired plots at a forest and agricultural development sites (AD) with shorter and longer duration since development represented as AD1 and AD2.
SiteHorizon Depth (m)BD (Mg m−3)Soil C (Mg ha−1)Development (Years)
NoForestAD1AD2ForestAD1AD2ForestForest (Litter)AD1AD2AD1AD2
10.650.40-0.540.88 -169 9 176 ->80-
20.750.40-0.570.97 -353 10 341 -50-
30.750.530.570.520.62 0.62 306 3 292 281 30>80
40.400.350.340.520.70 0.84 159 15 120 110 1043
50.300.280.240.780.89 0.98 101 12 116 86 2>80
60.370.28-0.701.07 -139 11 142 -42-
70.620.41-0.620.88 -189 10 212 -37-
Table 3. C stocks in forest and short/long-agricultural development fields (AD1/AD2) at sites 4 and 5.
SiteC ComponentsLand Use
No. 4 ForestAD1 (10 years AD)AD2 (43 years AD)
Floor litter C15.4 (0.6)--
Whole soil C159.0 (10.2)119.6 (3.9)109.7 (4.2)
LF soil C out of the whole2.1 (1.2)8.9 (1.3)3.7 (0.7)
No. 5ForestAD1 (2 y AD)AD2 (>80 y AD)
Floor litter C10.4 (1.1)--
Whole soil C100.9 (2.5)115.6 (5.0)85.9 (5.5)
LF soil C out of the whole2.8 (0.4)19.4 (5.7)7.2 (0.8)

