Crop Structure Changes Altered the Cropland Nitrogen Balance between 2005 and 2015 on the Sanjiang Plain, China
by
 and
and
Chunxia Yang
1,2, 
Hua Zheng
1,2,*,
Binbin Huang
1,2,
Ruonan Li
1,
Zhiyun Ouyang
1,2 and
Cong Li
3 1
State Key Laboratory of Urban and Regional Ecology, Research Center for Eco-Environmental Sciences, Chinese Academy of Sciences, Beijing 100085, China
2
College of Resources and Environment, University of Chinese Academy of Sciences, Beijing 100049, China
3
School of Economics and Finance, Xi’an Jiaotong University, Xi’an 710049, China
*
Author to whom correspondence should be addressed.
Sustainability 2018, 10(11), 4011; https://doi.org/10.3390/su10114011
Submission received: 23 September 2018
/
Revised: 22 October 2018
/
Accepted: 30 October 2018
/
Published: 2 November 2018
(This article belongs to the Special Issue Sustainable Crop Production Systems)
Abstract
:Nitrogen (N) budgets have been computed in many countries at various scales to improve understanding of N-balance characteristics and to assess the environmental pollution risks of applying chemical fertilizer N. However, dynamic characteristics, driving forces, and potential soil fertility consequences related to cropland N balance have seldom been discussed, especially in regions with highly fertile soils and low N-use intensities. This study investigated the temporal and spatial characteristics of N balance, and the impact of agricultural development on the agro-ecosystems of the Sanjiang Plain, one of the largest producers of commodity food grains in China. County-level agricultural statistics at five-year intervals were used to calculate agricultural N balances, N surplus intensity, and N-use efficiency between 2005 and 2015. Agricultural development has brought about continual increases in cultivated land area, consumption of chemical fertilizers, and nitrogen use efficiency (NUE). Nitrogen surplus intensity decreased from 65.0 kg/ha in 2005 to 43.5 kg/ha in 2010, and to 22.2 kg/ha in 2015. However, NUE was >90% in 13 counties in 2015, and in 11 counties in 2010. In contrast, only 5 counties had NUE above 90% in 2005, which indicates that N from the soil was used by crops and soil fertility was gradually decreasing. The percentage change of crop area, namely, the increase in maize area percentage, contributed significantly to the increases in NUE. A judicious management of fertilizers that meets the nutrient needs of the crops and ensures agricultural sustainability on the Sanjiang Plain is therefore essential. The findings of this study emphasize the importance of assessing the impact of crop structure adjustment on soil fertility and nitrogen balance during agricultural development.
1. Introduction
Food security, environmental degradation and climate change are significant challenges facing humankind. Agriculture is at the heart of these challenges, since it must seek to ensure global food security by increasing yields while adverse environmental impacts need to be reduced [1,2]. Nitrogen (N) is a key element in agricultural systems if high yields are to be achieved. Nitrogen deficiency negatively affects plant growth, whereas an N surplus can substantially reduce environmental quality and human well-being [3,4,5]. As recently as the 1960s, N availability in most parts of the world was controlled by natural processes and N was deficient in cropland [6]. However, the rapid development of the fertilizer industry provided a reliable supply of fertilizer N and other nutrients essential for plant growth, which has allowed farmers to considerably increase crop production per unit of land over the past century [7,8]. China has a large population and limited arable land per capita [9]. Increasing fertilizer inputs, especially N, is a common approach used to produce sufficient food for the rising population in China. In 1990, China consumed 19.2 Tg of N in the form of chemical fertilizers, a quarter of the world’s total, and 32.6 Tg in 2010, a third of the world’s total [10]. Unfortunately, because it is difficult to predict N fertilizer requirements accurately, N is often applied in excess of what the crop requires, which has unintended adverse consequences for the environment, including the degradation of downstream water quality and eutrophication of coastal marine ecosystems [3,6,11,12].
Nutrient balances are useful indicators of environmental risk or potential land degradation, and can optimize nutrient use [13,14,15,16]. The N balance is defined as the difference between the total quantity of nitrogen inputs (such as inorganic fertilizers, livestock manure, biological nitrogen fixation, and atmospheric deposition) and the size of the outputs (such as uptakes by harvested food and fodder crops) from agricultural land [17]. Nitrogen deficiency, N surplus, and N-use efficiency (NUE) in agricultural production are estimated on the basis of agricultural N budgets [4].
Agricultural nutrient balances differ substantially depending on the economic development level of the local economy [3]. The N balances of many developed and rapidly growing economies are positive, which indicates that nutrients are apparently accumulating. Nitrogen budgets have been computed in many countries at various scales to understand the N balance characteristics, to assess the potential pollution incurred due to excessive fertilizer N input, and to quantify feasible improvements in N-use efficiency by crops [3,17,18,19,20]. Most Chinese studies have focused on the excess input of chemical fertilizer N and chosen the most densely populated and agriculturally productive regions in China, such as the Changjiang River basin [21,22,23], the Haihe basin [24], and the Bohai Rim region [10]. However, N balance characteristics of regions with fertile soil and low input of chemical fertilizer N has seldom been discussed [25], and few studies pay attention to the variation of crop type and its effect on N budgets. In parts of many developing countries, such as sub-Saharan Africa and some provinces in China, agricultural nutrient inputs are insufficient to maintain soil fertility, which causes soil nutrient mining and threatens long-term food production [3,13,26,27]. China is the world’s largest developing country and had a net excess N supply of 2.65 × 10⁶ t in 2000, However, 37.68% of China’s counties have a nitrogen deficit. Cropland in these counties represents 43.1% of the national total [26], but the characteristics and potential risks related to the N balance in these regions is seldom discussed [25,28].
It is against this background that this study set out to: (1) examine the N balance, spatio-temporal changes, and their driving forces in terms of NUE andN surplus intensity (NSI); and, (2) to provide a scientific basis for the spatio-specific management of fertilizer N on the Sanjiang Plain, which is dominated by human activity with low N fertilization and high-intensity agricultural exploitation.
2. Materials and Methods
2.1. Study Area
The Sanjiang Plain (43°49′55″–48°27′40″ N, 129°11′20″–135°05′26″ E) lies in the north-eastern part of Heilongjiang Province, China. It comprises 23 counties or cities, and is spread over 10.89 × 10⁶ ha (Figure 1). According to data collected from the Chinese Academy of Agricultural Sciences, the total population in 2015 was 6.31 million, of which 47% was engaged in farming on the Sanjiang Plain. The Sanjiang Plain is formed by alluvial deposits from three rivers, namely, the Heilong River, the Wusuli River, and the Songhua River, and the elevation is less than 200 m in most parts. The climate is a temperate humid to sub-humid continental monsoon type. The annual mean temperature is 1.4–4.3 °C and ranges from −18 °C in January to 21–22 °C in July. The annual mean precipitation is 500–650 mm [29].
Sanjiang Plain, which has the largest and most concentrated area of freshwater wetlands in China, is also one of the largest producers of commodity food grains (cereals and pulses). Due to large-scale agricultural development, nearly 80% of the freshwater wetlands on the Sanjiang Plain were reclaimed over past decades [30]. Given its fertile soils, inputs of N as a chemical fertilizer for croplands can be as low as 0.05 t/ha, which is well below the national average of 1.27 t/ha [26]. However, with the development of agriculture, the use of N fertilizers on the Sanjiang Plain has increased gradually, and the resulting environmental risks can no longer be ignored.
2.2. County-Level Database
County-level agricultural statistics for 2005, 2010, and 2015 were used to calculate the N budgets for the Sanjiang Plain. The data, including the type and amount of fertilizers, crop yield and sowing area, and the extent of cultivated land, rice paddies, uplands, and livestock populations (numbers of pigs, sheep, cattle, etc.) were collected from the Chinese Academy of Agricultural Sciences. Data for irrigated land were collected from the China Statistical Yearbook for Regional Economy. The data were incomplete for Youyi County. Therefore, the regional average was used to replace the missing data. ArcGIS software developed by Environmental Systems Research Institute, Inc. (ESRI, CA, USA) was used to analyze spatial data. Finally, the N inputs and outputs were calculated at the county level.
2.3. Nitrogen Balance
Nitrogen balance was calculated as the difference between total N input and total N output. According to the Organization of Economic Cooperation and Development (OECD) methodology and other studies, chemical fertilizers, irrigation water, atmospheric deposition, human and livestock manure, and biological N fixation are counted as inputs, whereas uptake through the removal of harvested food and fodder crops are counted as outputs [21,22,31,32]. The flow diagram of the study for estimating the N balance is shown below (Figure 2).
● Chemical fertilizers (Nchemical)
Chemical fertilizers are always considered the largest source of N in an agro-ecosystem, and chemical fertilizer N can come from both pure N fertilizers (Nnitrogen) and compound fertilizers (Ncompound). Compound fertilizers in north-eastern China contain N, P, and K in a 1.0:2.0:0.2 ratio [33]. Therefore, the N content of the compound fertilizers is 31%.
● Irrigation (Nirrigation)
Uplands accounted for 65% of the arable land on the Sanjiang Plain. Irrigation water always contains some N, mostly leached from fertilizers, and human and animal waste. Therefore, N concentrations are relatively high in all intensively cultivated regions [22,34]. The annual N input from irrigation (Nirrigation) was calculated by multiplying the irrigated area (Airrigation) by 27.25 kg/ha of N, which is the midpoint of the range of 25.8–28.7 kg/ha, as given by Li and Jin [33].
● Atmospheric deposition (wet/dry) (Natmospheric)
Atmospheric deposition, whether wet or dry, is an important source of N. Wet deposition delivers nutrients that are dissolved in precipitation, and the amount of N was estimated by multiplying the concentration of inorganic N in precipitation (7.57 kg/ha) by the cultivated land area (A) [33,35]. Dry deposition amounts are significant, but difficult to measure. According to the commonly used method of Lovett and Lindberg [36], total (wet + dry) N deposition is two times the wet deposition.
● Biological nitrogen fixation (Nbiofixation)
Nitrogen is also introduced into agricultural systems in significant quantities by symbiotic and non-symbiotic N fixation. In this study, only soybean was taken into account as a symbiotic N-fixing crop because the planted area of other symbiotic N-fixation crops was very small. The annual N-fixation rate of soybean was taken as 139.25 kg/ha (midpoint of 128.5–150 kg/ha) on the Sanjiang Plain [33,37]. The cultivation of rice and other non-leguminous crops is an additional source of N fixation by microorganisms. As suggested by Li and Jin [33], the annual rate of non-symbiotic N fixation in rice paddies was taken as 44.8 kg/ha and, in uplands, it was 15 kg/ha. Nitrogen input from biological N fixation for each crop was the product of the sowing area (Asoybean, Auplands and Apaddy) and the N fixation rates for each crop.
● Organic nitrogen (Norganic)
Organic N includes inputs from human and livestock waste recycled as manure and straw, and used to fertilize the soil. Human and animal waste in rural areas of China is commonly used as manure. The annual N input from human (Nhuman) or livestock (Nlivestock) manure is the product of the populations in rural areas of humans (Phuman) and livestock (Plivestock) and the amount of N excreted by each individual (E). According to studies by Bao et al. [21], Smil [34] and Xing and Yan [38], the mean annual values for this source of N are 5, 8, 40, and 5 kg/capita for humans, pigs, cattle, and sheep, respectively. According to Xing and Zhu [12], 40% of human and animal waste is used as manure and applied to crops. A conversion factor of 0.85 should be used to estimate the total rural adult population proportion of the total rural population.
The amount of N added to the land as manure in the form of straw (Nstraw) was estimated based on the concentration of N in crop residues (Ei), the proportion of straw returned to the field (Ri), the straw to grain yield ratio (Ki), and crop yield (Yi) of the four major crops (rice, wheat, maize and soybean) [21,33,38].
● Nitrogen output/crop harvesting (Nharvest)
Crop harvesting (both grain and crop straw were included) is the most important sink for N input and is the only output considered in this study. It was calculated by multiplying crop yield (Yi) by the N requirement (Ri) of the crop per unit yield [33]. Ten major crops were taken into account and their Ri was suggested by Li and Jin [33], Zheng et al. [24].
2.4. Nitrogen Surplus Intensity, Nitrogen Use Efficiency
The N surplus intensity of a county is defined as the N balance value divided by the arable land area of that county. A positive value for NSI indicates that residual N in the soils may constitute a potential environmental risk. Nitrogen use efficiency is defined as the fraction of N input harvested as a product. A higher NUE indicates that more N was used by the agro-ecosystem. Nitrogen use efficiency has been proposed as an indicator of progress in achieving the Sustainable Development Goals recently accepted by 193 member-countries of the United Nations General Assembly [7,24]. The international recommended value for NUE is 50–90%, and improving it is one of the most effective means of increasing crop productivity while decreasing environmental degradation [7,39]. However, an NUE of greater than 90% implies mining of N from the soil, which is caused by an inadequate N input and can lead to land degradation [39].
2.5. Statisical Analysis
Regression analyses were conducted between primary NUE, N input intensity and change, cultivated area percentages, area changes for different crops, and changes in NUE of the cropland between 2005 and 2015 on the Sanjiang Plain. The analyses were used to reveal the factors driving NUE change caused by variation in N input intensity and crop area percentage. All analyses were conducted using the software Stata (version 14.0; Stata MP, College Station, TX, USA).
2.6. Uncertainty Analysis of N Budgets
Since the parameters used in the study originated from literatures and were extrapolated to the Sanjiang Plain (N deposition rate and soybean N fixation rates were excluded because they were parameters directly related to the Sanjiang Plain), a sensitivity analysis was performed by Monte Carlo simulations in Crystal Ball software (Decisioneering, Inc., Denver, CO, USA) run 20,000 times for 2005 to quantify the overall uncertainty in N balance. For N content of compound fertilizer, a coefficient of variation (CV) of 5% was assumed. For irrigation N factor, the CV was assumed to be 45%. The CVs for both uplands and paddy field N fixation were assumed to be 35%, and for N excreted by human and livestock, CVs of 30% were assumed [40,41].
3. Results
3.1. Agricultural Development and Crop Yield
Although the general population increased from 7.2 × 10⁶ in 2005 to 7.4 × 10⁶ in 2010 and then decreased to 6.3 × 10⁶ in 2015, the rural population steadily decreased from 3.3 × 10⁶ in 2005 to 3.2 × 10⁶ in 2010, and 3.0 × 10⁶ in 2015. A decrease of the rural population isn’t usually beneficial to agricultural production. However, the cultivated land area and consumption of chemical fertilizers increased over the decade by 39.2% and 45.1%, respectively. The total production of major food grains, including maize, soybean, and rice, also increased from 7763.5 × 106 kg in 2005 to 18,464.8 × 106 kg in 2015 (Table 1), all of which indicated that agricultural activity on the Sanjiang Plain had substantially intensified.
On the Sanjiang Plain, the fertilizer N application rate increased from 82.6 kg/ha in 2005 to 86.2 kg/ha in 2015, a minor increase of 4.3%, in sharp contrast with the increase of chemical fertilizer N, which could be attributed to the reclamation of cultivated land. Correspondingly, the yields of major food grains (maize, soybean, and rice) increased from 4012.1 kg/ha in 2005 to 6616.5 kg/ha in 2015, an increase of 64.9% (Table 1).
3.2. Nitrogen Input, Output, and Agricultural Balance
Nitrogen input increased from 47.2 × 10⁴ t in 2005 to 58.8 × 10⁴ t in 2010, but then decreased to 51.5 × 10⁴ t in 2015. Chemical fertilizers and biological fixation were the two major sources of N, which together accounted for 77.5% of the total input in 2005, 76.5% in 2010, and 71.6% in 2015. Both the amount and the percentage of chemical fertilizer N increased over the period, and it became the largest N input in 2015, contributing51.0% of the total. However, biological N fixation, the largest source of N input in 2005, decreased from 18.5 × 10⁴ t in 2005 to 10.6 × 10⁴ t in 2015, which was a decrease of 42.7%. The proportion of biologically fixed N to the total input correspondingly decreased from 39.2% in 2005 to 20.6% in 2015. Total N output increased from 33.0 × 10⁴ t in 2005 to 44.8 × 10⁴ t in 2015, and the largest harvested crop N was 46.4 × 10⁴ t in 2010. Soybeans, maize, and rice were the three major N input sinks, accounting for 92.4% of the N in harvested crops in 2005, 94.8% in 2010, and 97.3% in 2015. Soybeans dominated total N output in 2005 and was displaced by maize in 2015.
Nitrogen budgets for croplands were constructed by calculating the difference between all N inputs and outputs. Although both N input and N output increased substantially between 2005 and 2015, the N budget decreased from 14.2 × 10⁴ t in 2005 to 6.7 × 10⁴ t in 2015, with N input exceeding N output by 43.0% in 2005 and by 15.0% in 2015. Correspondingly, NSI decreased continuously, from 65.0 kg/ha in 2005, to 43.5 kg/ha in 2010, and to 22.2 kg/ha in 2015. NUE increased continuously over the period, from 69.9% in 2005, to 78.8% in 2010, and to 86.9% in 2015 (Table 2). The region displayed a low surplus during the period.
3.3. Spatial Patterns of Nitrogen Use Efficiency and Nitrogen Surplus Intensity
Although NUE increased between 2005 and 2015 on the Sanjiang Plain, it varied widely among the counties, with ranges of 35.2–99.7% in 2005, 42.6–155.0% in 2010, and 19.0–145.8% in 2015. The NUE for 13 counties, which accounted for 63.6% of the arable land, was higher than 90% in 2015, compared to 11 counties in 2010, and five in 2005.
There was also an uneven spatial distribution for NSI at the county level. The figures ranged from 0.4 kg/ha to 177.6 kg/ha in 2005, −52.9 kg/ha to 175.1 kg/ha in 2010, and −55.2 kg/ha to 166.5 kg/ha in 2015. The spatial distributions for NSI and NUE on a county scale are shown in Figure 3.
3.4. Impacts of Agricultural Development on NUE
Regression analysis illustrated that the changes in NUE between 2005 and 2015 were negatively correlated with NUE in 2005 (p < 0.1), N input per unit area in 2005 (p < 0.1), and changes in N input per unit area between 2005 and 2015 (p < 0.01), but positively correlated with changes in the area percentage for maize (p < 0.1) (Table 3).
3.5. Uncertainty Analysis of N Budgets
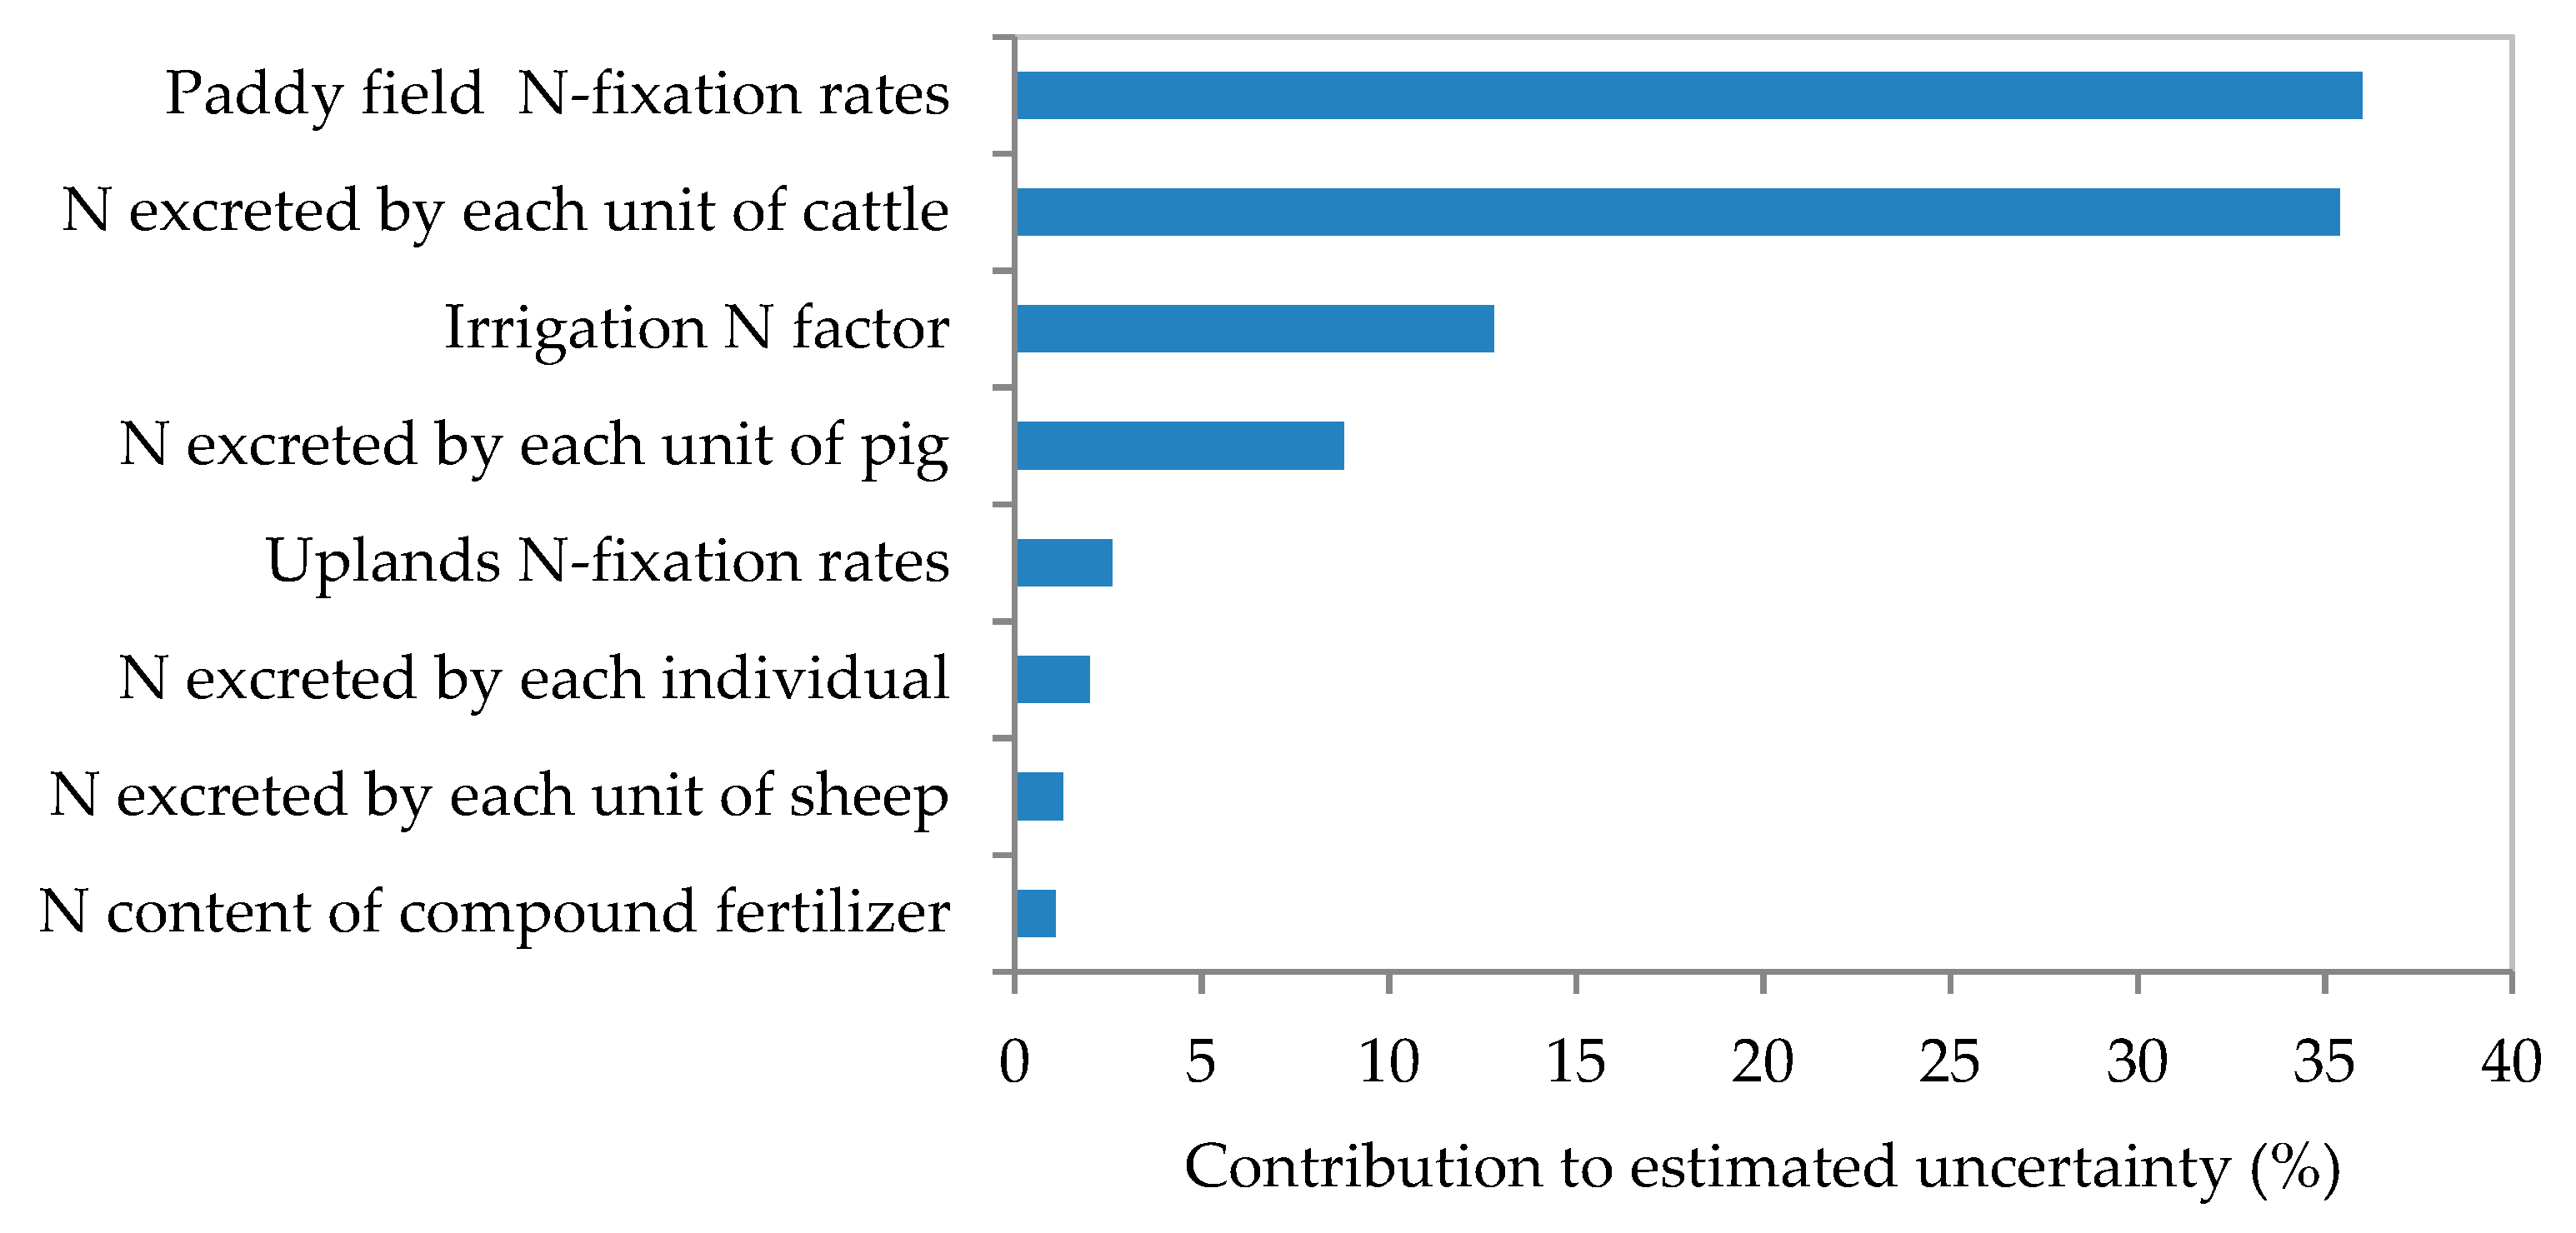
After running 20,000 Monte Carlo simulations, the average N budget was 14.2 × 10⁴ t with a 90% certainty range of 11.3–15.7 × 10⁴ t. Paddy field N-fixation rates and N excreted by each unit of cattle were two dominant variances, which accounted for 36.0% and 35.4% of the variability of the N budget, respectively (Figure 4).
4. Discussion
Although the N budget for farmland decreased between 2005 and 2015 on the Sanjiang Plain, it continued to be positive, which meant that excess N was lost to the environment. However, the N balance on the Sanjiang Plain was much less than that in the Changjiang and Haihe River basins [21,22,24]. The NSI for the Sanjiang Plain was much lower than that in the Haihe basin (158.8 kg N/ha in 2010), and the average NSIs for China (142.8 kg/ha in 2004 and 168.6 kg/ha in 2015) and the U.K. (51 kg/ha in 1995) [24,42,43]. It is also far below the standard limit (60 kg N/ha for sandy soils and 100 kg N/ha for clay soils) for nitrate leaching into groundwater and surface water on a regional or national scale [44]. Since N balance is positively related to chemical fertilizer input [31,45,46], the reduced NSI may be due to the low input of synthetic N fertilizers. The ratio of fertilizer N to total N input, which was 38.3–51.0% on the Sanjiang Plain, was much lower than in other Chinese provinces (except Tibet) [26]. Usually, about 70% of the N comes from chemical fertilizers in China [19,26]. Although the fertilizer N application rate increased by 4.3% over the ten years, it is markedly lower than the national average, and is also below the recommended rate for high yields [19].
Nitrogen use efficiency was 86.9% in 2015, which indicates that less than 15% of N input was lost in the agro-ecosystems. Previous studies revealed that NUE was 23% in the Changjiang River basin, and 42% in the Haihe basin [22,24], which were much less than NUE of the Sanjiang Plain. According to Smil [34], global NUE in crop biomass was 50% (46–56%) for all sources of N inputs. Research by Zhang et al. [7] showed that global average NUE in crop production needs to reach 70% by 2050 to meet the dual goals of food security and environmental stewardship. Alternatively, NUE only needs to rise to 60% in China due to large regional differences in crop production and China’s development stage. Therefore, at least to some extent, fertilizer N can increase crop production on the Sanjiang Plain while still minimizing the adverse environmental and health impacts of N. Compared to the North China Plain, the Sanjiang Plain has less N fertilizer utilization, which could result from higher soil fertility and long-term fertilization practices in the region. Figure 3 suggests that the spatial differences in NUE and NSI mean that N deficiency in croplands was more serious in 2015 than 2005. The internationally recommended value for NUE is 50–90% [7,39] and NUE of greater than 90% implies mining of N from the soil, which is caused by inadequate N inputs [39]. However, the results showed that 56.5% of the counties had NUE of more than 90% in 2015, whereas this figure was 21.7% in 2005 for the Sanjiang Plain. Although the total N content in the soil on the Sanjiang Plain was greater than that in other Chinese districts, the soil inorganic N content was insufficient to satisfy plant nutrient needs [25]. Furthermore, following wetland and forest reclamation, the soil N content decreased substantially [47]. Also, prolonged cultivation may have further decreased the stock of soil nutrients [48,49]. Previous results have showed significant decreases in the soil organic carbon density in the black soils of northeast China [50]. High-intensity agriculture and the decrease in soil N content mean that if the negative nutrient balances and mining of soil N continue, soil degradation is inevitable and will threaten long-term food production [27]. A NUE value of higher than 100% may be explained by the assumption of no changes in soil nitrogen stock in the study [4].
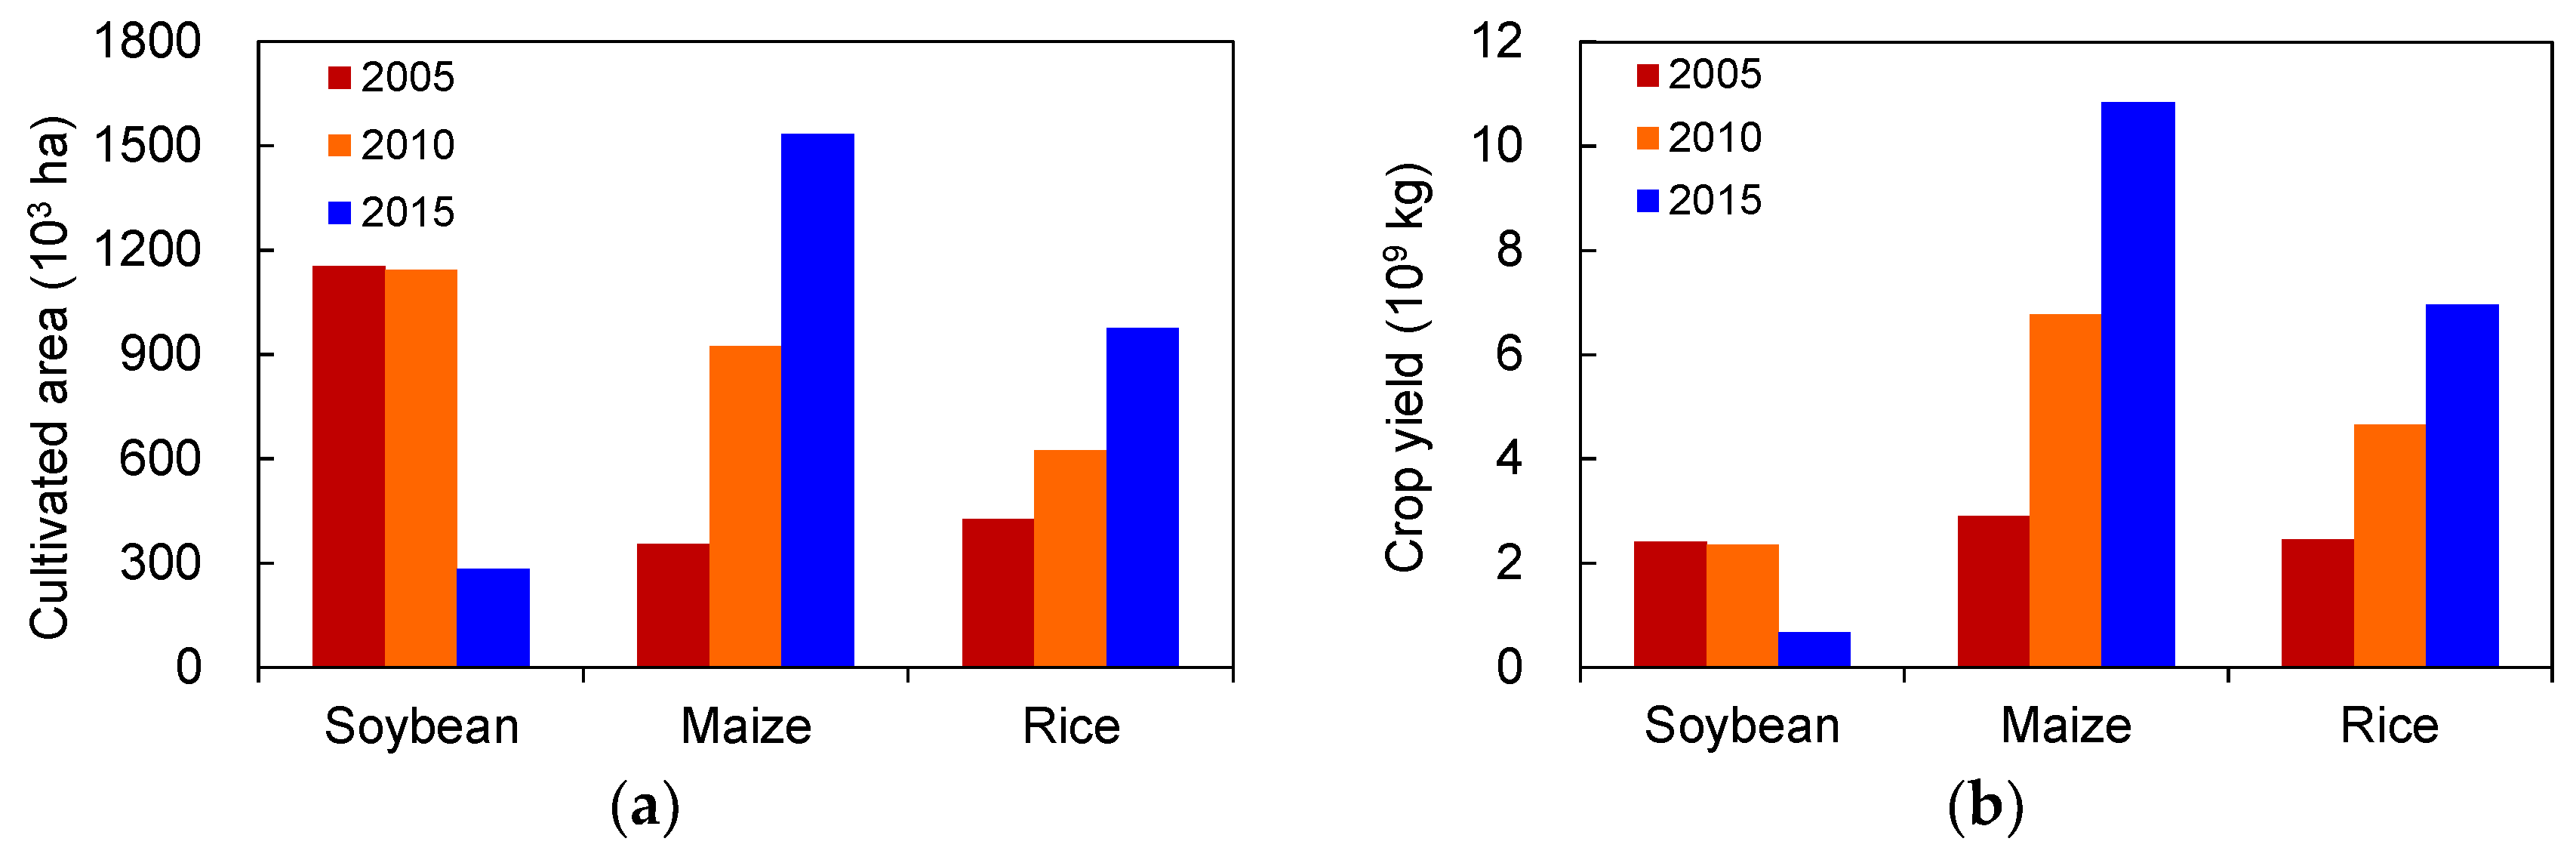
Regression analysis was used to illustrate the main factors influencing the changes in NUE. It indicated that the changes in NUE between 2005 and 2015 were positively correlated with changes in the area percentage of maize (p < 0.1), which implies that the spatial variation in NUE may be related to the rapid expansion of agriculture and changes in planting structure while inputs of chemical fertilizer N are maintained. In the decade from 2005 to 2015, the area under the three main crops (soybean, maize, and rice) on the Sanjiang Plain increased from 19.3 × 10⁵ ha to 27.9 × 10⁵ ha (a 44.2% increase), and the soybean, maize, and rice share of the total cultivated area increased from 88.5% in 2005 to 91.7% in 2015. Furthermore, food grain production increased by 34.0% over the same period. However, the area under soybean decreased by 75.6% from 2005 to 2015. Therefore, the rise in cultivated land is due to the sharp increases in the maize and rice areas (332.3% and 128.7%, respectively). The corresponding changes in the production of these three crops were −72.4%, 342.3%, and 140.0%, respectively (Figure 5). It is generally known that soybean can support itself through biological N fixation, whereas maize produces higher yields. However, increasing the area planted with maize requires more N fertilizer. The shift from soybean to maize may lead to the mining of soil N since the utilization rate for N fertilizer has not improved.
The driving forces behind this structural adjustment in planting were shifts in government policies. Since 2004, a series of policies were implemented in China to ensure stable grain production and to safeguard farmer interests, including food subsidies, abolishing agricultural taxes, and a minimum assured support price for food grains [51,52]. As a result, forest lands and wetlands were reclaimed and converted into cropland. Furthermore, since 1995, when China began importing soybean because of high production costs and the low oil yield of domestically produced soybean, the economic efficiency of soybean production has been lower than that of the major competing crops, such as maize and rice [53,54].
It is well known that accurate nutrient budgets for large regions are difficult to prepare. Firstly, it is difficult to measure N input from atmospheric deposition and biological N fixation, which explains why estimates were based on a number of parameters (Figure 4). However, parameter values were originally generated for different purposes. Furthermore, only the agro-ecosystem was taken into account, whereas forests, wetlands, and other ecosystems, which may also influence the N balance of an agro-ecosystem, were not included. However, to our knowledge, this study is the first attempt to quantify the N balance of the agro-ecosystem on the Sanjiang Plain and to analyze the impact of agricultural development on the N budget. The research suggests that high NUE and low NSI can threaten the sustainability of agriculture in the Sanjiang Plain due to degrading soil fertility and poor management caused by low fertilizer N inputs and high-intensity agriculture. The findings emphasize the importance of monitoring and assessing the impact of crop structure adjustment on N balance and soil fertility during agricultural development, which can help inform future efforts to support sustainable cropland management in similar areas of the world. Better management is urgently required to meet the nutrient needs of crops without adversely affecting the environment to ensure the sustainability of agriculture. There are many possible approaches to achieve this goal [24,33,47], such as the judicious application of chemical fertilizers targeted toward food productivity based on the characteristics of each crop; increasing applications of organic manure to replenish soil nutrients extracted during crop harvesting; and monitoring soil quality and nutrient losses. Attention should also be paid to other agricultural system outputs and their effects on factors such as air and water, biological diversity, and human health and well-being [4].
Author Contributions
C.Y. and H.Z. conceived and designed the research; C.Y., B.H. and R.L. analyzed the data and wrote the paper; H.Z., Z.O. and C.L. revised the paper; C.Y., H.Z., B.H., Z.O. and C.L. contributed materials; all authors read and approved the paper.
Funding
This research was funded by the National Natural Science Foundation of China (No. 41871218) and the National Key Research and Development Program of China (No. 2016YFC0503401).
Conflicts of Interest
The authors declare no conflict of interest.
References
- Cui, Z.; Zhang, H.; Chen, X.; Zhang, C.; Ma, W.; Huang, C.; Zhang, W.; Mi, G.; Miao, Y.; Li, X.; et al. Pursuing sustainable productivity with millions of smallholder farmers. Nature 2018, 555, 363–366. [Google Scholar] [CrossRef] [PubMed]
- Chen, X.; Cui, Z.; Fan, M.; Vitousek, P.; Zhao, M.; Ma, W.; Wang, Z.; Zhang, W.; Yan, X.; Yang, J.; et al. Producing more grain with lower environmental costs. Nature 2014, 514, 486–489. [Google Scholar] [CrossRef] [PubMed]
- Vitousek, P.M.; Naylor, R.; Crews, T.; David, M.B.; Drinkwater, L.E.; Holland, E.; Johnes, P.J.; Katzenberger, J.; Martinelli, L.A.; Matson, P.A.; et al. Nutrient imbalances in agricultural development. Science 2009, 324, 1519–1520. [Google Scholar] [CrossRef] [PubMed]
- Özbek, F.Ş.; Leip, A. Estimating the gross nitrogen budget under soil nitrogen stock changes: A case study for Turkey. Agric. Ecosyst. Environ. 2015, 205, 48–56. [Google Scholar] [CrossRef]
- Li, J.; He, Z.B.; Du, J.; Zhao, L.W.; Chen, L.F.; Zhu, X.; Lin, P.F.; Fang, S.; Zhao, M.M.; Tian, Q.Y. Regional Variability of Agriculturally-Derived Nitrate-Nitrogen in Shallow Groundwater in China, 2004–2014. Sustainability 2018, 10, 1393. [Google Scholar] [CrossRef]
- Ju, X.T.; Xing, G.X.; Chen, X.P.; Zhang, S.L.; Zhang, L.J.; Liu, X.J.; Cui, Z.L.; Yin, B.; Christie, P.; Zhu, Z.L.; et al. Reducing environmental risk by improving N management in intensive Chinese agricultural systems. Proc. Natl. Acad. Sci. USA 2009, 106, 3041–3046. [Google Scholar] [CrossRef] [PubMed] [Green Version]
- Zhang, X.; Davidson, E.A.; Mauzerall, D.L.; Searchinger, T.D.; Dumas, P.; Shen, Y. Managing nitrogen for sustainable development. Nature 2015, 528, 51–59. [Google Scholar] [CrossRef] [PubMed] [Green Version]
- Pan, D.; Kong, F.; Zhang, N.; Ying, R. Knowledge training and the change of fertilizer use intensity: Evidence from wheat farmers in China. J. Environ. Manag. 2017, 197, 130–139. [Google Scholar] [CrossRef] [PubMed]
- Zhu, Z.L.; Chen, D.L. Nitrogen fertilizer use in China—Contributions to food production, impacts on the environment and best management strategies. Nutr. Cycl. Agroecosyst. 2002, 63, 117–127. [Google Scholar] [CrossRef]
- Guo, L.; Yang, R.; Wang, D. A study on the spatial difference of farmland nitrogen nutrient budget in the Bohai Rim region, China. J. Geogr. Sci. 2012, 22, 761–768. [Google Scholar] [CrossRef]
- Sun, S.; Delgado, M.S.; Sesmero, J.P. Dynamic adjustment in agricultural practices to economic incentives aiming to decrease fertilizer application. J. Environ. Manag. 2016, 177, 192–201. [Google Scholar] [CrossRef] [PubMed]
- Kintl, A.; Elbl, J.; Lošák, T.; Vaverková, M.D.; Nedělník, J. Mixed Intercropping of Wheat and White Clover to Enhance the Sustainability of the Conventional Cropping System: Effects on Biomass Production and Leaching of Mineral Nitrogen. Sustainability 2018, 10, 336. [Google Scholar] [CrossRef]
- Cobo, J.G.; Dercon, G.; Cadisch, G. Nutrient balances in African land use systems across different spatial scales: A review of approaches, challenges and progress. Agric. Ecosyst. Environ. 2010, 136, 1–15. [Google Scholar] [CrossRef] [Green Version]
- Ha, N.; Feike, T.; Back, H.; Xiao, H.; Bahrs, E. The effect of simple nitrogen fertilizer recommendation strategies on product carbon footprint and gross margin of wheat and maize production in the North China Plain. J. Environ. Manag. 2015, 163, 146–154. [Google Scholar] [CrossRef] [PubMed]
- Liang, B.; Kang, L.; Ren, T.; Junliang, L.; Chen, Q.; Wang, J. The impact of exogenous N supply on soluble organic nitrogen dynamics and nitrogen balance in a greenhouse vegetable system. J. Environ. Manag. 2015, 154, 351–357. [Google Scholar] [CrossRef] [PubMed]
- Nilahyane, A.; Islam, M.A.; Mesbah, A.O.; Garcia, A.G. Evaluation of Silage Corn Yield Gap: An Approach for Sustainable Production in the Semi-Arid Region of USA. Sustainability 2018, 10, 252. [Google Scholar] [CrossRef]
- Shindo, J. Changes in the nitrogen balance in agricultural land in Japan and 12 other Asian Countries based on a nitrogen-flow model. Nutr. Cycl. Agroecosyst. 2012, 94, 47–61. [Google Scholar] [CrossRef]
- Van Breemen, N.; Boyer, E.W.; Goodale, C.L.; Jaworski, N.A.; Paustian, K.; Lajtha, K.; Mayer, B.; Van Dam, D.; Howarth, R.W.; Nadelhoffer, K.J.; et al. Where did all the nitrogen inputs go? Fate of nitrogen in the northeastern. Biogeochemistry 2002, 57/58, 267–293. [Google Scholar] [CrossRef]
- Xiong, Z.Q.; Freney, J.R.; Mosier, A.R.; Zhu, Z.L.; Lee, Y.; Yagi, K. Impacts of population growth, changing food preferences and agricultural practices on the nitrogen cycle in East Asia. Nutr. Cycl. Agroecosyst. 2008, 80, 189–198. [Google Scholar] [CrossRef]
- Dhakal, D.; Islam, M.A. Grass-Legume Mixtures for Improved Soil Health in Cultivated Agroecosystem. Sustainability 2018, 10, 2718. [Google Scholar] [CrossRef]
- Bao, X.; Watanabe, M.; Wang, Q.; Hayashi, S.; Liu, J. Nitrogen budgets of agricultural fields of the Changjiang River basin from 1980 to 1990. Sci. Total Environ. 2006, 363, 136–148. [Google Scholar] [CrossRef] [PubMed]
- Liu, C.; Watanabe, M.; Wang, Q. Changes in nitrogen budgets and nitrogen use efficiency in the agroecosystems of the Changjiang River basin between 1980 and 2000. Nutr. Cycl. Agroecosyst. 2008, 80, 19–37. [Google Scholar] [CrossRef]
- Xing, G.X.; Zhu, Z.L. Regional nitrogen budgets for China and its major watersheds. Biogeochemistry 2002, 57/58, 405–427. [Google Scholar] [CrossRef]
- Zheng, M.; Zheng, H.; Wu, Y.; Xiao, Y.; Du, Y.; Xu, W.; Lu, F.; Wang, X.; Ouyang, Z. Changes in nitrogen budget and potential risk to the environment over 20 years (1990–2010) in the agroecosystems of the Haihe Basin, China. J. Environ. Sci. 2015, 28, 195–202. [Google Scholar] [CrossRef] [PubMed]
- Wang, Y.Y.; Yang, Q.; Wang, R.S. Simulating study on nitrogen circulation of soybean field in the Sanjiang Plain. Sci. Geogr. Sin. 1999, 19, 555–558. (In Chinese) [Google Scholar]
- Fang, Y.D.; Feng, Z.M.; Hu, Y.C.; Wang, L.L. Balance of field nitrogen nutrient input/output using GIS technology in China. Trans. Chin. Soc. Agric. Eng. 2007, 23, 35–41. (In Chinese) [Google Scholar]
- Sheldrick, W.F.; Syers, J.K.; Lingard, J. A conceptual model for conducting nutrient audits at national, regional, and global scales. Nutr. Cycl. Agroecosyst. 2002, 62, 61–72. [Google Scholar] [CrossRef]
- Szalińska, E.; Orlińska-Woźniak, P.; Wilk, P. Nitrate Vulnerable Zones Revision in Poland—Assessment of Environmental Impact and Land Use Conflicts. Sustainability 2018, 10, 3297. [Google Scholar] [CrossRef]
- Yu, H.; He, Z.; Pan, X. Wetlands shrink simulation using Cellular Automata: A case study in Sanjiang Plain, China. Procedia Environ. Sci. 2010, 2, 25–233. [Google Scholar] [CrossRef]
- Wang, Z.; Zhang, B.; Zhang, S.; Li, X.; Liu, D.; Song, K.; Li, J.; Li, F.; Duan, H. Changes of land use and of ecosystem service values in sanjiang plain, northeast china. Environ. Monit. Assess. 2006, 112, 69–91. [Google Scholar] [CrossRef] [PubMed]
- Cao, N.; Qu, D.; Chen, X.P.; Zhang, F.S.; Fan, M.S. Analysis of the contribution to non-point pollution made by balanced fertilizer in Northeast China. J. Northwest A&F Univ. (Nat. Sci. Ed.) 2006, 34, 127–133. (In Chinese) [Google Scholar]
- OECD. Environmental Performance of Agriculture in OECD Countries Since 1990; OECD: Paris, France, 2008; p. 575. [Google Scholar]
- Li, S.T.; Jin, J.Y. Characteristics of nutrient input/output and nutrient balance in different regions of China. Sci. Agric. Sin. 2011, 44, 4207–4229. (In Chinese) [Google Scholar]
- Smil, V. Nitrogen in crop production: An account of global flows. Glob. Biogeochem. Cycl. 1999, 13, 647–662. [Google Scholar] [CrossRef] [Green Version]
- Sun, Z.G.; Liu, J.S. Nitrogen cycling of atmosphere-plant-soil system in the typical Calamagrostis angustifolia wetland in the Sanjiang Plain, Northeast China. J. Environ. Sci. 2007, 19, 986–995. [Google Scholar] [CrossRef] [Green Version]
- Lovett, G.M.; Lindberg, S.E. Atmospheric deposition and canopy interactions of nitrogen in forests. Can. J. For. Res. 1993, 23, 1603–1616. [Google Scholar] [CrossRef]
- Lu, R.K.; Liu, H.X.; Wen, D.Z.; Qin, S.W.; Zheng, J.Y.; Wang, Z.Q. Nutrient cycling and balance of agricultural ecosystem in different typical regions of China II: Parameters of nutrient input to farmland, Chin. J. Soil Sci. 1996, 27, 151–154. (In Chinese) [Google Scholar]
- Xing, G.X.; Yan, X.Y. Direct nitrous oxide emissions from agricultural fields in China estimated by the revised 1996 IPPC guidelines for national greenhouse gases. Environ. Sci. Policy 1999, 2, 355–361. [Google Scholar] [CrossRef]
- Ju, X.T.; Gu, B.J. Indexes of nitrogen management. Acta Pedol. Sin. 2017, 54, 281–296. (In Chinese) [Google Scholar]
- Ti, C.T.; Pan, J.J.; Xia, Y.Q.; Yan, X.Y. A nitrogen budget of mainland China with Spatial and temporal variation. Biogeochemistry 2012, 108, 381–394. [Google Scholar] [CrossRef]
- Wang, L.J.; Zheng, H.; Zhao, H.; Robinson, B.E. Nitrogen balance dynamics during 2000–2010 in the Yangtze River Basin croplands, with special reference to the relative contributions of cropland area and synthetic fertilizer N application rate changes. PLoS ONE 2017, 12, e0180613. [Google Scholar] [CrossRef] [PubMed]
- Lord, E.I.; Anthony, S.G.; Goodlass, G. Agricultural nitrogen balance and water quality in the UK. Soil Use Manag. 2002, 18, 363–369. [Google Scholar] [CrossRef]
- Sun, B.; Shen, R.P.; Bouwman, A.F. Surface N Balances in Agricultural Crop Production Systems in China for the Period 1980–2015. Pedosphere 2008, 18, 304–315. [Google Scholar] [CrossRef]
- Hou, Y.; Gao, Z.; Heimann, L.; Roelcke, M.; Ma, W.; Nieder, R. Nitrogen balances of smallholder farms in major cropping systems in a peri-urban area of Beijing, China. Nutr. Cycl. Agroecosyst. 2012, 92, 347–361. [Google Scholar] [CrossRef]
- Qiu, J.J.; Li, H.; Wang, L.G. Simulation of nitrogen level and balance in Cropland in China. Trans. Chin. Soc. Agric. Eng. 2008, 24, 40–44. (In Chinese) [Google Scholar]
- Wang, X.; Feng, A.; Wang, Q.; Wu, C.; Liu, Z.; Ma, Z.; Wei, X. Spatial variability of the nutrient balance and related NPSP risk analysis for agro-ecosystems in China in 2010. Agric. Ecosyst. Environ. 2014, 193, 42–52. [Google Scholar] [CrossRef]
- Zeng, X.B.; Huang, X.X.; Liu, Z.G.; Li, L.F.; Yang, J.B. Effects of the period of wetland reclamation on the character of soil profiles, C and N contents in Sanjing Plain. Sci. Agric. Sin. 2006, 39, 1186–1195. (In Chinese) [Google Scholar]
- Ouyang, W.; Xu, Y.; Hao, F.; Wang, X.; Siyang, C.; Lin, C. Catena Effect of long-term agricultural cultivation and land use conversion on soil nutrient contents in the Sanjiang Plain. Catena 2013, 104, 243–250. [Google Scholar] [CrossRef]
- Sun, Z.G.; Liu, J.S.; Li, X.H. Changes of nitrogen storage in soil under different land uses in the Sangjiang Plain. Syst. Sci. Compr. Stud. Agric. 2008, 24, 270–274. (In Chinese) [Google Scholar]
- Yu, Y.; Guo, Z.; Wu, H.; Kahmann, J.A.; Oldfield, F. Spatial changes in soil organic carbon density and storage of cultivated soils in China from 1980 to 2000. Glob. Biogeochem. Cycl. 2009, 23, GB2021. [Google Scholar] [CrossRef]
- Song, K.S.; Liu, D.W.; Wang, Z.M.; Zhang, B.; Jin, C.; Li, F.; Liu, H.J. Analysis of cultivated land dynamics in the past 50 years in Sanjiang Plain and its driving forces. J. Soil Water Conserv. 2008, 22, 75–81. (In Chinese) [Google Scholar]
- Zhang, H.Q.; Ma, F.C. Fluctuation analysis and evaluation of grain production in Heilongjiang Province. J. Heilongjiang Bayi Agric. Univ. 2013, 25, 97–101. (In Chinese) [Google Scholar]
- Li, X.Z.; Qiao, J. Fluctuation of soybean sowing area in Northeast China and cause analysis. Xinjiang State Farms Econ. 2009, 4, 6–12. (In Chinese) [Google Scholar]
- Yu, J.B.; Qiao, J.; Qiao, Y.L. On soybean industry development under import impact in China. Res. Agric. Mod. 2005, 26, 213–216. (In Chinese) [Google Scholar]
Figure 1.
Location of the Sanjiang Plain, China.
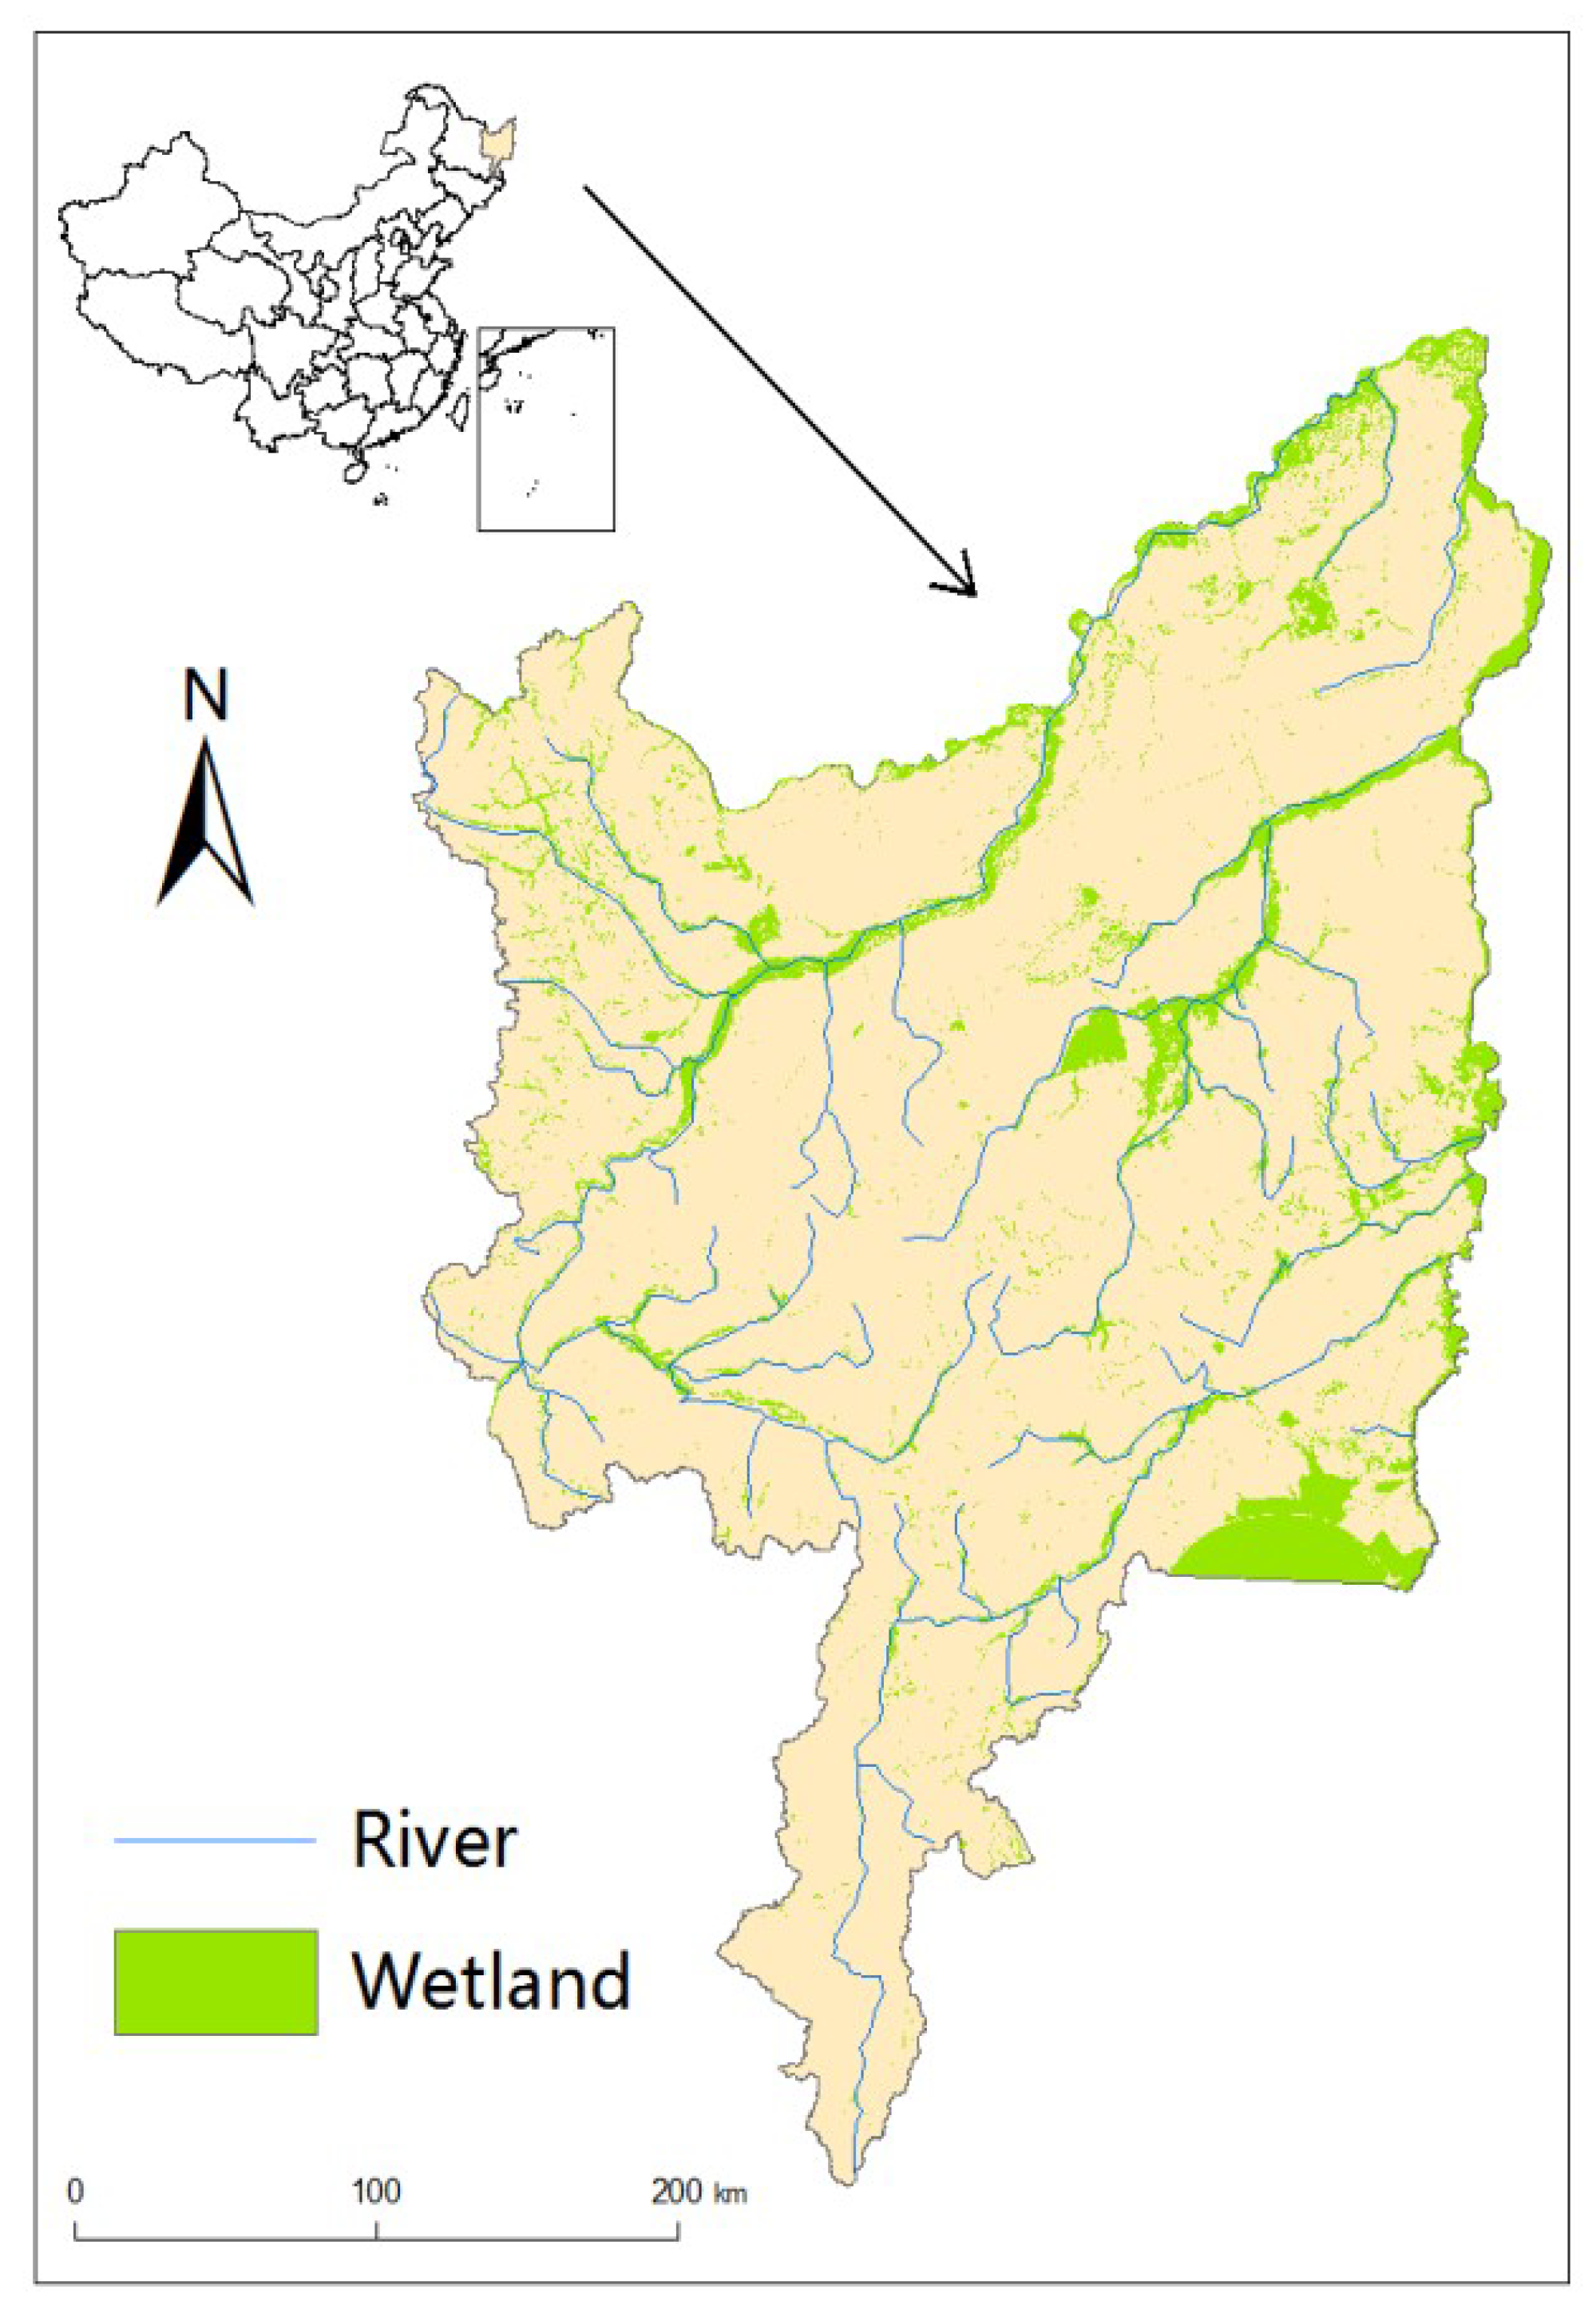
Figure 2.
The conceptual diagram of the N balance model.
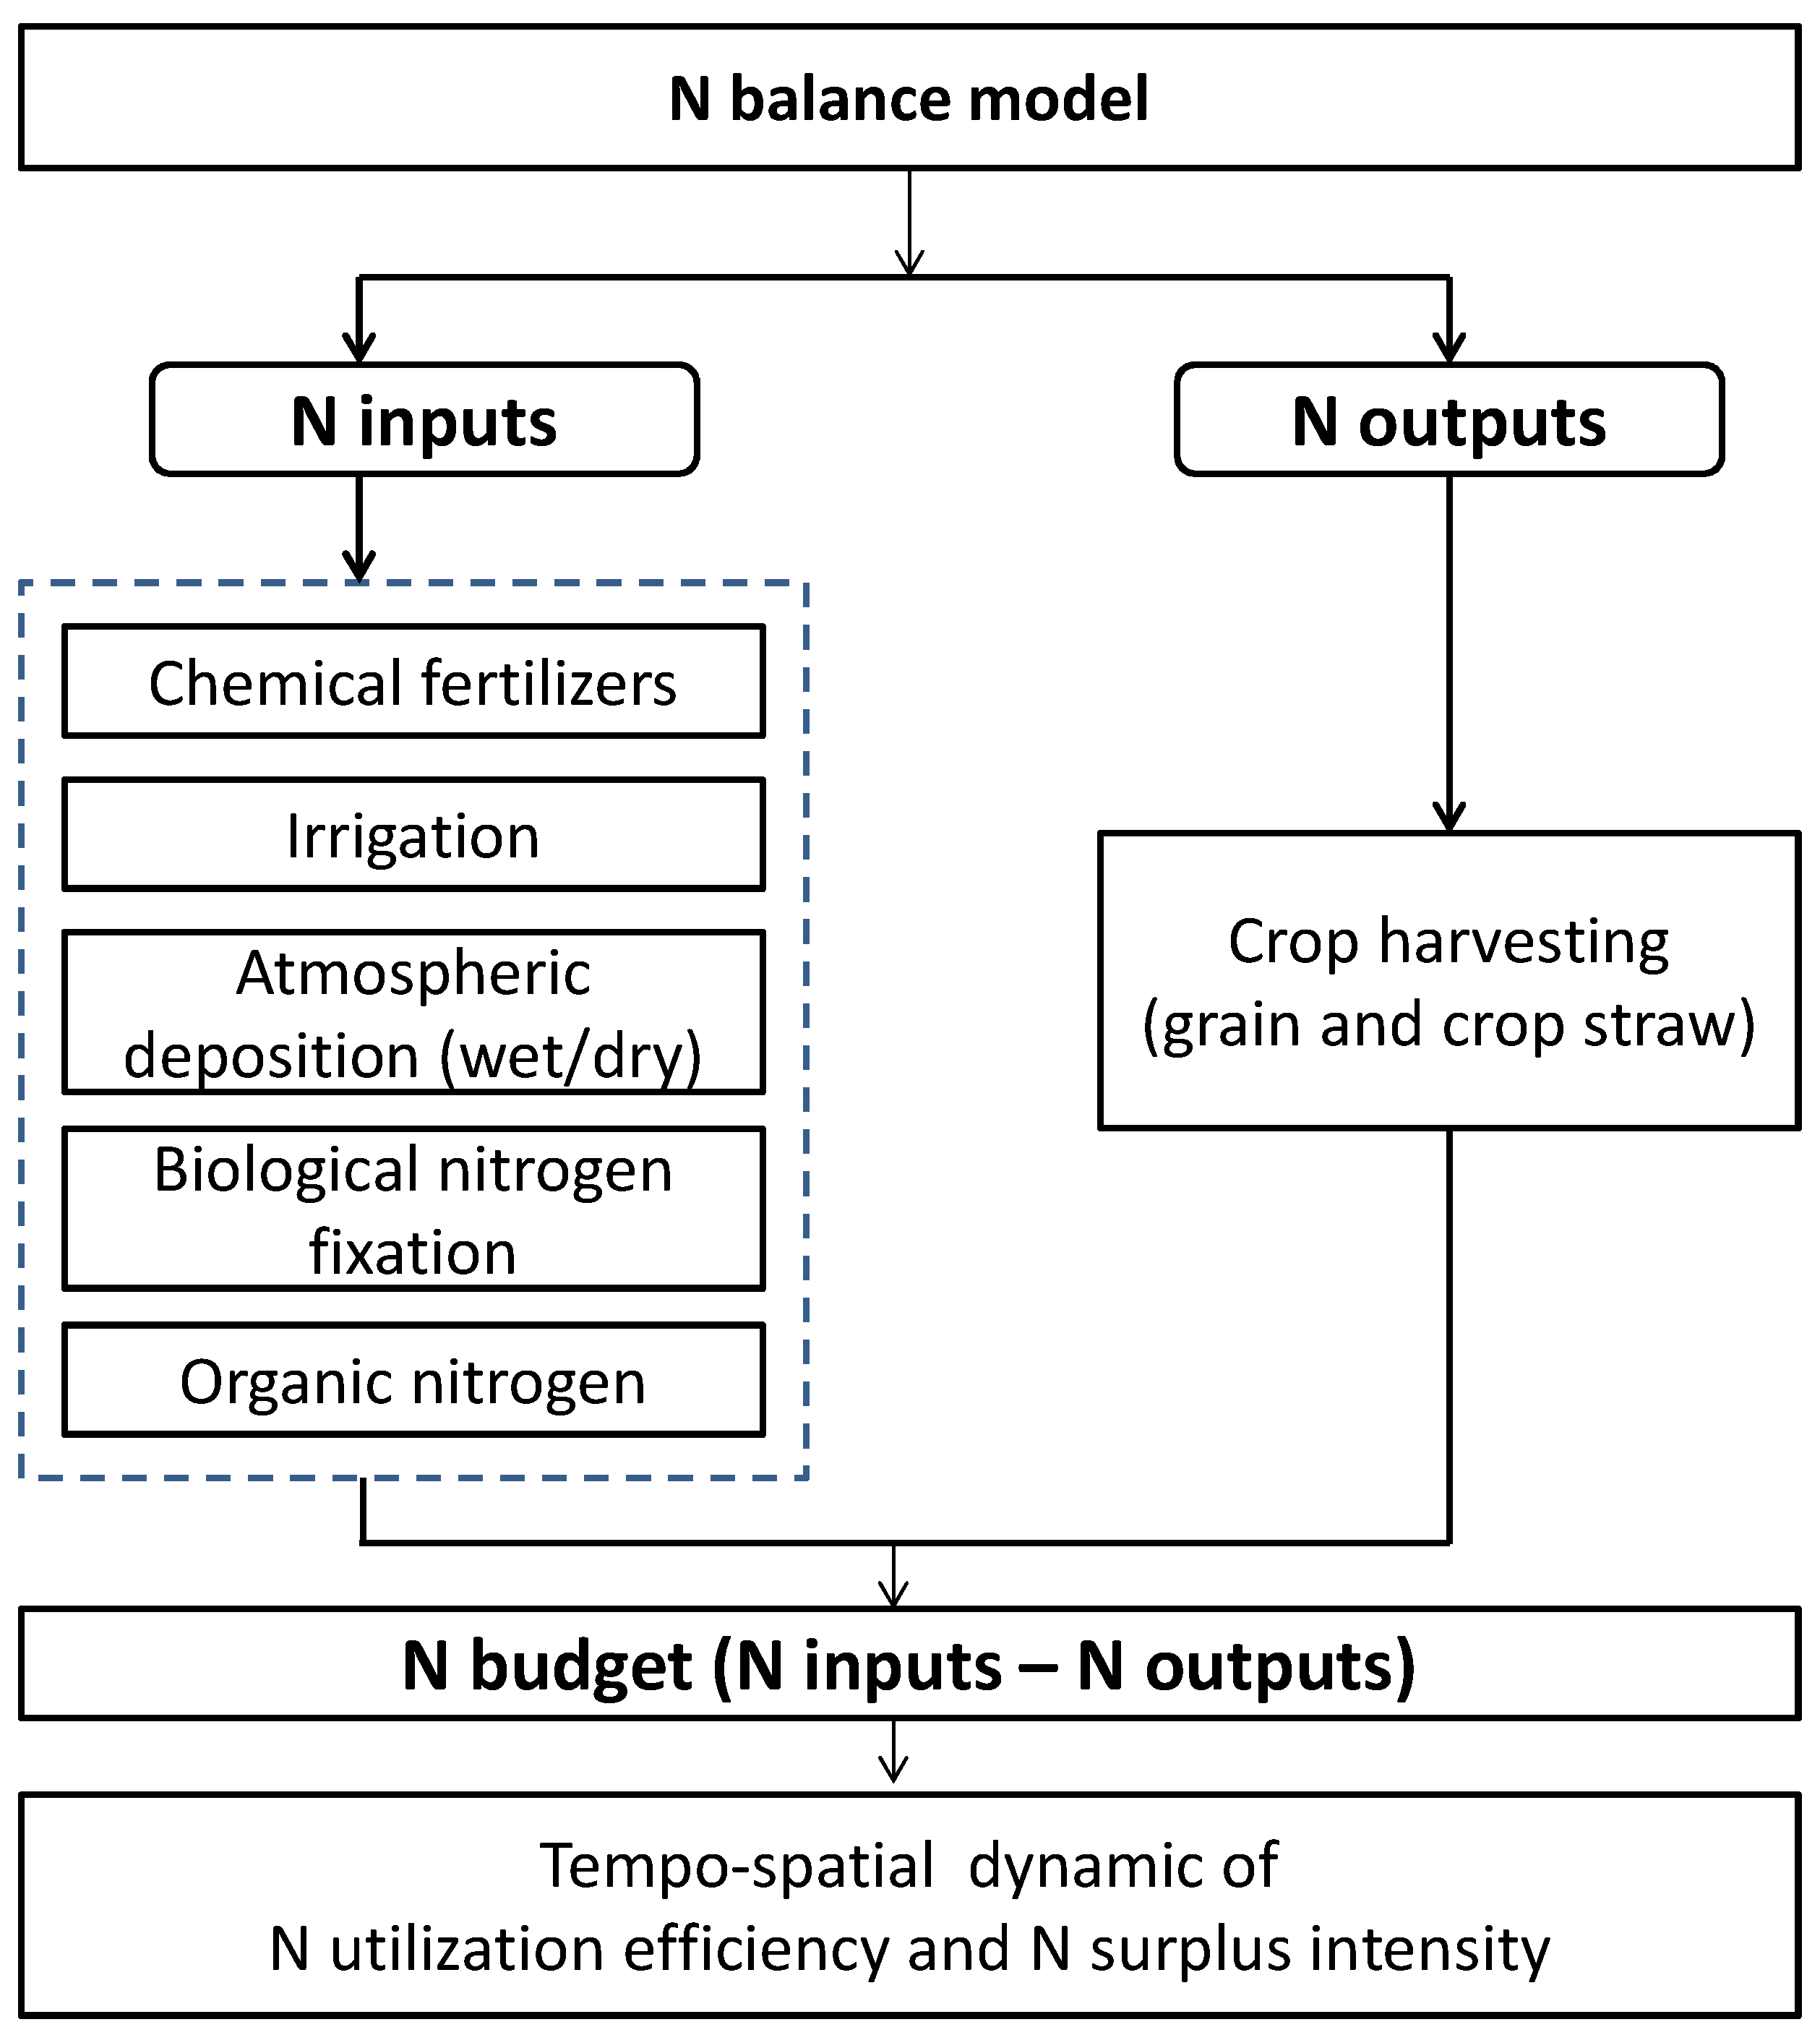
Figure 3.
Nitrogen surplus intensity (NSI, kg/ha) (a) 2005, (b) 2010, (c) 2015, and nitrogen use efficiency (NUE) (d) 2005, (e) 2010, (f) 2015.
Figure 3.
Nitrogen surplus intensity (NSI, kg/ha) (a) 2005, (b) 2010, (c) 2015, and nitrogen use efficiency (NUE) (d) 2005, (e) 2010, (f) 2015.

Figure 4.
Contributions of parameters to variability of N budget of 2005.

Figure 5.
Cultivated area (a) and yield (b) of soybean, maize, and rice on the Sanjiang Plain in 2005, 2010, and 2015.
Figure 5.
Cultivated area (a) and yield (b) of soybean, maize, and rice on the Sanjiang Plain in 2005, 2010, and 2015.

Table 1.
Population, cultivated land area, consumption of chemical fertilizers, and crop production in 2005, 2010, and 2015 on the Sanjiang Plain.
Table 1.
Population, cultivated land area, consumption of chemical fertilizers, and crop production in 2005, 2010, and 2015 on the Sanjiang Plain.
| Parameter | 2005 | 2010 | 2015 | 2015–2005 (%) |
|---|---|---|---|---|
| Population (106) | 7.2 | 7.4 | 6.3 | −12.7 |
| Rural population (106) | 3.3 | 3.2 | 3.0 | −11.1 |
| Livestock population (cattle, pigs, sheep) (106) | 7.0 | 8.3 | 8.5 | 20.6 |
| Cultivated land area (105 ha) | 21.9 | 28.6 | 30.4 | 39.2 |
| Chemical fertilizers (104 t N) | 18.1 | 24.9 | 26.2 | 45.1 |
| Total food grain production (106 kg) | 7763.5 | 13,783.0 | 18,464.8 | 137.8 |
| Productivity of food grains (kg/ha) | 4012.1 | 5120.2 | 6616.5 | 64.9 |
| N fertilizer rate (kg/ha) | 82.6 | 86.9 | 86.2 | 4.3 |
Data was collected from the Chinese Academy of Agricultural Sciences.
Table 2.
Estimated inputs and outputs for agricultural nitrogen on the Sanjiang Plain.
| N Budget Term | 2005 | 2010 | 2015 | |||
|---|---|---|---|---|---|---|
| Amount (104 t N) | % of Input | Amount (104 t N) | % of Input | Amount (104 t N) | % of Input | |
| Input | ||||||
| Chemical fertilizers | 18.1 | 38.3 | 24.9 | 42.3 | 26.2 | 51.0 |
| Irrigation | 0.9 | 1.9 | 1.7 | 2.9 | 2.2 | 4.2 |
| Atmospheric deposition | 3.3 | 7.0 | 4.3 | 7.3 | 4.6 | 9.0 |
| Biological fixation | 18.5 (17.3–19.7) | 39.2 | 20.11 (18.9–21.3) | 34.2 | 10.6 (10.3–10. 9) | 20.6 |
| Non-symbiotic | 2.4 | 4.2 | 6.7 | |||
| Symbiotic | 16.1 (14.8–17.3) | 15.9 (14.7–17.2) | 3.9 (3.6–4.2) | |||
| Recycled N | 6.4 | 13.6 | 7.8 | 13.3 | 7.9 | 15.4 |
| Animal waste | 3.8 | 4.1 | 4.0 | |||
| Human waste | 0.6 | 0.6 | 0.2 | |||
| Crop residue | 2.1 | 3.2 | 3.7 | |||
| Total input | 47.2 (46.0–48.4) | 58.8 (57.6–60.1) | 51.5 (51.2–51.8) | |||
| Output | ||||||
| Harvested crops | ||||||
| Wheat | 0.3 | 0.02 | 0 | |||
| Maize | 6.3 | 17.5 | 28.0 | |||
| Rice | 4.2 | 6.8 | 10.2 | |||
| Soybeans | 20.0 | 19.7 | 5.4 | |||
| Tuber crops | 0.1 | 0.1 | 0.3 | |||
| Oil crops | 0.4 | 1.3 | 0.3 | |||
| Sugar beet | 0.2 | 0.1 | 0 | |||
| Tobacco | 0.1 | 0.2 | 0.1 | |||
| Vegetables | 1.4 | 0.7 | 0.5 | |||
| Fruits | 0.1 | 0.2 | 0.02 | |||
| Total output | 33.0 | 46.4 | 44.8 | |||
| Budget (input–output) | 14.2 | 12.4 | 6.7 | |||
| Nitrogen surplus intensity (kg/ha) | 65.0 | 43.5 | 22.2 | |||
| Nitrogen use efficiency (%) | 69.9 | 78.8 | 86.9 | |||
Any data error is caused by rounding.
Table 3.
Factors associated with the NUE changes in cropland between 2005 and 2015 on the Sanjiang Plain.
Table 3.
Factors associated with the NUE changes in cropland between 2005 and 2015 on the Sanjiang Plain.
| Coefficients | Standard Error | |
|---|---|---|
| Constant | 92.020 | 86.834 |
| NUE in 2005 | −0.990 * | 0.393 |
| N input per unit area in 2005 | −0.372 * | 0.161 |
| Change in N input per unit area between 2005 and 2015 | −0.341 *** | 0.081 |
| Area percentage under soybean in 2005 | 0.552 | 1.138 |
| Change in area percentage under soybean between 2005 and 2015 | 0.446 | 0.938 |
| Area percentage under rice in 2005 | 0.416 | 0.699 |
| Change in area percentage under rice between 2005 and 2015 | 0.164 | 0.543 |
| Area percentage under maize in 2005 | 1.092 | 1.119 |
| Change in area percentage under maize between 2005 and 2015 | 0.781 † | 0.424 |
| R2 | 0.554 | - |
| N | 22 | - |
Unit of analysis is the county. Dependent variable is NUE change between 2005 and 2015. Model results passed standard regression diagnostics. † p < 0.1; * p < 0.05; ** p < 0.01; *** p < 0.001.
© 2018 by the authors. Licensee MDPI, Basel, Switzerland. This article is an open access article distributed under the terms and conditions of the Creative Commons Attribution (CC BY) license (http://creativecommons.org/licenses/by/4.0/).
Share and Cite
MDPI and ACS Style
Yang, C.; Zheng, H.; Huang, B.; Li, R.; Ouyang, Z.; Li, C. Crop Structure Changes Altered the Cropland Nitrogen Balance between 2005 and 2015 on the Sanjiang Plain, China. Sustainability 2018, 10, 4011. https://doi.org/10.3390/su10114011
AMA Style
Yang C, Zheng H, Huang B, Li R, Ouyang Z, Li C. Crop Structure Changes Altered the Cropland Nitrogen Balance between 2005 and 2015 on the Sanjiang Plain, China. Sustainability. 2018; 10(11):4011. https://doi.org/10.3390/su10114011
Chicago/Turabian StyleYang, Chunxia, Hua Zheng, Binbin Huang, Ruonan Li, Zhiyun Ouyang, and Cong Li. 2018. "Crop Structure Changes Altered the Cropland Nitrogen Balance between 2005 and 2015 on the Sanjiang Plain, China" Sustainability 10, no. 11: 4011. https://doi.org/10.3390/su10114011
Note that from the first issue of 2016, this journal uses article numbers instead of page numbers. See further details here.