A Cloud-Based Digital Farm Management System for Vegetable Production Process Management and Quality Traceability


1
College of Economics and Management, China Agricultural University, Beijing 100083, China
2
Beijing Research Center for Information Technology in Agriculture, Beijing 100097, China
*
Authors to whom correspondence should be addressed.
Sustainability 2018, 10(11), 4007; https://doi.org/10.3390/su10114007
Submission received: 2 September 2018
/
Revised: 14 October 2018
/
Accepted: 30 October 2018
/
Published: 1 November 2018
(This article belongs to the Special Issue Sustainable Crop Production Systems)
Abstract
:Farm Management Information Systems (FMISs) are being expanded to improve operation efficiency, reduce inputs, and ensure compliance with standards and regulations. However, this goal is difficult to attain in the vegetable sector, where data acquisition is time-consuming and data at different stages is fragmented by the potential diversity of crops and multiple batches cultivated at any given farm. This applies, in particular, to farms in China, which have small areas and low degrees of mechanization. This study presents an integrated approach to track and trace production efficiently through our Digital Farm Management System (DFMS), which adopts the cloud framework and utilizes Quick Response (QR) codes and Radio Frequency Identification (RFID) technology. Specifically, a data acquisition system is proposed that runs on a smartphone for the efficient gathering of planting information in the field. Moreover, DFMS generates statistics and analyses of planting areas, costs, and yields. DFMS meets the FMIS requirements and provides the accurate tracking and tracing of the production for each batch in an efficient manner. The system has been applied in a large-scale vegetable production enterprise, consisting of 12 farms distributed throughout China. This application shows that DFMS is a highly efficient solution for precise vegetable farm management.
1. Introduction
Under the pressure of increasing food safety requirements, increasing labor costs, and environmental deterioration, the main task of farm management has developed from the simple pursuit of large yields, into the arguably more complex pursuit of quality and efficiency [1,2,3]. Additionally, in today’s competitive environment, most farming enterprises are shifting from simple production units towards agricultural businesses with multifunctional service sectors [4]. Their farm management deals with the organization and operation of the farm, traceability and consumer requirements, agricultural policies, environmental requirements, global trade, and the multi-functionality of agricultural enterprises as a whole [5].
In China, presently, there is a clear development tendency from scattered smallholder farming toward large-scale intensive farms, with the promotion of farmland circulation [6]. More and more farms are adopting standards to improve the quality of the foods produced [7]. Piecework systems are generally adopted to improve production efficiency. However, due to the scattered farmland structure and low per capita occupancy, the operation scale of Chinese agricultural enterprises still remains smaller than in developed countries. Scattered smallholders provide the main organization form of agricultural production and management, and farm managers face many challenges in China. To continuously supply diversified products, in general, there are many different crops and different batches planted at the same time within any particular farm. The production process, especially for vegetables, involves many activities in the product lifecycle. Furthermore, many Chinese agricultural farms experience problems associated with their small areas, their low degree of mechanization, and the labor-intensity of agricultural work. Moreover, most Chinese farm technicians still use paper to record production information, and then a statistician enters these paper records into spreadsheet software (such as Microsoft Excel). This causes delays in data summary, which restricts data analysis and use. In addition, a large amount of production process and growth status images should be collected. Nevertheless, the traditional data collection method cannot integrate data and images. It is also impossible for enterprise managers to supervise farm production processes in real time, especially for large agricultural enterprises that consist of many farms distributed across broad geographic areas.
The skillful and accurate management of farms is very important for their sustainable development [8,9]. Farm Management Information Systems (FMISs) are regarded as an important tool for the management of farm businesses [4]. In general, FMISs are adopted to collect both internal and external data and process such data to support decision making for farm managers to efficiently monitor and improve their farm operations [10]. To enhance FMIS functionalities, many different system structures and software designs have been proposed [11,12,13,14,15]. New technologies such as the Internet of Things (IoT) and cloud computing have been introduced to advance the development of FMISs [5,16]. Fountas et al. [17] proposed an architecture to obtain data from agricultural machines in precision agriculture systems. Paraforos et al. [18] provided a solution consisting of three automation levels to improve FMISs based on future internet-based technologies. In addition, holistic managerial solutions have been proposed that link all information among planning, execution, and evaluation phases [19]. Nevertheless, existing systems usually provide the same services to all famers, cannot support run-time customization for their different requirements. Furthermore, in FMIS applications, it remains difficult to record farm activities properly, at least not in a systematic or analytic way, because most data are fragmented and dispersed [13,20]. Moreover, only preliminary research has been attempted to explore traceability compliance with standards for food safety and quality [20].
Furthermore, agri-product quality traceability is a topic of interest in global research [21,22]. An agri-product traceability system has four main pillars: product identification, data to be traced, product touting, and traceability tools [23]. Electronic data capture and exchange are basic functions in traceability systems; for example, barcode, radio-frequency identification (RFID) and near-field communication (NFC) technologies have been increasingly utilized in traceability systems [24,25]. Wang et al. [21] proposed an improved food traceability system for forward tracking, diverse tracing, and food quality evaluation. Mainetti et al. [3] developed a traceability system for fresh ready-to-eat vegetables using NFC technology. Traceability, though, is not only intended for product safety, but also for the optimization and enhancement of production [26]. The production processes of agricultural goods determine their quality, while impacting the associated consumption of materials and labor. Few systems have been developed and adopted for labor data monitoring. Thus, the integration of farm operation management and traceability could help farms to precisely manage activities and enable reliable product quality traceability.
Therefore, a cloud-based Digital Farm Management System (DFMS) with identification technology has been proposed and applied to provide services to farm managers throughout a geographically dispersed area and using a web-browser-based interface accessible from a wide variety of Internet-connected devices. A significant advance would be the establishment of an information acquisition solution developed for diverse crops as well as small and multiple batches to accurately aggregate data. Smartphones could be used in conjunction with identifying RFID and QR codes to efficiently track information and relationships within the product lifecycle throughout the farm. The second proposed improvement is an enhancement of the FMIS traceability function, which integrate quality and cost management. Thus, DFMS would improve efficiency and help enterprises to conduct precise management to reduce production costs, and to ensure product quality and safety.
2. Materials and Methods
2.1. Business Process Analysis of Farm Management
Farm management is a challenging and time-consuming task that involves many different activities. The business process of vegetable farm management is shown in Figure 1. Beyond the management of crops, farm management involves the management of inputs, quality, and inventory as well as profitability analysis and financial management.
Large agricultural enterprises, which usually utilize piecework systems, have many planting farms that are spread across broad geographic areas. Each farm is divided into multiple fields. A planting technician is responsible for one or more fields and leads workers in performing field operations. Standardized technical guidelines for planting are formulated by farm managers to guide and direct field operations. Thus, technicians supervise workers to plant crops based on a planting plan and technical planting guidelines, while recording field operations data and images with Mobile Operation Records System (MORS) via smartphone or Personal Digital Assistant (PDA) devices, including the total agricultural input such as labor. Then, these records are uploaded to a remote data server and are aggregated in production archives. These production archives are information records of the whole process from planting to delivery of each batch of products. According to the daily harvest plan, raw materials are picked, transported, weighed, and placed in storage. Each material batch may be processed or packaged with different product batches and then delivered for sale.
Based on the recorded data, farm managers can obtain production process information as well as generate statistics describing planting areas and production costs. Each type of agricultural material information is entered into the DFMS when purchasing agricultural materials. The agricultural material information database contains information about the safety interval of all pesticides. The safety interval information of pesticides can be downloaded to the MORS through the HTTP protocol to guide the use of pesticides. Moreover, farm managers can learn about the use of pesticides and evaluate whether the production process is safe. According to the entire process information for planting, processing, and delivery, managers can assess each batch of products; analyze the cost structure of the product, evaluate, and reward planting technicians; and revise the technical planting guidelines for the subsequent year.
The production management process is one of the most important agricultural tasks. In this article, we focus on the tracking and tracing of the planting process, from sowing to harvesting and product storage.
2.2. Digital Farm Management System Framework
Cloud computing can improve flexibility, reduce infrastructure requirements, streamline processes, improve accessibility, and efficiently handle large data sets [14]. The growing adoption of cloud computing in the field of farm data management is further expected to drive agricultural progress. Software as a Service (SaaS) using the cloud is expected to lead the future farm management software market [27]. As a product of the cloud age, SaaS provides users with a software service that is ready to use and that uses the Internet. When using SaaS software, users typically only need to access the entries provided by SaaS vendors through their respective Web browsers. Therefore, to lower the investment costs in Information Technology (IT) infrastructure and human resources, as well as to enable the possibility of online collaborations with internal users and customers, small to medium-sized enterprises are more likely to adopt SaaS [28].
The DFMS concept based on a cloud computing platform was proposed to enable information-based management on farms, which includes the tracking of the production process and the tracing of product quality. As shown in Figure 2, the system has a distributed five-tiered architecture, which is divided into a data collecting layer, a web service layer, a cloud storage layer, a system application layer, and a user layer.
The systems for plot RFID management, operation records management, weighing records management, and label printing management are used for collecting data in the production process. These constitute the four terminal systems in DFMS. (1) The Plot RFID system (PRS) aims to achieve unified management of land resources and to record and trace the production activity of each plot. RFID tags are used to identify plots due to their outstanding characteristics, such as non-contact recognition, high-temperature resistance, and high security; (2) Tracking and recording operations are the core of production normalization management and cost control and the foundation of product traceability for farms. The farm production activities information (e.g., sowing, pruning, watering, spraying pesticides, harvesting, and cleaning), labor information, and agricultural inputs information for the entire production process are manually entered into the MORS by the technician in the field. Then, the production archives are established while the operation records are uploaded to DFMS through Web Services; (3) After harvest, the agricultural products are delivered to the farm processing center. Each batch of the products is weighed and then placed into storage. Product receipt information (e.g., farm of origin, harvest date, storage time, operating personnel, storage type, raw material code, product code, product grade, wrapping material, and actual quantity) is recorded in the Weighing Records System (WRS) and uploaded to DFMS through Web Services. The processing information is also recorded in MORS, while it can also be directly input into DFMS; (4) The traceability information is recorded for every batch of products to meet the demand of traceability throughout circulation, repackaging, and delivery. Labels are printed with the Label Printing System (LPS) and applied to the product packaging. The labels have a traceability code, which is a unique identifier of each batch product.
Web Service technology is the perfect means to exchange or integrate data from different applications running on different machines, which provides a standard platform and operating system-independent mechanism [29]. The web service is used for data exchange between the Data Collecting Layer and Cloud Storage Layer or between DFMS and other external information systems.
Using cloud storage facilities and services simplifies the exchange or integration of information between the server system and terminal systems of DFMS [26]. The Cloud Storage Layer includes multidimensional data sources (i.e., technical regulations data, plan data, and production archives data). The information characterizing the entire production process can be retrieved based on the relationships between planting, processing, and traceability batch codes.
The DFMS server system contains nine major functional modules (i.e., planting technical regulation, planting plan, production archives management, input storage, harvesting plan, product storage, data statistics, traceability management, and data analysis). Together, these nine nodes support the realization of the entire business management in an efficient manner. Moreover, statistics and analysis of planting, harvest, processing, and delivery data is another major feature of the DFMS, which can support the precise control of farm production management, such as planting areas, worker salaries, inventory, and planting costs.
Through the cloud framework, the manager can efficiently retrieve production information by accessing the DFMS in any place with a network terminal via a mobile phone, computer, tablet, or laptop.
2.3. Design of Encoding and Identification for Different Batches
The collection of farm operating data via mobile devices with barcode scanning or RFID/NFC tag reading is the most advanced farm working mode. This type of collection considerably improves the efficiency of farm operated data acquisition, alleviates the workload of technicians, and saves time. In addition to the above issues in farm operating data acquisition, there are multiple crops and many batches, and duplicate records are required. Therefore, a new highly efficient solution that integrates barcode scanning or RFID/NFC tag reading has been designed for farms that have a diversity of crops and multiple batches.
2.3.1. QR Code and RFID Technologies
Barcodes, RFID, NFC, and IoT are the main auto-identification technologies used for product traceability throughout an entire supply chain [3]. With the development of IoT, numerous objects interconnected by RFID and wireless sensor networks are able to gather real-time information within the product lifecycle and supply chain [30]. Furthermore, RFID technology can help farms to accelerate the exchange of information and reduce production and distribution costs [26]. Given their advantages of high data storage capabilities, considerable data reading speeds, and reusability, RFID and NFC technologies are used to identify and carry data. The development of RFID applications in the agri-product production chain has attracted considerable research efforts. RFID technology has been applied in traceability control and supply chain management processes [31,32].
However, the price of RFID/NFC tags is higher than that of barcodes. This disadvantage also affects the price of food products and thus limits their use in food product traceability systems [33]. Standard 2D barcodes can store less information but still have a significant data capacity and are less costly than RFID/NFC tags. Therefore, important information can be transferred to linear or 2D barcode formats on the product or product packing to the subsequent user in many food traceability systems. Thus, DFMS was constructed by combining QR codes and RFID technology applications.
2.3.2. Production Encoding and Identification
(1) Plot Encoding and Identification
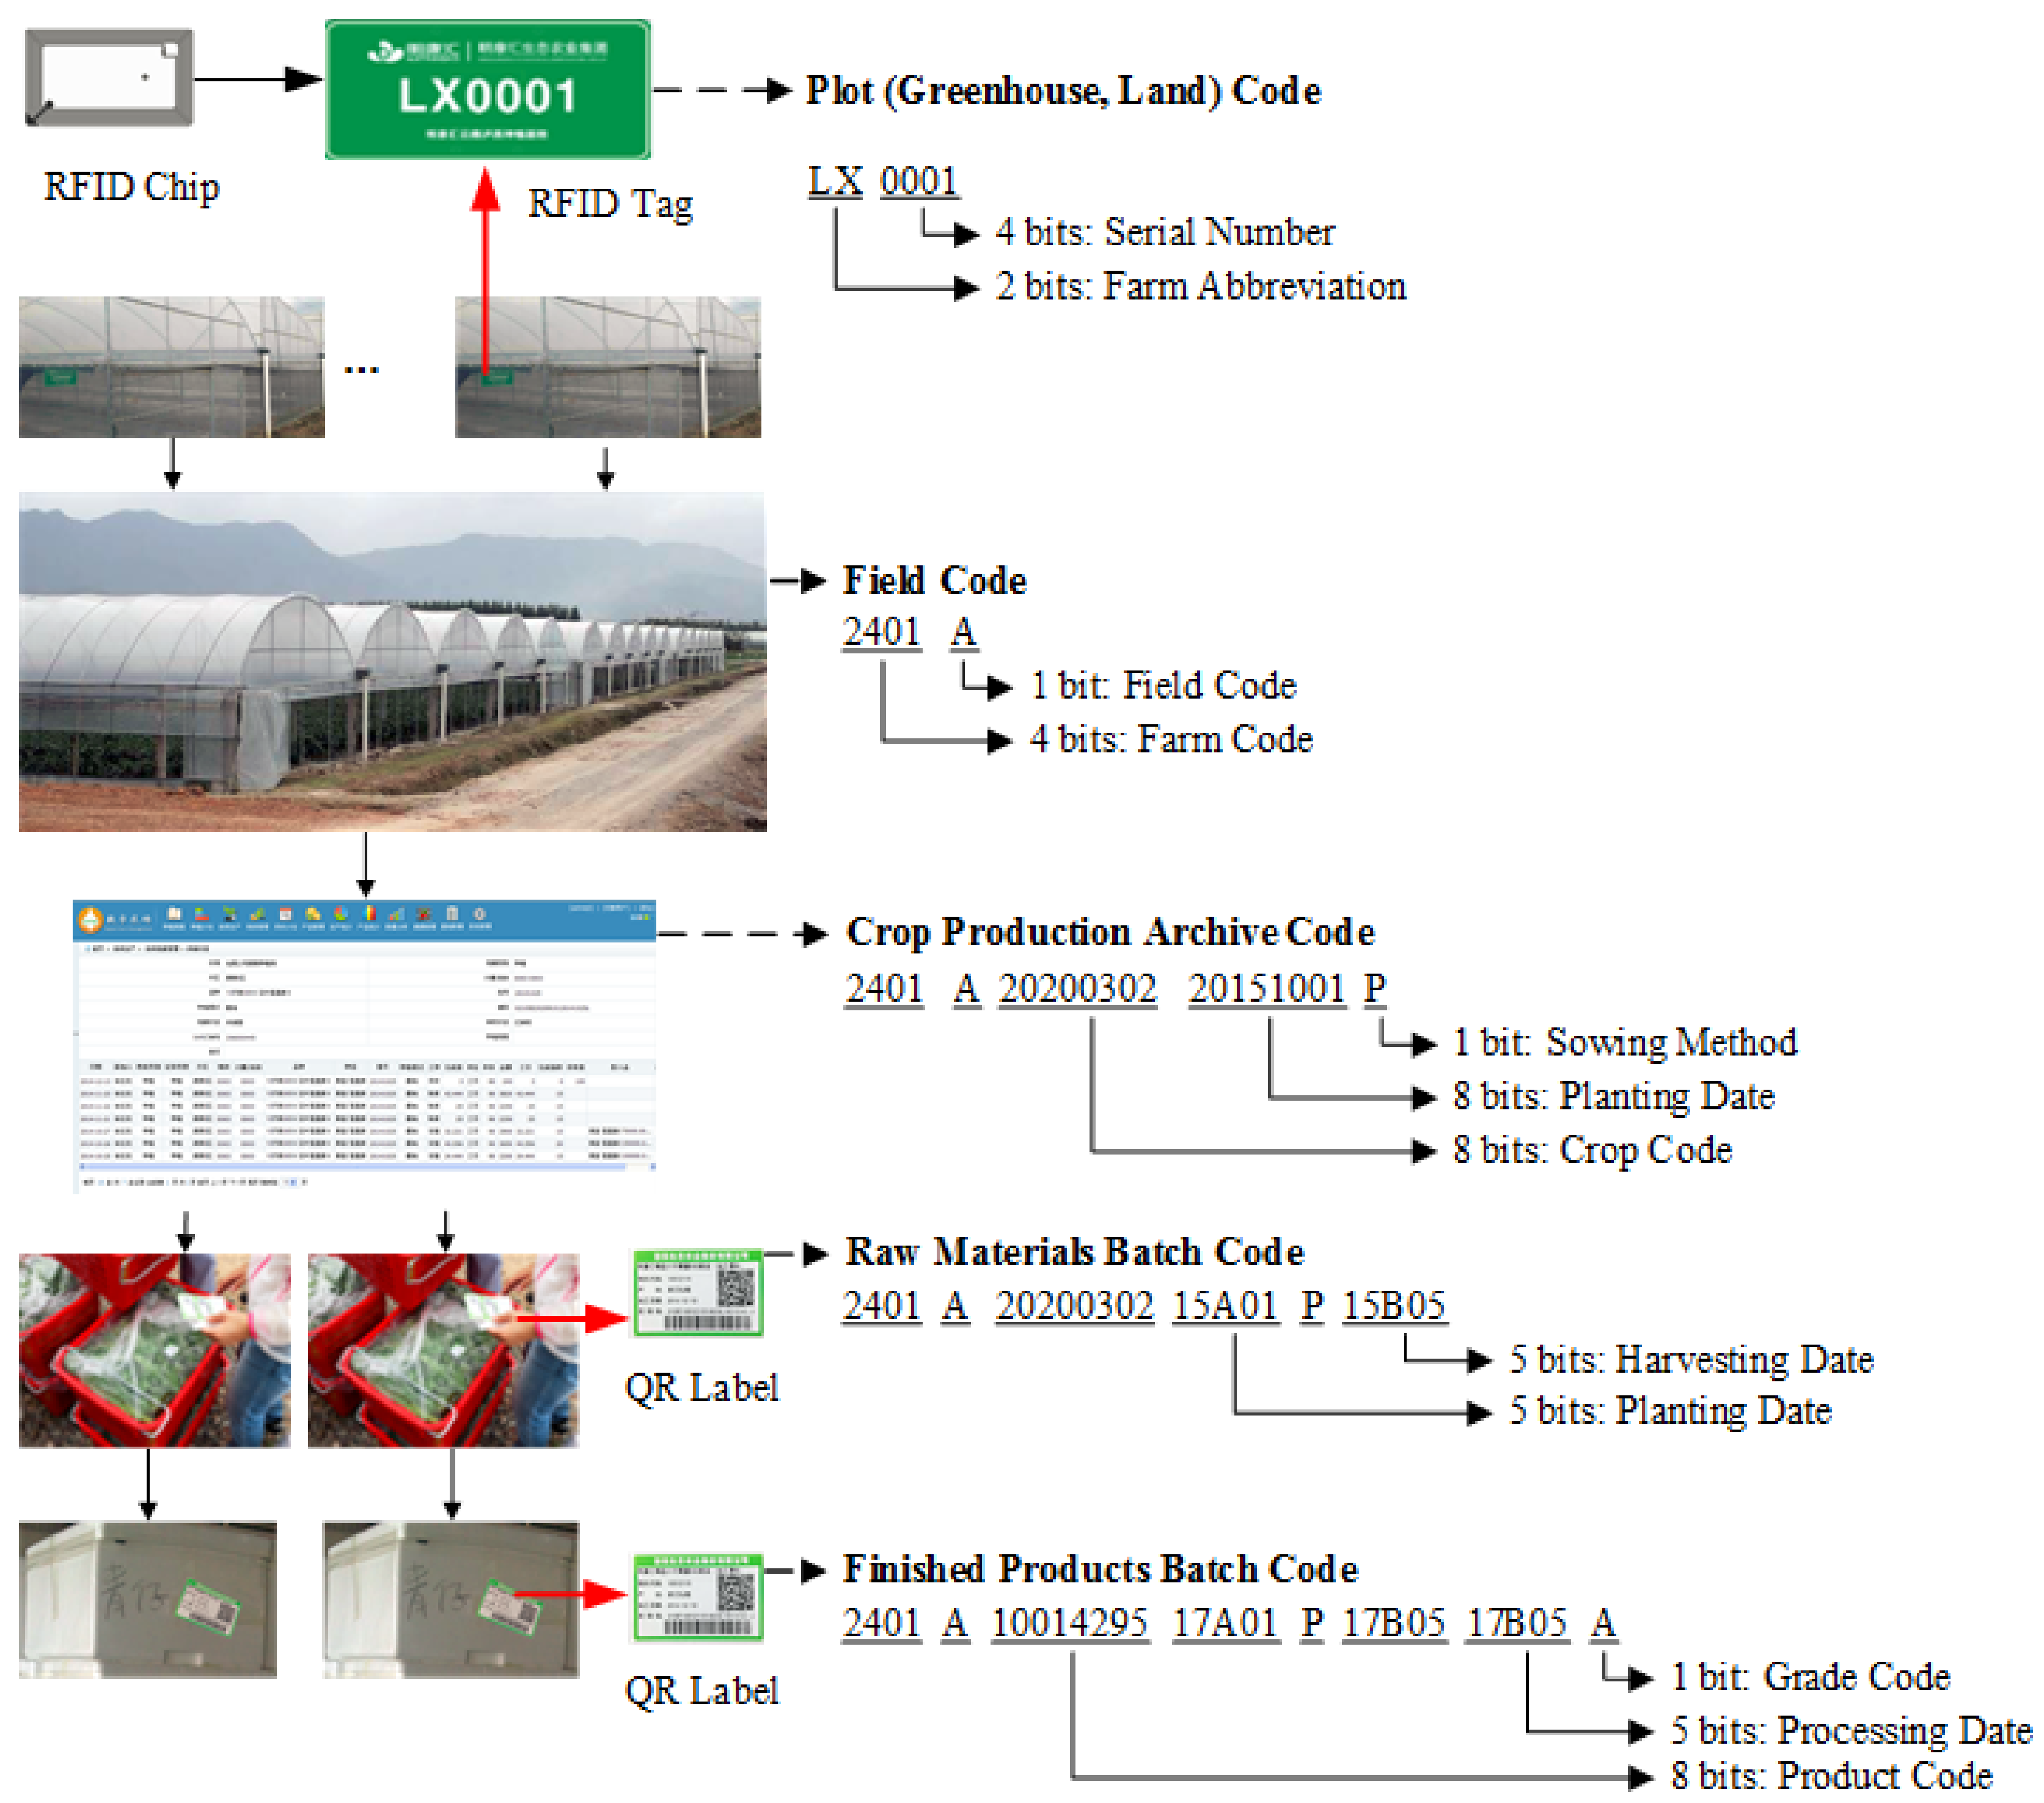
A farm typically has more than one field, and each field typically contains more than one plot. All plots are encoded sequentially, considering that some plots may be related to other fields according to management needs. As shown in Figure 3, each plot is identified by an RFID tag, attached to the entrance of the greenhouse, or erected at the edge of an area of land. The identifier code and farm name are printed on its surface. Planting primary information is recorded in the chip, which includes data such as plot code, field code, crop code, responsible technician, and planting date. The chip is embedded within a polyvinyl chloride card. Thus, the tag is waterproof and resistant to high temperature and wear. The RFID tag uses the MIFARE Classic 1K chip with an operating frequency of 13.56 MHz. This chip has a storage and data transfer capacity of 1024 bytes and 106 Kbit/s, respectively, and can be used in an outdoor environment for a long period of time.
(2) Production Archive Encoding
Each batch of every crop should be identified with a unique code, as this identifier forms the basis of production processes, cost accounting, and quality traceability. Thus, there is a crop production archive for each batch of every crop, including crop information, field information, batch code, planting technician information, agricultural input information, labor information, and costs. The production archive is identified by field, crop, and batch code and sowing method. As shown in Figure 3, the production archive code is generated and is designed with four sections, including five bits of code identifying the field, eight bits of code identifying the crop, eight bits identifying planting date, and one digit identifying sowing method (i.e., bunch planting, row seeding, broadcast sowing, transplanting).
(3) Raw Material Batch Encoding and Identification
After raw materials are picked and harvested, traceability is possible only when the harvest batches are encoded properly to ensure that they are properly associated with the production archive. As shown in Figure 3, a batch code of materials is generated at the harvesting stage, which is designed with five sections (field code, crop code, planting batch code, sowing method code, and harvesting batch code). Five bits identifying the harvest code are added based on the production archive batch code. As shown in Figure 2, when the raw material is picked and harvested, the harvest labels containing harvesting batch codes are printed based on the daily harvest plan and subsequently affixed to the container that holds the harvested batch.
(4) Product Batch Encoding and Identification
Each batch of the materials may be divided into several sub-batches prior to processing into products. Hence, the product batch code includes the processing batch code for the proper identification of the agri-product. As shown in Figure 3, the crop code is replaced by the product code and adds five bits for the processing batch with one bit for the production grade. The product batch information is encoded into the linear and 2D barcode format on the product packing.
For example, the product code 2401A1001429517A01P17B0517B05A represents product 10014295 planted in field A of farm 2401, sown on 1 October 2017 sub-batches using the row seeding method, followed by harvesting and processing on 5 November 2017, and the product grade is A.
2.3.3. Relationships among Batches
Every stage of farm production uses batches as the smallest management unit; therefore, it is necessary to manage data at the level of individual batches. Accordingly, these batches should be associated throughout processing, enabling production information to be found over all stages through the final product code.
Figure 4 shows the relationships between different stages in the product lifecycle. Planting technical guidelines describe field production protocols, and they are therefore an important basis for production process evaluation. Production archives are created for each batch of every crop, which are related to guidelines and plan codes. The production archive is uniquely identified by the archive code, which is comprised of the field code, crop code, batch code, and sowing method code. In the field planting phase, operation records of field activities (soil preparation, sowing, pruning, fertilization, spraying pesticide, and harvesting) are entered into MORS and immediately uploaded to DFMS via Wi-Fi, 3G, or 4G networks. These records on the same plot are correlated with the same crop archive code. Additionally, the input batch is recorded in input records. The raw material harvested from the same planting batch has the same harvesting batch. After harvesting, the raw materials are delivered to the farm processing center. Each batch of raw materials may be processed according to batch, and there will be multiple product batches, which are related to the harvesting batch. Therefore, we can find all the information about the whole product lifecycle through these links. Furthermore, based on planting regulation and operation records, the evaluation results of the production process and traceability information can be obtained.
3. Results
In this study, DFMS was implemented in Java, and web services were developed using JAX-WS (Java API for XML Web Services) for each of the terminal systems (e.g., PRS, MORS, WRS, LPS). To support a large number of users, security, credibility, and expandability, a cloud-based system with a five-tiered architectural model was chosen for the system. DFMS uses a browser–server architecture and can be accessible from any terminal device (notebook computer, tablet, or smartphone) equipped with a web browser and connected to the Internet, which enables users to utilize and add visual observations of fields to the system [16]. DFMS focuses on agri-product production process management and product quality traceability management.
DFMS has been applied to a large-scale vegetable producer in China since 2014, NATREGRO Co., Ltd. (Hangzhou, China) This system can organize and utilize the horticultural knowledge of the agricultural enterprises and farms for each step of crop cultivation. Within NATREGRO Co., Ltd., DFMS has been applied to 12 farms that grow vegetables.
3.1. Field Records
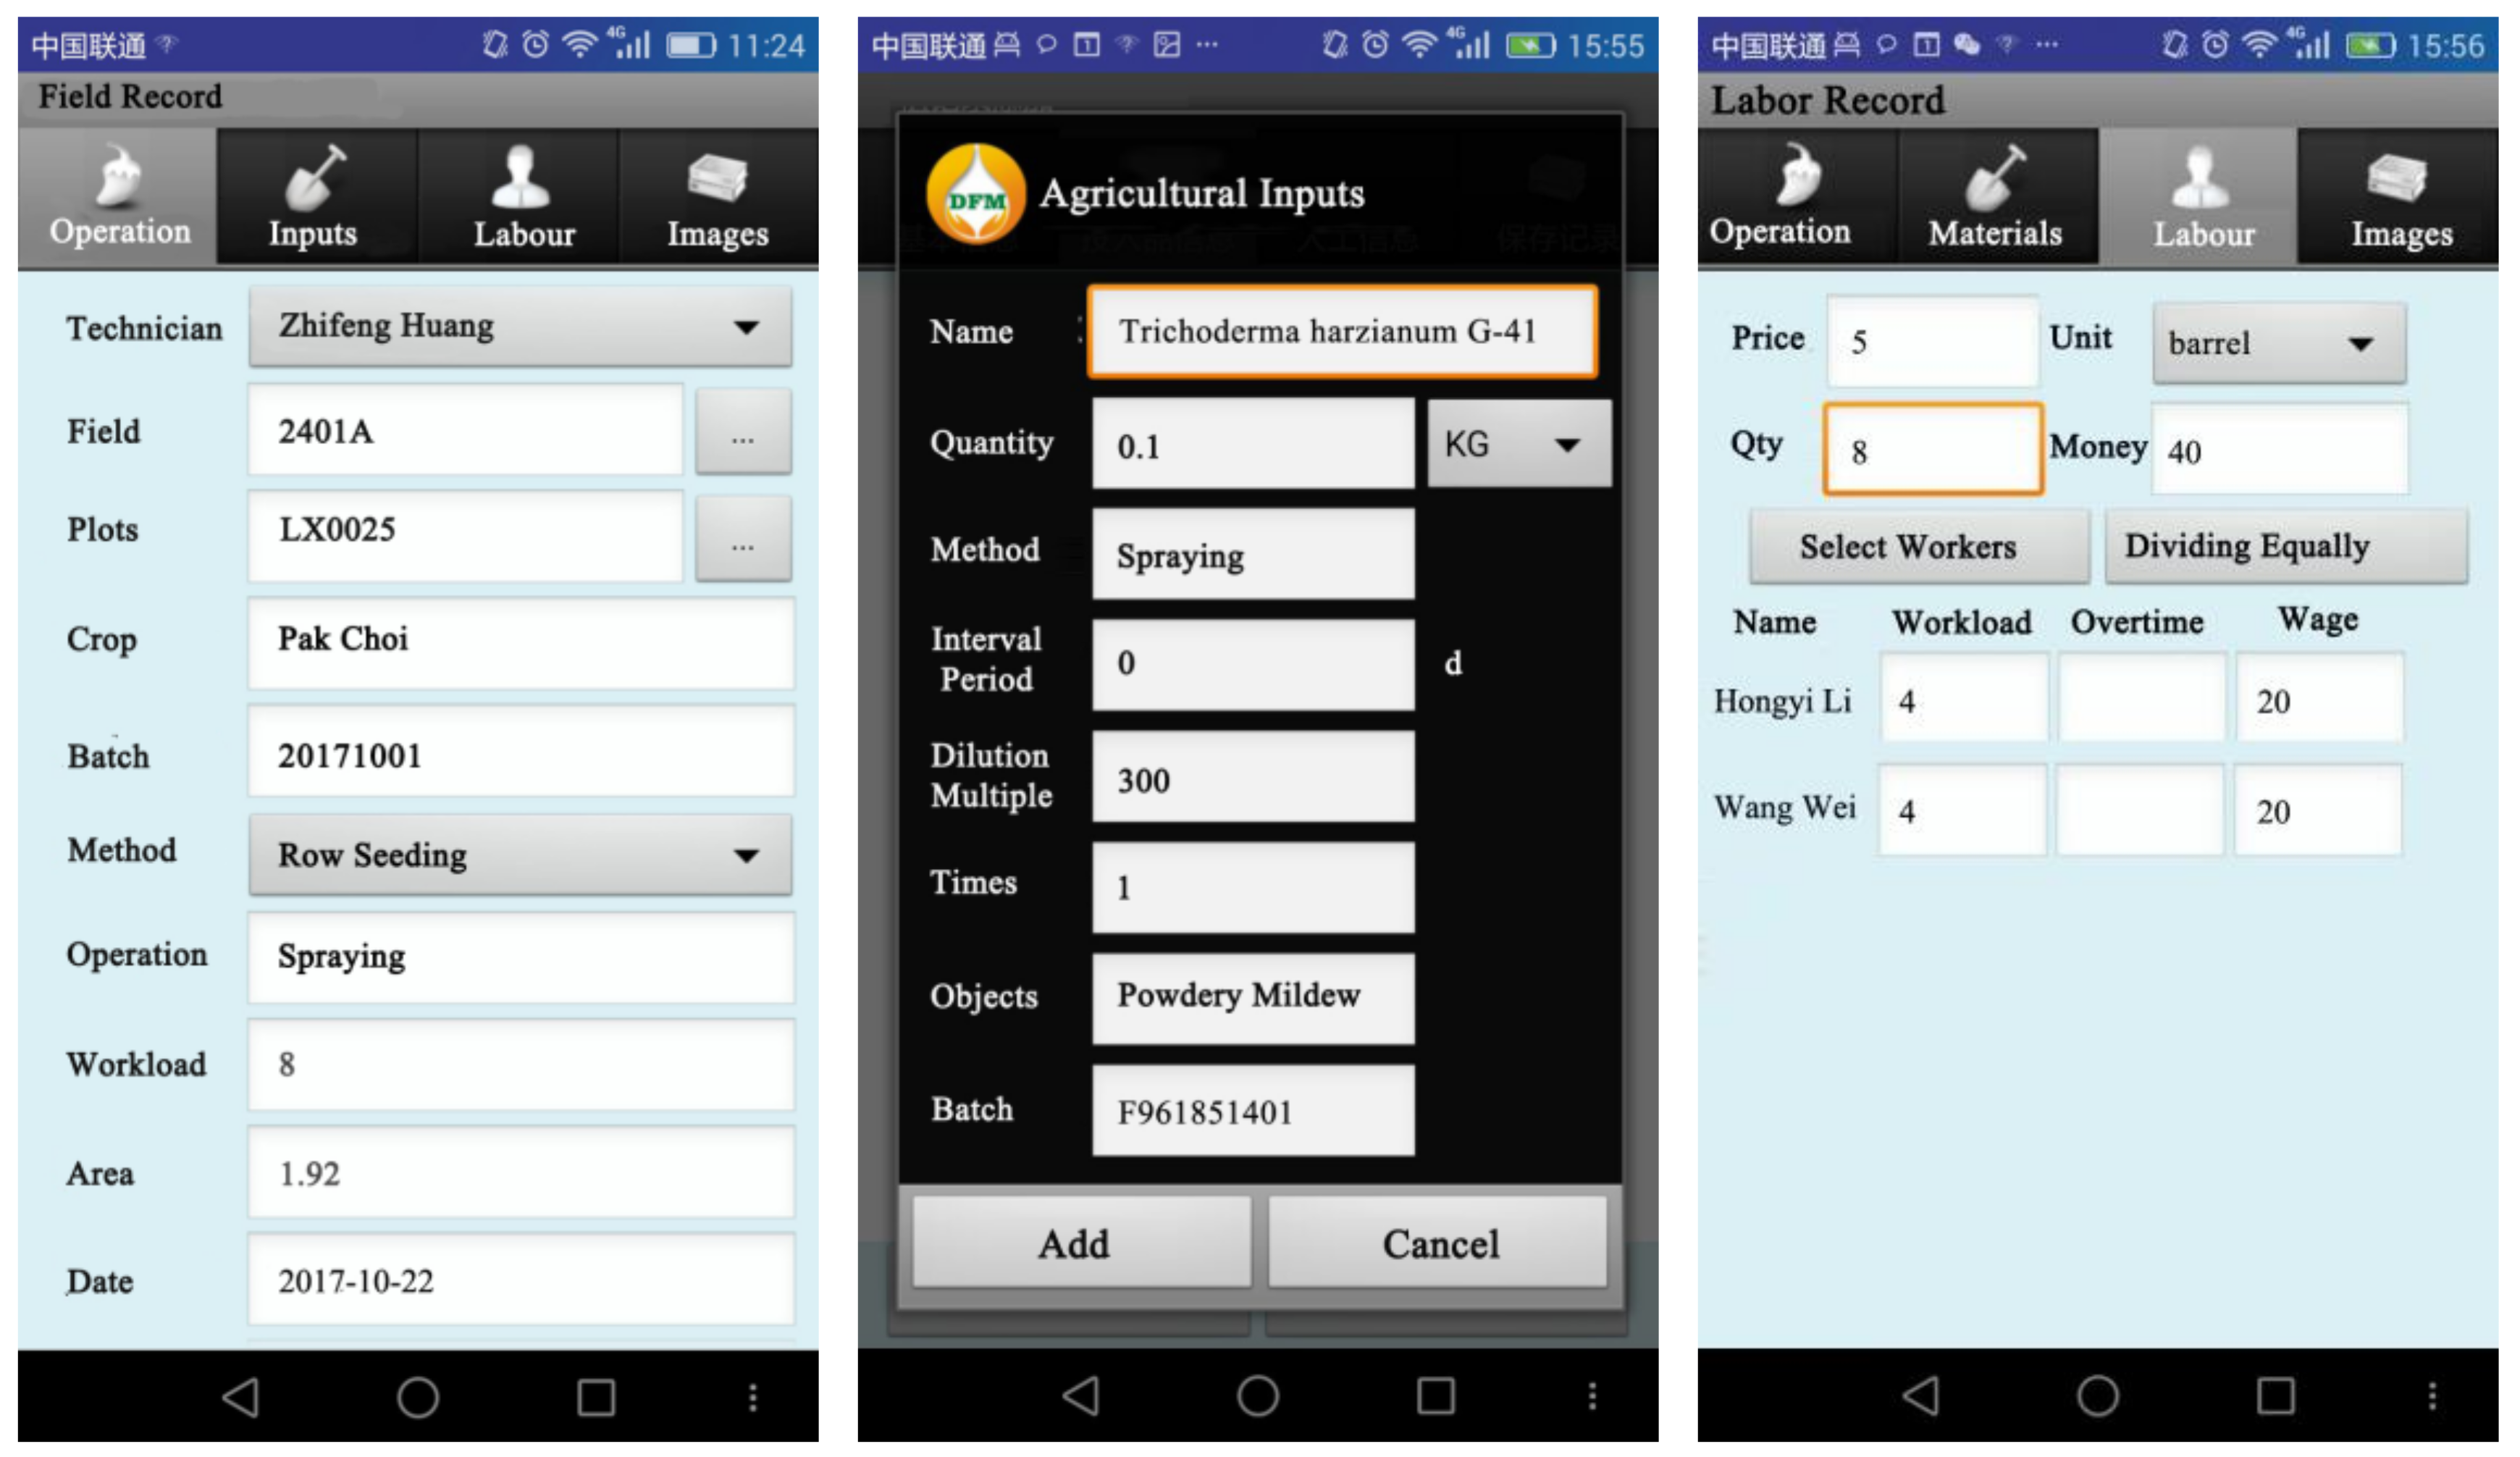
The field operation is closely related to the economic benefits of the farm. Agricultural inputs and labor information for every field operation sequence were recorded to monitor the planting process for compliance with technical guidelines. MORS was developed for smartphone platforms with NFC functions, as shown in Figure 5. The first widget is Operation, which includes the basic information related to the operation. The field, crop, batch, sowing method, and plot data can be filled into input boxes automatically by reading RFID tags. Other operational information (i.e., operation, area, and date), input information (i.e., input name, quantity, and method), and labor information (i.e., worker name, workload, and wage) are entered by technicians using the Operation, Inputs, and Labor widgets. In the Labor widget, worker wages can be calculated automatically for each selected worker. In addition, images of the field operations can be conveniently taken using MORS. As an example, in Figure 5, spraying operation is recorded in detail using MORS, which was executed to prevent Powdery Mildew.
When field records are acquired, they can be immediately uploaded to DFMS via Wi-Fi, 3G, or 4G networks. The field records for the same field, crop, batch, and sowing method are integrated into the same production archive automatically, which also records the planting process and the use of inputs and labor.
3.2. Product Records
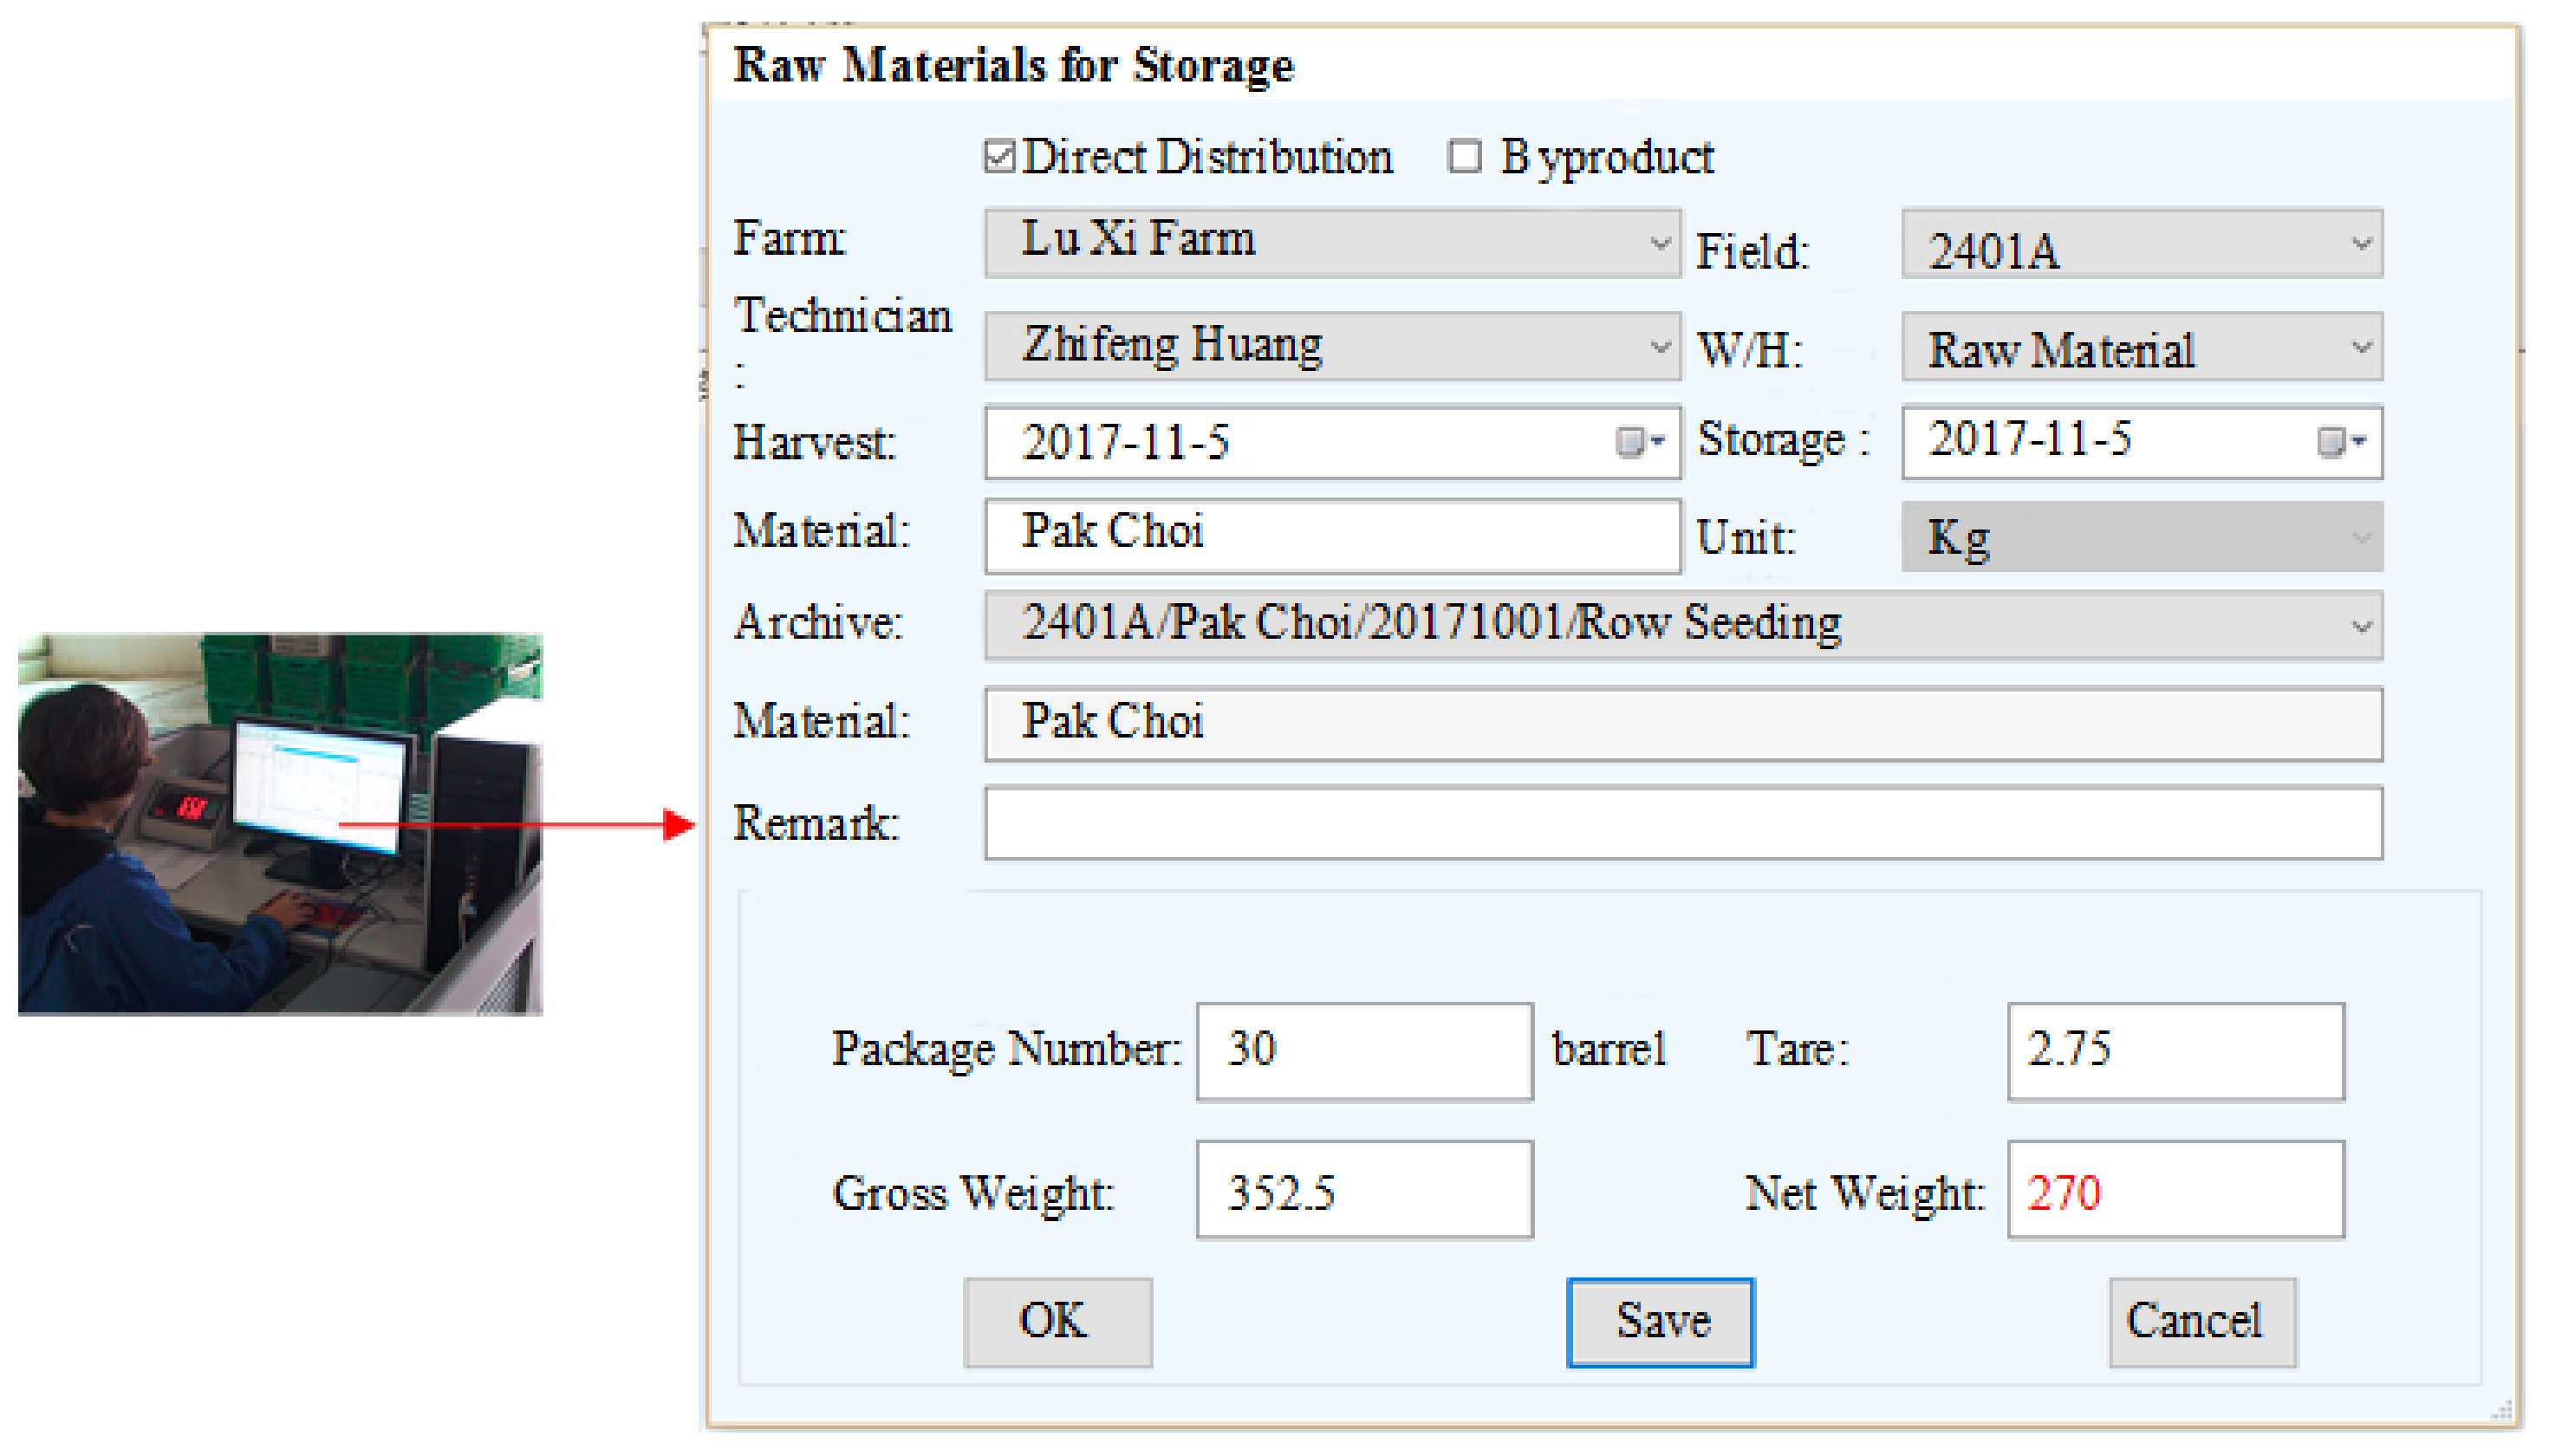
Harvest labels containing harvest batch codes are printed with LPS based on the daily harvest plan and are subsequently affixed to containers during the harvest. After harvesting, the agricultural raw materials are delivered to farm processing centers. As shown in Figure 6, scanning the harvesting QR labels, the basic information (e.g., farm, field, technician, and archive) are automatically filled into the boxes. The material weight is automatically obtained from weight sensors, and the record is related to the production archive by parsing the QR code. One batch of the materials may be divided into several batches for processing into products. Each batch product is identified by process batch and grade.
All materials and product records are stored in a local database using MySQL, and are then uploaded to the DFMS via web services.
3.3. Production Archives
The production archive is automatically established by aggregating the field records according to field code, crop code, plant batch, and sowing method. The Entity Relationship Diagram (ERD) of the database for the production archive is described in Figure 4. The production archive contains an archive code, field code, crop code, planting batch code, sowing method, technician code, sowing date, cleaning date, and area. The field records, raw material records, and products records are related to each other within the production archive.
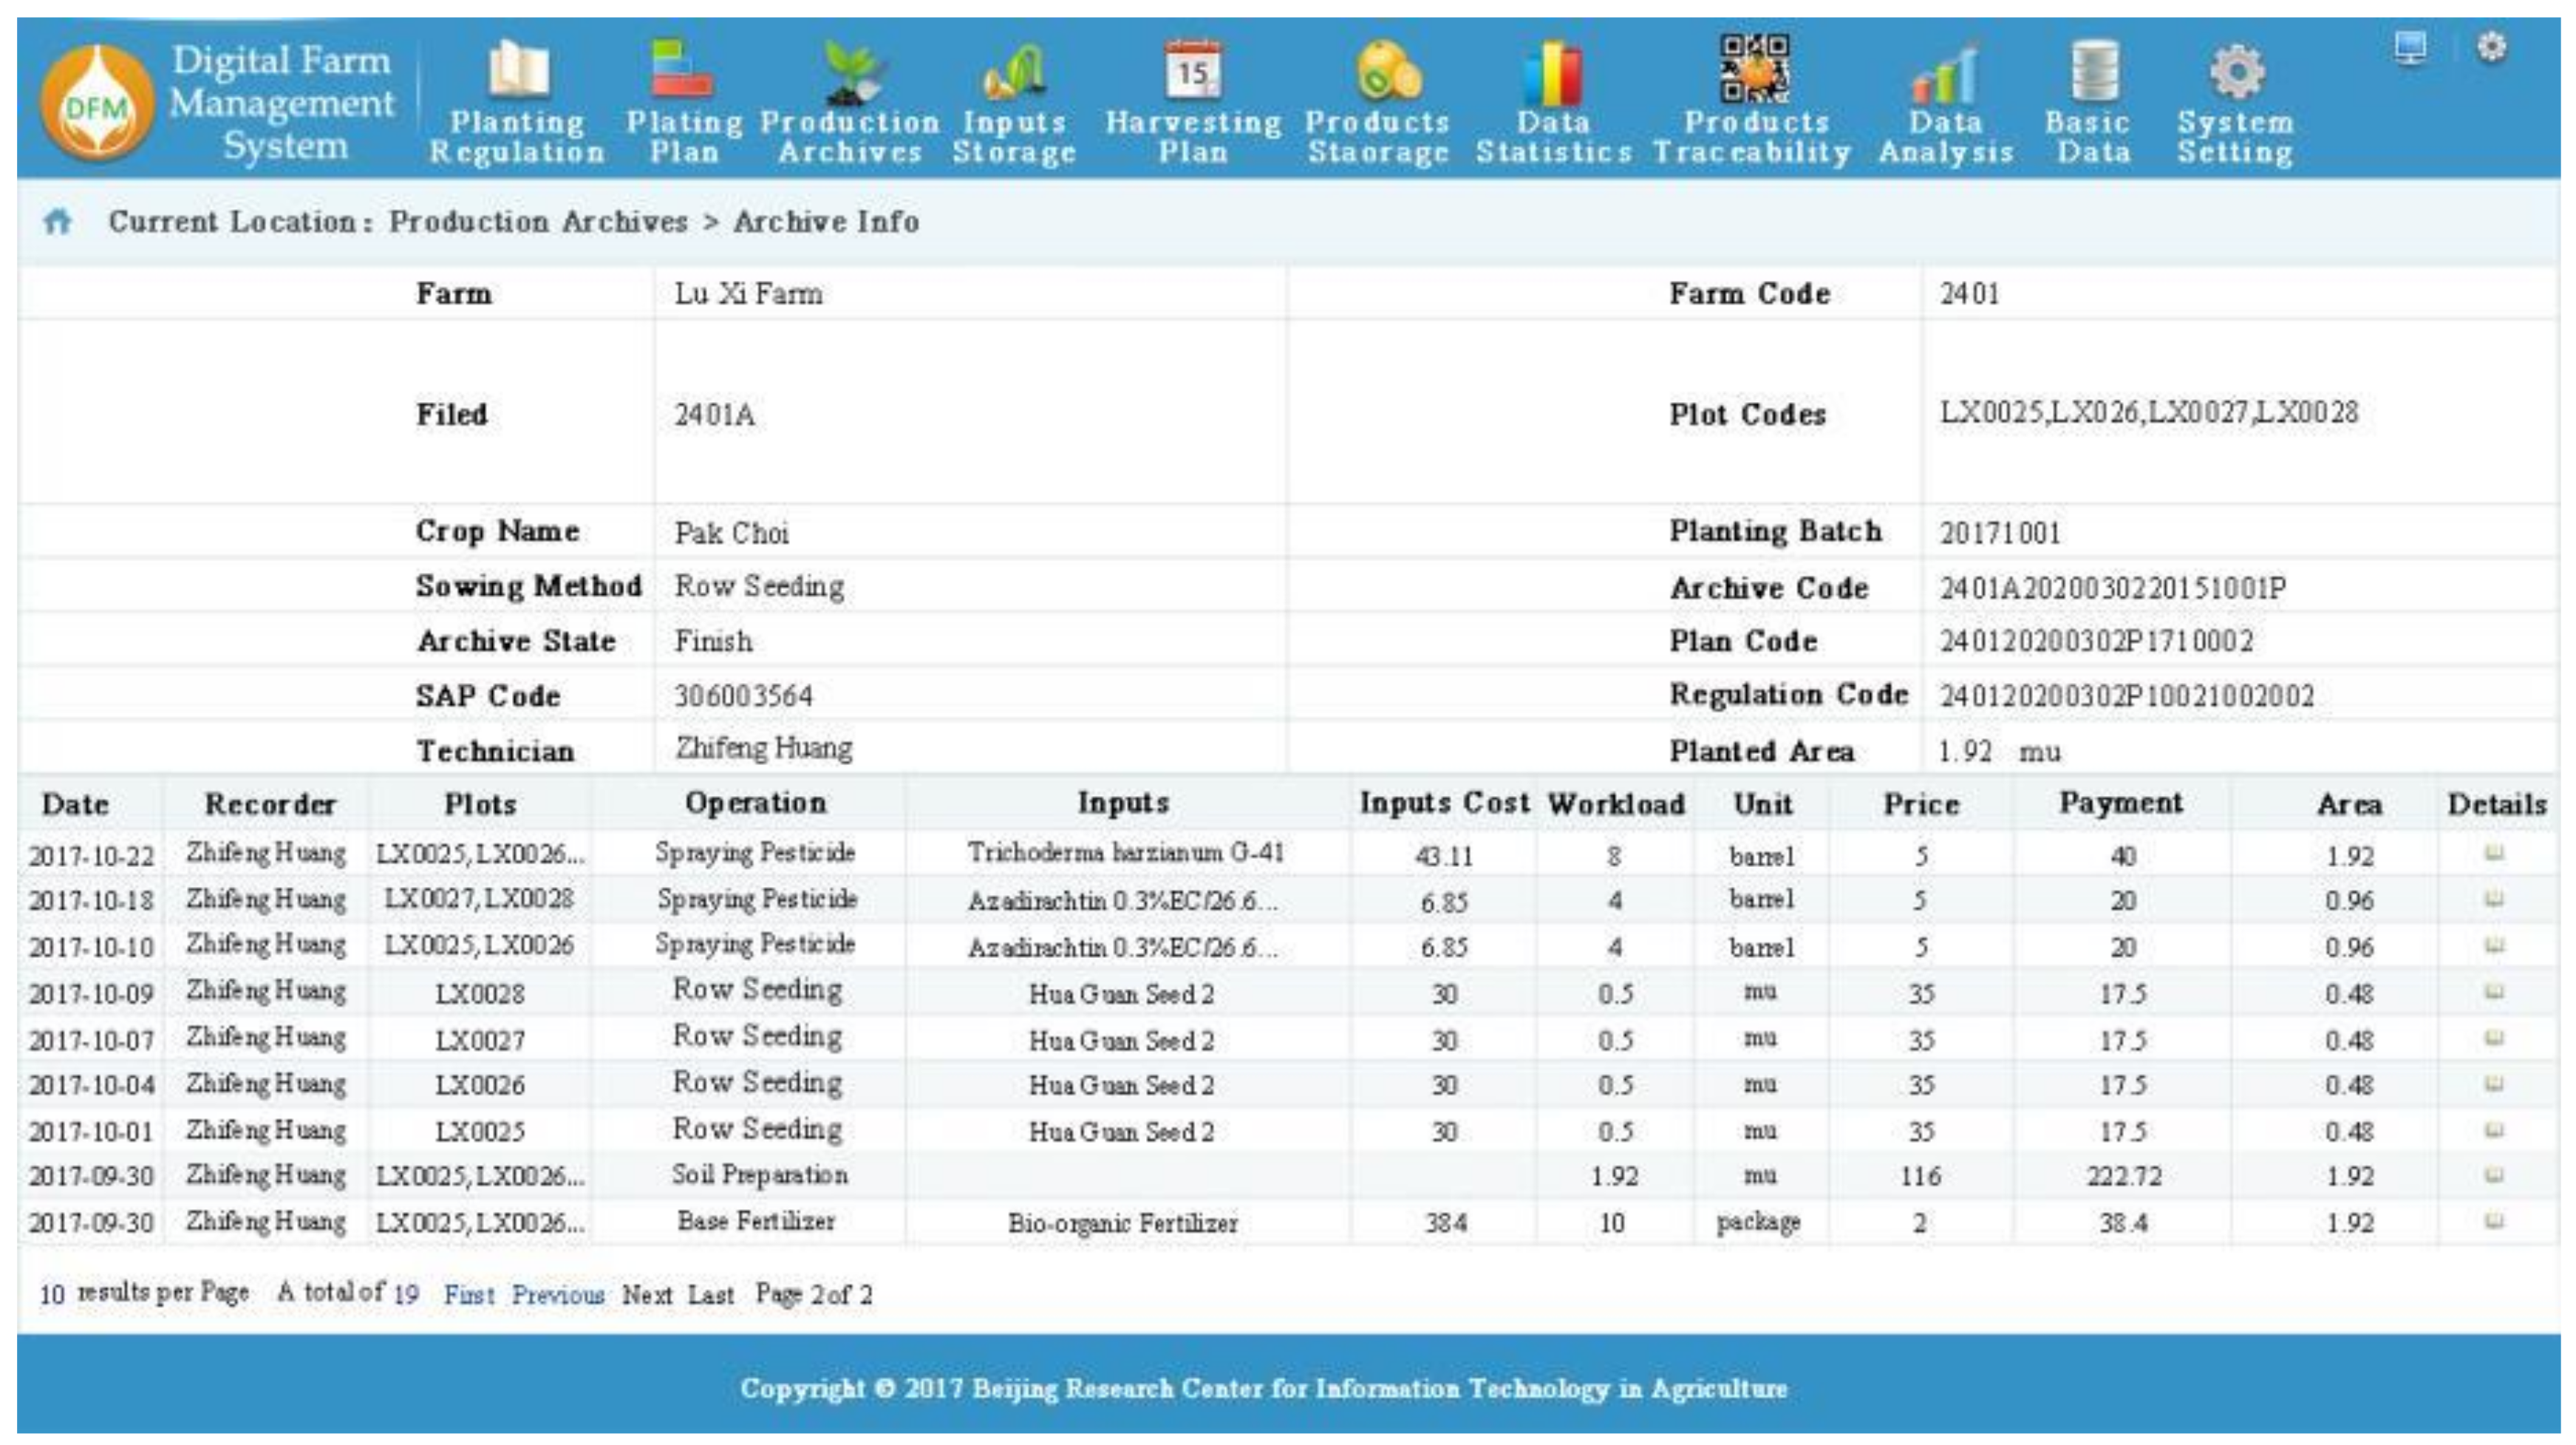
Product lifecycle visibility is possible through the production archive, which records the whole production process. Images can also be retrieved from the system, which can be used to visualize the field production process. Figure 7 illustrates the production archive of Pak Choi, nine operation records can be seen in the current page with the information regarding date, recorder, plots, operation, inputs, input costs, workload, and area. For example, Pak Choi was sowed from October 1 through 9 of 2017 using the row seeding method. The first day of sowing was 1 October 2017; therefore, 20171001 was defined as the planting batch number. At the right side of the table shown in Figure 7, operational details (such as, inputs batch and safety interval, and worker name) can be seen by clicking each of the links.
3.4. Execution Statistics
The farm managers can be aware of the implementation of the plan, the future harvesting area, and the vacant area and then make efficient decisions using the statistic functions in DFMS. The statistical areas (i.e., planted area, harvested area, and cleaning area) are automatically calculated when the field record is uploaded to DFMS. These processes for calculating these areas is shown in Figure 8, and planted, harvested, or cleaning areas will be incremented by x according to the new operation type. In addition, the month weighted area is used as an allocation key to calculate indirect costs (such as rent and management fees), which are calculated according to the actual ground time. The monthly weighted area can be expressed as:
where represents the monthly weighted area; represents the area in the field at the end of the last month; represents the sowing record number; represents the cleaning record number; represents each planting date; represents the planting area; represents each cleaning date; represents the cleaning area; represents the days of the current month; and and represent the first and last days of the current month. Pak Choi planting areas in November 2017 as calculated by Equation (1) are shown in Figure 8. As shown in Table 1, the Last End Area was 1.92 mu, was 0, was 1, was 1.92 mu, was 1, was 30, and the weighted area of Pak Choi in November 2017 was 0.32 mu.
3.5. Performance Analysis
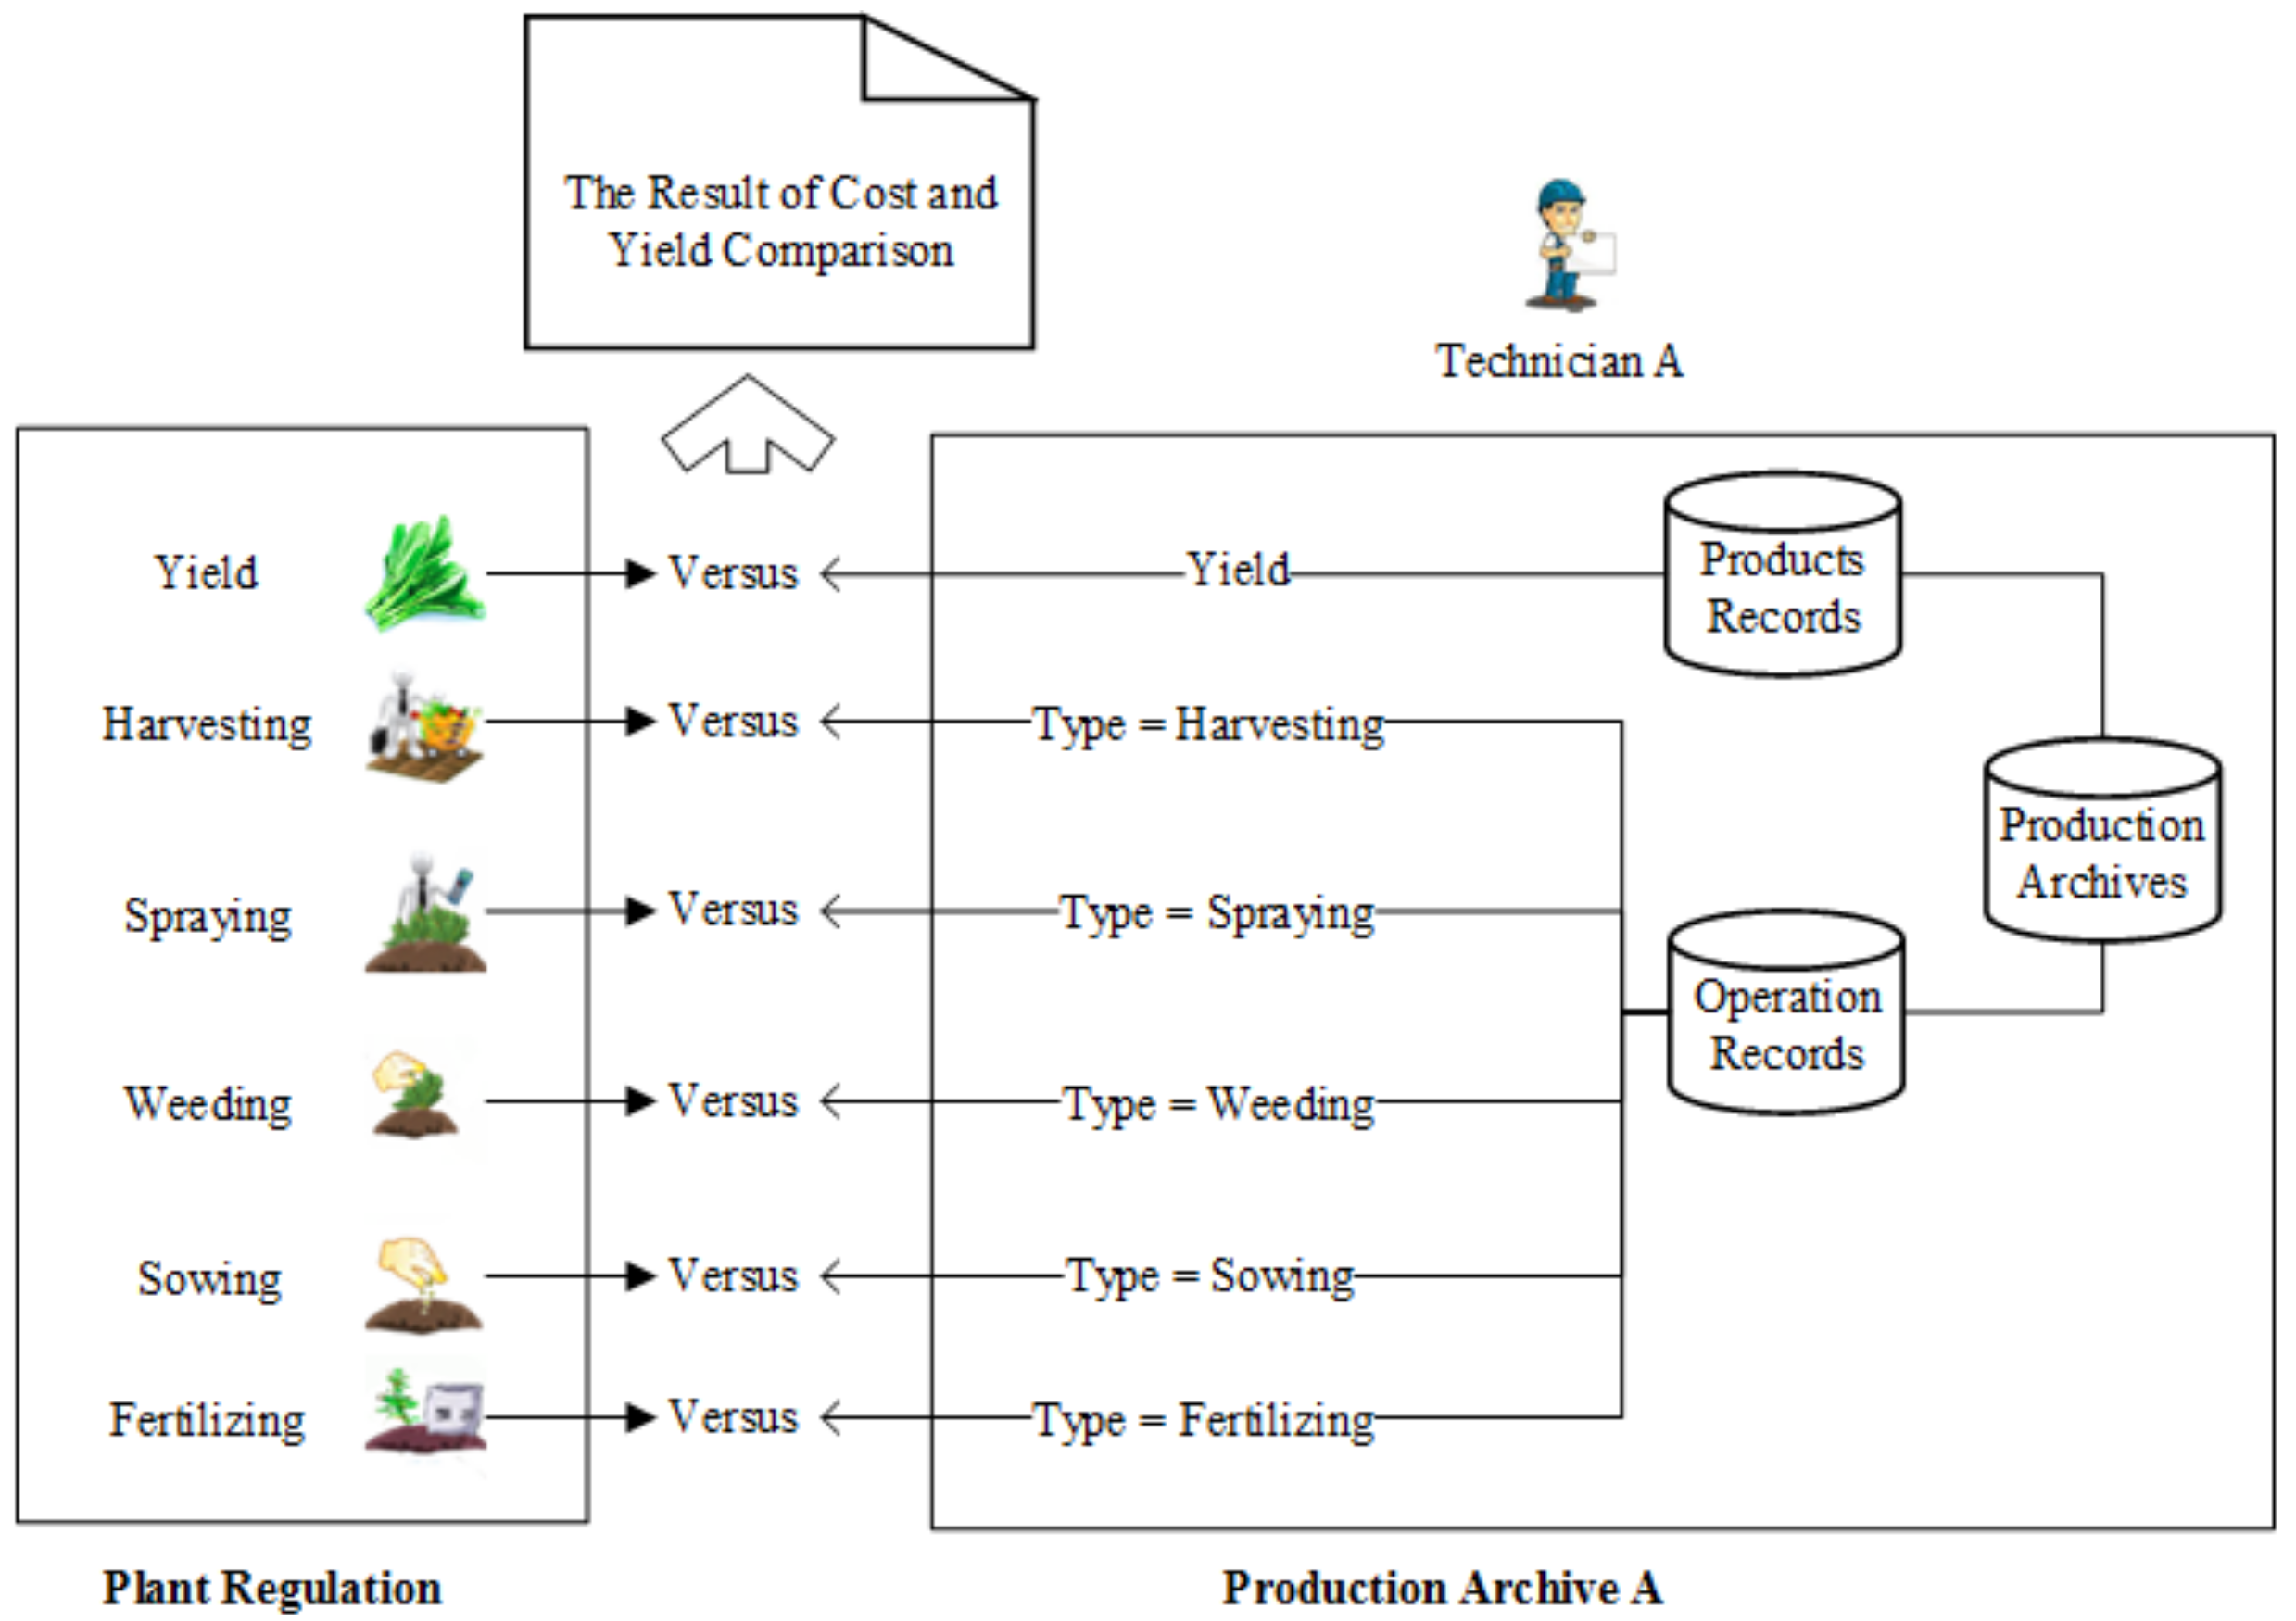
The analysis of production performance is an effective means to control the production process, including inputs, labor costs, and obtained yield. The planting cost of the entire planting cycle and yield of a single crop are statistically calculated in DFMS at the end of a production cycle. The planting costs specified for each set of standardized planting guidelines and in every batch of products are compared according to the planting operation type. Planting operations can be divided into predefined types: base fertilizer, soil preparation, sowing, watering, spraying insecticide, and weeding. Figure 9 illustrates the analysis flow for the production cost of a batch crop compared to technical planting guidelines. The cost of each planting phase is accumulated by the operation type of corresponding field records. For example, the sowing cost is calculated by assessing records in which the operation type is sow. Then, the costs are compared across planting procedures, and the production process is strictly controlled.
The performance analysis result as performed by the DFMS Data Analysis module for Pak Choi with the batch of 20171001 in field 2401A is illustrated in Figure 10. In the middle of Figure 10, the Cost Analysis chart shows the Budget Input and Labor cost based on technical planting guidelines and Actual Inputs and Labor cost based on the production archive. Under the chart, the Performance Analysis table presents the Budget Cost and Yield, Actual Cost and Yield Cost are grouped into 10 different categories: Base Fertilizer, Soil Preparation, Sowing, Watering, Spraying Insecticide, Weeding, Daily Operations (such as opening and closing greenhouse film or shade netting), Picking, Transporting, and Cleaning. In addition, the Comparison column indicates the percentage of actual compared to budgeted cost or yield. As an example, the actual Weeding Labor cost is 288.00 ¥, 87.50% higher than the budget cost.
3.6. Quality Traceability
Product traceability is important for increased agricultural product safety and consistent high-quality vegetable production. Traceability management aims to develop a universal system that makes vegetable production traceable. Gapless and secure traceability can provide the following: (1) the complete history of a product, from seed to shelf; (2) environmental information for each farm; and (3) purchasing information on agricultural inputs and treatments (e.g., seedling growth, planting, insecticide spraying, fertilizing, and harvesting). Traceability can effectively manage accidental safety risk, boost consumer trust, and improve vegetable production quality.
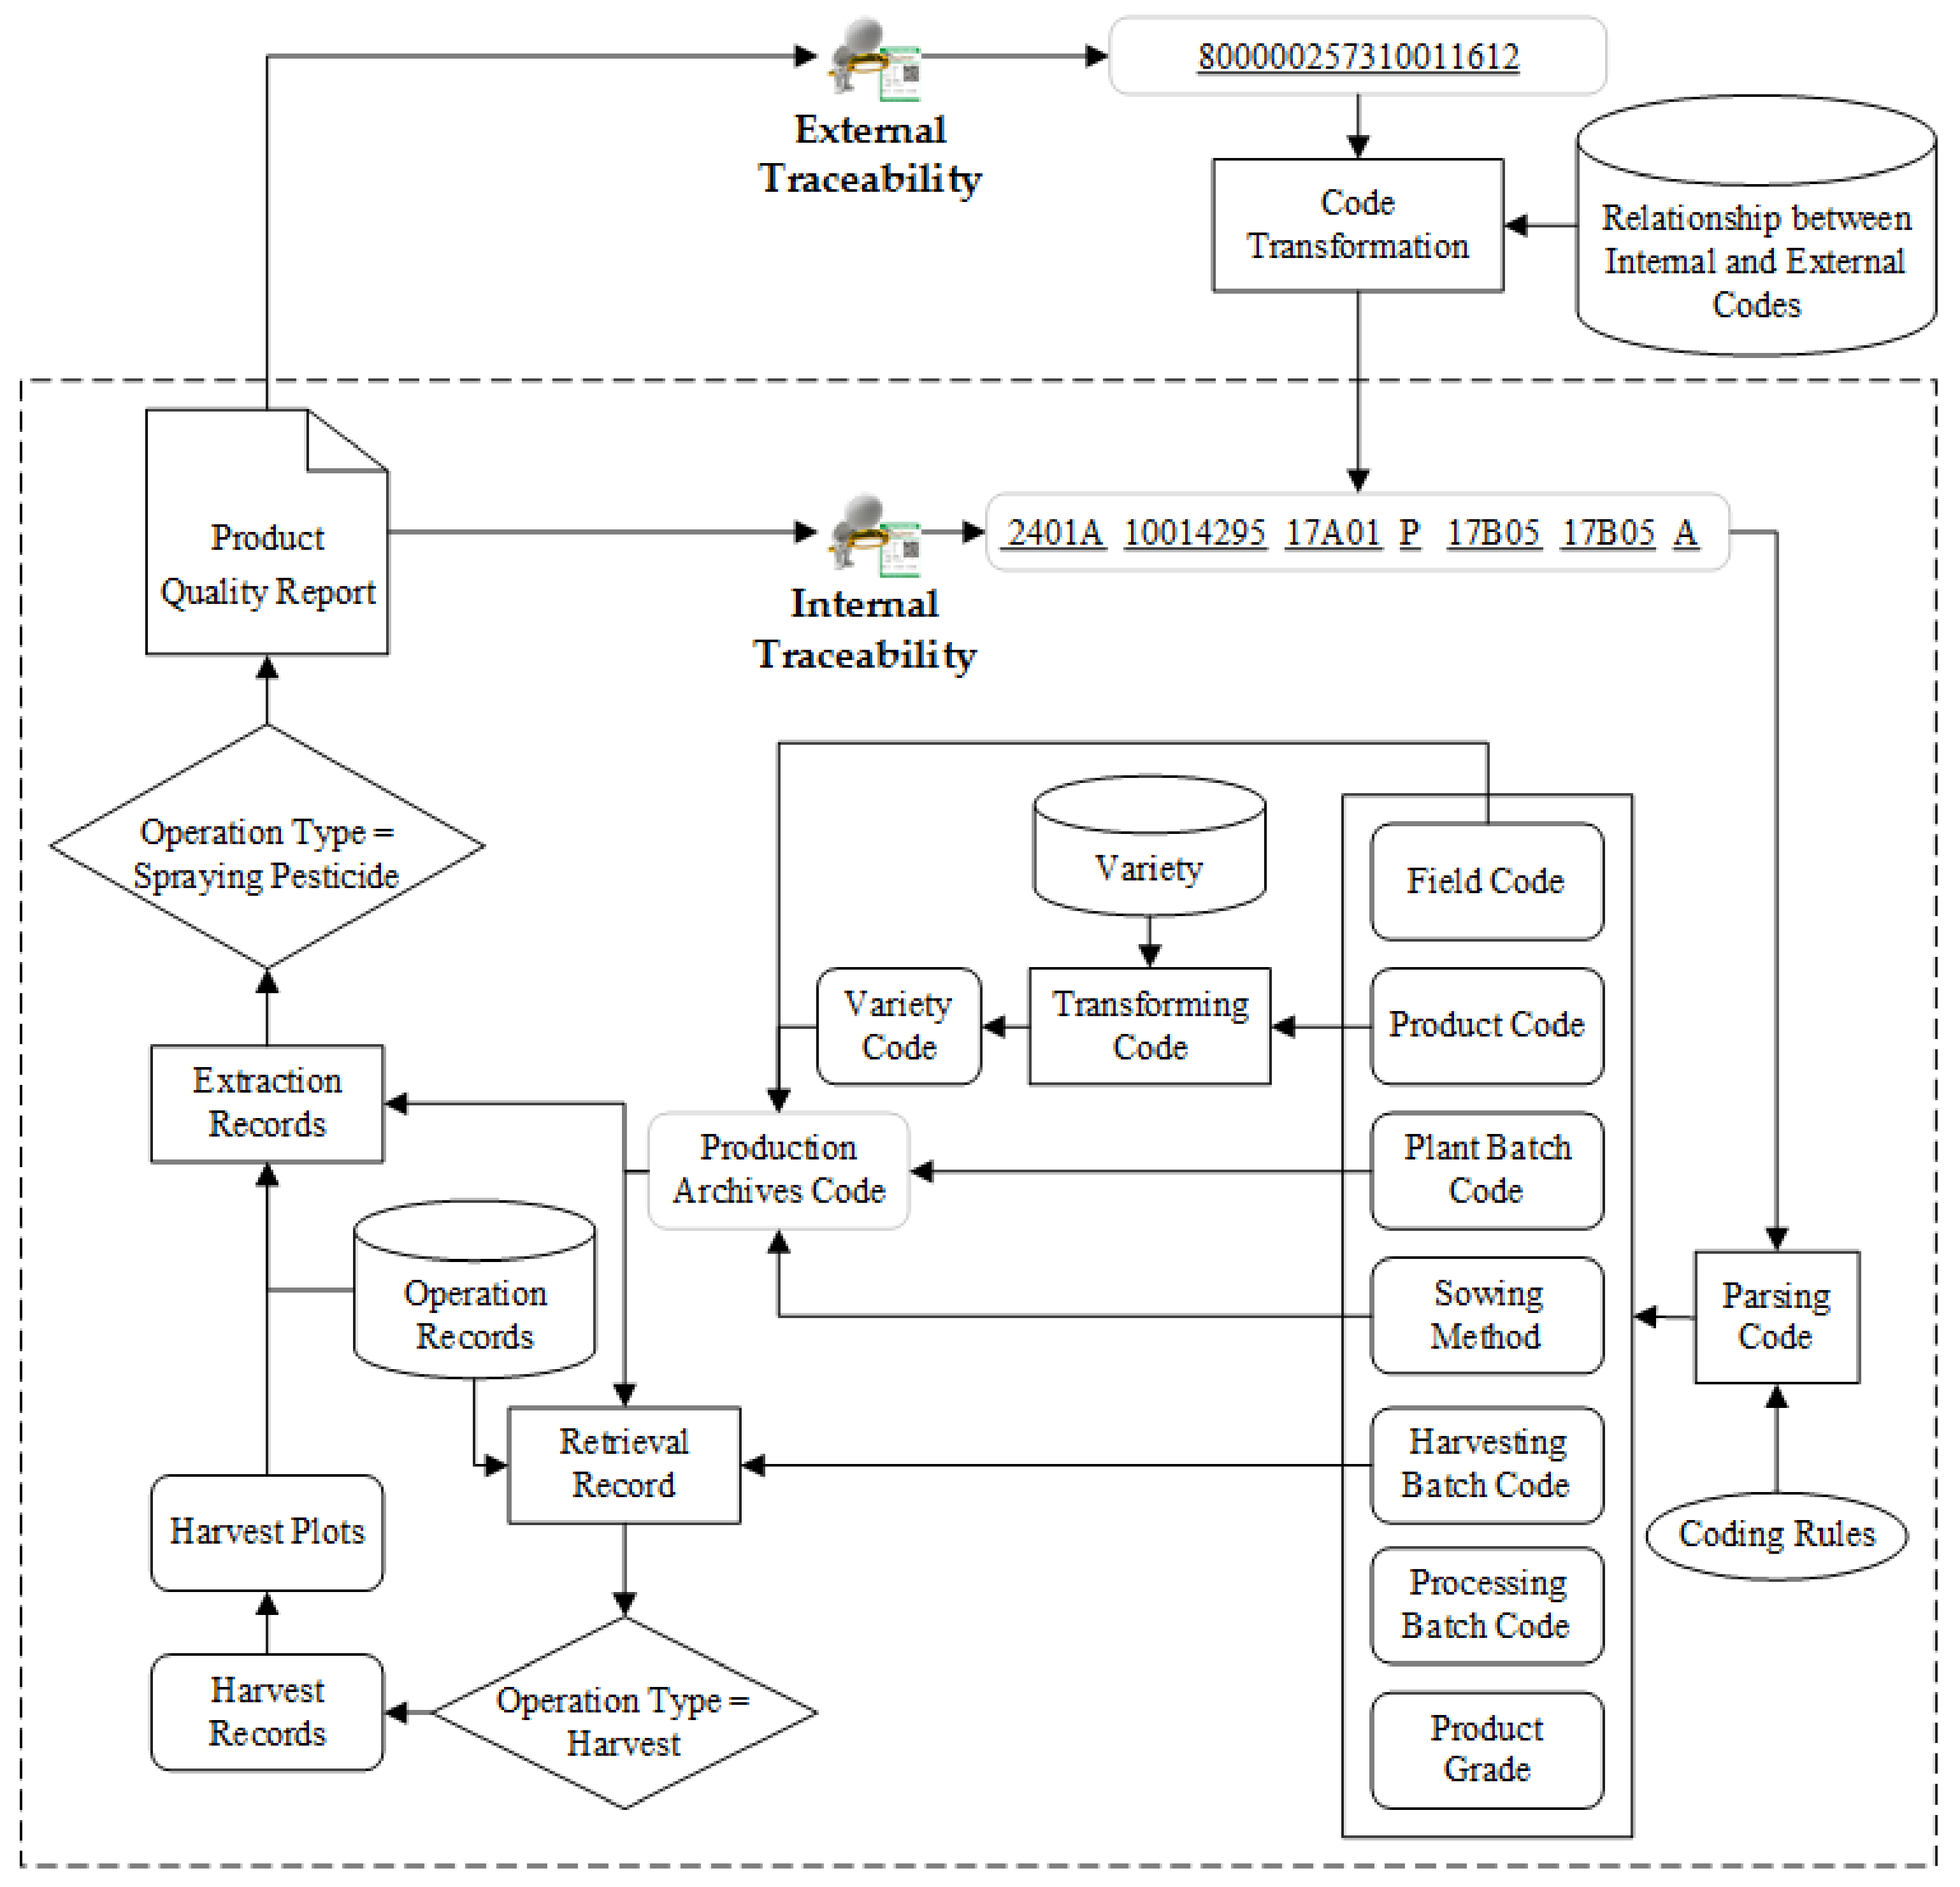
All the above collected information forms the basis for planting product traceability. This article mainly describes the process of quality traceability management within a farm. As shown in Figure 11, products are traced through identification, parsing, transforming, and retrieving. After the traceable QR code is scanned, the traceable code will be resolved into the field code, product code, plant batch code, sowing method code, harvesting batch code, processing batch code, and product grade code according to the built-in rules of the system. As each crop in the field produces different raw materials, the raw materials will be processed into different products. Therefore, product codes must be transformed into the raw material code and then into crop codes. A production archive can be found according to field code, crop code, planting batch code, and sowing method code. However, the information from plots that produced the product is important and not the production information regarding the crop in all plots. Accordingly, the harvesting plot for this batch product needs to be found, and then all production process information on this particular plot needs to be retrieved. Therefore, based on the relationships among planting, processing, and delivery phase data, production information for the entire process can be retrieved. In addition, the information related to quality and safety, such as inputs and safety intervals, can be obtained through a query with the appropriate settings.
The managers of enterprises and farms can query the operation information for spraying, fertilizing, and security based on the traceable product batch code, from seedling to harvest. When specific problems are identified in agricultural products throughout the supply chain, the source of agricultural products can be quickly located using internal traceability, which is helpful for taking appropriate countermeasures. Furthermore, DFMS provides an external traceability information query interface for consumers to request information. The consumer can query the product safety information based on the traceable product batch code. For example, quality traceability results for the Pak Choi example are shown in Figure 12, which includes planting information and harvesting information. Pak Choi was harvested on 5 November 2017 and processed on the same day at the Lu Xi Processing Center. The last pesticide application occurred on 22 October, while the appropriate safety interval is 14 days.
3.7. Application Effect
After implementing the system, the production working efficiency improved. For example, the production working efficiencies before and after DFMS application were compared. The results of the comparison are shown in Table 2. The managers of an enterprise can obtain the information of any farm at any time; therefore, the production strategy can be adjusted at any time.
Recording planting operation information is very time consuming on operating farms. Technicians need to record the operation information during the planting process. Before implementing the present system, technicians generally need to record the operation information on paper in the field. Those intermediate results were then used for later calculation of the amount of each operation and every worker payment in the evening, which is often time consuming and requires about 1.5 h in the examined example. Then, the records on paper were entered into Excel by a statistician, which is also an error-prone and time-consuming process. After implementing DFMS, the planting technician can use a smartphone/PDA to record information at any time in the field, which in our example takes half an hour at most.
Furthermore, timeliness for the submission and summary of the data before and after applying the system were also compared. Before implementing the system, a statistician needed to enter information into a computer and summarize the data based on the paper production records. In our case study, the process often lasted for three to four days. However, after adopting the system, the timeliness for submitting and summarizing data greatly improved. The statistical summary function for DFMS enables statisticians to spend more time in supervision and management, for example, checking the accuracy of data and effectiveness of operations. Data accuracy increased from 84% to 99% after applying the system.
Moreover, the number of employed statisticians can be reduced. Before applying the system, at least three statisticians were needed by each NATREGRO farm respectively for production, sales and warehouse statistics. After applying the system, at least one statistician can be reduced per farm per month. The salary of a statistician is about 3000 ¥ per month; thus, labor costs per farm per month of 3000 ¥ can be saved.
Finally, as a result of the real-time visual control of the production process, the production cost is reduced by 13%, the inputs is reduced by 9%, and high-quality product rate is increased from 35 to 52%.
To effectively implement DFMS, agricultural enterprises or research organizations should also make additional investments, which include mobile acquisition equipment, printers, electronic tags, card readers, system software, and staff training. Although these extra costs can be higher than alternative systems, the application of DFMS can improve work efficiency and save both material and labor costs. Ultimately, gains outweigh losses, and thus applying the system has high potential in planting production enterprises.
4. Discussion
With the introduction of information technology and communications in the field of agriculture over the past decades, FMIS has been widely utilized as an important tool for the management of agricultural production [4]. In developed countries, it is commonplace for farmers to use FMIS to monitor their crops [10]. However, successful cases of using foreign farm management software in China are rare due to different advocated technical processes and poor technical support for personalized customization.
In the study of Fountas et al., 75% of FMIS applications are standalone computer software applications, 10% of which are only operating on mobile applications (tablets and smartphones), 9% are web-based applications, and 6% are both [20]. The SaaS appeals to farm managers because they can immediately and easily access global information through the Internet. Furthermore, the software offers advanced security, and they do not have to worry about operating system upgrades and related IT issues. An innovation of DFMS is the use of cloud-based software for the acquisition, processing, and visualization of data received from mobile phones and printers. Through the development of cloud-based DFMS, scattered smallholders or farms can be united to make reasonable arrangements for production planning, to optimize the allocation of production factors, and to increase the standard and scientific technological level.
The DFMS solution that integrates RFID, QR, and mobile phone can meet the precise management needs for multi-crop and multi-batch products on the farm. DFMS not only meets the requirements of the farm management information system but also helps to accurately track and trace the production process of each batch in an efficient manner. In addition, the traceability function is improved in DFMS compared to existing FMISs. DFMS can better meet the increased demands to reduce production costs, comply with agricultural standards, and maintain high product quality and safety.
An RFID tag identifies a plot. Technicians scan the RFID tag of a plot though a smartphone or PDA with NFC functions to obtain and enter operational information. Although the probability of RFID tag collision in our system application process is very low due to scanning the tags one by one, an ALOHA-Based anti-collision algorithm [34] is still used in the PRS.
At the end of 2015, there are nearly 1.5 million farmer cooperatives [35]. China has good potential to become a market for farm management software. Therefore, it is of great significance for the development of China’s agriculture to study the FMIS that are suitable for China’s specific conditions.
With the application of Future Internet technologies, DFMS should be expanded to support smart farming applications. Sensors used to measure and record temperature, humidity, light, CO2 and pH of soil data should be integrated into DFMS to broaden the decision-making basis for the intelligent management of farms.
5. Conclusions
In this study, DFMS with identification technology for farm production management was developed and presented. Considering that many farms that lack such a system, DFMS was designed based on cloud technology. Farm managers can obtain visual observation information of fields, which are uploaded by operators in the field or in processing centers in real time, through any terminal devices equipped with a web browser and an Internet connection (e.g., notebook computers, tablets, and smartphones).
Additionally, an encoding and identification solution for a diversity of crops and multi batch management is provided. The proposed solution aims to monitor the production process in real time and ensures operational compliance with technical guidelines. This system utilizes RFID and QR code technologies to link production information across different phases. QR codes allow the tracking of products and ensure the accuracy of production information across different stages of each batch at a low cost. RFID chips embedded within polyvinyl chloride cards can be used to identify greenhouses in exposed, outdoor environments. The RFID tags used in this study are equipped with the following characteristics: waterproof, high-temperature resistant, and reusable.
Furthermore, smartphones or PDA devices with NFC technology are used to read RFID tags to efficiently acquire production information. Mobile phones can be conveniently used for field operations. Through DFMS, each phase of the cultivation and circulation processes can be tracked and is available for inspection of production, cost controls, and traceability services. Moreover, the statistical results (i.e., areas, labor, inputs cost for each batch, and yield) are efficiently obtained based on the operational record and production archive.
DFMS was successfully adopted by a number of large-scale agricultural production and vegetable producers, including NATREGRO in China. By relying on the strict production process management and quality control using DFMS, this system gains the trust of customers and earns a positive reputation. NATREGRO was a supplier of the 2016 G20 (Group of 20) Summit, and provided 23 crops and more than 130 tons of vegetables. The system can manage all business process information associated with planting products, from planning to delivery.
Author Contributions
F.Y. conceived this research and wrote the manuscript; F.Y. and K.W. developed the information system and discussed the content of this study; Y.H. conducted the data collection and processing; and K.W. and Z.Q. designed this research and provided important advice in the development of this study and manuscript.
Funding
This research was funded by the Science and Technology Innovation Ability Construction Project of the Beijing Academy of Agriculture and Forestry Sciences grant number No. KJCX20170206 and the National Natural Science Foundation of China grant number No. 61403035.
Acknowledgments
The authors would like to thank the referees for their valuable suggestions, which improved the content and presentation of this manuscript. This work was funded by the Science and Technology Innovation Ability Construction Project of the Beijing Academy of Agriculture and Forestry Sciences (No. KJCX20170206) and the National Natural Science Foundation of China (No. 61403035).
Conflicts of Interest
The authors declare no conflicts of interest.
References
- Korada, S.K.; Yarla, N.S.; Putta, S.; Hanumakonda, A.S.; Lakkappa, D.B.; Bishayee, A.; Scotti, L.; Scotti, M.T.; Aliev, G.; Kamal, M.A.; et al. Chapter 1—A Critical Appraisal of Different Food Safety. In Food Safety and Preservation; Grumezescu, A.M., Holban, A.M., Eds.; Academic Press: Cambridge, MA, USA, 2018; pp. 1–12. [Google Scholar]
- Pivoto, D.; Waquil, P.D.; Talamini, E.; Finocchio, C.P.S.; Dalla Corte, V.F.; de Vargas Mores, G. Scientific development of smart farming technologies and their application in Brazil. Inf. Process. Agric. 2018, 5, 21–32. [Google Scholar] [CrossRef]
- Mainetti, L.; Patrono, L.; Stefanizzi, M.L.; Vergallo, R. An innovative and low-cost gapless traceability system of fresh vegetable products using RF technologies and EPC global standard. Comput. Electron. Agric. 2013, 98, 146–157. [Google Scholar] [CrossRef]
- Paraforos, D.S.; Vassiliadis, V.; Kortenbruck, D.; Stamkopoulos, K.; Ziogas, V.; Sapounas, A.A.; Griepentrog, H.W. Multi-level automation of farm management information systems. Comput. Electron. Agric. 2017, 142, 504–514. [Google Scholar] [CrossRef]
- Kaloxylos, A.; Eigenmann, R.; Teye, F.; Politopoulou, Z.; Wolfert, S.; Shrank, C.; Dillinger, M.; Lampropoulou, I.; Antoniou, E.; Pesonen, L.; et al. Farm management systems and the Future Internet era. Comput. Electron. Agric. 2012, 89, 130–144. [Google Scholar] [CrossRef]
- Wu, X.; Wu, F.; Tong, X.; Jiang, B. Emergy-based sustainability assessment of an integrated production system of cattle, biogas, and greenhouse vegetables: Insight into the comprehensive utilization of wastes on a large-scale farm in Northwest China. Ecol. Eng. 2013, 61, 335–344. [Google Scholar] [CrossRef]
- Jin, S.; Zhou, J. Adoption of food safety and quality standards by China’s agricultural cooperatives. Food Control 2011, 22, 204–208. [Google Scholar] [CrossRef]
- Husemann, C.; Novkovic, N. Farm Management Information Systems: A case study on a German multifunctional farm. Econ. Agric. 2014, 61, 441–453. [Google Scholar] [CrossRef]
- Knuth, U.; Amjath-Babu, T.S.; Knierim, A. Adoption of Farm Management Systems for Cross Compliance—An empirical case in Germany. J. Environ. Manag. 2018, 220, 109–117. [Google Scholar] [CrossRef]
- Sørensen, C.G.; Fountas, S.; Nash, E.; Pesonen, L.; Bochtis, D.; Pedersen, S.M.; Basso, B.; Blackmore, S.B. Conceptual model of a future farm management information system. Comput. Electron. Agric. 2010, 72, 37–47. [Google Scholar] [CrossRef] [Green Version]
- Sørensen, C.G.; Pesonen, L.; Bochtis, D.D.; Vougioukas, S.G.; Suomi, P. Functional requirements for a future farm management information system. Comput. Electron. Agric. 2011, 76, 266–276. [Google Scholar] [CrossRef]
- Kaloxylos, A.; Groumas, A.; Sarris, V.; Katsikas, L.; Magdalinos, P.; Antoniou, E.; Politopoulou, Z.; Wolfert, S.; Brewster, C.; Eigenmann, R.; et al. A cloud-based Farm Management System: Architecture and implementation. Comput. Electron. Agric. 2014, 100, 168–179. [Google Scholar] [CrossRef]
- Paraforos, D.S.; Vassiliadis, V.; Kortenbruck, D.; Stamkopoulos, K.; Ziogas, V.; Sapounas, A.A.; Griepentrog, H.W. A Farm Management Information System Using Future Internet Technologies. IFAC-PapersOnLine 2016, 49, 324–329. [Google Scholar] [CrossRef]
- Ampatzidis, Y.; Tan, L.; Haley, R.; Whiting, M.D. Cloud-based harvest management information system for hand-harvested specialty crops. Comput. Electron. Agric. 2016, 122, 161–167. [Google Scholar] [CrossRef] [Green Version]
- Yang, F.; Zhang, X.; Liu, Z.; Wang, Z.; Wang, K. Research on the Application Integration Model for the Agricultural Enterprise of Integrative Production and Marketing. In Computer and Computing Technologies in Agriculture IV CCTA 2010, IFIP Advances in Information and Communication Technology; Li, D., Liu, Y., Chen, Y., Eds.; Springer: Berlin/Heidelberg, Germany, 2010; Volume 346. [Google Scholar]
- Nikkilä, R.; Seilonen, I.; Koskinen, K. Software architecture for farm management information systems in precision agriculture. Comput. Electron. Agric. 2010, 70, 328–336. [Google Scholar] [CrossRef]
- Fountas, S.; Sørensen, C.G.; Tsiropoulos, Z.; Cavalaris, C.; Liakos, V.; Gemtos, T. Farm machinery management information system. Comput. Electron. Agric. 2015, 110, 131–138. [Google Scholar] [CrossRef]
- Paraforos, D.S.; Vassiliadis, V.; Kortenbruck, D.; Stamkopoulos, K.; Ziogas, V.; Sapounas, A.A.; Griepentrog, H.W. Automating the process of importing data into an FMIS using information from tractor’s CAN-Bus communication. Adv. Anim. Biosci. 2017, 8, 650–655. [Google Scholar] [CrossRef]
- Sørensen, C.G.; Pesonen, L.; Fountas, S.; Suomi, P.; Bochtis, D.; Bildsøe, P.; Pedersen, S.M. A user-centric approach for information modelling in arable farming. Comput. Electron. Agric. 2010, 73, 44–55. [Google Scholar] [CrossRef]
- Fountas, S.; Carli, G.; Sørensen, C.G.; Tsiropoulos, Z.; Cavalaris, C.; Vatsanidou, A.; Liakos, B.; Canavari, M.; Wiebensohn, J.; Tisserye, B. Farm management information systems: Current situation and future perspectives. Comput. Electron. Agric. 2015, 115, 40–50. [Google Scholar] [CrossRef]
- Wang, J.; Yue, H.; Zhou, Z. An improved traceability system for food quality assurance and evaluation based on fuzzy classification and neural network. Food Control 2017, 79, 363–370. [Google Scholar] [CrossRef]
- Ding, J.; Huang, J.; Jia, X.; Bai, J.; Boucher, S.; Carter, M. Direct farm, production base, traceability and food safety in China. J. Integr. Agric. 2015, 14, 2380–2390. [Google Scholar] [CrossRef]
- Regattieri, A.; Gamberi, M.; Manzini, R. Traceability of food products: General framework and experimental evidence. J. Food Eng. 2007, 81, 347–356. [Google Scholar] [CrossRef]
- Thakur, M.; Forås, E. EPCIS based online temperature monitoring and traceability in a cold meat chain. Comput. Electron. Agric. 2015, 117, 22–30. [Google Scholar] [CrossRef]
- Pagano, M.; Zombardo, A.; Valentini, P.; Storchi, P. Mobile device usage to highlight the value of a Vitis vinifera L. germplasm collection. J. Food Agric. Environ. 2014, 12, 706–709. [Google Scholar]
- Pigini, D.; Conti, M. NFC-Based Traceability in the Food Chain. Sustainability 2017, 9, 1910. [Google Scholar] [CrossRef]
- Farm Management Software to Reach $4.07 bn by 2022. Available online: http://news.agropages.com/News/NewsDetail---18749.htm (accessed on 20 August 2018).
- Van de Weerd, I.; Mangula, I.S.; Brinkkemper, S. Adoption of software as a service in Indonesia: Examining the influence of organizational factors. Inf. Manag. 2016, 53, 915–928. [Google Scholar] [CrossRef]
- Abdelfattah, A.S.; Abdelkader, T.; EI-Horbaty, E.M. RSAM: An enhanced architecture for achieving web services reliability in mobile cloud computing. J. King Saud Univ. Comput. Inf. Sci. 2018, 30, 164–174. [Google Scholar] [CrossRef]
- Kim, Y.; Chang, T.; Park, J. Gen2 RFID-Based System Framework for Resource Circulation in Closed-Loop Supply Chains. Sustainability 2017, 9, 1995. [Google Scholar] [CrossRef]
- Kelepouris, T.; Pramatari, K.; Doukidis, G. RFID-enabled traceability in the food supply chain. Ind. Manag. Data Syst. 2007, 107, 183–200. [Google Scholar] [CrossRef]
- Sarac, A.; Absi, N.; Dauzère-Pérès, S. A literature review on the impact of RFID technologies on supply chain management. Int. J. Prod. Econ. 2010, 128, 77–95. [Google Scholar] [CrossRef]
- Tarjan, L.; Šenk, I.; Tegeltija, S.; Stankovski, S.; Ostojic, G. A readability analysis for QR code application in a traceability system. Comput. Electron. Agric. 2014, 109, 1–11. [Google Scholar] [CrossRef]
- Lu, L.; Lai, S. ALOHA-Based Anti-Collision Algorithms Used in RFID System. In Proceedings of the 2006 International Conference on Wireless Communications, Networking and Mobile Computing, Wuhan, China, 22–24 September 2006; pp. 1–4. [Google Scholar]
- Zhong, Z.; Zhang, C.; Jia, F.; Bijman, J. Vertical coordination and cooperative member benefits: Case studies of four dairy farmers’ cooperatives in China. J. Clean. Prod. 2018, 172, 2266–2277. [Google Scholar] [CrossRef]
Figure 1.
The business process of farm management.

Figure 2.
Digital Farm Management System framework.

Figure 3.
Different batch encoding steps.

Figure 4.
Different relationships among batches in the product lifecycle.

Figure 5.
Interface of the Mobile Operation Records System.

Figure 6.
Interface of the Weighing Records System.

Figure 7.
Interface of the Weighing Records System.

Figure 8.
Areas calculating process.

Figure 9.
The analysis flow of production performance.

Figure 10.
Performance analysis based on the planting process.

Figure 11.
Safety traceability process.

Figure 12.
Quality traceability result.


Table 1.
Areas of Pak Choi (2401A, 20171001, Row Seeding) in November 2017.
| Field | Crop | Batch | Sowed Time | Harvested Time | Planted Area (mu) |
|---|---|---|---|---|---|
| 2014A | Pak Choi | 20171001 | 2017-10-01 | 2017-11-03 | 1.92 |
| Last End Area (mu) | This Plant Area (mu) | This Clean Area (mu) | This Loss Area (mu) | Current Field Area (mu) | This Weighted Area (mu) |
| 1.92 | 0 | 1.92 | 0 | 0 | 0.32 |
Table 2.
Results of the comparison before and after Digital Farm Management System (DFMS) application.
Table 2.
Results of the comparison before and after Digital Farm Management System (DFMS) application.
| Actors | Items | Before Applying DFMS | After Applying DFMS |
|---|---|---|---|
| Technicians | Consumed time for recording | About 1.5 h | About 30 min |
| Convenience for piece wage management | Inconvenient | Very convenient | |
| Timeliness for submitting and summarizing data | Delay of three or four days | Timely | |
| Statisticians | Data accuracy | Accuracy rate was 84% | Accuracy rate was 99% |
| Data analysis | About 1 week | About 30 min | |
| Labor cost per farm per month | No cost savings | Saving 3000 ¥ at least | |
| Managers | Understanding the production process | Difficult | Any time |
| Entire | Production cost | Reduced by 13% | |
| Inputs | Reduced by 9% | ||
| High quality product rate | 35% | 52% |
© 2018 by the authors. Licensee MDPI, Basel, Switzerland. This article is an open access article distributed under the terms and conditions of the Creative Commons Attribution (CC BY) license (http://creativecommons.org/licenses/by/4.0/).
Share and Cite
MDPI and ACS Style
Yang, F.; Wang, K.; Han, Y.; Qiao, Z. A Cloud-Based Digital Farm Management System for Vegetable Production Process Management and Quality Traceability. Sustainability 2018, 10, 4007. https://doi.org/10.3390/su10114007
AMA Style
Yang F, Wang K, Han Y, Qiao Z. A Cloud-Based Digital Farm Management System for Vegetable Production Process Management and Quality Traceability. Sustainability. 2018; 10(11):4007. https://doi.org/10.3390/su10114007
Chicago/Turabian StyleYang, Feng, Kaiyi Wang, Yanyun Han, and Zhong Qiao. 2018. "A Cloud-Based Digital Farm Management System for Vegetable Production Process Management and Quality Traceability" Sustainability 10, no. 11: 4007. https://doi.org/10.3390/su10114007
Note that from the first issue of 2016, this journal uses article numbers instead of page numbers. See further details here.