Article

Optimism Bias Evaluation and Decision-Making Risk Forecast on Bridge Project Cost Based on Reference Class Forecasting: Evidence from China

1
School of Engineering and Management, Nanjing University, Nanjing 210005, China
2
Faculty of Civil Engineering and Geosciences, Delft University of Technology, Stevinweg 1, 2628CN Delft, The Netherlands
*
Author to whom correspondence should be addressed.
Sustainability 2018, 10(11), 3981; https://doi.org/10.3390/su10113981
Submission received: 13 September 2018 / Revised: 25 October 2018 / Accepted: 29 October 2018 / Published: 31 October 2018
(This article belongs to the Special Issue Sustainable Development and Management of Mega Projects)

Abstract

:
The high uncertainty of megaproject results in increasing complexity in the decision-making and ultimately leads to different degrees of cost overrun and project delays. One of the critical reasons for cost overrun and delay is the optimism bias of decision makers. Although the previous literature has analyzed the cost overrun distribution of bridges, roads and other infrastructure projects, there is still a lack of research on how to make more reasonable decisions according to the cost overrun risk and cost-benefit theory by considering the expectation of cost overrun. Therefore, this paper firstly measures optimism bias by conducting the field research and interviews regarding over 30 long bridges in China. On the basis of the optimism bias measure, a decision-making risk model of bridge projects with the expectation of cost overrun has been built. Then the paper takes Hangzhou Bay Bridge as an example to discuss the influence of cost overrun predication, implicit benefits and the project’s operation time on NPV results. Moreover, the probability of project unbuildability risk under different degrees of cost optimism bias has also been discussed. Finally, suggestions for risk forecast are provided for decision-makers to make more objective and comprehensive judgments.

1. Introduction

In recent years, allowing for the total number and the scale of public megaprojects, China has ranked the first worldwide. According to the statistical data released by the IMF and UNESCO in 2013, the total number of mega-infrastructure projects that have been built and were under construction between 1945 and 2012 in China is 7932, which is classified as “numerous” [1]. This has led to much international research on megaproject management theories. In particular, the research on megaproject decision-making has been a hot topic since the dawn of the 21st century [2,3,4]. An error or ineffectiveness in a decision scheme will cause significant damages not only to the megaproject itself but also to the social, economic and natural environments that have close relationships with the project. Therefore, decision-making at the early stage plays a vital role in the whole lifecycle of a megaproject.
Overestimated profit and underestimated cost in the preliminary planning period is referred to as optimism bias. It is an essential source of generating prediction errors. It is mainly reflected in fields such as too high expectations for profits and the postponement of megaprojects. Prediction errors that result from optimism bias are common in international megaprojects. For example, according to Flyvbjerg’s studies [5], the construction cost in Danish bridge and tunnel projects is underestimated by approximately 50% to 100% on average, while the traffic volume is overestimated by approximately 60%. In the central logistics transportation system, the actual cost is higher than the predicted cost by 50% on average while the actual demand is lower than the predicted demand by 50%. In addition, many megaprojects are postponed due to optimism bias. For instance, the completion of the Sydney Opera House in Australia was delayed for ten years and the Boston Central Artery was delayed for eight years [6,7], to refer to two well-known examples. Meanwhile, there have been many cost overruns and postponements to varying degrees in decision-making concerning mega-public megaprojects in China. For example, the Hong Kong-Zhuhai-Macau Bridge went over budget by over HK$ 5 billion (over RMB 4 billion yuan) due to the postponed completion of the construction section in Hong Kong. Hangzhou Bay Bridge overspent 2.2 billion yuan, according to calculations in 2017. The decision-making in public megaprojects in China adopts the “government’s principal-agent mechanism”. Both the cost system and the investment and financing pattern have typical Chinese characteristics and the values and preferences of the decision-making subjects are different from those in European and North American countries. Therefore, it is necessary to measure and explore the optimism bias in megaproject decision-making in China, with the aim of providing suggestions and supports for the improvement of scientific and accurate decision-making.
Flyvbjerg [5] analyzed the cost overrun distributions of bridges, roads and other infrastructure projects and provided suggestions on the degrees and risks of possible construction cost overrun in general situations. However, he did not consider how to make more reasonable decisions according to the risk of cost overrun and cost-benefit theory, when decision-makers realize optimism bias and predict that a cost overrun is possible in a project. Therefore, the paper suggests that considering the multi-stage and multi-scale complexity in the whole lifecycle of megaprojects, it is not only necessary to consider the cognitive limitations such as the optimism bias of the decision subjects but it is also important to embed the cost overrun risks caused by optimism bias into the decision-making process.
Specifically, two research questions will be answered in this paper: (1) What is the probability that the whole project will not be accepted as the cost overrun has previously appeared in similar projects? (2) What is the probability that the whole project will not be accepted in different cost overrun degrees?
To solve the above problems, based on the measurement of optimization bias in long bridges in China, this paper builds a decision distribution model by using the cost-benefit theory in combination with the explicit economic benefits and implicit social benefits of the project.

2. Theoretical Background

2.1. Theory of Optimism Bias

Optimism refers to the way in which people are more likely to have a positive attitude in predicting the events that may occur in the future and it relates to the degree of individual satisfaction with life, physical health status and self-esteem. The concept of “optimism bias” was first put forward by the Nobel Prize winner, Daniel Kahneman and his colleagues in their theories and research about judgment and decision-making under the condition of uncertainty [8]. Optimism bias is mainly divided into two categories: optimism bias towards positive events and towards negative events. Anthropologists, economists, management scientists, psychologists and cognitive neurologists have found that optimism is prevalent in everyday life and it has both positive and negative influences.
Cantarelli et al. [9] posited that decision errors could be effectively avoided by using different theories such as rational selection theory and prospect theory. Kahneman [8] suggested that the way to avoid optimism bias is to use the “outside view” to make decisions. The “outside view” is mainly derived from the objective data of past performance and the opinions of shareholders who have not initiated projects or gained benefits from an operation.

2.2. Optimism Bias in Project Decision-making

Many scholars have tried to introduce optimism bias into different types of project decision-making research, such as traffic engineering, software engineering and construction engineering. The studies about optimism bias in projects at the early stage are mainly conducted on the psychological level. Lovallo and Kahneman [10] noted that decision-makers might be blindly optimistic when making decisions, which may lead to overestimations of benefits and underestimations of the necessary cost. By analyzing data from the British Department for Transport, Flyvbjerg et al. [11] not only found that the optimism bias of decision-makers exists but also provided explanations about optimism bias from psychological, technical, political and economic perspectives. Snow et al. [12] found that optimism bias often leads to more than 60% of project delays by analyzing the issues such as the degree, motivation and frequency of optimism bias in software engineering. They also used the information-theoretical model for analytical purposes and noted that only 10 to 15% of predictions are accurate. Similarly, Johnston [13] reviewed urban models based on geographic information system (GIS) software and analyzed the influence of optimism bias on the cost overrun of software projects. In addition, Jennings [14] mainly studied the risk and cost overrun of the London Olympic Games project budget. Caponecchia and Sheils [15] considered the impact of optimism bias on predictions of construction site safety.
In recent years, to study the impact of optimism bias on megaprojects and to better control such impact, researchers have focused on decision-makers’ optimism bias in megaproject management. Flyvbjerg et al. [16,17] collected data from 210 transport projects in 14 countries and regions, conducted analyses and found that decision-makers not only underestimated customer traffic but also underestimated economic and financial risks. Flyvbjerg [5] used the RCF (Reference Class Forecasting) method for the first time to help decision-makers to stay within their budget. Since then, based on Flyvjerg’s predictions, Salling [18] used a joint decision support model to analyze the project risks from the inaccuracy of construction cost estimation and demand forecast. Unlike the above studies, Kutsch et al. [19] systematically analyzed the optimism bias in project management through empirical and simulation methods and found that optimism bias exists not only in the planning phase but also in the project implementation stage. Batselier and Vanhoucke [20] incorporated the RCF technique into his newly introduced method- XSM (Exponential Smoothing-based Method). Results show that the XSM exhibits a considerable overall performance improvement, especially when considering the optimism bias.
The research on the optimism bias of megaprojects in China is still at the initial stage and there have been few studies that focus on the optimism bias in megaprojects. Therefore, this paper intends to study the issues of optimism bias concerning cost in bridge decision-making in China from the external perspective A project risk decision-making model of top decision-makers is conducted about whether a project is feasible. Finally, it provides suggestions for decision-makers.

3. Optimism Bias Measurement of Bridges in China

3.1. Data Collection

The budget and cost data of long bridges (more than 400 m) used in this paper are mainly from the field studies and interviews of large bridges in Shandong, Fujian, Anhui, Yunnan, Jiangsu, Guizhou, Zhejiang and Hunan provinces in China, covering more than 30 bridge projects, including Langqi Minjiang Bridge, Aizhai Bridge, the Second Nanjing Yangtze River Bridge, the Third Nanjing Yangtze River Bridge, the Forth Nanjing Yangtze River Bridge, Runyang Yangtze River Bridge, Su Tong Yangtze River Highway Bridge, Taizhou Yangtze River Bridge, Jiaozhou Bay Bridge, Hangzhou Bay Bridge, Jiashao Bridge, Xiazhang Bridge, Shanghai Yangtze River Bridge and Tunnel, Longjiang Bridge, Ma’anshan Yangtze River Bridge, Nanpu Bridge, Yangpu Bridge, Chongqi Bridge and Donghai Bridge and so forth. As the number of large-scale bridge projects is very limited, the samples selected in the previous research have been much fewer than those of roads and rails [16,17].
During the nine-month field research, lots of details of bridge projects from all over China (including project proposals, preliminary design specifications and feasibility study reports) were collected through expert interviews, file inquiries, questionnaires and other methods (see Table 1).

3.2. Measurement of Optimism Bias

China has been in a period of rapid traffic construction development since the 1980s and a great number of bridges with a long span, advanced technology adoption and high investment have appeared. Through probabilistic analysis, it can be known that under an optimism bias, 60% of the projects will exceed 10% of the budget at most, while 80% of the projects will exceed 35% of the budget at most and the cost overrun probability of most projects is lower than 60% (shown in Figure 1).
When a project is still in the preliminary planning phase, the decision-makers should take optimism bias into account when assessing the budget. As shown in Figure 2, when the acceptable cost overrun risk of a bridge project reaches 10%, the decision-makers should select a budget improvement rate of 50%. In other words, if the initial budget of this bridge project is 10 million yuan, the final budget should be increased by 50%, reaching 15 million yuan. When the acceptable cost overrun risk of the bridge project reaches 60%, which means that the project cost overrun risk must be within 60%, the decision-makers should select a budget improvement rate of 2%. In other words, if the initial budget of this bridge project is 10 million yuan, the final budget should be increased by 2%, reaching 10.2 million yuan.
From the analyses of the cost overrun of China’s bridges above, it can be concluded that cost overrun has historically existed in bridge projects. Through the analyses of the historical number and extent of the bridge cost overrun, we have drawn a diagram on the cost overrun distribution of bridges. To determine what kind of distribution with which this variable of cost overrun proportion is in accordance, we tested six different common distributions to fit the data (shown in Figure 3) in SPSS. Finally, we found that the log-normal distribution fits the data features best.
Then, we provide a probability density function of the log-normal distribution and a probability density distribution diagram with all parameters.
p d f ( x | α , μ , σ ) = 1 ( x α ) σ 2 π exp ( ( ln ( x α ) μ ) 2 σ 2 )
From the following figure, it can be seen that the data feature of being skewed to the left distribution is described well through the function (the specific fitting distribution can be seen from Figure 4).

4. Model of Decision-Making Risk Forecast Based on RCF

It can be seen from the above analyses that the cost overrun is relatively common in megaprojects in China. On the basis of measuring the optimism bias distributions of bridge megaprojects in China, this paper further considers how to make more reasonable decisions during the decision-making process according to the cost overrun risk and cost-benefit theory, when decision-makers realize optimism bias and predict that cost overrun is possible in the project.
This section builds a model with the combination of RCF and cost-benefit theory. Compared with the traditional cost-benefit theory, the model not only considers the explicit economic benefits but it also takes the implicit social benefits into account.

4.1. Initial Model

In the past, researchers have mainly stated that the feasible prerequisite for a project is for the NPV (net present value) (The NPV referred to here is mainly discounted from the initial year of the construction project). of the project to be greater than or equal to zero but the benefit is mainly limited to the actual economic income from tolls and the cost is mainly limited to the construction and operation. However, in fact, in addition to the explicit direct income, there are many potential implicit benefits. In this paper, the indirect benefits of traffic projects are divided into two parts: enhancing the regional economy and reducing traffic costs.
In this section, bridge projects are taken as an example and cost-benefit theory is used as the theoretical foundation to construct the model. Assuming that the basic condition for the construction project is that its income can cover the cost, that is, the profit is greater than zero and considering the long construction period of megaprojects, the time value must be considered. Thus, the decision-making model is described as follows.
N P V T = t = T 0 + 1 T t o l l E x p l i c i t B e n e f i t s ( E B ) ( 1 + r ) t + t = T 0 + 1 T I m p l i c i t B e n e f i t s ( I B ) ( 1 + r ) t t = 1 T 0 C o n s t r u c t i o n C o s t ( C C ) ( 1 + r ) t t = T 0 + 1 T O p e r a t i o n C o s t ( O C ) ( 1 + r ) t 0

4.2. Description of Variables

4.2.1. Explicit Benefits

Explicit benefits (EB)refers to the rapid realization aspect after the completion of a bridge project and this aspect mainly comes from tolls and fees.
E B = i j P Q i , j
In this context, i and j do not refer to the starting and ending points of the bridge. Instead, they refer to the relevant departure and destination cities near the bridge. The total flow of the bridge refers to the sum of the traffic flow through the bridge between these cities. Qis usually considered in accordance with the Geometric Brownian Motion (GBM): d Q t = θ Q t d t + γ d z . In the formula, θ and γ are constants, separately representing the estimated growth rate of the traffic volume and the volatility of the traffic volume. dz is the increment of the Wiener process and is in accordance with the normal distribution, among which E (dz) = 0, E(dz)2 = dt [21]; every parameter of GBM with which Q i , j is in accordance is different. It should further be noted that the traffic flow from Place i to Place j is equal to that from Place j to Place i. Thus, double counting is omitted.
Generally, the tolls of some bridges may be adjusted every a few years in China. Based on this, the annual growth in tolls can be calculated according to the compound annual growth rate.
E B t = i j P 0 ( 1 + r p ) ( t T 0 ) Q ( i , j ) , t = i j P 0 e r p ( t T 0 ) Q ( i , j ) , t

4.2.2. Implicit Benefits

During the operation period, a bridge project will not only bring direct economic benefits but it will also play a potential role concerning passengers and the development of the area where the project is located.
(1) Passengers’ benefits
The completion of a traffic project can usually shorten passengers’ transit time and reduce fuel costs according to Fresno model [13], which defines the criteria of government decisions as the minimization of system costs and maximization of profits. Verhoef [22] argued that senior decision-makers would take the minimization of transport system costs into account, especially transit time and fuel consumption. In the research report on the feasibility of Hangzhou Bay Bridge, the national economic benefits are defined as the benefits of transport cost reduction, the time-saving benefits of new projects and the lost benefits of traffic accident reduction. Among them, the on-the-way time that passengers save should be considered according to the gross product in China created by the passengers’ time saved. It is believed that 40% to 60% of the time saved will be utilized again according to the feasibility analysis report of Hangzhou Bay Bridge. However, this paper argues that traffic accidents are difficult to measure in most cases and passengers’ benefits are simplified as the growth in the regional GDP and the reduction in fuel costs that are caused by the decrease in transit time.
In general, compared with the prior detours and ferries, cross-regional bridges have many advantages. As ferry modes involve new measurement baselines that are relatively complicated, only the differences in personal utility prior to and after completion are compared in this paper, which means that the highway passing methods before the bridge completion is used for comparison. Rouhani et al. [23] put forward the following Rouhani model of system cost minimization:
Min   i j β t t i j ( x i j * ) x i j * + k i j β k λ k ( L i j t i j ( x i j * ) ) L i j x i j *
The first half of the formula is the total traffic duration and t i j ( x i j * ) is the function of the transit time on each route. Fuel consumption is calculated according to the waste release. λ k is the emission factor (g/m), a nonlinear function of velocity ( L i j t i j ( x i j * ) ) . To determine the emission amount of each traffic route, it is necessary to multiply λ k by the length of the traffic route L i j and the traffic flow x i j * . Because the measurement units of the total traffic duration and fuel consumption are different, the two parts should be monetized. β t is the monetary value of time ($/h) and β k is the cost of the emission of gas k ($/t). The model EMFAC-2011 [24] is used to measure and calculate λ k . β k includes: CO2 $25/t, CO $250/t, NOX $7000/t [25,26]. The average time value β t is $14/h. In the Fresno model, this value is $16.79 [27].
However, the above model does not take passengers’ benefits into account. A car can hold many passengers and the benefits obtained from the saved time should also be applicable to them. Passengers’ on-the-way time value can be understood as the value of production that is generated due to the saved time, specifically the GDP created by the saved time. In addition, calculating the fuel consumption by the exhaust gas is relatively complex due to the lack of data about the emissions of a single type of gas. However, the passing speed on the bridge is usually limited to a certain range. Additionally, the fuel consumption is relatively easy to measure if the shortened travel distance is calculated and the distance is multiplied by the price of fuel consumed every kilometer. Thus, on the basis of the Rouhani model, the two variables are modified in this paper. In addition, in the past ten years, the fuel price in China has been rising, so we assume the fuel price will increase as time passes and the disposable income per capita will rise, are assumptions in the model. This will result in a change in the time value. Finally, the variable can be modified as follows:
P B t = i j ω Q ( i , j ) , t Δ m i , j α β 0 ( 1 + r β ) ( t T 0 ) + i j Δ m i , j V P g 0 ( 1 + r p g ) ( t T 0 ) Q ( i , j ) , t = i j ω Q ( i , j ) , t Δ m i , j α β 0 e r β ( t T 0 ) + i j Δ m i , j V P g 0 e r p g ( t T 0 ) Q ( i , j ) , t ( i j )
(2) External benefits
Investment in mega-infrastructure construction in Europe has been high. It is difficult to recover the megaprojects and operation costs dependent only on toll income. However, the external benefits of megaprojects are undeniable and they can promote regional economic and urban development. According to the principles of traffic economics, the flow radius of production factor resources is determined by traffic conditions rather than geographical location to a large extent. From this perspective, it is more important to measure the time distance of accessibility [28]. After the completion of traffic project, “shortening the time distance to change the space distance” makes the labor mobility more convenient and improves the efficiency of resource allocation. At the same time, the shortened traffic time distance reflects the “urban integration” of regional cities. This means that the infrastructure and services in one city can be shared by other cities more frequently and people flow, material flow, information flow and business flow break through the traditional boundaries of administration regions [29]. At this level, the completion of traffic project plays a role in boosting a region’s economy.
It is generally believed that the bridges can shorten the distance between cities and greatly enhance the accessibility. In particular, for those cities of which the physical distance is short but not very short, the improvement in convenience can greatly increase the opportunities of trade and labor markets between the two places [30]. Since Harris [31], there has been a tradition in the research of the new economic geography that the variables of the city access to regional markets can be calculated through the weighted sum of the GDP or population distance. The formula is shown below:
M A h , t = g G D P g , t e λ t t h g , t + 1
Hanson [32] defined the indicator as a “market potential” indicator to show the economic link between a city and surrounding cities. He argued that the economic relationships among the surrounding cities are related to the sizes and traffic distances of the surrounding cities. This has a positive correlation with the sizes of the surrounding cities and a negative correlation with the distances between cities.
Relevant studies have been conducted based on this model in some empirical analyses. The results demonstrate that the “market potential” of a prefecture-level city in a particular district is significantly related to the collection of manufacturing space [33]. Ahlfeldt and Feddersen [34] argued that the variables of “market potential” are used in the analysis of the impact of the transport infrastructure on the overall development of the city. By constructing a function of market potential changes, it shows the change of the radiation effects caused by the shortened urban distances.
The model of “market potential” changes is as follows:
χ h = log ( g G D P g , t e λ t t h g , t + 1 g G D P g , t e λ t t h g , t )
Zheng and Kahn [30] optimized the model of “market potential” and defined “market potential” as a function of the purchasing power of surrounding cities with traffic connections through the distance weighted. They posited that the traffic construction mainly has a great impact on the tertiary industry. This can be described in detail as follows:
M P i , t = j I N C O M E j , t e λ T i j , t = j P O P j , t I N C O M E _ P C j , t e λ T i j , t
To discuss the influence on the construction externality after the completion of the bridge, this paper constructs a “market potential change” Δ M P i , t combined with the studies of Zheng and Kahn [30], Ahlfeldt and Feddersen [34], which is, calculating the market potential before and after the completion of the bridge and using the difference as the radiation effect of the bridge completion on the city. To prevent the confusion between transit time and the time used in the summation formula, m is used to represent transit time.
Δ M P i , t = M P j , t M P j , t t 0 = i j Q ( i j , t ) α R V P O P j , t I N C O M E _ P C j , t e 60 λ m g , h P O P j , t I N C O M E _ P C j , t e 60 λ m 0 i , j = i j Q ( i j , t ) α R V ( 1 + r R V ) ( t T 0 ) P O P j , T 0 ( 1 + r p o p , j ) ( t T 0 ) I N C O M E _ P C j , T 0 ( 1 + r i n c , j ) ( t T 0 ) ( e 60 λ m i , j e 60 λ m 0 i , j ) = i j Q ( i j , t ) α R V e r R V ( t T 0 ) P O P j , T 0 e r p o p , j ( t T 0 ) I N C O M E _ P C j , T 0 e r i n c , j ( t T 0 ) ( e 60 λ m i , j e 60 λ m 0 i , j )   ( i j )

4.2.3. Cost

The costs of bridge projects are mainly divided into the construction cost and the operation cost.
(1) Construction cost
As this paper focuses on the possibility of cost overrun in consideration of optimism bias, it is necessary for the study to take the expected cost overrun into account and set the construction cost as follows: C C = C C 0 · ( 1 + n ) . C C 0 refers to the initial investment amount determined according to the project feasibility analyses at the preliminary stage. n refers to the cost overrun ratio. For the cost during period t, we can assume that the construction costs are the same during the construction period. Therefore: Construction cost:
C C t = C C = C C 0 · ( 1 + n ) T 0
(2) Operation and maintenance cost
In general, there is a particular link between operation cost and construction cost. The operation costs of bridges include fixed costs and variable costs and the fixed costs are determined by its construction costs because the increase in construction costs means, to a certain extent, an improvement in project quality and it can reduce the fixed maintenance costs during the operation period. According to “the 2007 Research Report on Fund Demand in National Highway Maintenance and Management of China”, the operation costs in the tth year can be calculated as follows:
O C t = M T 1 T 2
In the formula, M refers to the fixed cost. The fixed operation and maintenance cost is M = k 1 C C 0 a . α > k 1 are both constants and α > 0.
T1 refers to the modified coefficient of traffic volume, which is, k 2 Q , k 2 is a constant and k 2 > 0; T2 refers to the modified coefficient of road service time, showing an exponential growth as the operation time changes. It is e k ( t T 0 ) . k is a constant and k > 0;
Therefore, the operation cost is:
O C t = k 1 k 2 ( C C 0 ( 1 + n ) ) a Q t e k ( t T 0 )

4.3. Modified Model

In most cases, a bridge was built mainly to solve traffic terminal contradictions between two places or to help a place receive the economic radiation effects from other big cities that are cut off due to traffic. Therefore, the model above can be simplified and it only needs to describe the megaproject decision-making model for two places.
The change in relevant cities can first simplify the description of variables obtained from the direct economic benefits. In this situation, instead of separately calculating and adding the traffic flow in the cities along the bridge, it only needs to determine the traffic flow between the core city A and B within a given distance. It can be regarded as Q, the traffic capacity for the entire section of the bridge. In the description of passengers’ benefits, there is also no need to calculate and add all transit time changes in the cities along the way. In addition, the regional driving function can be simplified as the sum of economic effects between city A and city B after bridge completion.
Therefore, according to Formulas (1)–(13), simplify (1 + r)t as e−rt, the modified model can be concluded:
= t = T 0 + 1 T t o l l e r t P 0 e r p ( t T 0 ) Q t + t = T 0 + 1 T e r t ( ω Q t Δ m g , h α β 0 e r β ( t T 0 ) + Δ m g , h V P g 0 e r p g ( t T 0 ) Q t ) + t = T 0 + 1 T e r t Q t α R V e r R V ( t T 0 ) ( P O P g , T 0 e r p o p g ( t T 0 ) I N C O M E _ P C g , T 0 e r i n c , g ( t T 0 ) ( e 60 λ m g , h e 60 λ m 0 g , h ) + P O P h , T 0 e r p o p h ( t T 0 ) I N C O M E _ P C h , T 0 e r i n c , h ( t T 0 ) ( e 60 λ m g , h e 60 λ m 0 g , h ) ) t = 1 T 0 e r t C C 0 ( 1 + n ) T 0 t = T 0 + 1 T e r t k 1 k 2 ( C C 0 ( 1 + n ) ) a Q t e k ( t T 0 ) ( i j )

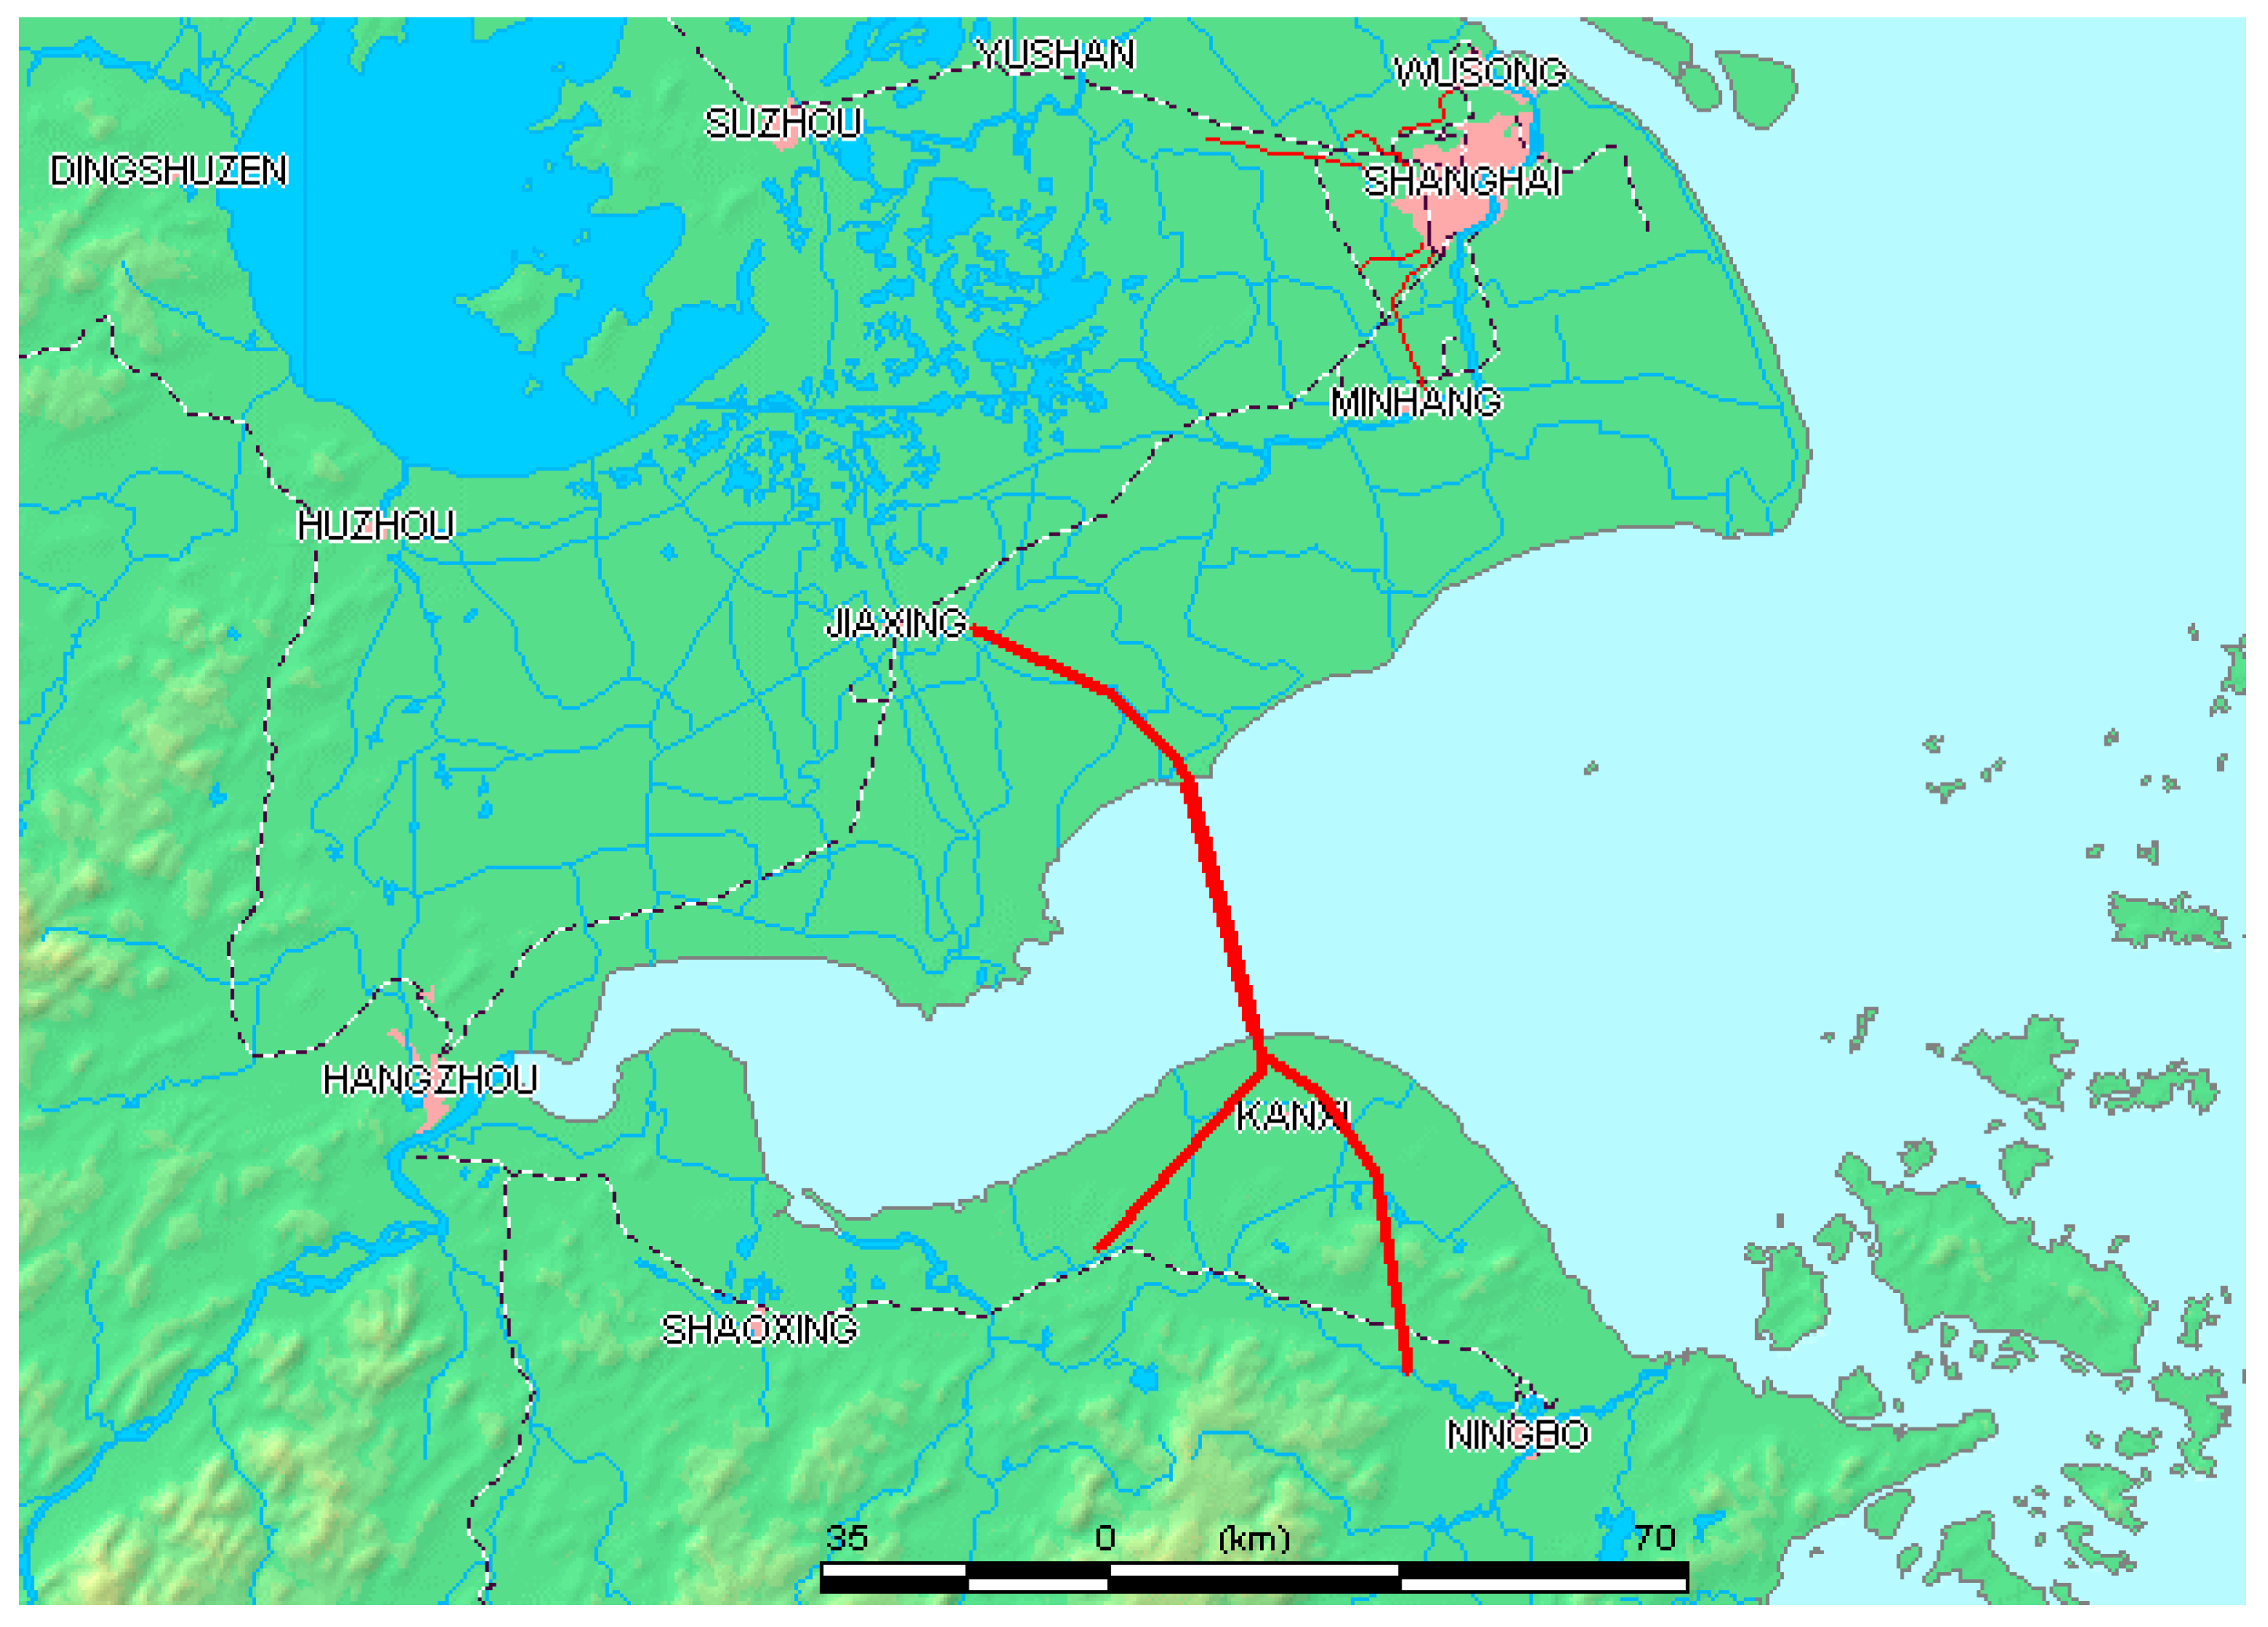
5. Case Study: Hangzhou Bay Bridge

5.1. Introduction of Hangzhou Bay Bridge

Hangzhou Bay Bridge is a highway bridge across Hanzhou Bay in the eastern coastal region of China. The megaproject is one of the longest sea-spanning bridge with the total length of 36 km. The project started in June 2003 and was completed on June 2007. It connects Ningbo city and Jiaxing city in Zhejiang province (see Figure 5) and reduces travel time between Ningbo and Shanghai from 4 h to 2 h. The completion of Hangzhou Bay Bridge changes the traffic situation in Ningbo, promotes the tourism development in Jiangsu province, Zhejiang province and Shanghai, directly boosts the economic and social development in Ningbo and Jiaxing and stimulates the development of the surrounding areas.

5.2. Parameters Hypothesis

Hangzhou Bay Bridge is taken as an example in this paper, which adopts parametric hypotheses and conducts analyses of the PVT model. It is found that the core benefits of the model are mainly the direct and indirect benefits that Hangzhou Bay Bridge brings to Hangzhou and Shanghai. The basic parameters of the bridge, the parameters of the direct economic benefits, the passengers’ benefits, the regional radiation effects and the cost parameters are assumed on the basis of the model. The parameters are as follows in Table 2.

5.3. Discussion

It is worth noting that the construction cost in the model is based on the results demonstrated through RCF, as mentioned in Section 4.3. This means that the cost overrun distributions and degrees of China’s bridge projects concluded in the previous section will be used for calculating the final construction costs. Based on this, the NPV distribution in the final decision-making model is used for the analysis of the situations in which the NPV is greater than zero to consider the acceptable cost overrun.
We raised two research questions at the beginning of the paper, the difference between them is the description of the cost. In the first question, the RCF method is used to obtain the cost overrun distributions and as a whole for the decision-making model. By using the Monte Carlo method to determine the distributions of the NPV, it shows the decision-making risk of the whole project after referring to the cost overrun of previous bridge projects and considering the cost overrun possibilities. However, in the second question, the proportion of the cost overrun is an unknown variable. Further, the question is discussed after obtaining different distributions of NPV through various proportions of cost overrun.
Because the traffic volume Q and the cost overrun proportion n involved in the model are both random variables and their calculations are complicated (involving exponentiation and division calculation of distributions), it is impossible to deduce the probability density function of the final results directly. To solve this problem, the Monte Carlo simulation method is used in this paper to perform the calculation.

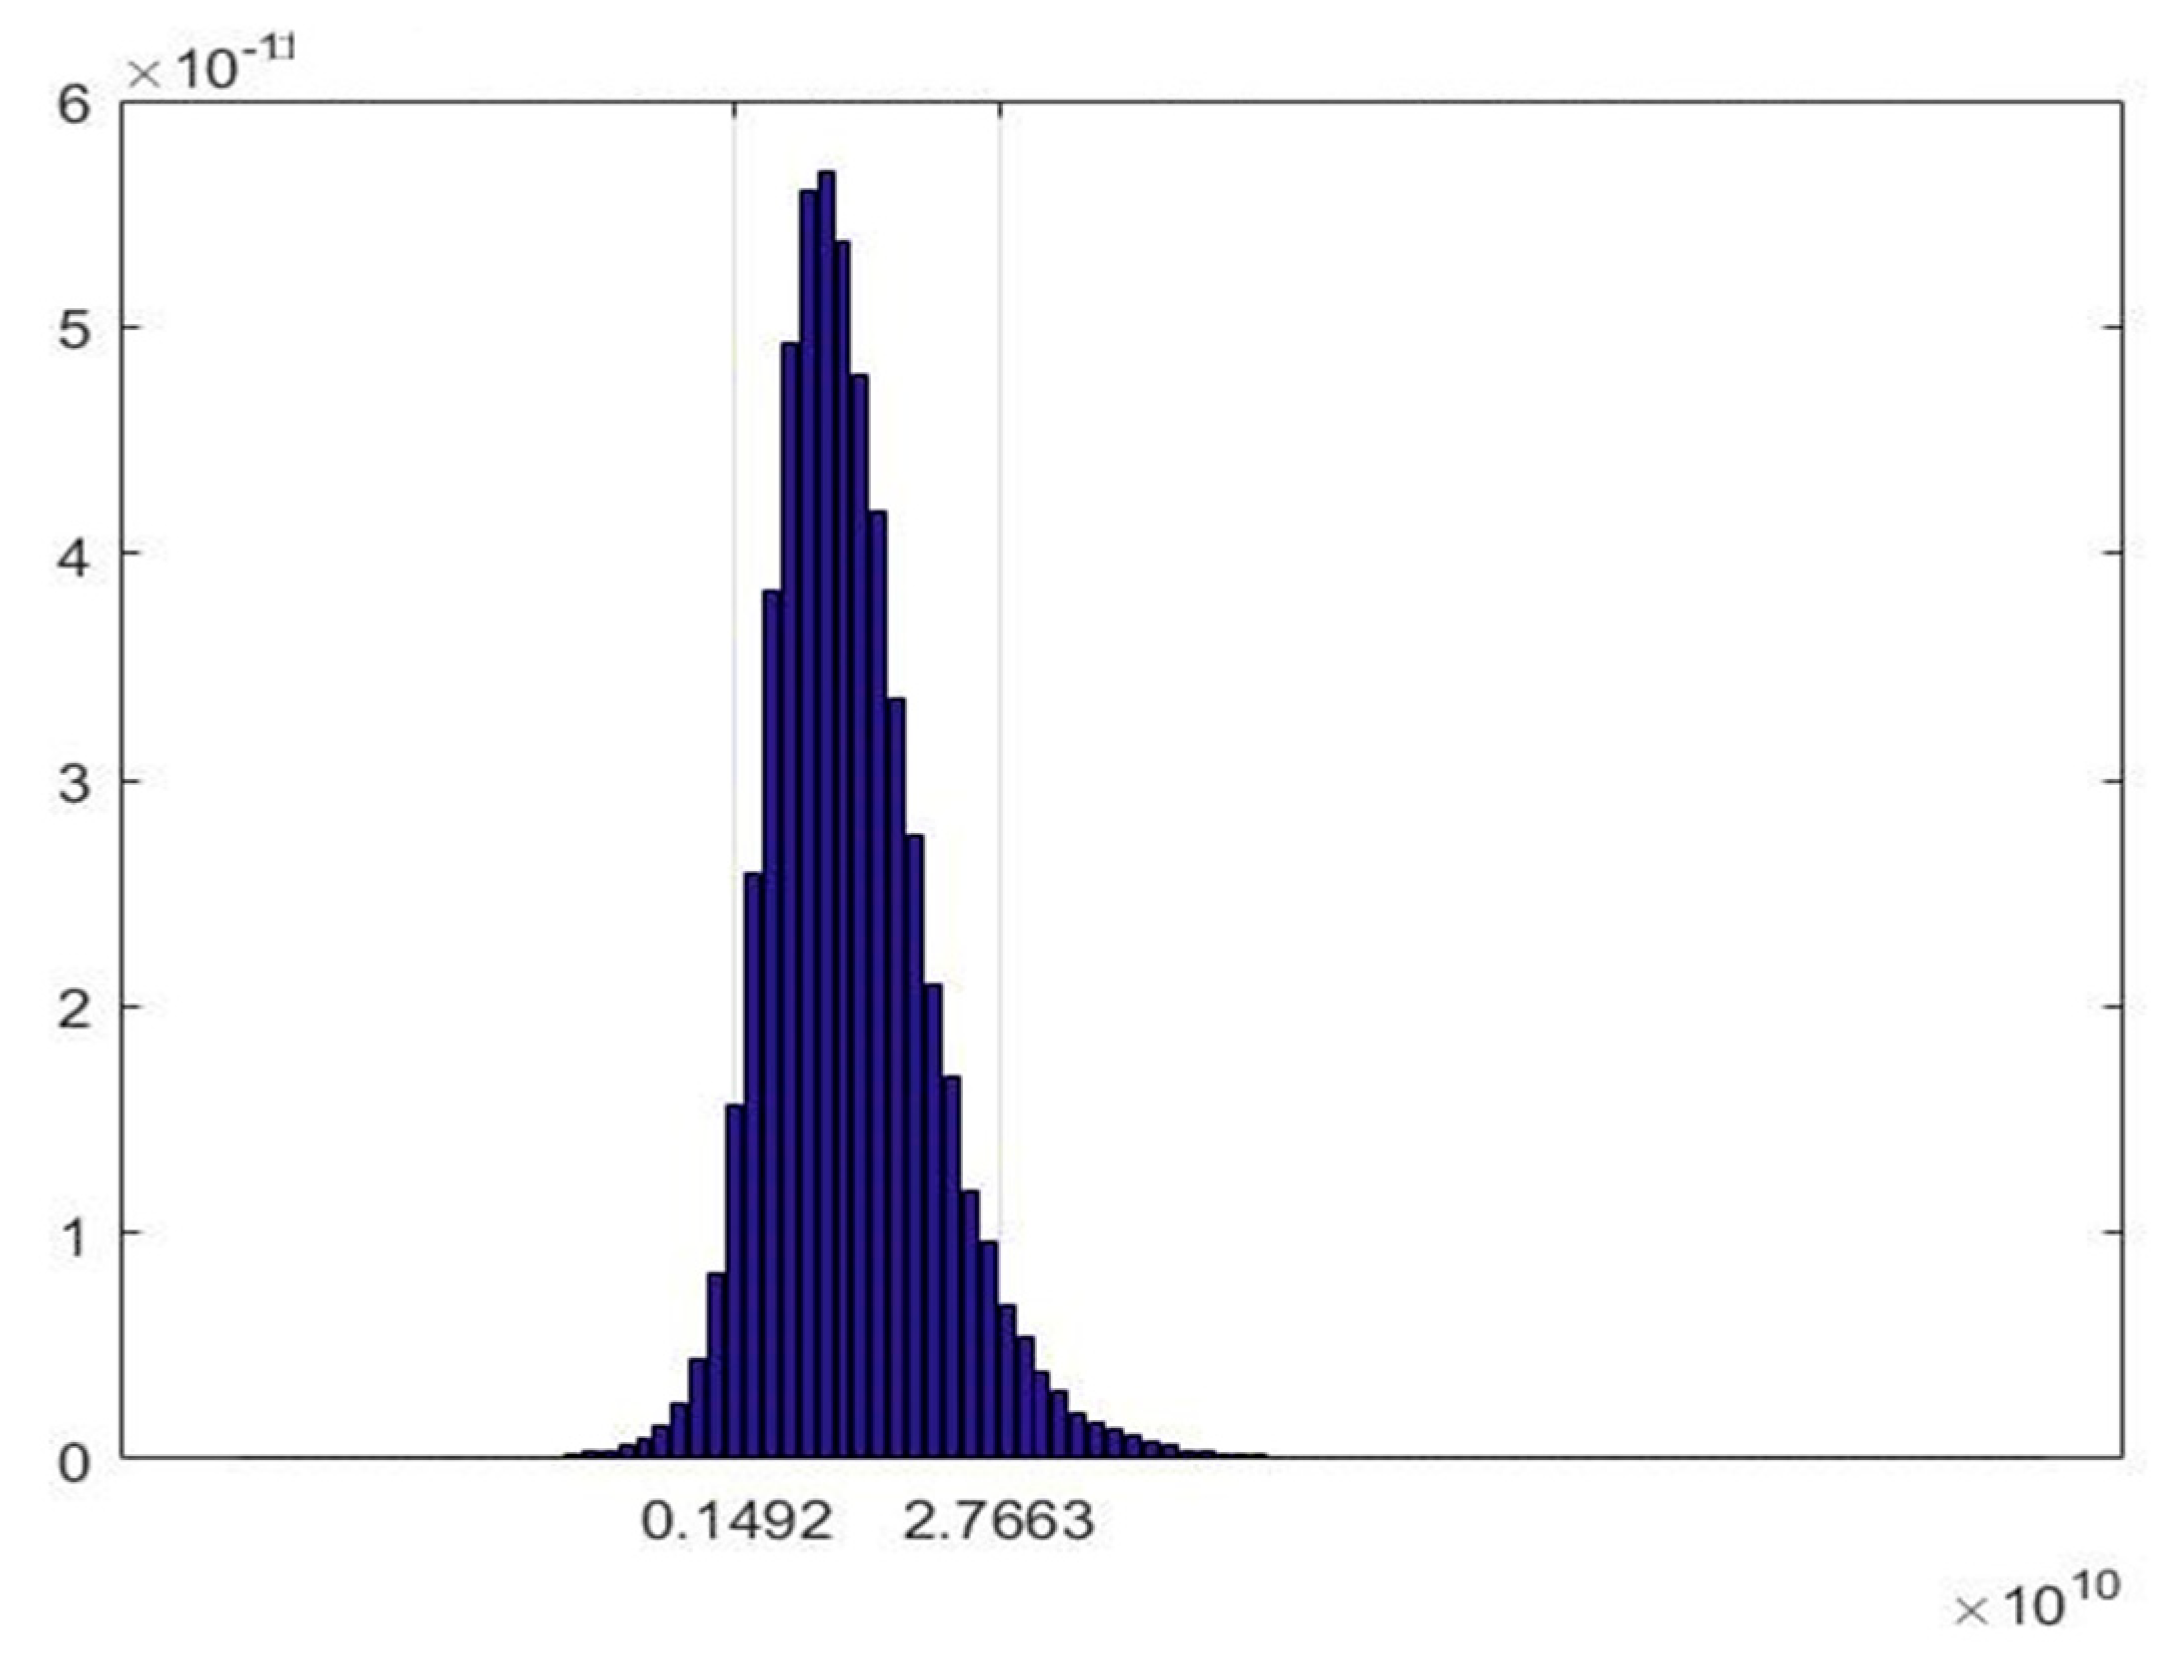
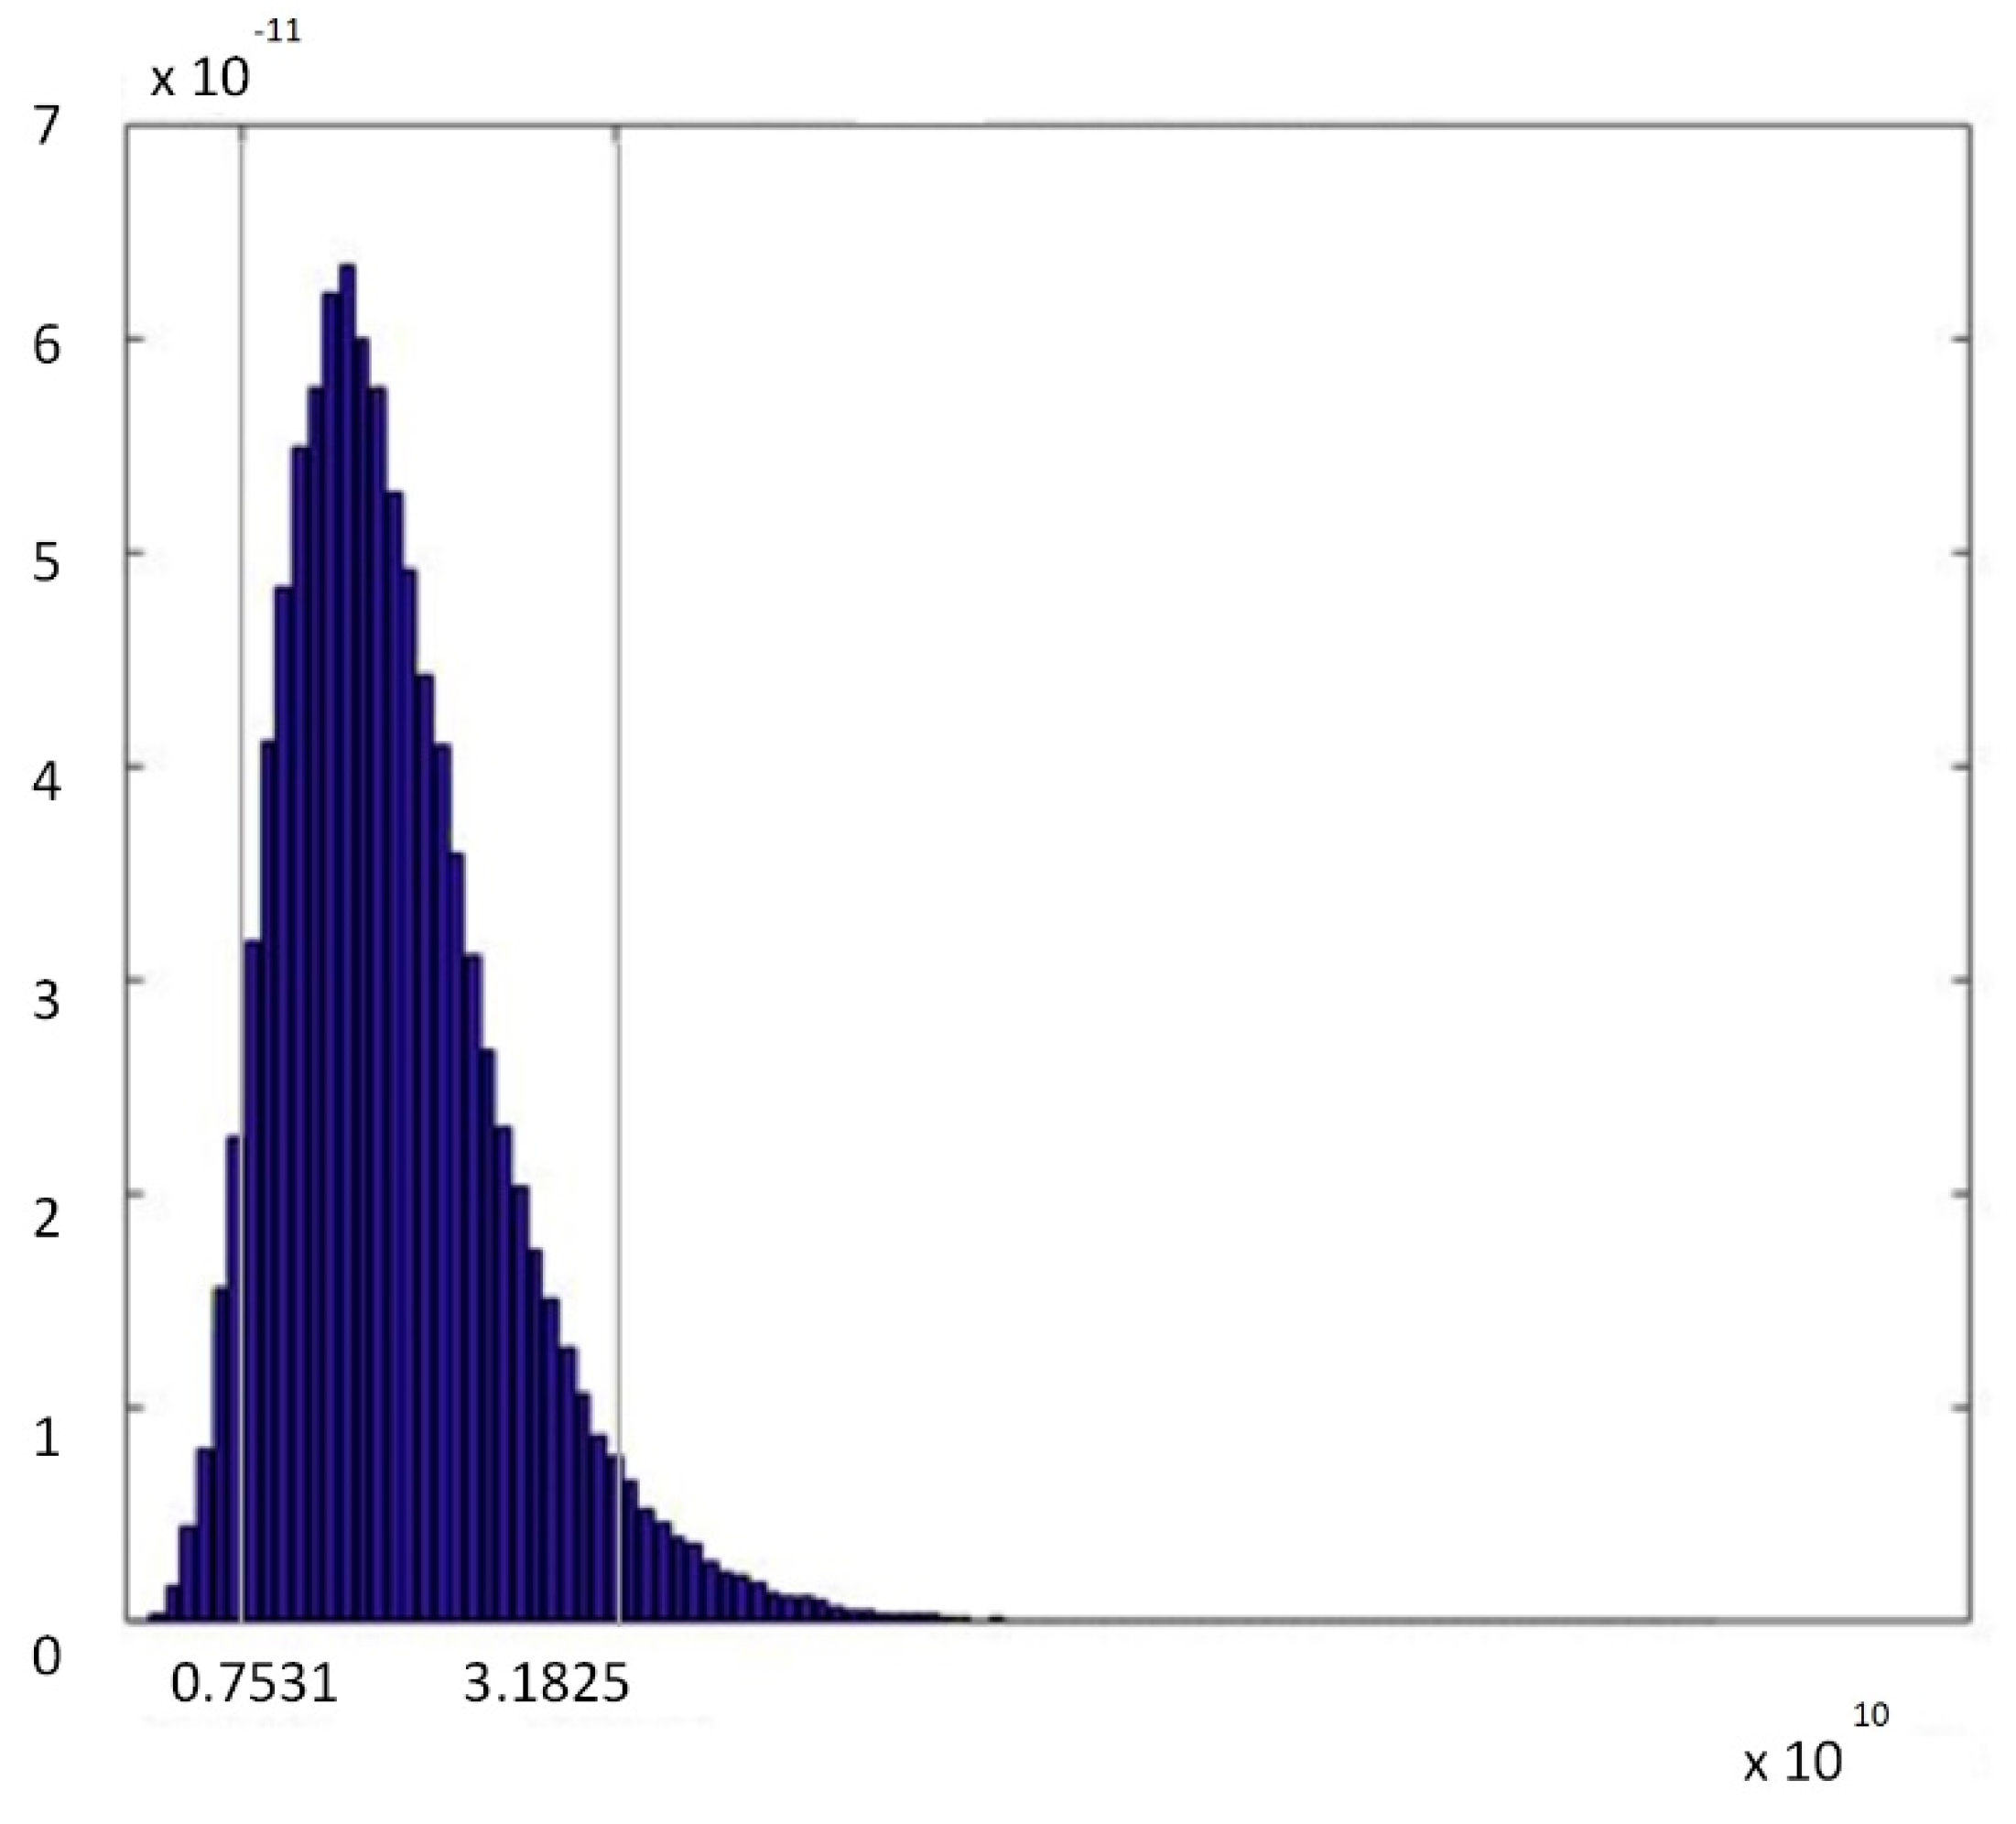
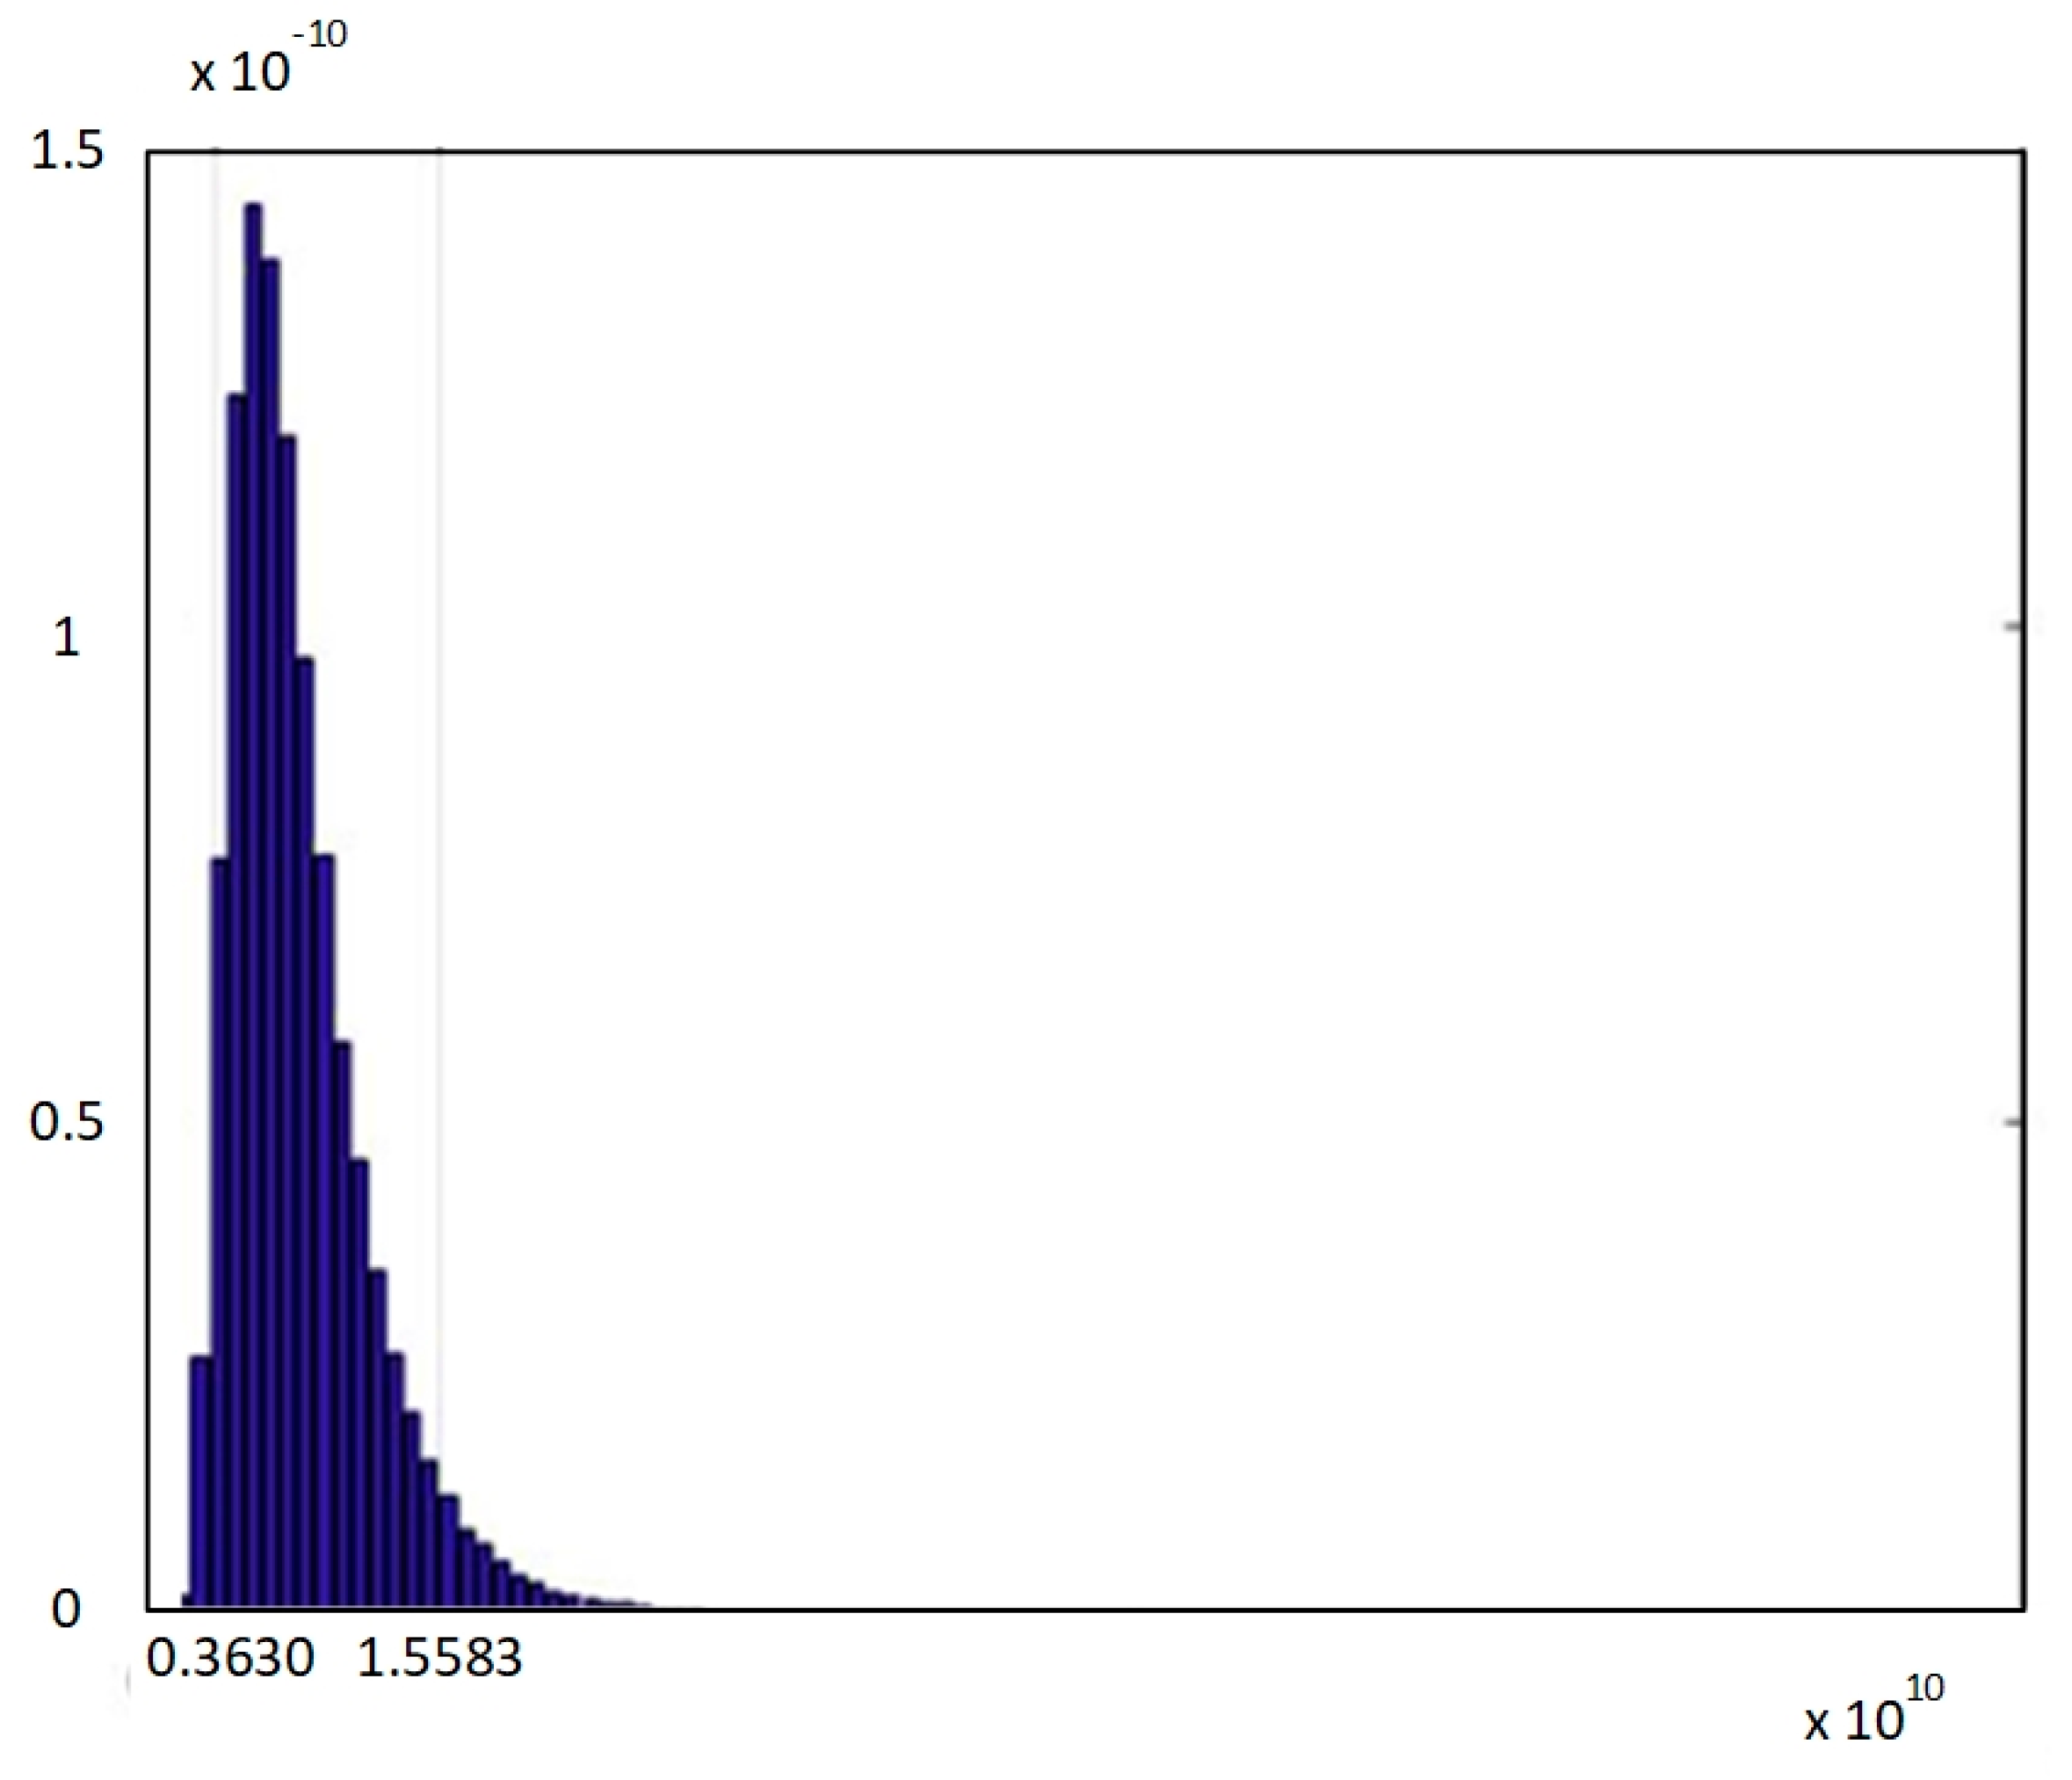
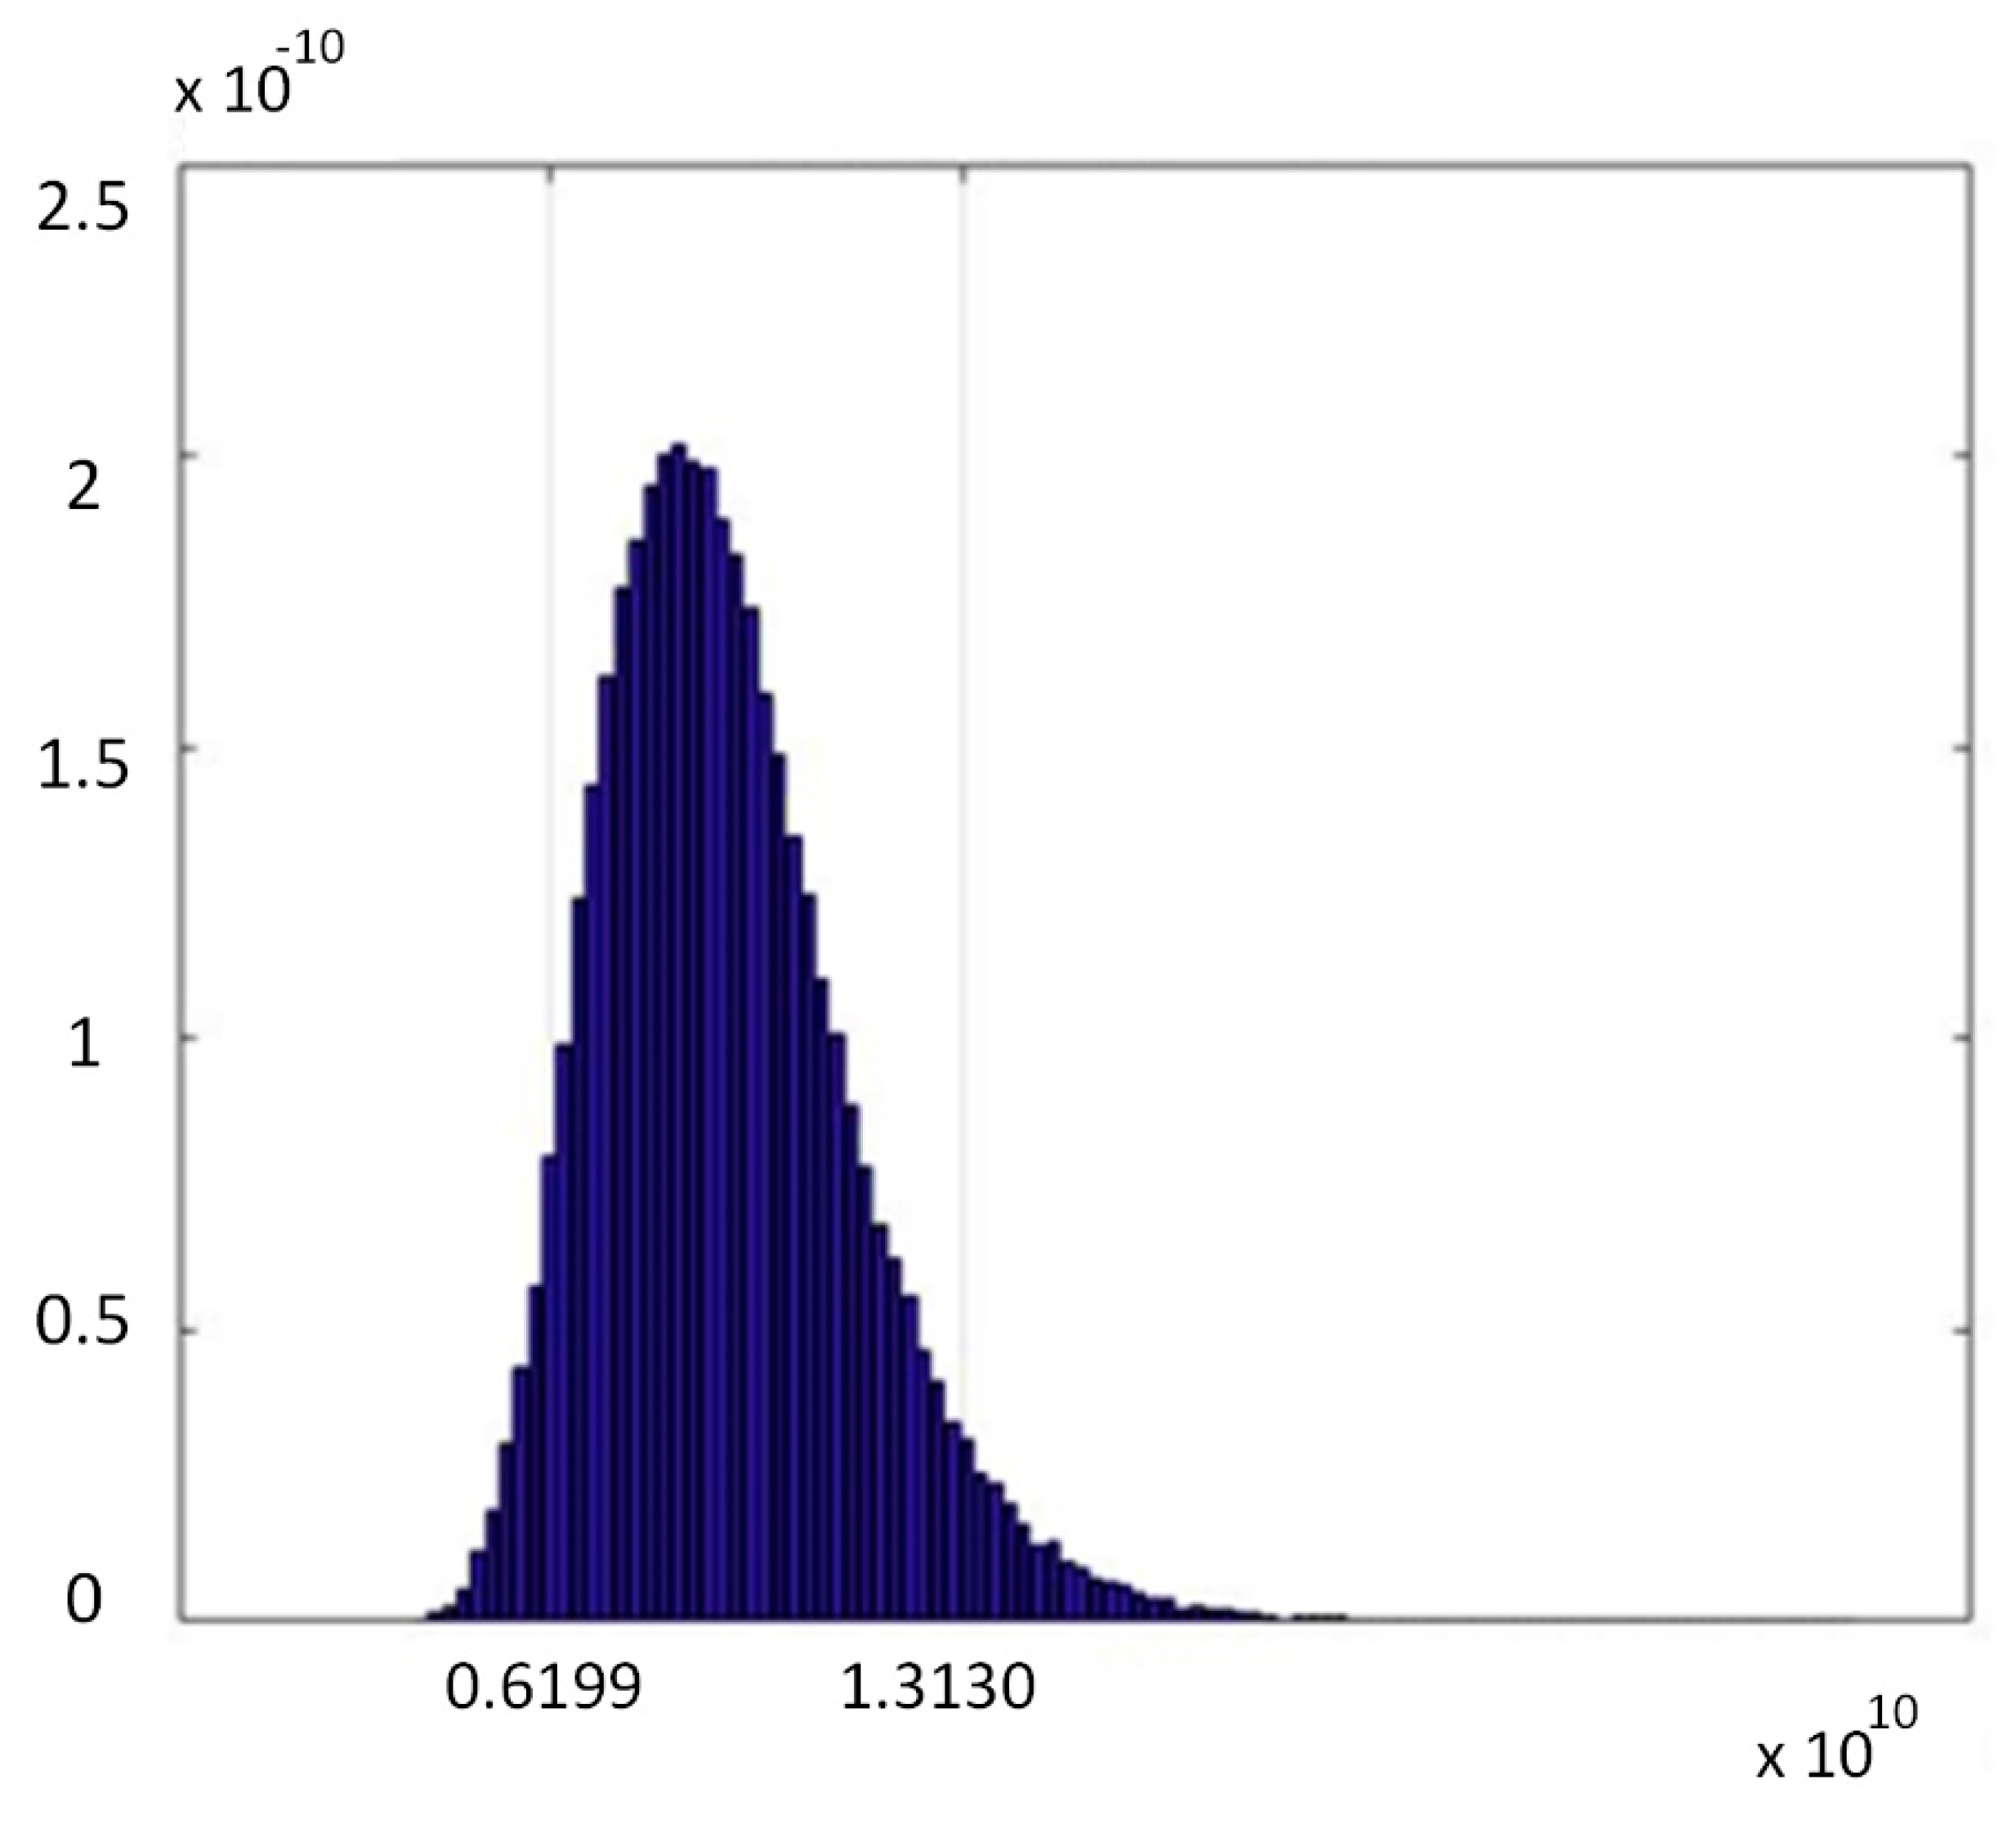
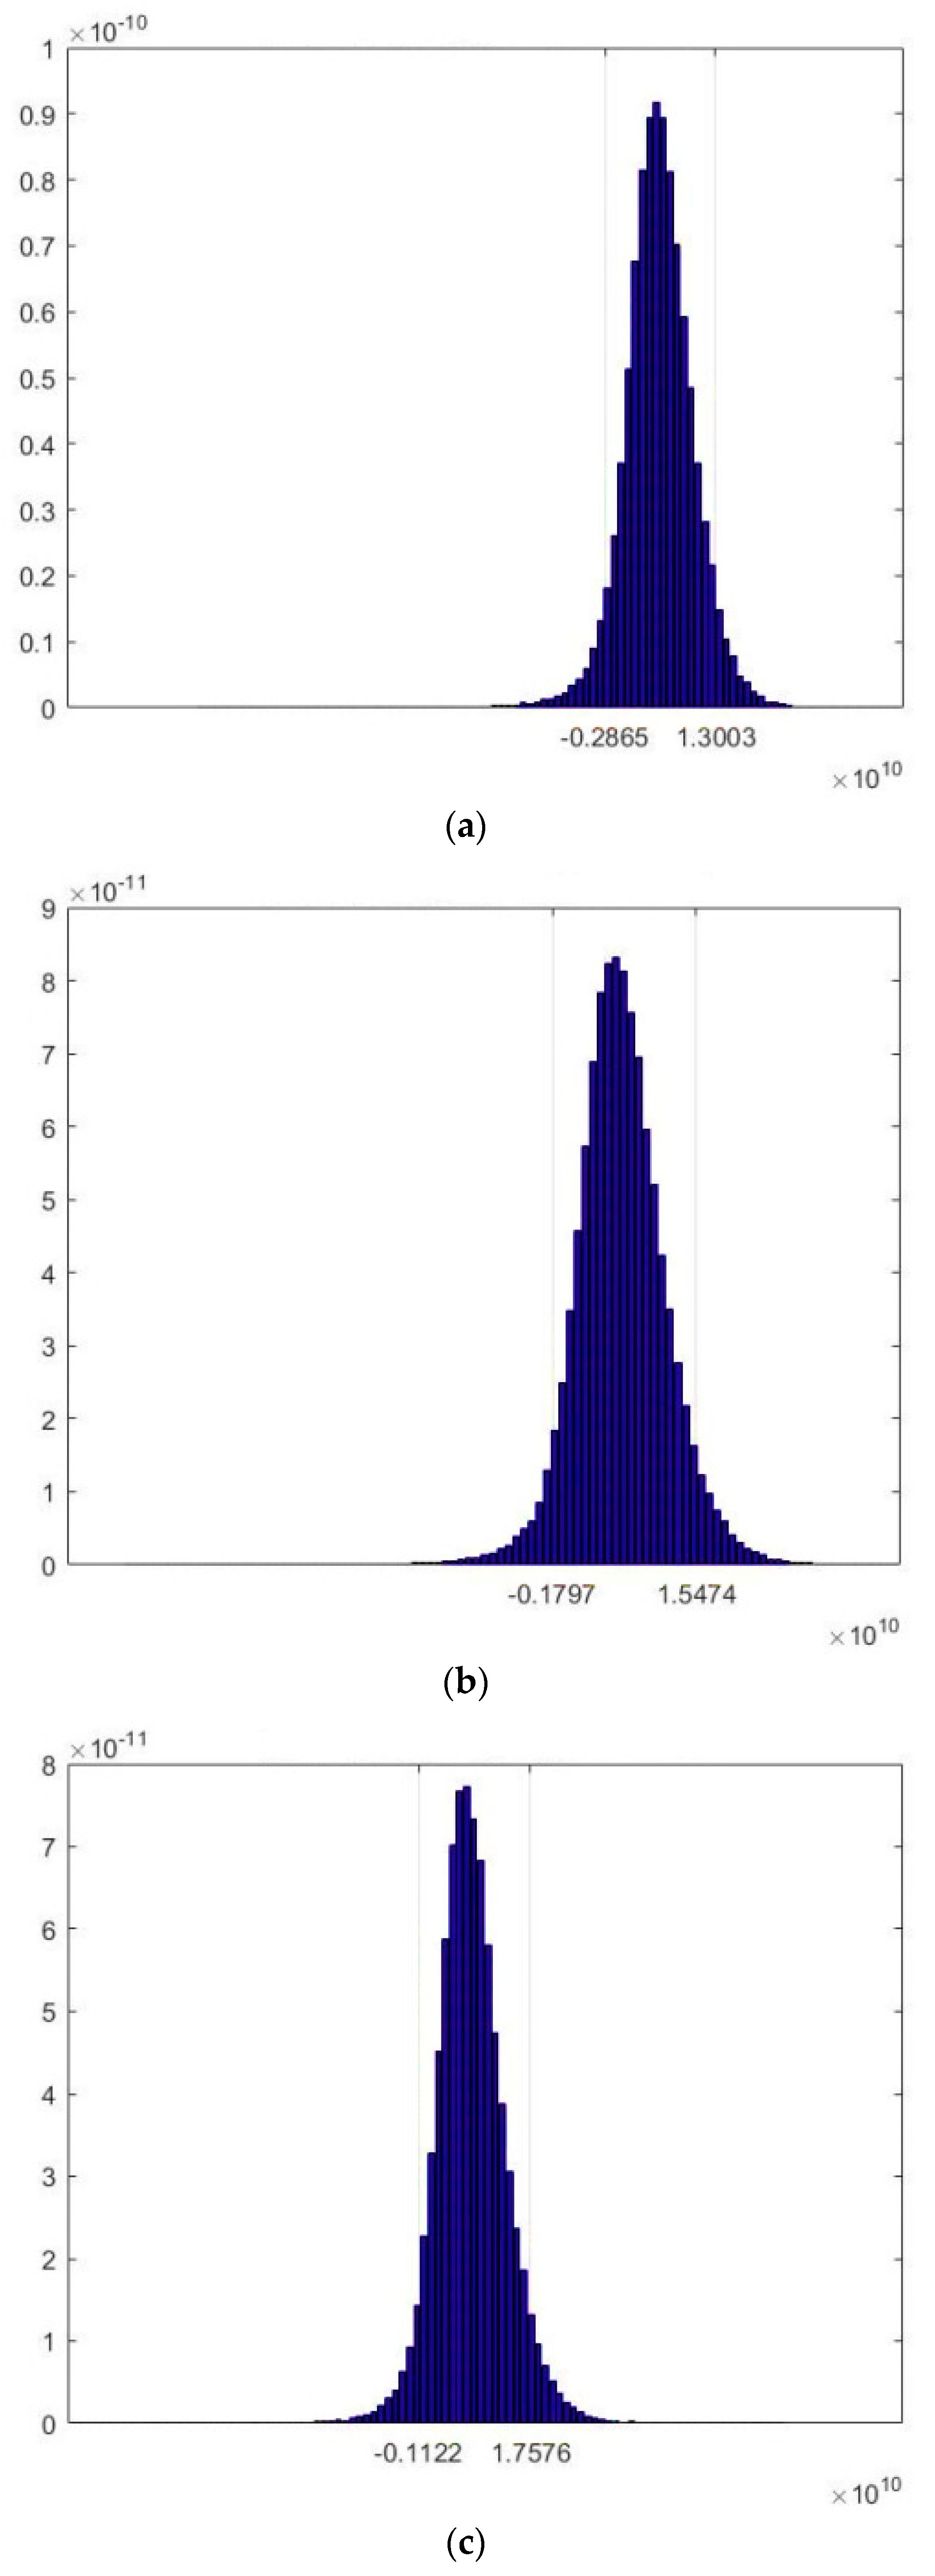
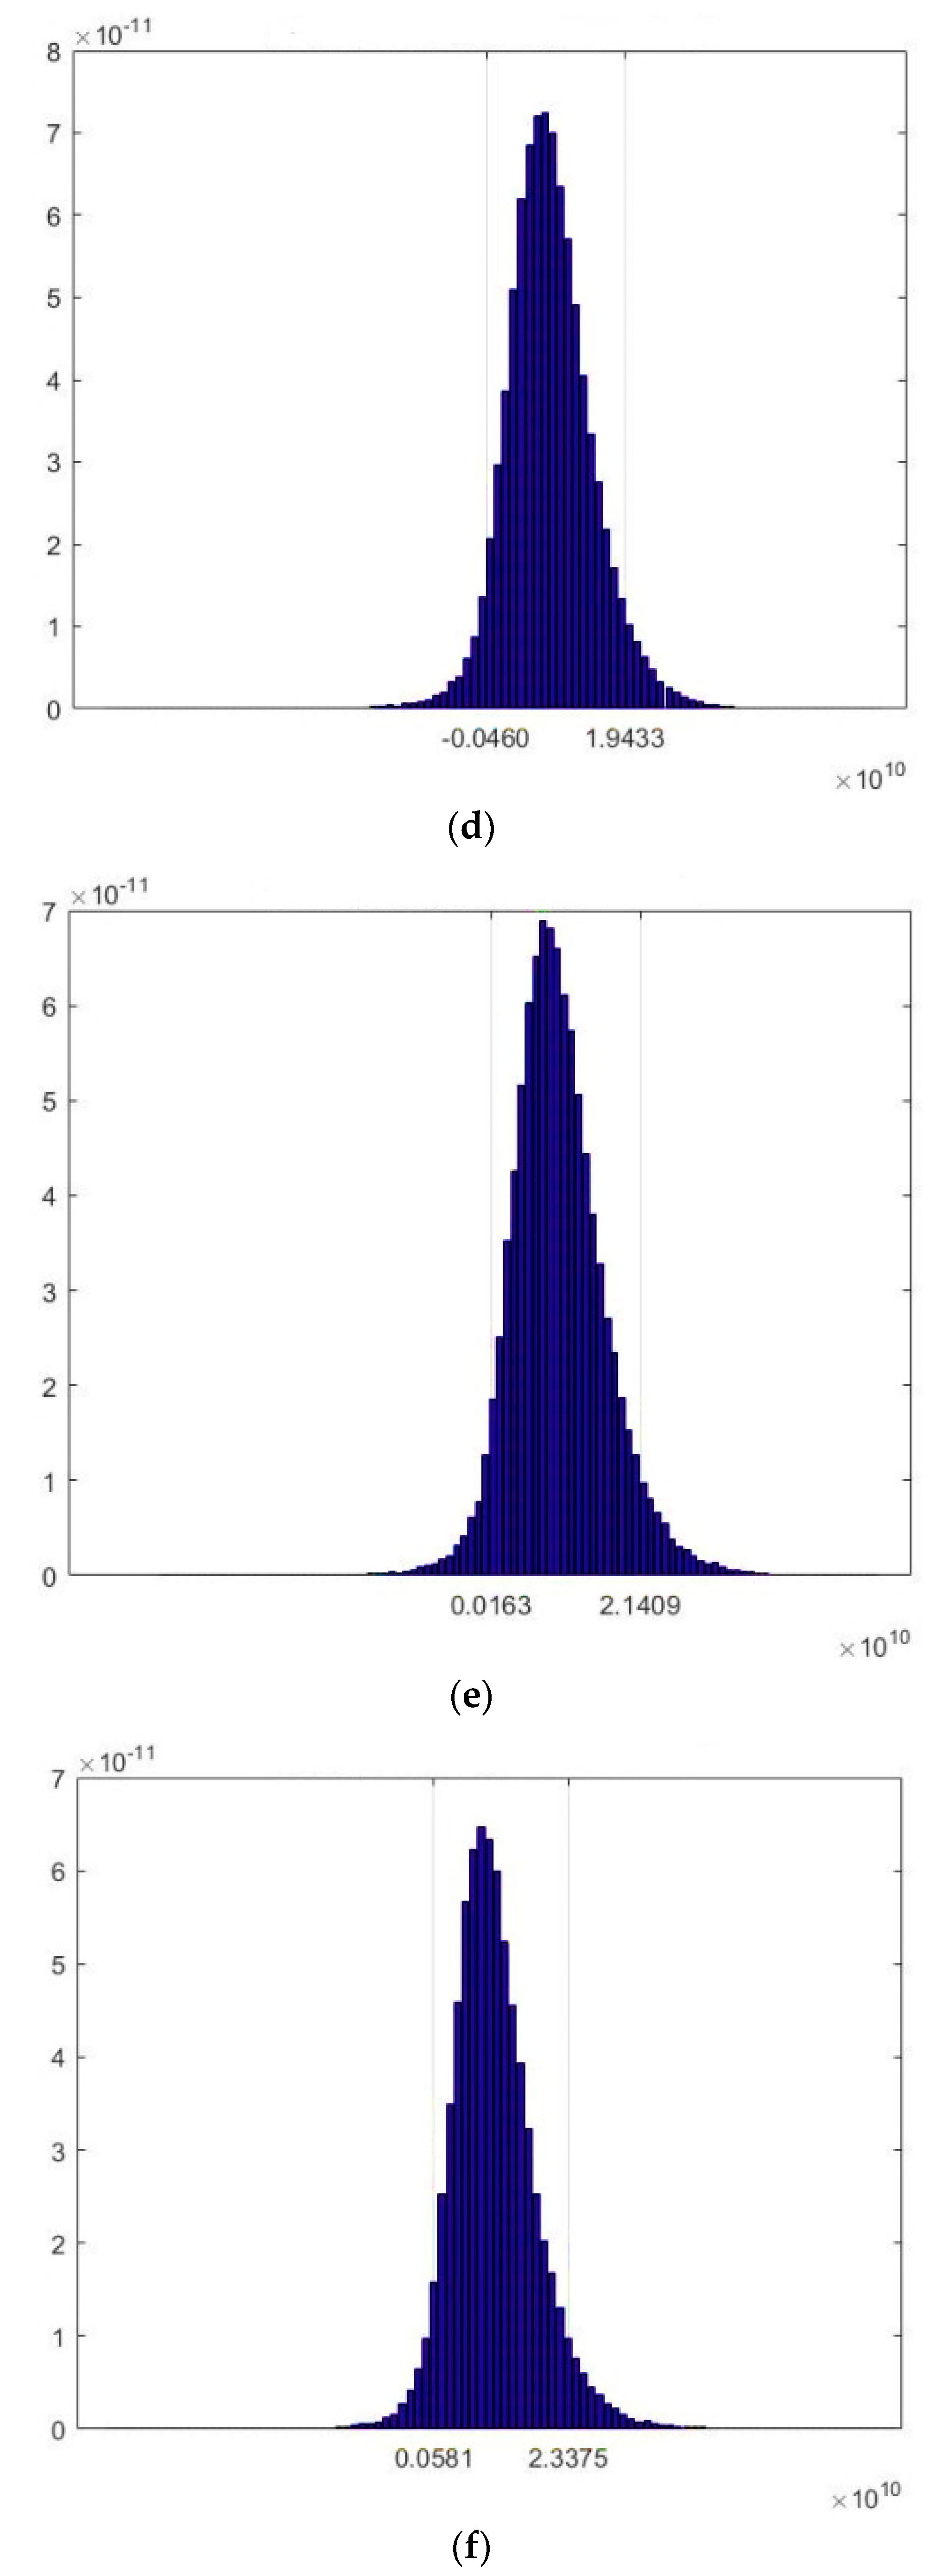
5.3.1. Discussion under Given Situations of Cost Optimism Bias Distributions

(1) Influence of cost overrun predications on NPV results
It is found that Hangzhou Bay Bridge is feasible in the method of RCF based on the cost overrun probability distributions (lognormal distributions) of previous similar projects. Considering the direct economic benefits, implicit benefits and cost overrun, the probability that the NPV of this project is under 0 is only 3.06%, meaning that the project is valuable when the probability reaches 96.94%. The NPV of the project will reach between 1.49 billion (the probability quantile is 5%) and 27.66 billion yuan (the probability quantile is 95%) (see Figure 6).
If only the budget made during the feasibility analysis period is taken as a parameter for the cost of the model without considering the cost optimism bias from the external perspective, the results will show a different change (see Figure 6 and Figure 7). The analyses show that there is no project risk in this situation. The probability that its NPV is greater than 0 is 100% and it reaches between 7.53 billion and 31.83 billion yuan (the probability quantile is 5% and 95%, respectively).
Compared with the considerable benefits generated after the completion of Hangzhou Bay Bridge, its cost and income are relatively small. Thus, decision-makers must consider whether the risk difference brought about by the cost overrun is relatively small (the risk of 3% and risk-free). Although the difference is small, it is still worthy of consideration. Bridges with tremendous benefits, such as Hangzhou Bay Bridge, can expose project risks. For bridges with average benefits or relatively high cost limits, it is necessary to consider project cost overrun. Hangzhou Bay Bridge does not have a considerable influence on construction; however, it can expose the risk in advance through the consideration of the optimism bias of cost.
(2) Influence of implicit benefits on NPV results
This study not only puts forward a decision-making model that considers cost overrun predictions but it also takes the implicit benefits of the project into account. It has been clarified that considering the direct economic benefits, implicit benefits and cost overrun, the probability of an NPV less than 0 is only 3.06% and the NPV of the project will reach between 1.492 billion (the probability quantile is 5%) and 27.663 billion yuan (the probability quantile is 95%).
In fact, the risk in the project operation is relatively high if we consider it only from the perspective of traditional economic cost-benefit models. Under the given cost overrun distribution expectations, if we only consider the toll revenues and cost instead of the implicit benefits of the project, the risk probability of the project will reach 96.82%, which means that there is a probability of 96.82% that the project benefits cannot cover the construction cost and operation cost during the designed life (100 years).
The direct economic revenue comes from tolls. Through the calculation of the model, it is estimated that the traffic volume of Hangzhou Bay Bridge reaches between 4.1 billion and 32 billion vehicles and the NPV of the tolls reaches 6 billion (the probability quantile is 5%) to 12.2 billion (the probability quantile is 95%) yuan. However, under the same traffic distributions, the NPV of its construction costs reaches between 10.8 billion to 19.2 billion yuan, with operation costs between 240 million to 580 million yuan. In this case, the project risk probability is 96.82%.
The actual situation is similar to the estimation. After Hangzhou Bay Bridge was built and opens to the public, it has adjusted tolls several times to increase revenues. In 2013, five years after the bridge project completion, Hangzhou Bay Bridge was still facing financial strain. The financial gap in 2013 reached 850 million yuan compared with the toll revenue of Hangzhou Bay Bridge in the first half year of 2013, which just reached 643 million yuan.
According to the general cost-benefit model (see Figure 8), the megaproject is not worthwhile and it definitely is not a perfect project if we consider its benefits. However, one cannot evaluate a megaproject solely from the economic point of view. The essence of a megaproject lies in its convenience for residents and the potential promotion of the national economy. In fact, Hangzhou Bay Bridge makes great contributions in this regard. The implicit benefits brought by the project, such as the social linkage, reduced travel time for passengers and tourists and the reduction in fuel costs cannot be ignored.
The NPV of the implicit benefits of the whole project is mainly between 10.32 billion and 29.64 billion (the interval probability is 90%) yuan (see Figure 9). In particular, the value brought by the decrease in transit time is between 3.63 and 15.58 billion yuan (see Figure 10); the value brought by the decrease in fuel costs is between 6.2 and 13.13 billion yuan (see Figure 11) and the regional value is between 242 million and 1.51 billion yuan (see Figure 12). (Due to their own developed economies in Shanghai and Ningbo, the probabilities of the interval mentioned above are all 90%.).
Therefore, considering the implicit benefits and all of the possible cost overrun, Hangzhou Bay Bridge is still a bridge worth building with higher potential value.
(3) Influence of the project’s operation time on the NPV results
Sometimes the situation that the actual operation period of a project is less than the designed life may appear due to the too-heavy load, excessive depreciation or force majeure. It is found that when the project cycle of Hangzhou Bay Bridge is less than 75 years (that is, when the operation period is less than 70 years), the project risk will sharply become greater. When the project cycle is greater than 75 years, the probability of project NPV < 0 will increase by 0.5–0.6% for the reduction in project cycle every 10 years. However, when the project cycle is less than 75 years, the probability of project NPV < 0 will increase sharply for the reduction in project cycle every 10 years. When the project cycle is reduced from 65 years to 55 years or from 45 years to 35 years, the increase in the probability of project NPV < 0 probability increase is 1.45% and 3.8%. The details are shown as follows (also see Figure 13):
When T = 85 (the operation period lasts for 80 years), P(NPV ≤ 0) = 4.11%;
When T = 75 (the operation period lasts for 70 years), P(NPV ≤ 0) = 4.71%;
When T = 65 (the operation period lasts for 50 years), P(NPV ≤ 0) = 5.84%;
When T = 55 (the operation period lasts for 50 years), P(NPV ≤ 0) = 7.29%;
When T = 45 (the operation period lasts for 40 years), P(NPV ≤ 0) = 9.17%;
When T = 35 (the operation period lasts for 30 years), P(NPV ≤ 0) = 12.97%;
Therefore, a relatively safe operation period for the Hangzhou Bay Bridge is 75 years or longer.

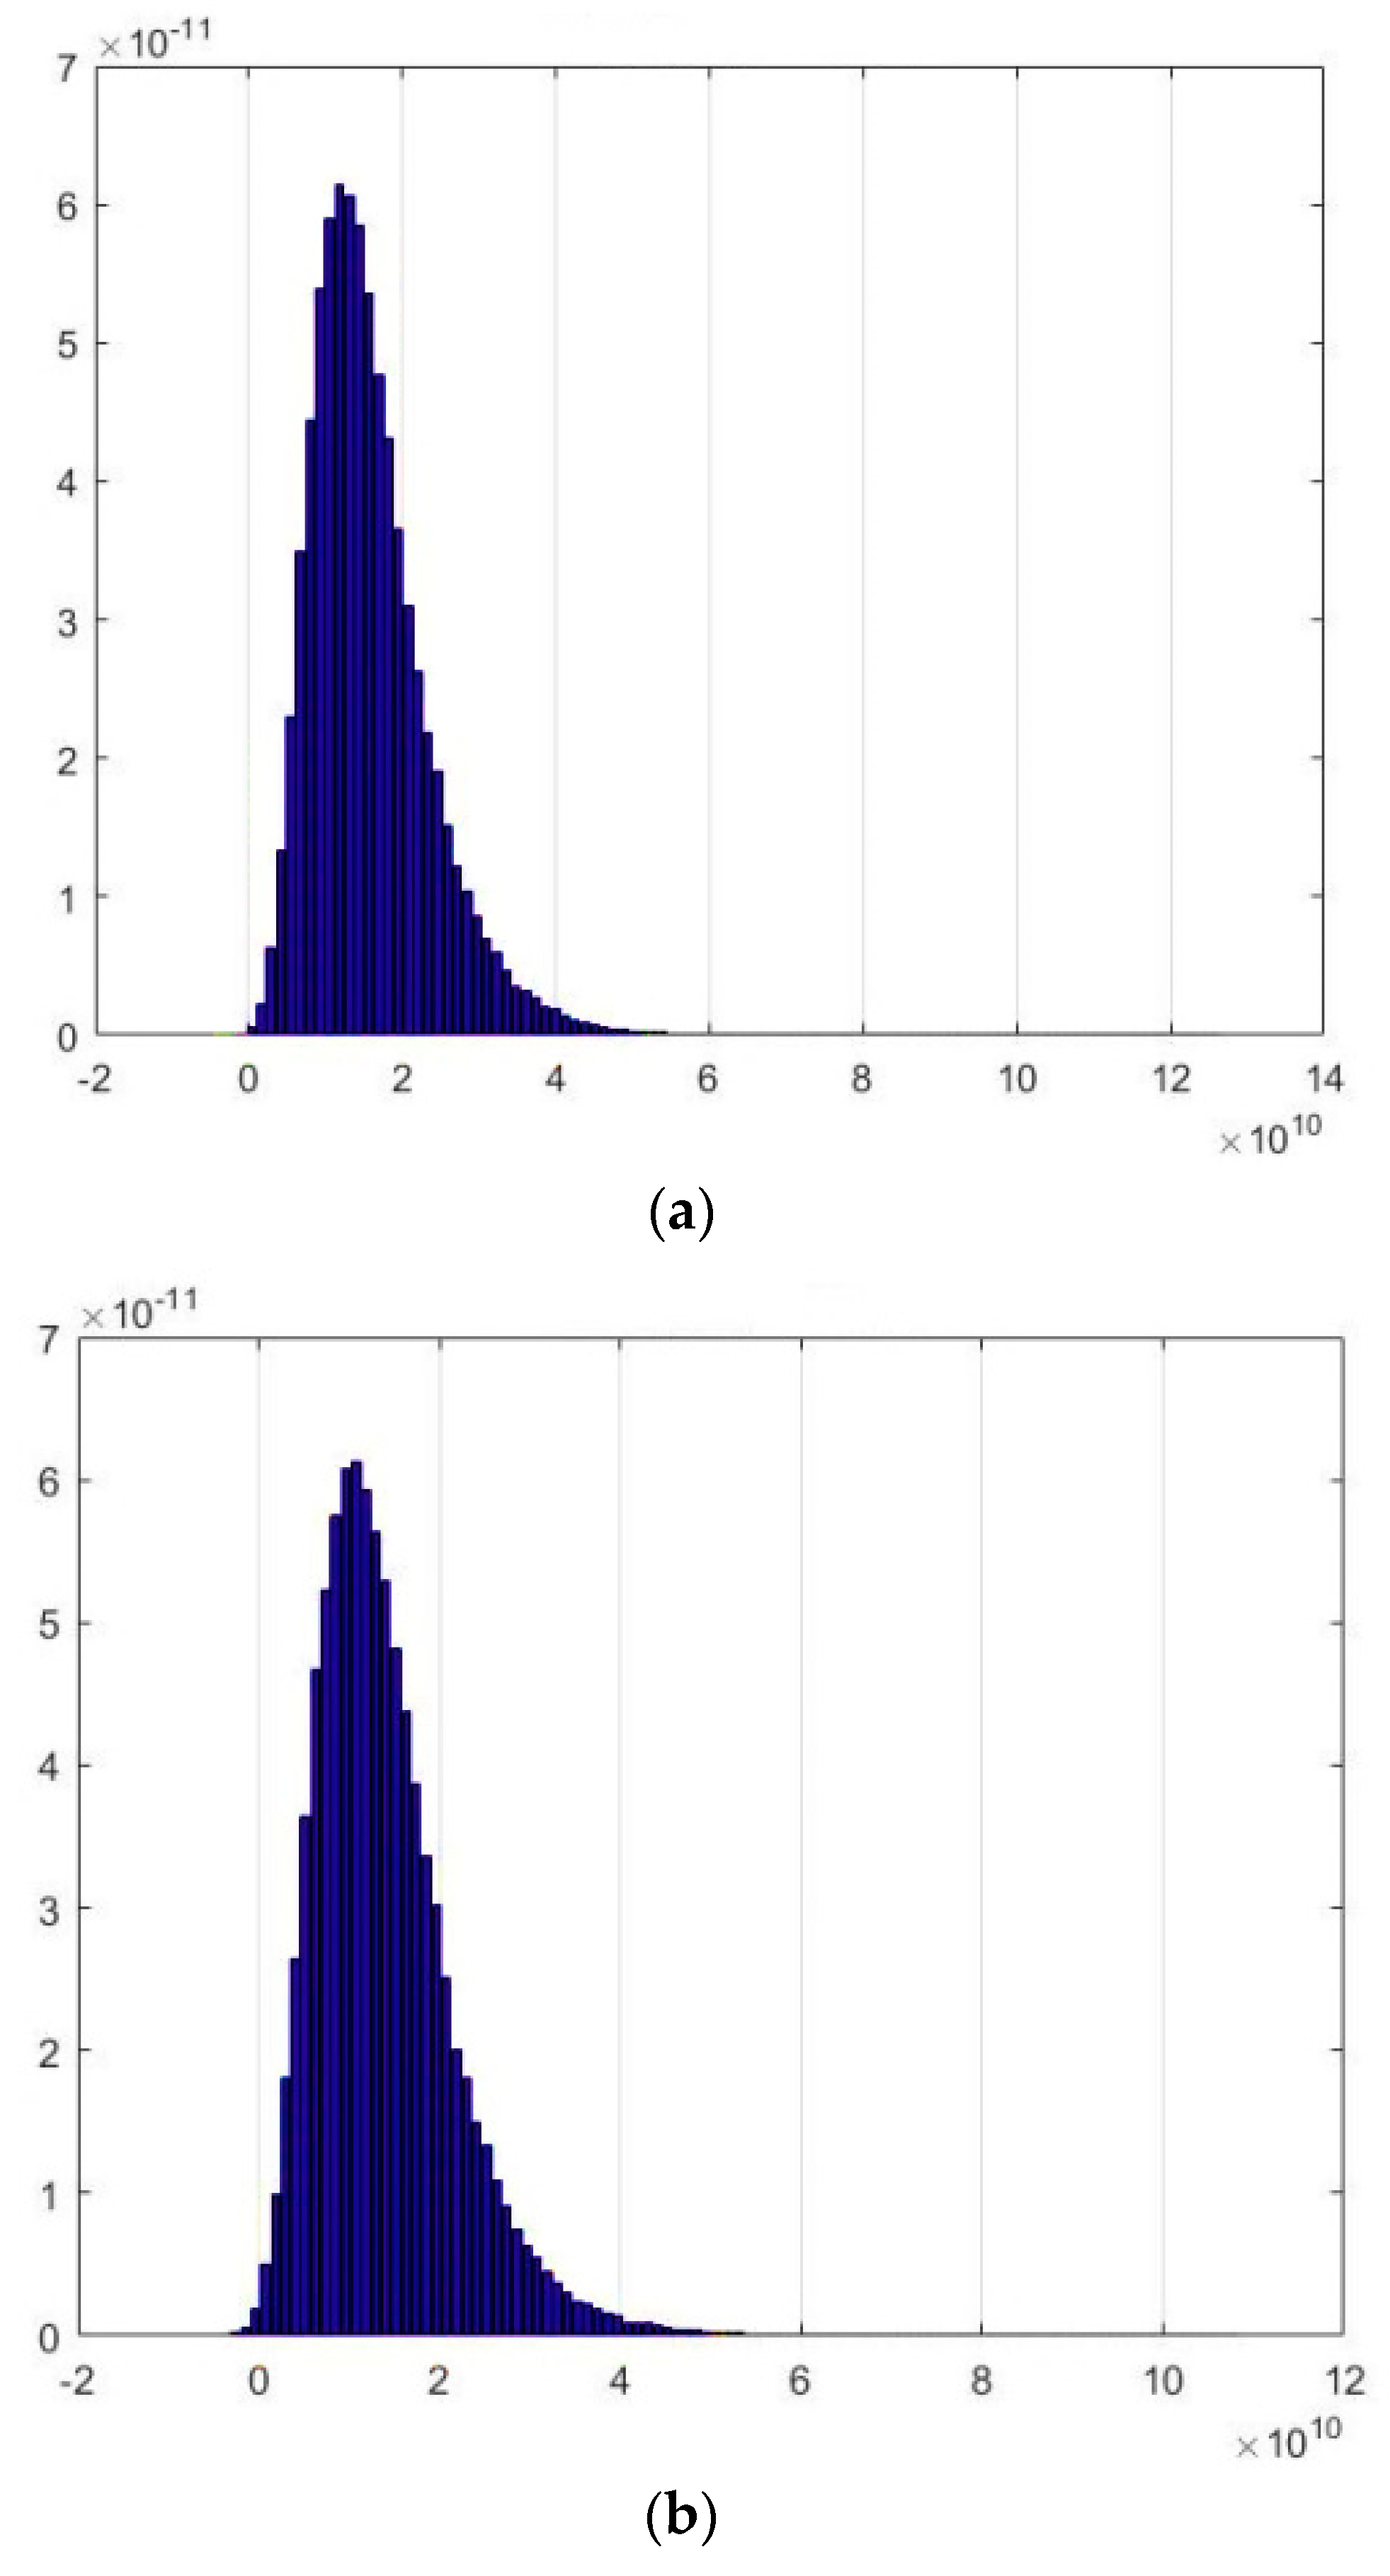
5.3.2. Discussion under Different Degrees of Cost Optimism Bias

The decision-making risk of the whole project is discussed in the above section after referring to the cost overrun of previous bridge projects and considering the cost overrun possibilities. However, the decision-making risks corresponding to the specific cost overrun proportions and the boundaries of the cost overrun proportions have not yet been discussed. Given that the operation period will last 100 years, we change the hypothesis that the cost overrun proportion n is in accordance with logarithmic distribution into a specific value and evaluate the project’s decision-making risks through the value change under different degrees of cost optimism bias.
Considering both the direct and indirect benefits, Hangzhou Bay Bridge is a relatively high-quality project. A conservative decision-maker is not very sensitive to the project cost overrun risks. The details are shown as follows:
When n = 20%, P(NPV ≤ 0) = 0.015%; When n = 40%, P(NPV ≤ 0) = 0.23%;
When n = 60%, P(NPV ≤ 0) = 1.17%; When n = 80%, P(NPV ≤ 0) = 3.85%;
When the project’s cost overrun expectations reach 80% or higher, the probability of the project’s inutility is only 3.85%; when Hangzhou Bay Bridge construction budget of 11.7 billion yuan overruns to the cost of 18.8 billion yuan (cost overrun for 7.1 billion yuan), the bridge construction is still meaningful (see Figure 14).
When the project cost overrun reach 100% or higher, the decision-making risks increase greatly. The details are shown as follows:
When n = 100%, P(NPV ≤ 0) = 9.02%; When n = 130%, P(NPV ≤ 0) = 21.64%;
When n = 160%, P(NPV ≤ 0) = 37.44%; When n = 200%, P(NPV ≤ 0) = 58.05%;
Due to the great difficulty in the project’s construction, if the cost overrun is estimated to reach 130%, the probability of the project’s inductility is 21.64% or higher (see Figure 15). In this situation, a conservative decision-maker will basically reject this project.
From the analyses in this section, it can be seen that Hangzhou Bay Bridge has a high tolerance for cost overrun. Only when the project cost overrun reach 100% or higher will the risk increase. This project has great implicit benefits Thus the cost overrun risks have a relatively minor impact on the significance of the project.
In actual situations, the decision-makers can still refer to the previous cost overrun distributions and extract the possible cost overrun estimate proportions of other new projects into the model calculation to obtain the overall risk. The possible cost overrun proportions can also be estimated for the further judgment of decision-making risk boundaries according to the decision-makers personal risk appetite.
In addition, it is believed in this paper that a cost overrun risk multiplier should also be constructed to compare the effects of different cost overrun and the significance of different projects.
n P = o v e r r u n   p r o p o r t i o n s ( n ) P ( N P V 0 )
The following Table 3 shows that when the cost overrun proportion of Hangzhou Bay Bridge is higher than 100%, its cost overrun risk multiplier will surge. When the NPV of different projects is similar, the cost overrun risk multiplier can be used to compare the sensitivity of projects to make better decisions.

6. Conclusions

This paper is mainly structured in two parts. In the first part, the cost estimation of long bridges in China is discussed from the external perspective. In the early decision-making stage of a new project, the previous cost overrun probability distributions should be referenced. At the same time, the necessary budget increase should be calculated to ease optimism bias and it can be regarded as a criterion for project evaluation under different risk tolerance to relieve the pressure from unexpected cost overrun. In the second part, the decision-making risk in the whole Hangzhou Bay Bridge project is depicted based on the previous studies. Under the framework of cost-benefit theory, the explicit revenues, implicit benefits and cost expectations of the project are considered during the project decision-making process. Therefore, decisions are well thought-out. The cost overrun resulting from cognitive limitations is significantly reduced as are the misjudgment risks of the project that appear due to the neglect of the infrastructure projects’ availability for the case study.
The decision-making risk model proposed in this paper solves two questions. Answers to the first question can help decision-makers roughly assess the overall risk of the unbuilt project in the case of cost overrun. The significance of discussing the second question is to determine the decision-making risks that correspond to specific cost overrun proportions and the boundary of cost overrun proportions under acceptable risk. The second question plays a role in guiding practical decision-making. In particular, it means that after knowing the possible cost overrun of the bridge based on the RCF method, the decision-makers substitute the highest possible cost overrun proportion into the model calculation and they will find the specific cost overrun proportions and the unbuildability risk of the project under construction (that is, the NPV is less than 0). Conversely, it means that when the decision-makers have already predicted the unbuildability risk of the project under construction and accepted it, they can reduce the cost overrun proportions from the model results of the second question to confirm further whether they can accept this cost overrun proportion. Actually, the second question decomposes the first question.

6.1. Theoretical Contributions

From the external perspective, this paper uses the RCF method to measure the optimism bias in long bridge projects in China and calculates the necessary budget value under different acceptable risks of cost overrun. Further, an overall decision-making risk model is put forward in this paper based on the predicted cost overrun according to cost-benefit theory.
There are mainly two theoretical innovations in this decision-making risk model.
(1)
It quantifies the optimism cost overrun and takes them into consideration. In this way, it can eliminate the effects of optimism bias that result from the cognitive limitations of decision-makers. Compared with Flyvbjerg’s study on optimism bias [5], this article provides suggestions about whether the project as a whole is worth construction.
(2)
Based on the cost-benefit theory, the model takes the implicit benefits into account and more rationally depicts the value of a public project.

6.2. Practical Implications

The research results in this paper are also valuable and meaningful in practice in three aspects.
(1)
In the quantification of optimism bias distributions, the measuring results of optimism bias in China and international bridge projects are compared and it is found that there are considerable differences between the cost overrun distributions and the budget enhancement under optimism bias, which can help decision-makers understand the possible cost variance and probabilities in advance and increase the budget to ease the negative effects brought about by cost overrun during the actual operation period.
(2)
Decision-makers can predict the probability of a cost overrun in the project’s decision-making using the model in this study and they can decide whether to build the project according to their risk tolerance. As the model takes the expectation of cost overrun into consideration, it helps decision-makers reduce the risks caused by cognitive bias as much as possible.
(3)
Moreover, the model can help decision-makers identify the direct economic benefits and potential social value to help them obtain a more rational understanding of the project.

6.3. Limitations

The study also has some limitations that must be further improved:
(1)
In this model, only the optimism bias of costs is taken into consideration; however, the optimism bias of the traffic volume estimate is not considered. This can be improved in future research.
(2)
The optimism bias distributions discussed in this paper are collected from the cost data of 30 long bridges in China. Although the 30 bridges are statistically significant, it is still necessary to expand the database of the bridges’ costs to enhance the accuracy of the model.
(3)
The model takes the implicit benefits into account, improving the feasibility of the project’s implementation to some extent. In the future, the financial conditions of the government and the decision-makers can be considered further to narrow the feasible region of the project’s implementation. In the case in which the direct economic revenues of the project fail to cover its cost, the impact of social benefits is implicit and subtle. Additionally, these benefits are counted into different “accounts” of the national economy. This means that project repayment is still stressful for the government. Decision-makers should be considered as a limitation in the future decision-making model. If the repayment cannot be dependent only on the project itself, the decision-makers’ financial capability should be considered. Otherwise, the project’s limitation should be that the economic revenues of the project must cover 80% of the cost.

Author Contributions

H.L. and C.J. designed the study and completed the paper in English together; Y.L. and M.H. provided research advice and revised the manuscript; X.L. collected research data and provided advice.

Funding

This work was part of the research funded by the National Nature Science Fund of China (NSFC), grant number 71671088, 71390521, 71732003, 71471082.

Acknowledgments

The authors are grateful to all study participants from large-scale bridge projects in this study.

Conflicts of Interest

The authors declare no conflict of interest.

Nomenclature

ParameterNotations
Tthe time point at which the whole bridge project finally ends (namely, the lifecycle of the bridge project)
T0the time point for the project completion or regarded as the construction period of the bridge project
TT0the operation period
Ttollthe time point at which tolls end (that means the toll period is Ttoll − T0);
rdiscount rate
Ptolls for one single pass (yuan/vehicle/pass)
P0tolls for one single pass in the first year of the operation period (yuan/vehicle/pass);
Qi, jthe traffic flow from Place i to Place j.
Q(i,j), tthe bridge traffic flow from Place i to Place j in the tth year.
EBtthe direct economic benefits gained in the tth year (yuan);
PBtpassengers’ benefits in the tth year (yuan);
rpthe annual average growth rate of one single pass toll
kthe type of released gases (CO2, CO, etc.).
λkthe emission factor (g/m)
αthe average number of passengers on a car (people/vehicle/pass);
βtthe monetary value of time ($/h)
the cost of the emission of gas k ($/t).
β0the monetary value of unit time for the urban population in the first year of the operation period (yuan/h);
ωthe proportion of time value that is put into production, generally 0.4–0.6
Δmi,jreduction in transit time from Place i to Place j after the bridge completion, in hours (h);
mi,jTransit time between city i and city j after the completion of the bridge.
m0i,jTransit time between city i and city j after the completion without the bridge.
rβthe growth rate of the monetary value of unit time for the urban population;
Vthe average velocity of vehicles (km/h);
Pg0the fuel price in the first year of the operation period, yuan/km;
rpgthe growth rate of the fuel price, generally regarded as the inflation rate
MAh,tthe access capability of the city h at time t.
GDPg,trepresents the size of the city g at time t.
tthg, tthe distance between the city h and g (Both the geographical distance and transit time between the two places can be used to refer to the distance. Transit time is used in this context)
χhthe “market potential” change of the city h, namely, the change of radiation effects on the surrounding cities after the realization of the traffic connection and the shortening of distances.
tthg, t+1the new transit time between the city h and g.
MPj,tthe radiation effects of the surrounding city j on the city i and the market potential which the city i receives in total
MPj,tt0refers to the radiation effects of the surrounding city j assuming the bridge was not constructed during the period t
POPj,tthe non-agricultural population in the city j during the period t;
POPj,T0the non-agricultural population in the city j shortly after the completion of bridge construction.
INCOME–PCj,tper capital income of the non-agricultural population in the city j during the period t;
INCOMEj,tthe total income of the non-agricultural population in the city j during the period t;
Tij,ttransit time from the city j to the city i during the period t;
λthe attenuation coefficient of space. According to the research results from several scholars, the coefficient is 0.02;
rpop,jthe natural growth rate of the non-agricultural population in the city j
rinc,jthe natural growth rate of average income of the non-agricultural population in the city j
RVNumber of road passengers in the radiation region of the bridge
rRVThe growth rate of the number of road passengers in the radiation region of the bridge
Mthe fixed cost
C0initial investment cost, generally regarded as the budget cost estimate
CCtthe construction cost in the tth year;
CC0initial investment cost, generally regarded as the budget cost estimate
T1the modified coefficient of traffic volume
T2the modified coefficient of road service time
CCtthe construction cost in the tth year
OCtthe operation cost in the tth year
k, k2respectively refer to the parameters related to road service time and the modified coefficient of traffic volume
k1, αrespectively refer to the parameters related to the operation cost and the construction cost
nthe proportion of the construction cost that exceeds the initial planning investment amount

References

  1. Sheng, Z. Fundamental Principles Behind the Theory of Mega Infrastructure Construction Management. In Fundamental Theories of Mega Infrastructure Construction Management; Springer: Berlin, Germany, 2018; pp. 135–183. [Google Scholar]
  2. Salem, O.M.; Miller, R.A.; Deshpande, A.S.; Arurkar, T.P. Multi-criteria decision-making system for selecting an effective plan for bridge rehabilitation. Struct. Infrastruct. Eng. 2013, 9, 806–816. [Google Scholar] [CrossRef]
  3. Brauers, W.K.M.; Zavadskas, E.K.; Peldschus, F.; Turskis, Z. Multi-objective decision-making for road design. Transport 2008, 23, 183–193. [Google Scholar] [CrossRef]
  4. Hertogh, M.; Baker, S.; Staal-Ong, P.L.; Westerveld, E. Managing Large Infrastructure Projects Research on Best Practices and Lessons Learnt in Large Infrastructure Projects in Europe. Utr. Netlipse 2008, 13–15. [Google Scholar]
  5. Flyvbjerg, B. Curbing optimism bias and strategic misrepresentation in planning: Reference class forecasting in practice. Eur. Plan. Stud. 2008, 16, 3–21. [Google Scholar] [CrossRef]
  6. Boltz, M.G.; Yum, Y.N. Temporal concepts and predicted duration judgments. J. Exp. Soc. Psychol. 2010. [Google Scholar] [CrossRef]
  7. Sanna, L.J.; Chang, E.C.; Parks, C.D.; Carter, S.E. The hourglass is half full or half empty: Temporal framing and the group planning fallacy. Gr. Dyn. 2005, 9, 173–188. [Google Scholar] [CrossRef]
  8. Kahneman, D.; Lovallo, D. Timid Choices and Bold Forecasts: A Cognitive Perspective on Risk Taking. Manag. Sci. 1993. [Google Scholar] [CrossRef]
  9. Cantarelli, C.C.; van Wee, B.; Molin, E.J.E.; Flyvbjerg, B. Different cost performance: Different determinants?: The case of cost overruns in Dutch transport infrastructure projects. Transp. Policy 2012, 22, 88–95. [Google Scholar] [CrossRef]
  10. Lovallo, D.; Kahneman, D. Delusions of Success: How Optimism Undermines Executives’ Decisions. Harv. Bus. Rev. 2003, 81, 56–63. [Google Scholar] [PubMed]
  11. Flyvbjerg, B.; Holm, M.K.S.; Buhl, S.L. How common and how large are cost overruns in transport infrastructure projects? Transp. Rev. 2003, 23, 71–88. [Google Scholar] [CrossRef] [Green Version]
  12. Snow, A.P.; Keil, M.; Wallace, L. The effects of optimistic and pessimistic biasing on software project status reporting. Inf. Manag. 2007. [Google Scholar] [CrossRef]
  13. Johnston, R.; Shabazian, D.; Gao, S. UPlan: A versatile urban growth model for transportation planning. Transp. Res. Rec. J. Transp. Res. Board 2003, 1831, 202–209. [Google Scholar] [CrossRef]
  14. Jennings, W. Why costs overrun: Risk, optimism and uncertainty in budgeting for the London 2012 Olympic Games. Constr. Manag. Econ. 2012. [Google Scholar] [CrossRef]
  15. Caponecchia, C.; Sheils, I. Perceptions of personal vulnerability to workplace hazards in the Australian construction industry. J. Saf. Res. 2011. [Google Scholar] [CrossRef] [PubMed]
  16. Flyvbjerg, B. Measuring inaccuracy in travel demand forecasting: Methodological considerations regarding ramp up and sampling. Transp. Res. Part A Policy Pract. 2005. [Google Scholar] [CrossRef]
  17. Flyvbjerg, B. From Nobel Prize To Project Management: Getting Risks Right. Proj. Manag. J. 2006. [Google Scholar] [CrossRef]
  18. Salling, K.B.; Leleur, S. Accounting for the inaccuracies in demand forecasts and construction cost estimations in transport project evaluation. Transp. Policy 2015, 38, 8–18. [Google Scholar] [CrossRef]
  19. Kutsch, E.; Maylor, H.; Weyer, B.; Lupson, J. Performers, trackers, lemmings and the lost: Sustained false optimism in forecasting project outcomes—Evidence from a quasi-experiment. Int. J. Proj. Manag. 2011. [Google Scholar] [CrossRef] [Green Version]
  20. Batselier, J.; Vanhoucke, M. Improving project forecast accuracy by integrating earned value management with exponential smoothing and reference class forecasting. Int. J. Proj. Manag. 2017. [Google Scholar] [CrossRef]
  21. Pichayapan, P.; Hino, S.; Kishi, K.; Satoh, K. Real option analysis in evaluation of expressway projects under uncertainties. J. East. Asia Soc. Transp. Stud. 2003, 5, 3015–3030. [Google Scholar]
  22. Verhoef, E.T. Second-best road pricing through highway franchising. J. Urban Econ. 2007. [Google Scholar] [CrossRef]
  23. Rouhani, O.M.; Geddes, R.R.; Gao, H.O.; Bel, G. Social welfare analysis of investment public-private partnership approaches for transportation projects. Transp. Res. Part A Policy Pract. 2016. [Google Scholar] [CrossRef]
  24. Bai, S.; Eisinger, D.; Niemeier, D. MOVES vs. EMFAC: A comparison of greenhouse gas emissions using Los Angeles County. In Proceedings of the Transportation Research Board 88th Annual Meeting, Washington, DC, USA, 11–15 January 2009. [Google Scholar]
  25. Wang, M.Q.; Santini, D.J.; Warinner, S.A. Methods of Valuing Air Pollution and Estimated Monetary Values of Air Pollutants in Various US Regions; Argonne National Lab.: Lemont, IL, USA; Center for Transportation Research: Austin, TX, USA, 1994. [Google Scholar]
  26. McCubbin, D.R.; Delucchi, M.A. The health costs of motor-vehicle-related air pollution. J. Transp. Econ. Policy 1999, 33, 253–286. [Google Scholar] [CrossRef]
  27. Schrank, D.; Eisele, B.; Lomax, T. TTI’s 2012 Urban Mobility Report; Texas A&M Transportation Institute, Texas A&M University: College Station, TX, USA, 2012; Volume 4. [Google Scholar]
  28. Song, Y.; Tan, Y.; Song, Y.; Wu, P.; Cheng, J.C.P.; Kim, M.J.; Wang, X. Spatial and temporal variations of spatial population accessibility to public hospitals: A case study of rural–urban comparison. GISci. Remote Sens. 2018, 55, 718–744. [Google Scholar] [CrossRef]
  29. Sassen, S. The Global City: Strategic Site, New Frontier. In Managing Urban Futures; Routledge: Abingdon, UK, 2016; pp. 89–104. [Google Scholar]
  30. Zheng, S.; Kahn, M.E. China’s bullet trains facilitate market integration and mitigate the cost of megacity growth. Proc. Natl. Acad. Sci. USA 2013, 201209247. [Google Scholar] [CrossRef] [PubMed]
  31. Harris, C.D. The, Market as a Factor in the Localization of Industry in the United States. Ann. Assoc. Am. Geogr. 1954, 44, 315–348. [Google Scholar]
  32. Hanson, G.H. Market potential, increasing returns and geographic concentration. J. Int. Econ. 2005. [Google Scholar] [CrossRef]
  33. Faber, B. Trade integration, market size, and industrialization: Evidence from China’s National Trunk Highway System. Rev. Econ. Stud. 2014, 81, 1046–1070. [Google Scholar] [CrossRef]
  34. Ahlfeldt, G.M.; Feddersen, A. From Periphery to Core: Economic Adjustments to High Speed Rail. IEB Working papers. Available online: http://diposit.ub.edu/dspace/handle/2445/116855 (accessed on 31 October 2018).
Figure 1. Probability Distributions of Cost Overrun in China’s Long Bridge Projects.
Sustainability 10 03981 g001
Figure 2. Increase Rates of Optimism Bias Investment in China’s Long Bridge Projects.
Sustainability 10 03981 g002
Figure 3. Different Types of Distributions of Cost Overrun. (a)The Logarithmic Distributions; (b) The Weibull Distributions; (c) The Gamma Distributions; (d) The Chi-square Distributions; (e) The Skew-T Distributions; (f) The F Distributions.
Sustainability 10 03981 g003aSustainability 10 03981 g003bSustainability 10 03981 g003c
Figure 4. Probability Density of Log-normal Distributions with Different Parameters.
Sustainability 10 03981 g004
Figure 5. Location of Hangzhou Bay Bridge.
Sustainability 10 03981 g005
Figure 6. NPV Results of the Project under Cost Overrun Based on RCF.
Sustainability 10 03981 g006
Figure 7. NPV Distributions without the Consideration of Cost Optimism Bias.
Sustainability 10 03981 g007
Figure 8. Calculation Results of General Cost-benefits with the Consideration of the Expectation of Cost Overrun.
Sustainability 10 03981 g008
Figure 9. NPV Distributions of All Implicit Benefits of the Project.
Sustainability 10 03981 g009
Figure 10. NPV Distributions of the Value Decrease Related to Transit Time.
Sustainability 10 03981 g010
Figure 11. NPV Distributions of the Value Decrease Related to Fuel Cost.
Sustainability 10 03981 g011
Figure 12. NPV Distributions of the Regional Linkage Benefits Brought by the Project Completion.
Sustainability 10 03981 g012
Figure 13. NPV Distributions of the Project under Cost Overrun in Different Project Cycles Based on RCF. (a) T = 35; (b) T = 45; (c) T = 55; (d) T = 65; (e) T = 75; (f) T = 85.
Sustainability 10 03981 g013aSustainability 10 03981 g013b
Figure 14. NPV Distributions of the Project under Different Cost Overrun Proportions (n < 100%). (a) n = 20%; (b) n = 40%; (c) n = 60%; (d) n = 80%.
Sustainability 10 03981 g014aSustainability 10 03981 g014b
Figure 15. NPV Distributions of the Project under Different Cost Overrun Proportions (n > 100%). (a) n = 100%; (b) n = 130%; (c) n = 160%; (d) n = 200%.
Sustainability 10 03981 g015aSustainability 10 03981 g015b
Table 1. Budgets and Costs of Accounts for the Approval of Some Long Bridge Projects in China.
Project No.Budget SourceCost SourceCost OverrunCompletion TimeType of Bridge
1Instruction of project feasibilityInterview with Fujian Department for transportation15%2014.1Cross-river
2Bridge feasibility reportInterview with Hunan Department for transportation108%2012.3Cross-valley
3Interview with companyOfficial website5%2001.3Cross-river
4Interview with companyOfficial website3%2005.10Cross-river
5Interview with companyInterview with Jiangsu Department for transportation4%2012.12Cross-river
6Interview with Jiangsu Department for transportationOfficial website −8%2004.4Cross-river
7Interview with Command Department for BridgeInterview with Command Department for Bridge24%2008.6Cross-river
8Bridge feasibility reportInterview with Jiangsu Department for transportation4%2012.11Cross-river
9Interview with Shandong Department for transportationInterview with Shandong Department for transportation11%2011.6Cross-sea
10Completed acceptance report Completed acceptance report 14%2007.6Cross-sea
11Interview with Command Department for BridgeInterview with Zhejiang Department for transportation2%2013.7Cross-sea
12Bridge feasibility reportInterview with company57%2013.5Cross-sea
13Interview with companyInterview with company−8%2009.10Cross-river
14Interview with Command Department for BridgeInterview with Command Department for Bridge23%2016.12Cross-valley
15Interview with companyInterview with Command Department for Bridge18%2013.12Cross-river
16Interview with Shanghai Department for transportationInterview with Shanghai Department for transportation54%1991.12Cross-river
17Interview with Shanghai Department for transportationInterview with Shanghai Department for transportation10%1993.10Cross-river
18Interview with Jiangsu Department for transportationInterview with Jiangsu Department for transportation−7%2011.12Cross-river
19Interview with Shanghai Department for transportationInterview with Shanghai Department for transportation57%2005.5Cross-sea
Table 2. General Parameters.
ParameterValueParameterValueParameterValue
T105ϒ0.08 r p g 0
T05ΔmA,B1.3POPA,T018,588,300
Ttoll34.5 α 3 r p o p , A 3.86%
r10%β08.9INCOME_PCA,T026675
P093.7 r β 6% r i n c , A 10.8%
r p 2%V100POPB,T02,770,300
θ 4.27%Pg00.8 r p o p , B 9.15%
λ 0.02 m 0 A , B 3.3INCOME_PCB,T025,304
m A , B 2C011,760,000,000 r i n c , B 8.5%
k 0.02k10.6k26
a 0.01Q08,747,590rRV8%
RV520,000,000
Table 3. Cost Overruns Risk Multiplier of Hangzhou Bay Bridge.
n20%40%60%80%
n/p 0.000750.005750.01950.048125
n100%130%160%200%
n/p 0.09020.1664620.2340.2901

