How Green Building Product Decisions from Customers Can Be Transitioned to Manufacturers: An Agent-Based Model


1
School of Management, Jiangsu University, Zhenjiang 212013, China
2
Australasian Joint Research Centre for Building Information Modelling, School of Built Environment, Curtin University, Perth, WA 6845, Australia
3
Department of Housing and Interior Design, Kyung Hee University, Seoul 130-701, Korea
*
Author to whom correspondence should be addressed.
Sustainability 2018, 10(11), 3977; https://doi.org/10.3390/su10113977
Submission received: 2 October 2018
/
Revised: 20 October 2018
/
Accepted: 22 October 2018
/
Published: 31 October 2018
(This article belongs to the Special Issue Sustainable Development and Management of Mega Projects)
Abstract
:The development of green building products is of great significance to the sustainability of construction projects. Both the financial ability and adoption behavior of customers have a great influence on the decisions made by manufacturers regarding the development of green building products. To clarify how customer behavior related to green building products can be transitioned to manufacturers, this paper presents a multiagent model that considers the interactions between customers and manufacturers, describing the decision process of manufacturers through the swarm intelligence algorithm and taking complex characteristics of agents into account. Results show that the customer’s financial ability has a positive impact on the green decisions of manufactures. In addition, the average greenness of products produced by manufacturers is found to be lower than that required by customers. Furthermore, building products within a certain range of greenness has strategic advantages in market competition, leading to higher sales and a monopoly position.
1. Introduction
Developing green buildings is a very important approach for improving the living environment, reducing building energy consumption, and solving the energy crisis. A green building is defined as “a philosophy and associated project and construction management practices that seek to: (1) Minimize or eliminate impacts on the environment, natural resources, and nonrenewable energy sources to promote the sustainability of the built environment; (2) enhance the health, wellbeing and productivity of occupants and whole communities; (3) cultivate economic development and financial returns for developers and whole communities; and (4) apply life cycle approaches to community planning and development” [1]. To fulfill these objectives, the products used in green buildings, which are energy-saving or environmentally friendly, are known as green building products [2]. For example, some furniture manufacturers use environmentally friendly panels as an alternative building material, which is formaldehyde-free and made of biomaterials that do not pollute the environment. Some home builders implement off-site construction and use materials that are more sustainable for family houses, which can achieve a net-zero energy consumption target by using solar panels, environmentally friendly products and wall panel systems with tight seals and improved insulations. Therefore, it can be seen that encouraging manufacturers to develop, produce, and promote green building products is of great significance to the sustainable development of engineering buildings, and this topic is of increasing concern to engineering managers and practitioners [3].
The adoption of green behavior by customers has a great influence on the green decision-making of building product manufacturers. In market competition, manufacturers are trying their best to meet different demands for products, which leads to the existence of products with different levels of greenness in the market at the same time, and greenness is the indicator that reflects the general impact of different green attributes in green building products [4]. Through greenness decision-making, manufacturers can highlight the energy efficiency and environmental friendliness of their products, thus enabling them to obtain competitive advantage and product differentiation.
Customers’ purchase decisions and the production decisions of manufacturers are affected by multiple factors. For example, the financial ability of a customer and the interaction between customers are important factors influencing the purchase decisions of customers [5], while the interaction between manufacturers, such as mutual competition, imitation, and learning, are also significant factors influencing the green product decisions of manufacturers. In reality, the financial ability and environmental awareness of customers is constantly improving, so what is the evolving trend of green product decisions for manufacturer groups under this scenario? What are the emerging characteristics of sales and profit of building products with different degrees of greenness?
The market is composed of agents of manufacturers and customers. The system is a typical complex adaptive system, in which agents are heterogeneous and behaving adaptively and the interactions and transactions among manufacturers and customers are changing dynamically; therefore, the system performance is complex, nonlinear, and so on [6,7]. To give answers to these two problems, this paper considers the interaction between customers and the competition between manufacturers, studies the evolution mechanism of green product decision-making by manufacturers, and analyzes the sales evolution and corresponding market characteristics of building products with different degrees of greenness under different growth rates of customers’ financial ability. It is of great significance for clarifying the macrobehavior mechanism of the green degree decision of manufacturers and the market evolution characteristics of green building products.
The innovations and characteristics of this paper are as follows. First of all, it is different from previous studies because it pays more attention to the optimal decision of individual enterprises [8], focuses more on the evolution of the green product decisions of manufacturers under the influence of customer purchase decisions, and carries out a multidimensional analysis of the process of decision evolution. Secondly, in addition to the influence of multiple attributes (price, quality, etc.) of the product [9], this paper takes more complex characteristics of agents into consideration, such as the influence of customers’ financial ability, heterogeneity of customer preferences, and interactions among customers on the purchase decision of customers, and mutual competition, imitation, and learning among manufacturers, which are described by the swarm intelligence algorithm. Therefore, the model in this paper is more consistent with real practices. In addition, this paper studies the macro emergence mechanism of market supply and demand features based on the interactions among micro agents to clarify the detailed microfoundation, which can then affect the macrobehavior of the system.
2. Literature Review
2.1. Decision on Green Product
Some scholars have carried out research focusing on the related decisions on the green products of enterprises under different market characteristics and supply chain structures. There are many works of research regarding the decisions on green products under different market characteristics. Cao et al. find that the competition among peer manufactures is the important force and effective channel to spread the green products [10]. Thøgersen et al. show that the availability of a “green” alternative could allow consumers to do their shopping as effortlessly and time-efficiently as consumers buying conventional products [11]. Zhou et al. find that the selection and evaluation of green production strategies is a critical but difficult process affected by dynamic and uncertain conditions [12]. Yenipazarli and Vakharia [13] show that in a market where customers have different levels of product evaluation, a single pricing decision of the new kind of green product hinders the enterprise from adapting to the customer demands and avoiding cannibalization. Yu et al. [14] reveal that the increase in environmental consciousness may encourage manufacturers to enlarge the production scale of green products, but it does not necessarily enable manufacturers to gain more profit. Chen and Sheu [15] investigate the impact of market uncertainty and the level of customers’ rationality on the green strategy of the enterprise, finding that it is not necessarily beneficial to adopt the differentiation strategy, while in some cases the enterprise should produce the product with the same green degree as its competitors. Raza et al. [16] develop a comprehensive revenue management framework to study green investment, pricing, and the inventory decision-making of enterprises in a market where customers’ willingness to pay is heterogeneous.
There is also some literature regarding the decisions on green products under different supply chain structures. Tsai et al. present the green product mix decision model for evaluating the benefits of expanding various types of capacity [17]. Tsaur focuses on the pricing of green products (reused personal computers) that are discarded and sold in a secondary market [18]. Chen et al. [19] explore the effect of the market power of green manufacturers on the pricing and green degree decision of supply chain members in a duopoly green supply chain. Basiri and Heydari [20] compare and analyze the green product degree, pricing, and sales effort decision of newly launched green products on the basis of the current traditional nongreen products under different green channel coordination modes. Jamali and Rasti-Barzoki [21] explore the pricing and green degree decision of the green products which compete with nongreen substitute products in a two-level supply chain and show that the green product degree and profit of green supply chain under a centralized scenario are higher than those under a decentralized scenario. Zhang et al. [22] compare scenarios where manufacturers and retailers determine the product’s energy-saving degree, respectively, indicating that a product’s energy-saving degree is usually determined by the manufacturer unless the retail has a strong bargaining power.
2.2. Green Building
Green building have mainly been studied in the context of the influence factors of green building development and the evaluation system. There is some research analyzing the influence factors of green building development. Castro-Lacouture et al. proposed a mixed integer optimization model that incorporates design and budget constraints while maximizing the number of credits reached under the green building rating system [23]. Marker et al. identified some change factors influencing the diffusion and adoption of green buildings [24]. Zuo and Zhao [25] reviewed the current literature regarding green buildings, showing that most related research focuses on the environmental dimensions of sustainability, while few researchers pay attention to the social and economic dimensions of sustainability, which shed light on future works. Wang et al. [26] revealed that although green buildings are able to reduce greenhouse gas (GHG) emissions more than their traditional counterparts, green buildings do not necessarily enable low GHG emissions from a life-cycle perspective. Wimala et al. [27] examined the perspective of building occupants to find out the factors which hinder the development of green buildings in Indonesia, showing that a limited understanding of the conception of building occupants and other stakeholders is the most important barrier. Hwang et al. [28] conducted a survey to find out the key risk factors in green building projects in Singapore and compare these factors with those in conventional counterparts. Teng et al. [29] identified three problems with the current green building development in China using the system dynamic model and put forward relevant measures to deal with these problems.
In addition, many scholars have carried out studies to construct an evaluation system of green building. Ding [30] conducted a system review of current assessment methods used to figure out the sustainability of green building and developed a sustainability framework for green building evaluation. Ali and Nsairat studied international green building assessment tools and defined new assessment items respecting the local conditions of Jordan [31]. Huang and Wang [32] constructed a systematic evaluation model to ascertain the green performance of building products and determined the optimal purchasing scheme on the basis of a gray relational analysis and analytic hierarchy process (AHP). Sinha et al. [33] gave a detailed explanation of the meaning of green building material and suggested that it is beneficial to adopt the Life Cycle Analysis (LCA) method to evaluate green buildings. Luo et al. [34] gave an explanation of the requirements for green buildings and proposed an improved assessment index for choosing green building products in consideration of the Kent index and the catastrophe theory. Zhang et al. introduced the latest evaluation standards for green buildings in China, Great Britain, and the United States, and proposed some suggestions for improving China’s evaluation standard for green buildings [35]. Sackey and Kim [36] developed a comprehensive performance score framework to make a comparative analysis of the environment and economic sustainability of two kinds of classical green building material: Asphalt shingle and clay tile roofing.
Through the analysis of current literature, it is clear that research concerning green buildings mainly focuses on the influence factors of green building development and its assessment system, while research related to decisions on green products pays more attention to the optimal decision of individual enterprises under the influence of different factors, but few of these works involve the evolution of the green product degree decision of building product manufacturers. In fact, in market competition, manufacturers usually tend to imitate and learn from each other, which poses an influence on the green degree decision of manufacturers. In addition, current research tends to portray market demand as a linear function of features, such as price and green degree, but mutual learning, imitation behavior among manufacturers, and the interaction among customers are usually overlooked. In reality, in addition to the influence of the multiattributes of the product (such as price, quality, etc.), the purchase decision of customers is also influenced by other customers in their own interaction network.
3. Agent-Based Modeling
In this paper, the agent-based modeling approach is used to build models. Agent-based modeling (ABM) is defined as a method for the creation of simulation models that are composed of agents that can interact with each other and adapt to the environment [37]. The entities in ABM are modeled to be atomic agents, enabling the model to easily implement population heterogeneity in terms of attributes and decision-making processes [38]. In addition, due to its ability to capture emergent phenomena arising from the microlevel behavior of agents and their interactions, ABM is able to explain the nonlinear behavior of the system observed in the real world [39].
3.1. System Analysis
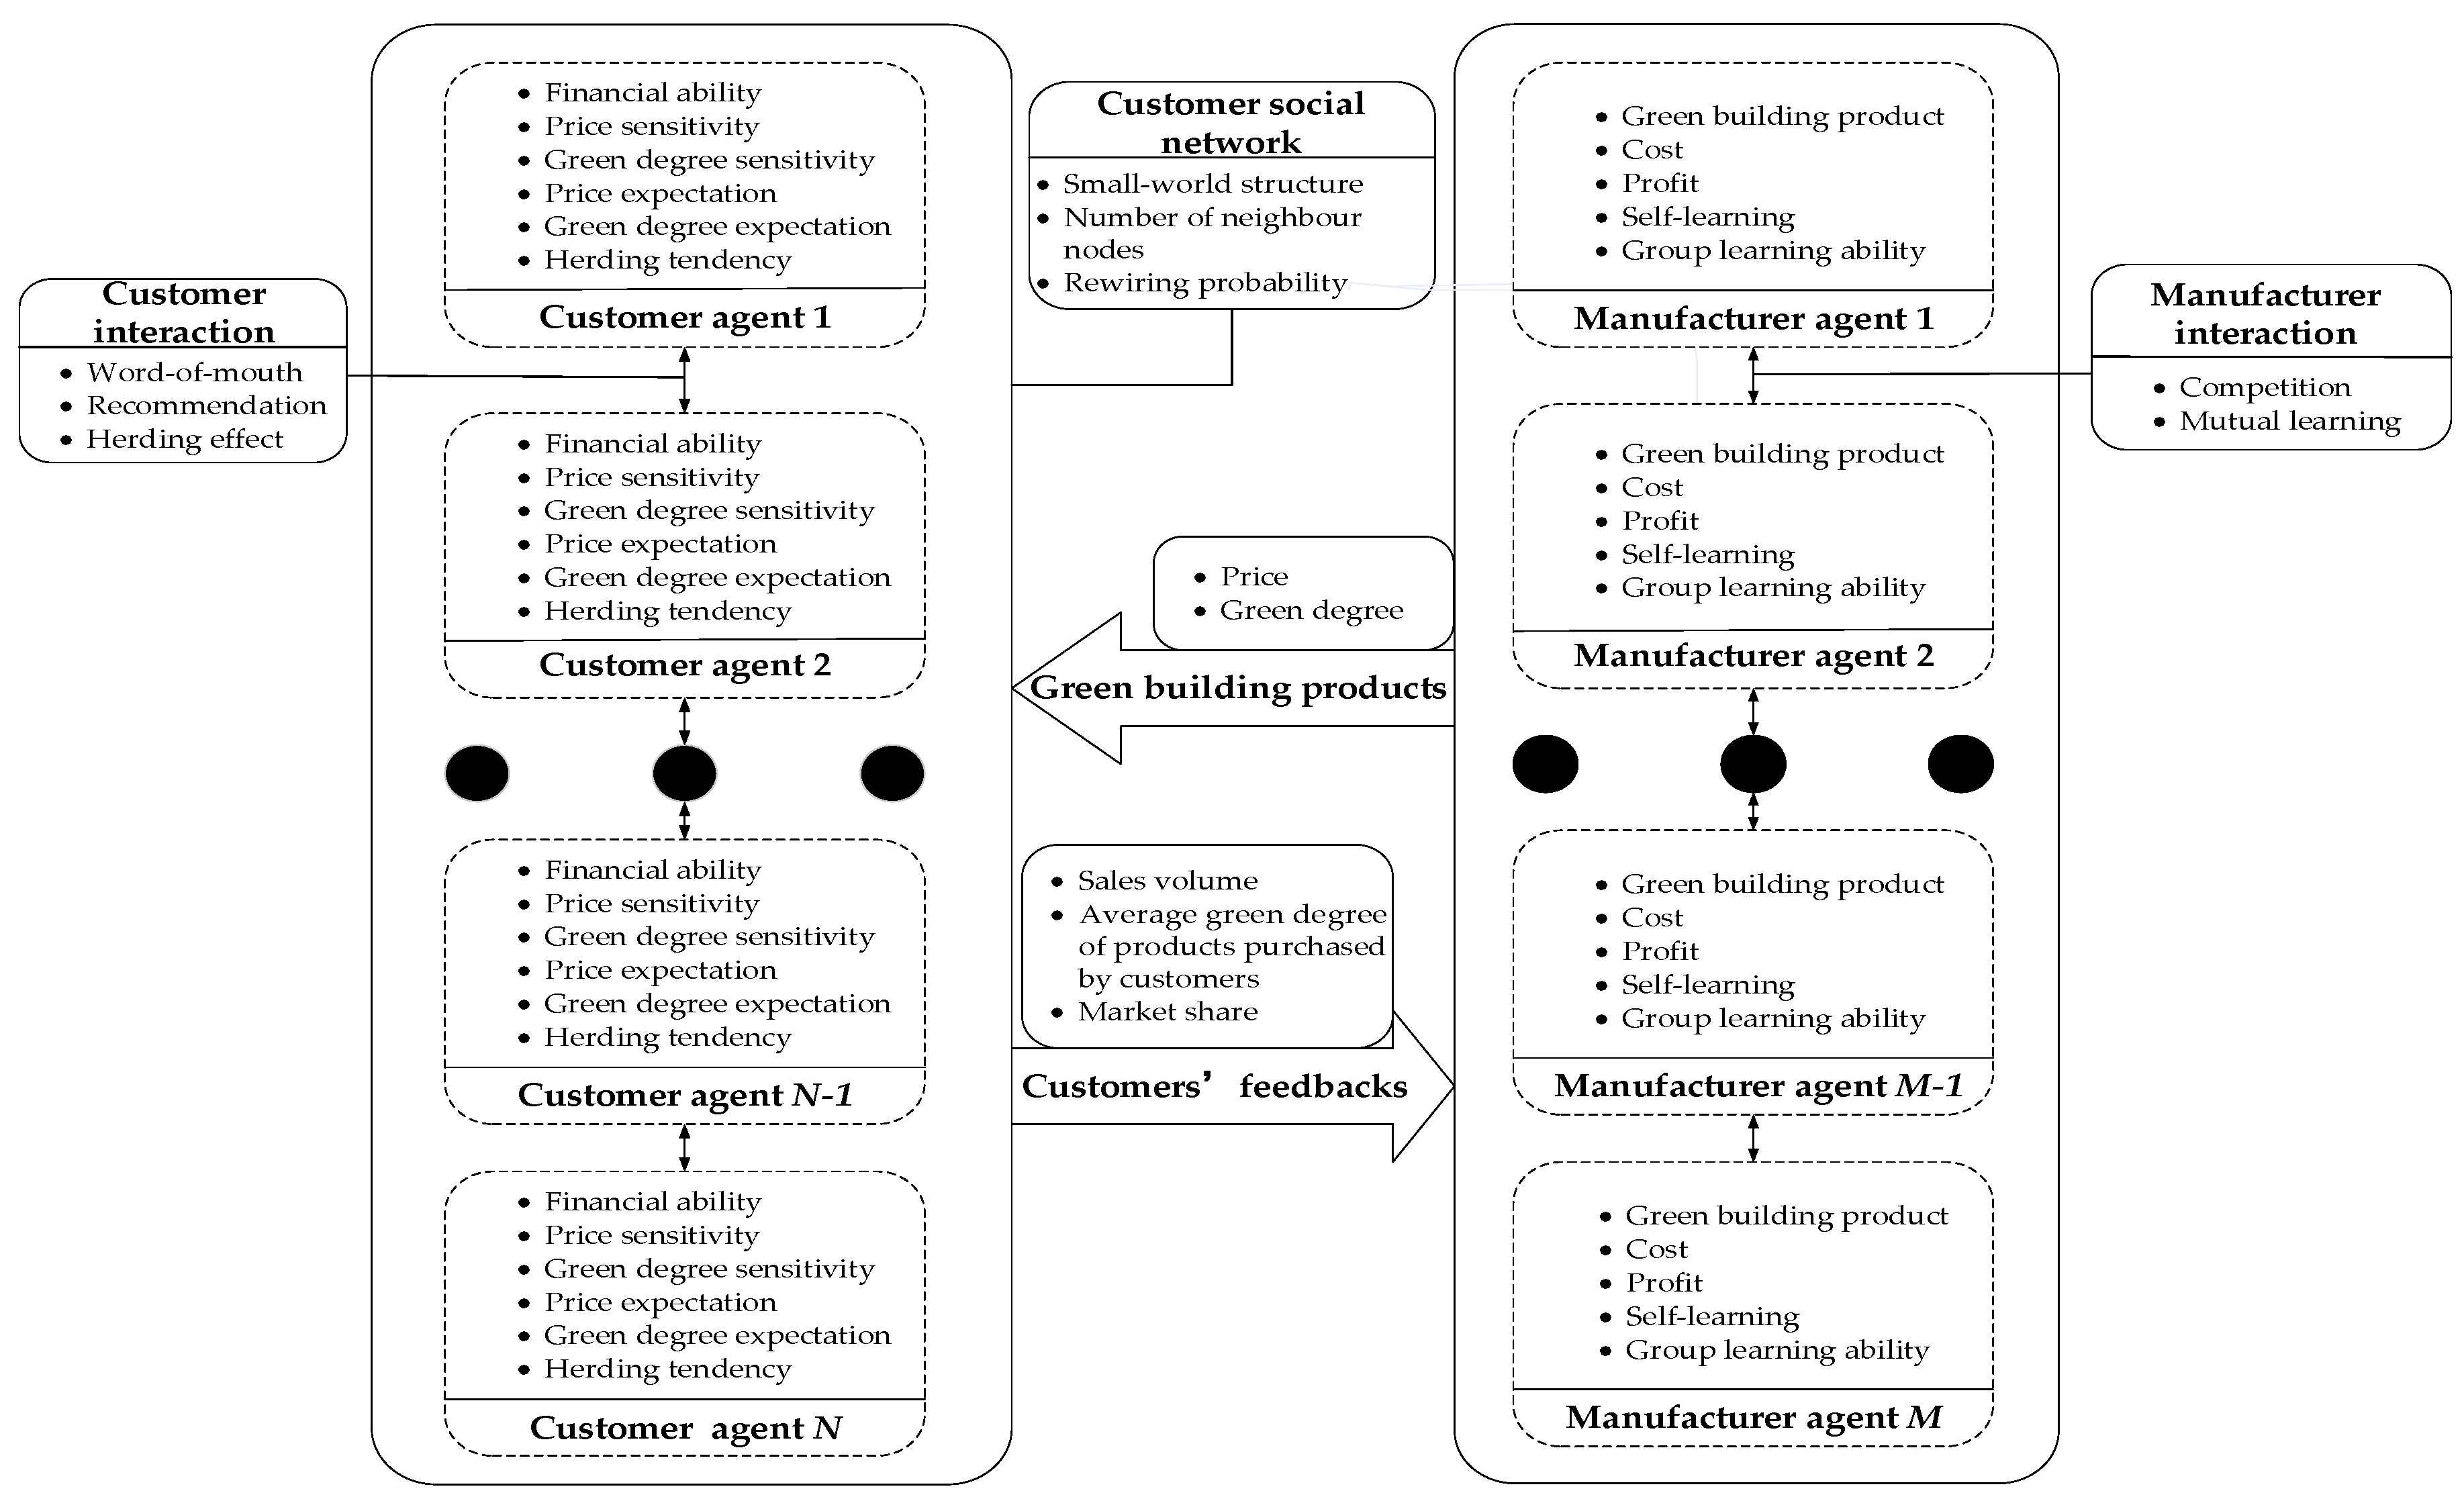
There are two kinds of agents in the model: Green building product manufacturers and customers who can be referred as , and whose number is and , respectively. The influencing factors and action mechanisms of the decision-making of manufacturers and customers and the interaction mechanisms between these two kinds of agents have been built based on reality, as shown in Figure 1.
As can be seen from Figure 1, the market consists of the customers, green building products manufacturers, and green building products. In the process of market transactions, the customer makes a purchasing decision, which is influenced by the financial ability, the expectation, sensitivity of price, green degree, etc. In addition, the interactions among customers based on word of mouth, recommendation, imitation, etc. will also have an impact on a customer’s purchase decisions. Meanwhile, there is a competition and mutual imitation and learning relationship between the green building product manufacturers: The manufacturer will adjust their green product degree according to its cost, profit, historical experience, and imitation of other benchmark manufacturers’ decisions based on self-learning and group-learning. Green building products are the link between green building product manufacturers and customers, which in turn form the interaction between the supply and demand of product, resulting in the mutual interaction between a manufacturer’s green product degree decision and a customer’s purchase decision. Through the interactions of these agents in the market, the system macro performance indices, such as green product degree, the sales, profit of manufacturers, and the product concentration degree, are constantly emerging.
3.2. Customer Agents
3.2.1. Customer Interaction Network
The small-world network is used to characterize the structure of the customer interaction network. As is revealed by the authors of [40], the customer interaction network has the characteristics of a small-world network, which refers to a network with a small feature path length and a large clustering coefficient, which can be constructed as follows. Starting from a ring lattice with vertices and edges per vertex, each edge is rewired at random with probability . Specifically, it is required that , where guarantees that a random graph will be connected. This construction produces graphs between regularity and disorder , such that a in the intermediate region 0 < < 1 produces some degree of both.
3.2.2. Customer Purchase Decision-Making
is the utility of the green building product for the customer , which can imply customers’ motivation and willingness to purchase products, and the customer will make their purchase decision according to the utility of the product. The utility function proposed by the authors of [41] is used as the basis for customers making purchase decisions. The utility is shown in Equation (1):
As can be seen from Equation (1), there are two factors exerting an influence on the utility ; one is the price of the product and the other is the green degree of the product. In Equation (1), denotes the price sensitivity coefficient of customer to the product , which is an exponential function of the difference between the real price and the expected price of the product according to the authors of [42], as shown in Equation (2), where and is the customer ’s expected price for product .
In addition, the in Equation (1) denotes the green product degree sensitivity coefficient of customer to the product . Based on the outlier avoidance customer psychological theory [43], the customer will be more sensitive to the green degree if the green product degree is closer to their expectation, as shown in Equation (3), where the value of is in the range of and is the customer ’s expected green degree for product .
In reality, customers are embedded in the corresponding social networks; therefore, when making purchase decisions, they will not only consider the price and green degree of the product, but also refer to other customers’ comments, which may lead the customer to show a certain degree of herd mentality [44]. Due to the influence of herd mentality, the utility of product will change correspondingly when customer interacts with other customers. Under the influence of herd mentality, the changing rules of product utility for customer are shown in Equation (4).
In Equation (4), refers to the influence of herd mentality on customer and the parameter represents the herd strength of customer and is subject to uniform distribution. The closer the value of is to 0, the less likely customers are to be influenced by the surrounding people and the weaker the herd effect is; while the larger the value of , the more susceptible the customer is to the influence exerted by the surrounding people and the more obvious the herd effect is. The parameter represents the influence of other customers in the social network perceived by the customer , which is obtained by the mean value of product utility for other customers [37], as shown in Equation (5).
As can be seen, the number of neighbors of customer in their social network is and the utility of product for neighbor can be shown as . Hence, combining Equations (1) to (5), the utility can be updated, as shown in Equation (6).
According to the authors of [45], the expected green degree of customer for product is positively correlated with the level of financial ability of customer , as the customer whose financial ability is higher will pay more attention to the environmental performance of the product and their expected green degree of the product will be much more higher. Therefore, the customer’s expected green degree of the product can be obtained through Equation (7), where represents the financial ability of the customer and is the regression coefficient between the customer’s expected green degree and customer’s financial ability, whose value is larger than 0. is a constant indicating the fixed expected green degree of the product when the financial ability of customer is 0 and is the stochastic disturbance drawn from a uniform distribution, indicating the deviation of the customer’s expected green degree of the product.
In addition, it is assumed that the customer can make an estimation of the expected price based on their expected green degree of the product and the value of expected price will increase with the expected green degree . In addition, the authors [46] assume that when the price of the product is more than 1 times the expected price, the customer will think the product is too expensive and refuse to purchase it. Hence, the utility of product for customer can be further updated, as shown in Equation (8).
The customer will make purchase decisions based on the utility of product . The customer will compare the utilities of different products supplied by all green building product manufacturers in the market to obtain the maximum utility and make purchase decisions correspondingly, according to the following rules: Product 1 will be chosen when ; product 2 will be purchased when ; product will be chosen when ; and the product is chosen with the same probability when .
3.3. Green Building Product Manufacturer Agents
3.3.1. Manufacturer Profit
In this paper, it is assumed that the green building products produced by all manufacturers in the market are similar in function and have certain substitutability, and all of them can meet the function requirements of customers, but there are great differences in product price and green degree; therefore, manufacturers will compete with each other based on the price and green degree of their own products.
In reality, a building product with a higher green degree requires a more complex production process and higher technical level; therefore, its unit production cost is much higher. In this paper, it is assumed that is the fixed regular unit production cost and is the additional margin cost, which can be set as the a quadratic function with the green product degree according to the Reference [47]; therefore, the function of can be shown as: , where denotes the cost parameter related to green production efforts and . Therefore, the unit production cost of product can be shown in Equation (9).
In addition, it is assumed that the green building product manufacturer makes product price decisions via the cost-plus pricing method, that is, the product price can be set as:, where is the profit margin of green building product and the value of of each manufacturer is assumed to be the same. Thus, the price of product can be obtained, as shown in Equation (10).
Additionally, the parameter is set to indicate whether or not the customer purchases the product and if the customer purchases the product , , otherwise , and then the sales volume of product can be calculated as in Equation (11).
The profit of manufacturer is the difference between the manufacturer’s sales revenue and production costs; thus, the profit of manufacturer is shown in Equation (12).
We have provided a table to demonstrate the validity of the equations. Please refer to Table 1.
3.3.2. Manufacturer Decision-Making
To deeply analyze the evolution of manufacturer green degree decisions, it is assumed that there are no technical barriers, extra cost caused by production conversion, and production performance constraints for manufacturers, enabling manufacturers to adjust the green degree of their products according to their own profits. Due to its advantage, the particle swarm optimization (PSO) algorithm is applied to simulate the manufacturer’s green degree adjustment behavior, so as to better describe the mutual imitation and learning among manufacturers. The manufacturer considers the manufacturer with the best profit level in the market as the “benchmark manufacturer” and learns from them. To reach the profit maximization target, the manufacturer will determine the green degree of their products at next time according to their current green product degree , the historical green product degree corresponding to their own historical optimal profit , and the current green product degree of the manufacturer with the best profit in current market . The rules for manufacturers’ green degree decision-making are as follow.
Step 1: Initializing the manufacturer parameters, setting the number of green building product manufacturers to , and randomly generating the initial green product degree and velocity ;
Step 2: Calculating the current profit of each manufacturer under their own current product degree ;
Step 3: If current profit of manufacturer is larger than their historical best profit , then is updated as follows: and the green product degree corresponding to their historical best profit is replaced with its current green degree , as shown in the equation: ;
Step 4: It is assumed that the manufacturer can understand other manufacturers’ current profit and green product degree in the current market. The best profit of manufacturers in the current market is recorded as , which can be obtained as: and the green product degree of the manufacturer with the best profit is updated to ;
Step 5: Updating the velocity and green product degree of manufacturer according to Equations (13) and (14):
Step 6: Turn to Step 2 until all manufacturers have been looped through.
In Equation (13), is the weight coefficient and when , it can make the PSO algorithm have good convergence, according to the the authors of [48]; therefore, it sets . is the manufacturer’s learning coefficient, which reflects the self-learning ability for their own history, is the manufacturer’s group cognition factor, which represents the degree of collaboration between manufacturers and the degree of manufacturer’s acceptance of the group’s common information [49], and and are random numbers drawn from a uniform distribution in the range (0,1).
4. Experiment Scenarios Design
It is assumed that there are 10 manufacturers and 10,000 customers in the green building product market. In the initial stage of the experiment, the manufacturer sells their green building products with their own green degree so that products differ in the green degree and price; while the customer looks for products that match their purchase power and then calculates the utility of products separately to make purchase decisions based on the principle of utility maximization. When customers finish purchasing products, manufacturers can get their own competitive performance indicators, such as sales and profit, and identify the “benchmark manufacturer” through the comparison of the other manufacturers’ profit, then making adjustment in green product degree and price at the next time stage based on the PSO algorithm.
The purpose of this paper is to investigate the green degree decision evolution of green building product manufacturers, and the corresponding market macro characteristics under different customer financial ability scenarios. Therefore, the model keeps the basic parameters of the experiment unchanged and sets , , and , in turn. The initial value setting of the basic model parameters is shown in Table 2.
In Table 2, the value of price sensitivity , green degree sensitivity and herd strength is taken from Reference [41], the value of and in Equation (7) is based on References [45,46], the number of neighbor nodes and node rewiring probability are taken from Reference [50], the value of weight factor in PSO algorithm is taken from Reference [48], and the value of , is taken from Reference [49].
To get a deeper analysis of the green degree decision of manufacturer, this paper divides manufacturers into three categories based on their own initial green product degree. The manufacturer whose initial green product degree exceeds 50 is called a Manufacturer with High Initial Green Degree (HIGD) and their symbol and number are marked as and , respectively; the manufacturer whose initial green product degree in the range of [30, 50) is called a Manufacturer with Medium Initial Green Degree (MIGD) and their symbol and number are marked as and , respectively; the manufacturer whose initial green degree in the range of [15, 30) is called a Manufacturer with Low Initial Green Degree (LIGD) and their symbol and number are marked as and , and represents the total number of manufacturers in the market. It will be beneficial to the macro evolution of the competition decisions of manufacturers and demands of customers in the market to divide manufacturers into three categories.
5. Results and Analysis
The average green product degree of HIGD in the experiment is represented as , the average product sales of HIGD are represented as , and the average profit of HIGD is represented as , while the corresponding indicators of LIGD and MIGD are similar. The average green degree of products provided by all green building product manufacturers in the market is represented as , which reflects the overall evolutionary trend of green degree decision-making of manufacturers; the average green degree of products actually purchased by customers is represented as , which reflects the overall evolutionary trend of green degree demands of customers and the highest market share of manufacturer is represented as , while the lowest market share of manufacturer is represented as .
5.1. Manufacturer Green Degree Decisions
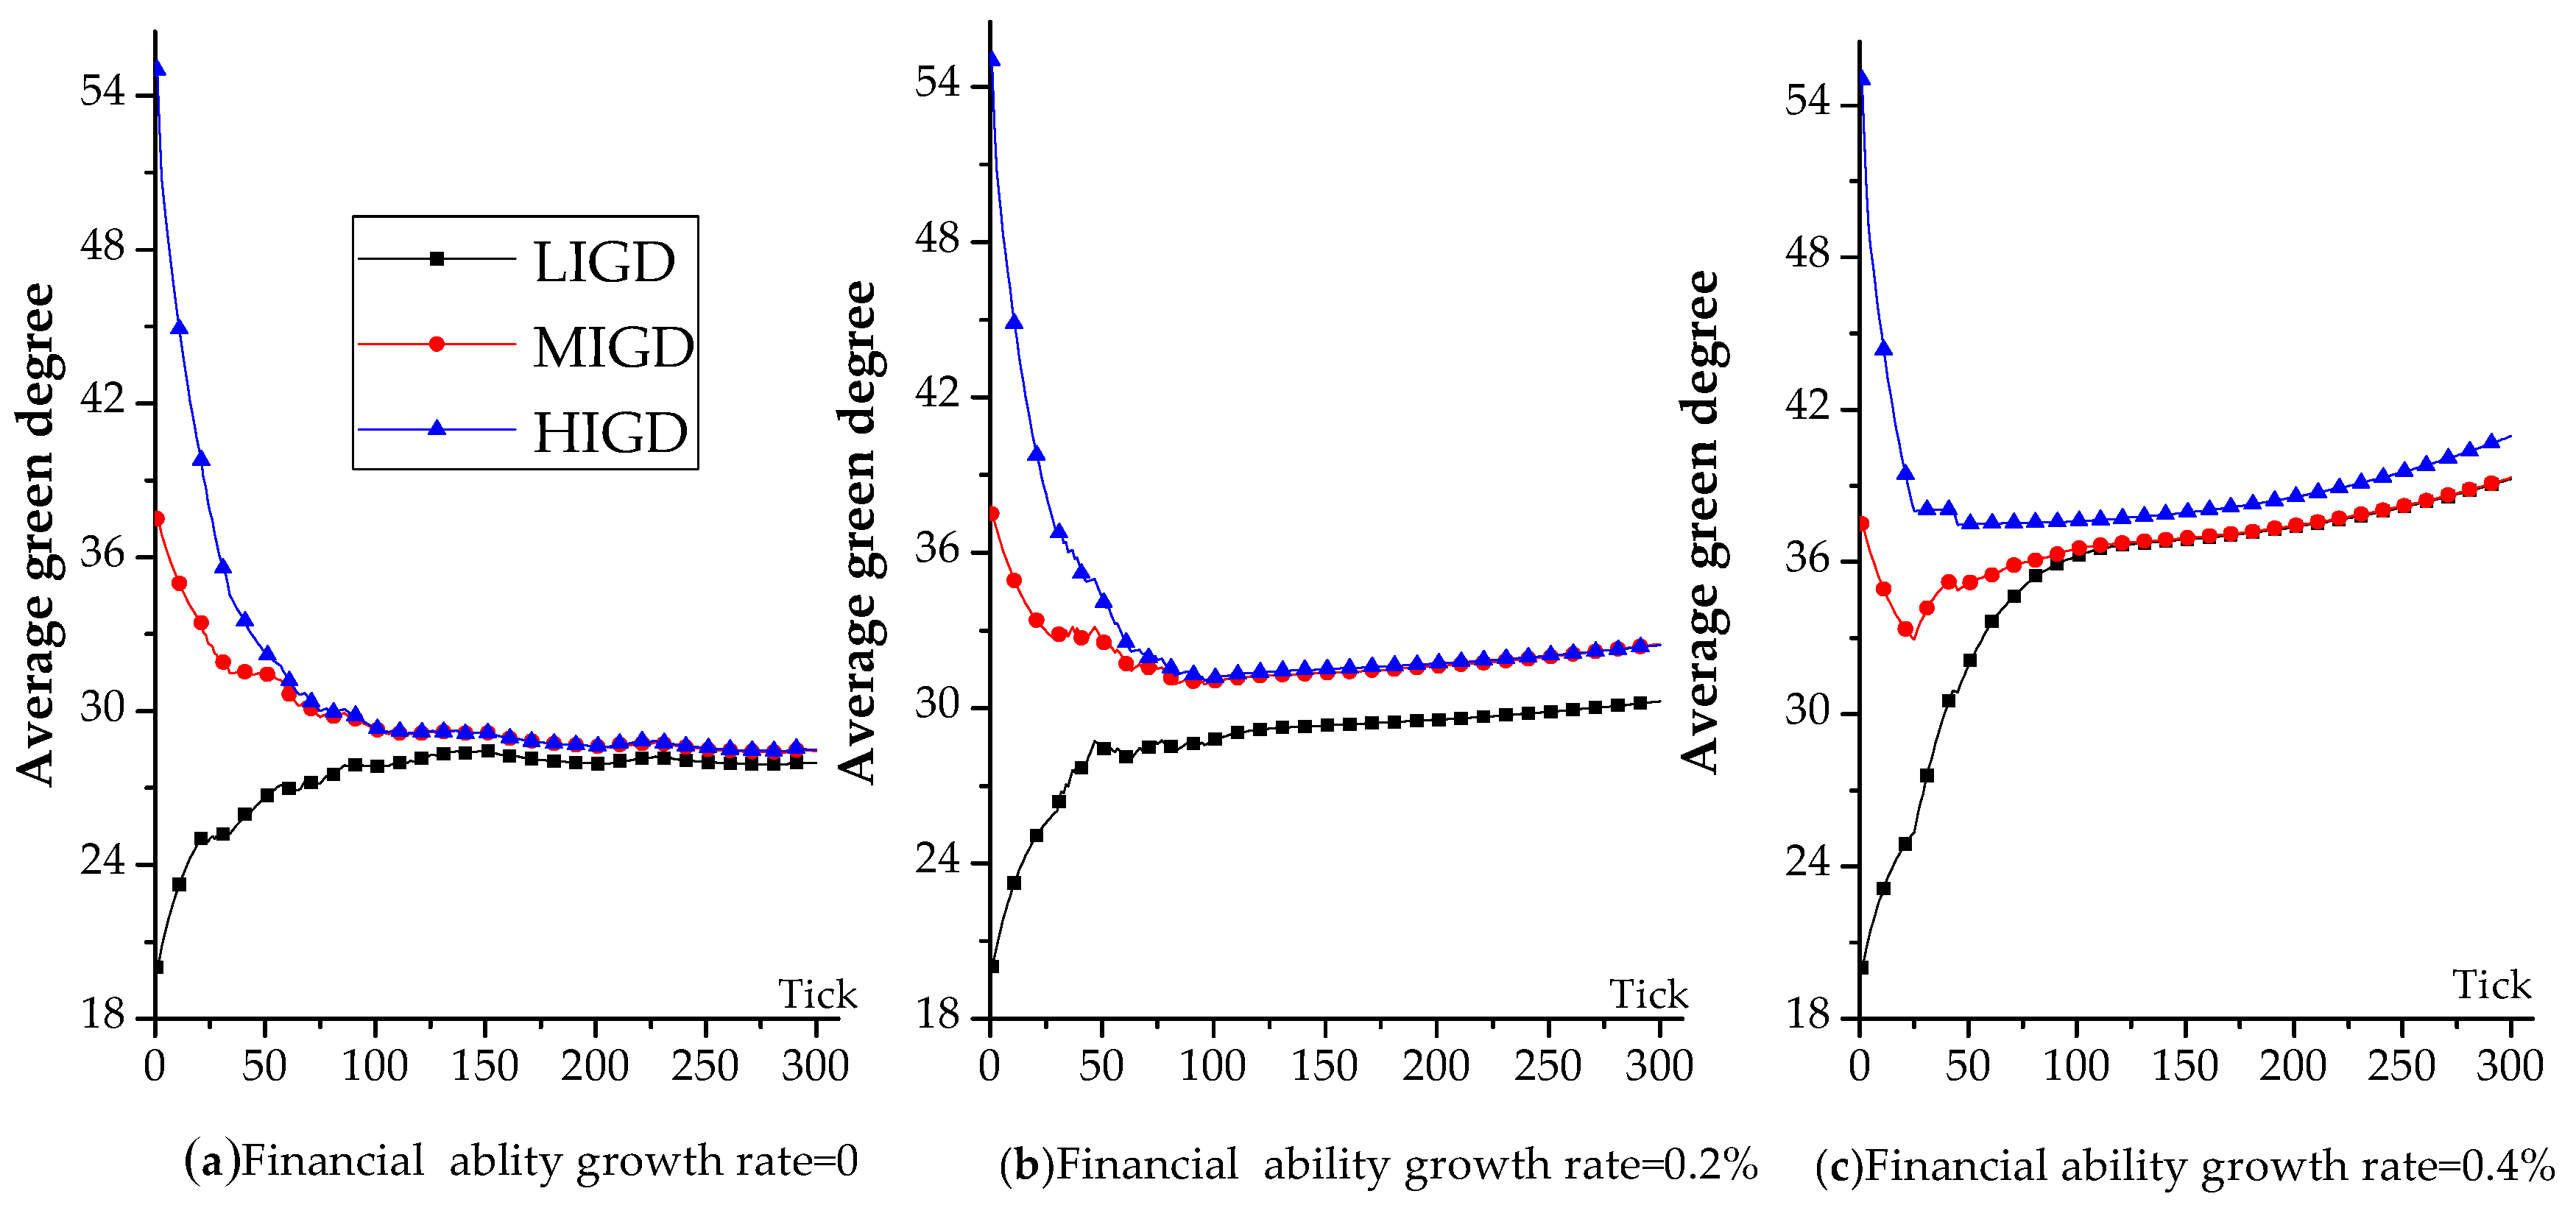
The evolutions of green product degree decisions of different manufacturer categories are shown in Figure 2. The growth rate of the financial ability of customers is 0, 0.2%, and 0.4% and shown in Figure 2a–c, respectively. As can be seen from the figure, when the growth rate of customers’ financial ability is 0, the green product degree of MIGD and HIGD gradually decreases to a certain stable level, while the green product degree of LIGD gradually rises to a certain stable level. However, when the growth rate of the financial ability of a customer is 0.2% and 0.4%, the green degree of MIGD and HIGD gradually decreases and then increases slightly, while the green degree of LIGD shows a trend of increasing rapidly and then rising slowly.
Therefore, it can be seen that the growth rate of customer financial ability is one of the key factors affecting the green degree decision of manufacturers. Customers whose financial ability grows faster will have higher requirements for green product degree; thus, the green degree decisions of three categories of manufacturers all show an upward trend. When the growth rate of customer’s financial ability is 0.4%, the rising speed of the green product degree is higher than that when the growth rate of customer’s financial ability is 0.2% and 0, so the growth rate of a customer’s financial ability has a positive effect on improving the green degree of the product.
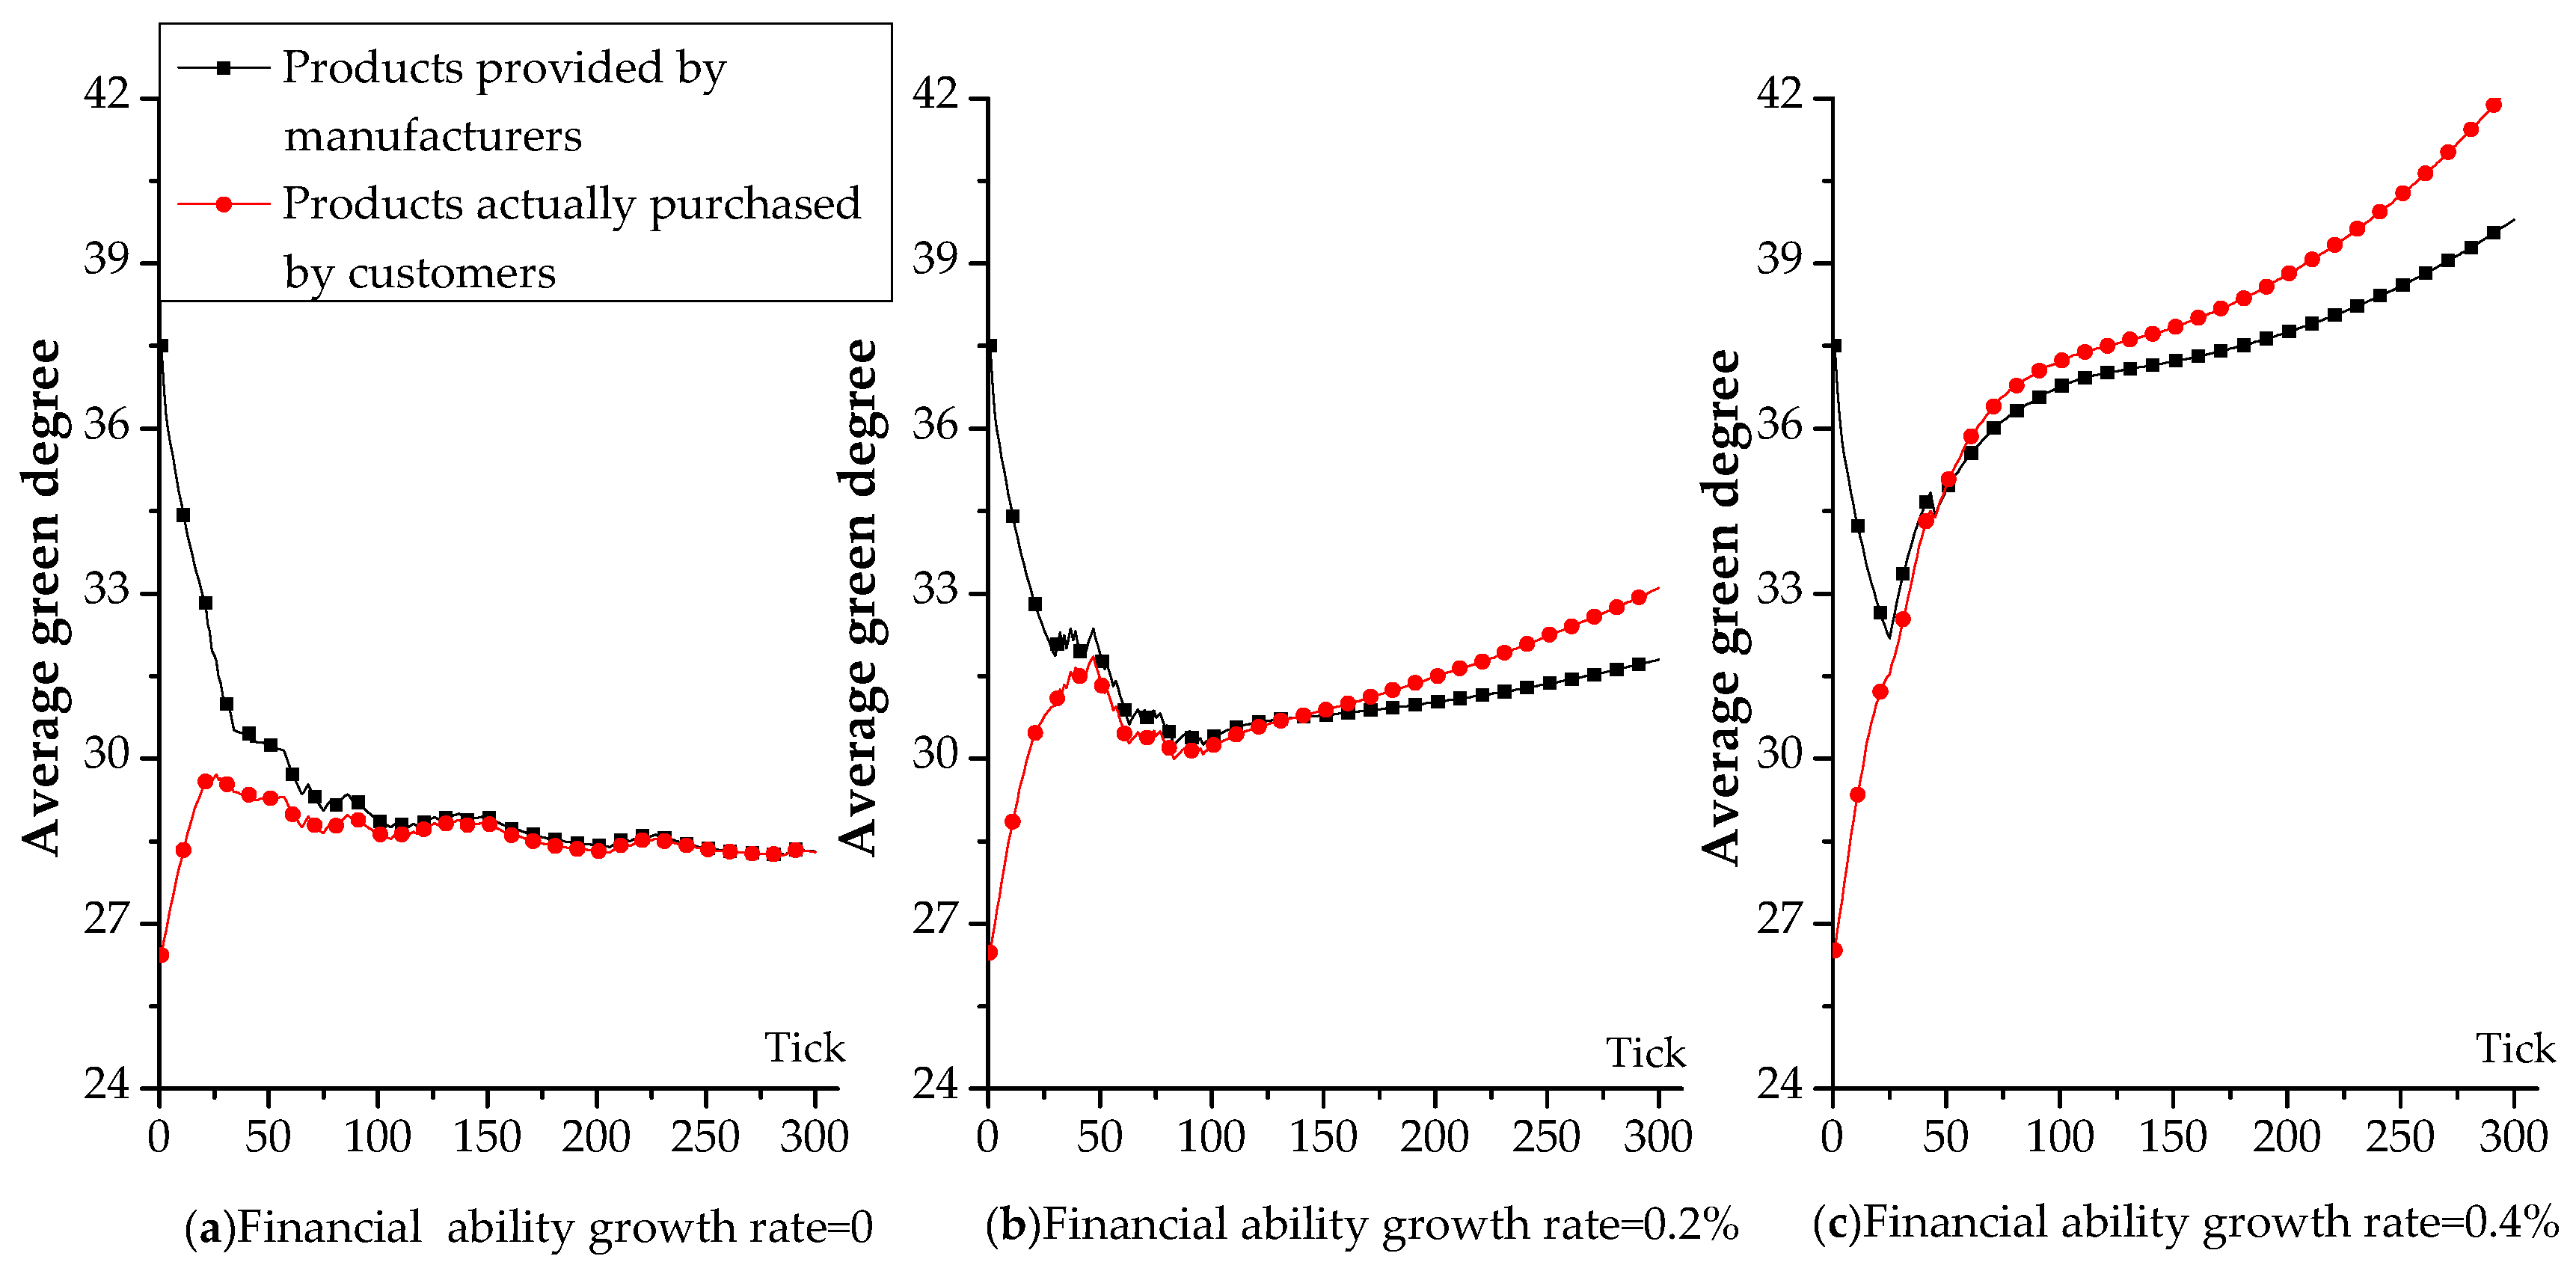
Figure 3 depicts the evolution of the average green degree of products which manufacturers supply and customers purchase. As shown in Figure 3, at the initial stage of system operation (t = 0), the green degree of products provided by manufacturers is higher than that of products actually purchased by customers. When the growth rate of financial ability of customers is 0, the average green degree of products provided by manufacturers and that of products purchased by customers show a certain downward trend, and their trend is relatively consistent. When the growth rate of financial ability of customers is 0.2% or 0.4%, the average green degree of products provided by manufacturers still shows a downward trend in the initial stage, while the average green degree of products actually purchased by customers shows an upward trend at the same time. However, as the financial ability of customers rises continuously, the average green degree of products provided by manufacturers and that of products actually purchased by customers both show an increasing trend, and the average green degree of products actually purchased is higher than that of products provided.
Thus, it can be concluded that when the financial ability of customers is relatively stable (the growth rate is 0), through referring to their historical experience, continuous mutual learning, imitation, and trial, the manufacturer is able to accurately “capture” the real demand for the green product degree of customers. However, in a dynamic market environment where the financial ability of customers is constantly improving, the actual demand for the green product degree of customers is also dynamically changing, leading manufacturers to continuously produce products with a higher green degree. However, manufacturers may “underestimate” the customers’ actual demand for green product degree, resulting in a situation where the average green degree of products provided by manufacturers is lower than that of products actually purchased by customers.
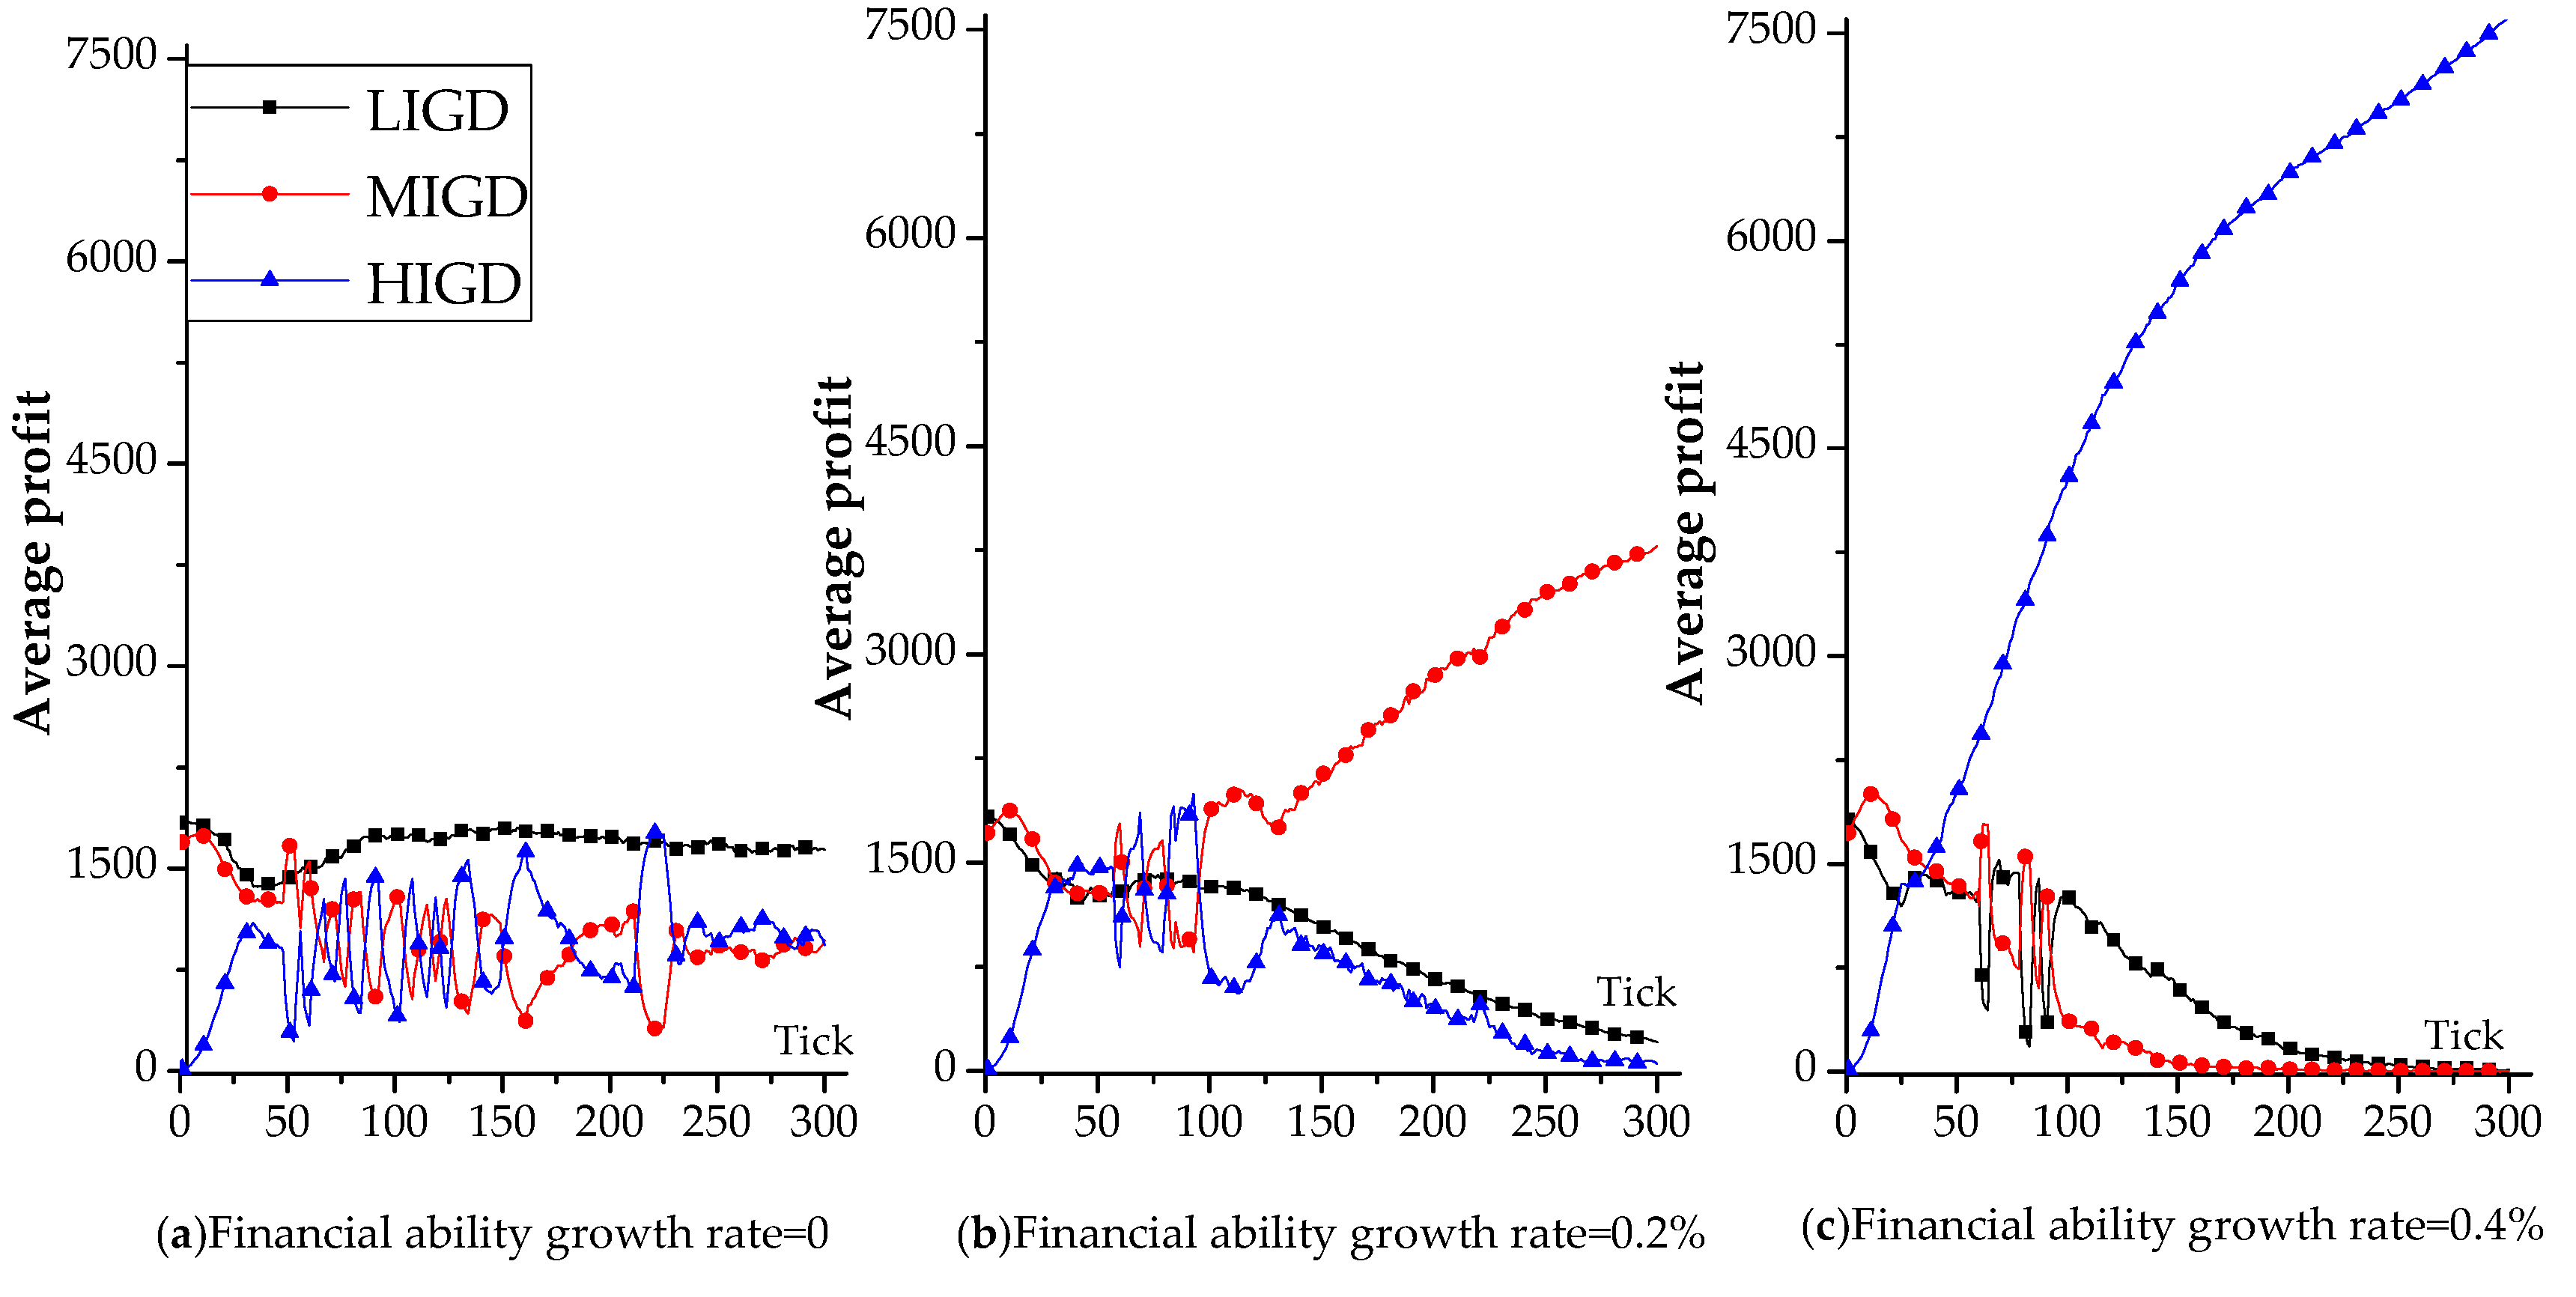
5.2. Manufacturer Product Sales and Profits
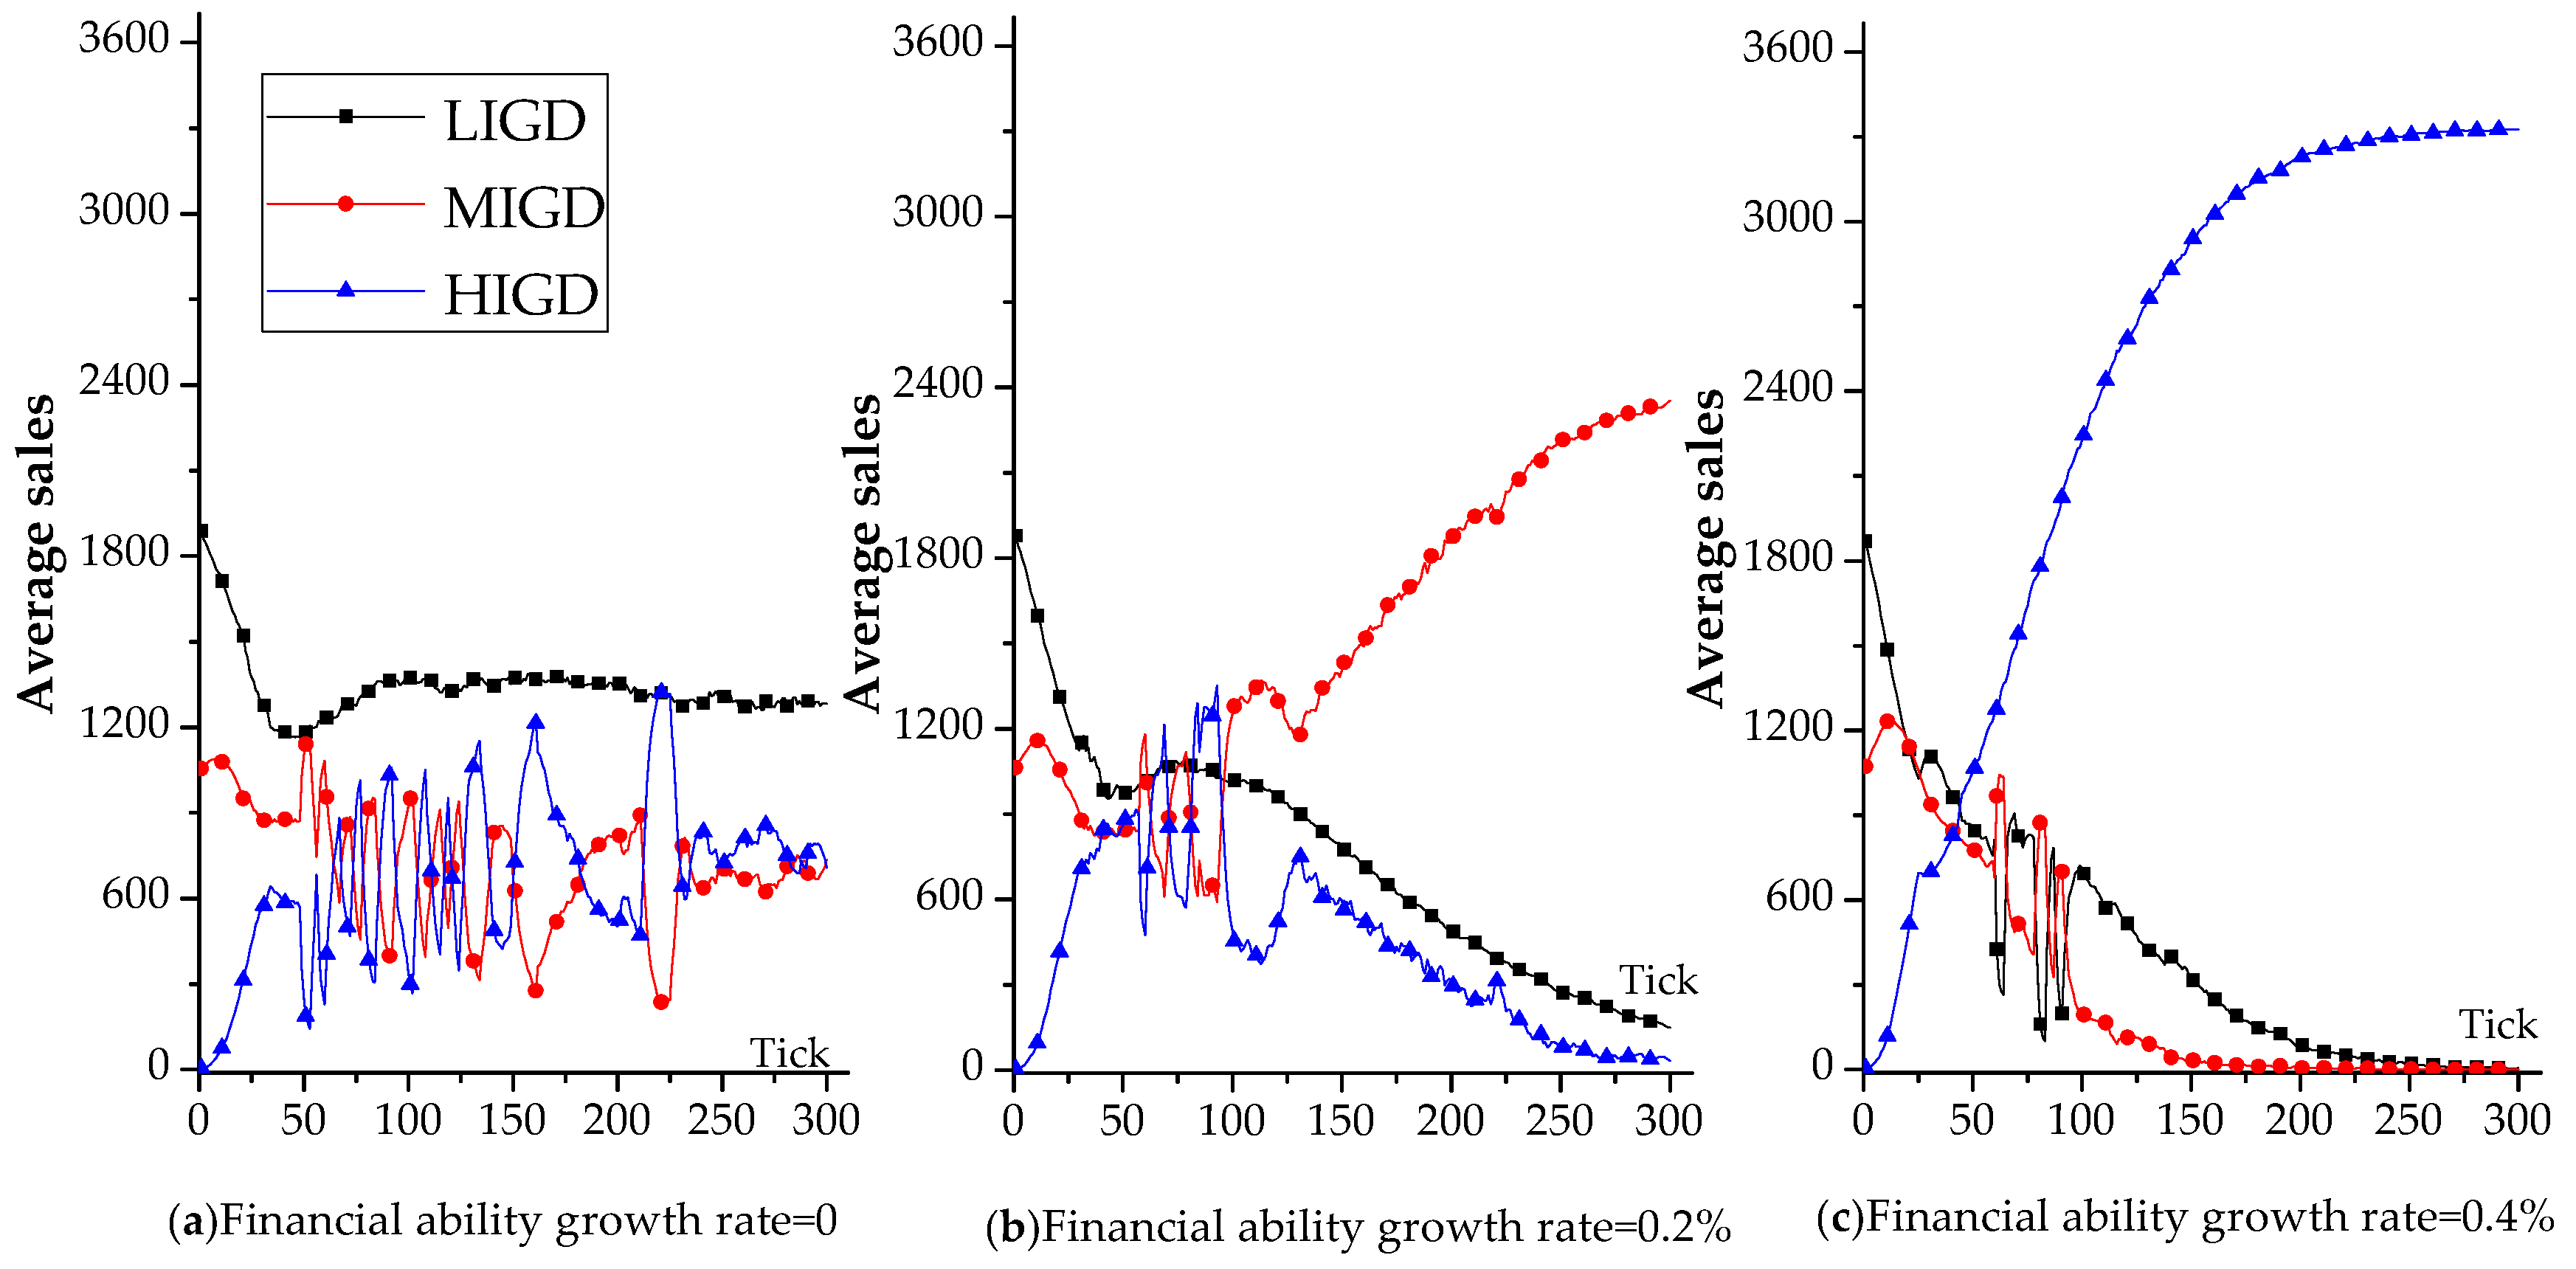
The average sales of three manufacturer categories under different growth rates of customer financial ability are presented in Figure 4. Figure 4 shows that when the growth rate of customer financial ability is 0, the sales of LIGD declines first and then stabilizes, while the sales of MIGD and HIGD fluctuate and alternate with each other, and the sales of MIGD and HIGD are lower than that of LIGD. When the growth rate of customers’ financial ability is 0.2%, as shown in Figure 4b, with the increase in customer financial ability, MIGD gradually seizes the market share, while the market competitiveness of ILGD and HIGD gradually weakens. When the growth rate of customer financial ability is 0.4%, as shown in Figure 4c, with the increase in customers’ financial ability, the sales of HIGD increase rapidly, while the market competitiveness of MIGD and LIGD gradually weakens, so their product sales show a downward trend.
Thus, it can be seen that the dynamic change of customer financial ability will have a different impact on the market competitiveness of products with different green degrees. As customer financial ability continues to grow, it makes green building products with a certain green degree stand out in the market competition. Furthermore, relying on the increase in customer financial ability, the path dependence of market share is gradually forming, which ensures the continuous market competitiveness of the outstanding manufacturer. Thus, in a market where customer financial ability increases constantly, green building product manufacturers should strive to match the green demand of customers as much as possible, and take relevant measures to increase the sales of products to seize the market share instead of improving the green product degree blindly, which is helpful for manufacturers to continuously improve their competitive advantage.
Figure 5 shows that corresponding to the same growth rate of customer financial ability, the evolution of average profit of three manufacturer categories is consistent with their sales in Figure 4. As customer financial ability continues growing, the market sales of a certain category of green building products will increase and gradually dominate the market, making the average profit of such product manufacturers show an upward trend. Therefore, it can be seen that customer financial ability has become one of the most important factors affecting the profit difference of manufacturers with different green product degrees.
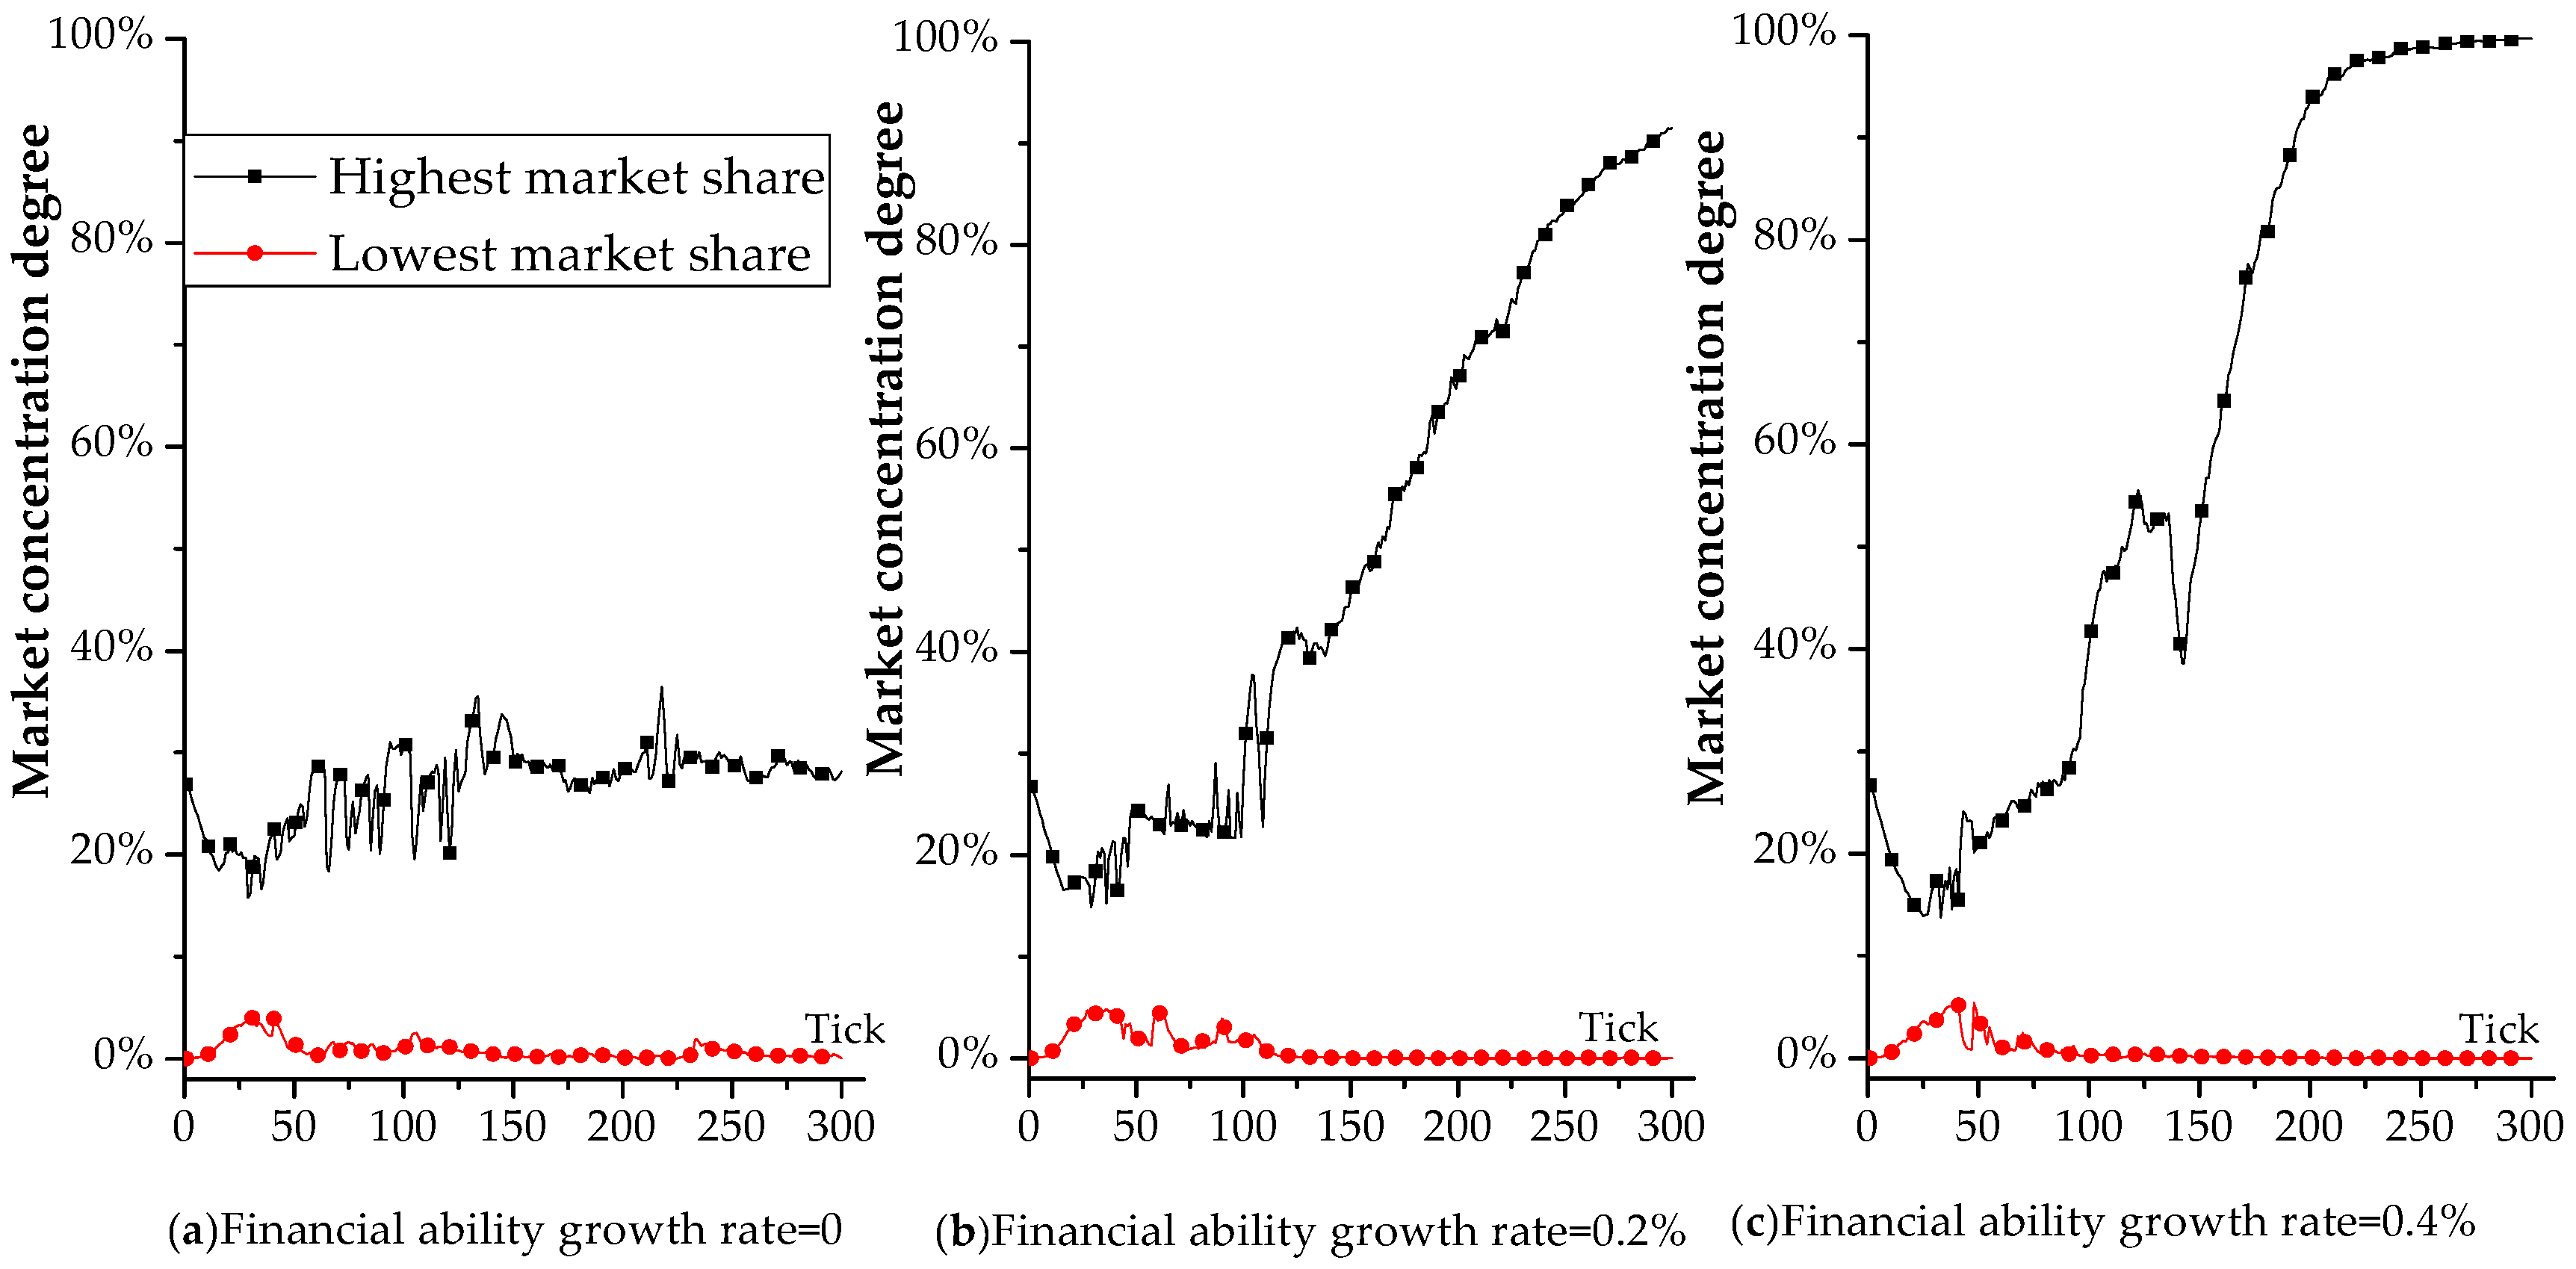
5.3. Manufacturer Market Share
The evolution of the product market concentration degree when the growth rate of customer financial ability is 0, 0.2%, and 0.4% is shown in Figure 6a–c, respectively. The product market concentration degree is able to reflect the difference in competitiveness between manufacturers in the market. When the growth rate of customer financial ability is 0, the highest market share gradually increases to more than 30% and the lowest market share is close to 0; when the growth rate of customer financial ability is 0.2%, the highest market share reaches about 90%; when the growth rate of customer financial ability is 0.4%, the highest market share is stable at around 1. The results shown in Figure 6 suggest that the higher the growth rate of customer financial ability, the easier it will be for individual manufacturer to seize the market, or even monopolize it.
6. Conclusions
This paper aimed to provide a theoretical basis for promoting the sustainable development of engineering construction by studying the decision-making mechanism of green building product manufacturers and the corresponding market evolution mechanism. In view of this, this paper took the more complex characteristics of agents into consideration, and described the decision-making of green building product manufacturers through the swarm intelligence algorithm. On the basis of fully considering the interaction among customers and the competition between manufacturers, this paper carried out a multidimensional and panoramic analysis of the macro behavior performances of manufacturers, customers, and green building products.
Results showed that: (1) The growth rate of customer financial ability is one of the key factors influencing the green degree decision of manufacturers, and the growth of customer financial ability has a positive effect on improving the green product degree. (2) When the financial ability of customers is relatively stable (the growth rate is 0), through referring to their historical experience, continuous mutual learning, imitation, and trial, the manufacturer is able to accurately "capture" the real demand for the green product degree of customers. In a dynamic market where customer financial ability grows continuously, the average green degree of products produced by manufacturers may be lower than that of products actually purchased by customers. (3) The dynamic change of customer financial ability will have a different impact on the market competitiveness of products with different green degrees. A building product with a certain range of green degree may stand out in the market competition with the increase in customer financial ability, and may form the path dependence of market share, which may lead this kind of manufacturer to monopolize the market.
In addition, the reality may be more complicated. The equations in our model are simplified demonstrations of the behaviors which are a necessary starting point for further studies that are at a more complicated level by integrating more factors.
Author Contributions
All authors contributed equally to this work. All authors wrote, reviewed, and commented on the manuscript. All authors have read and approved the final manuscript.
Funding
This work was supported by the National Natural Science Foundation of China (Nos. 71501084, 71671078, 71771127, 71602083); The Key Project of Philosophy and Social Science Research in Colleges and Universities in Jiangsu Province (No. 2018SJZDI052); Qing Lan Project of Jiangsu Province; Youth Backbone Teacher Training Project of Jiangsu University; The National Social Science Fund of China (18VSJ038; 17AGL010).
Acknowledgments
The authors would like to acknowledge the professionals who collaborated on this study. We would also like to thank all the reviewers who provided suggestions to improve this paper.
Conflicts of Interest
The authors declare no conflict of interest. The funders had no role in the design of the study; in the collection, analyses, or interpretation of data; in the writing of the manuscript, or in the decision to publish the results.
References
- Robichaud, L.B.; Anantatmula, V.S. Greening project management practices for sustainable construction. J. Manag. Eng. 2010, 27, 48–57. [Google Scholar] [CrossRef]
- Lippiatt, B.C. Selecting cost-effective green building products: Bees approach. J. Constr. Eng. Manag. 1999, 125, 448–455. [Google Scholar] [CrossRef]
- Wu, P.; Song, Y.; Shou, W.; Chi, H.; Chong, H.-Y.; Sutrisna, M. A comprehensive analysis of the credits obtained by leed 2009 certified green buildings. Renew. Sustain. Energy Rev. 2017, 68, 370–379. [Google Scholar] [CrossRef]
- Zhu, W.; He, Y. Green product design in supply chains under competition. Eur. J. Oper. Res. 2017, 258, 165–180. [Google Scholar] [CrossRef]
- Oliver, H.; Volschenk, J.; Smit, E. Residential consumers in the cape peninsula’s willingness to pay for premium priced green electricity. Energy Policy 2011, 39, 544–550. [Google Scholar] [CrossRef]
- Li, X.; Wu, P.; Shen, G.Q.; Wang, X.; Teng, Y. Mapping the knowledge domains of building information modeling (bim): A bibliometric approach. Autom. Constr. 2017, 84, 195–206. [Google Scholar] [CrossRef]
- Song, Y.; Tan, Y.; Song, Y.; Wu, P.; Cheng, J.C.P.; Kim, M.J.; Wang, X. Spatial and temporal variations of spatial population accessibility to public hospitals: A case study of rural–urban comparison. GIScience Remote Sens. 2018, 55, 718–744. [Google Scholar] [CrossRef]
- Shi, Q.; Zhu, J.; Li, Q. Cooperative evolutionary game and applications in construction supplier tendency. Complexity 2018, 2018, 8401813. [Google Scholar] [CrossRef]
- Zhu, J.; Shi, Q.; Wu, P.; Sheng, Z.; Wang, X. Complexity analysis of prefabrication contractors’ dynamic price competition in mega projects with different competition strategies. Complexity 2018, 2018, 5928235. [Google Scholar] [CrossRef]
- Cao, J.; Zhou, G.G.; Qi, Y. The decision analysis on the development of green products based upon manufacturesâ™ competition. Key Eng. Mater. 2011, 467–469, 1721–1726. [Google Scholar] [CrossRef]
- Thøgersen, J.; Jørgensen, A.K.; Sandager, S. Consumer decision making regarding a “green” everyday product. Psychol. Mark. 2012, 29, 187–197. [Google Scholar] [CrossRef]
- Zhou, M.; Pan, Y.; Chen, Z.; Yang, W.; Li, B. Selection and evaluation of green production strategies: Analytic and simulation models. J. Clean. Prod. 2012, 26, 9–17. [Google Scholar] [CrossRef]
- Yenipazarli, A.; Vakharia, A. Pricing, market coverage and capacity: Can green and brown products co-exist? Eur. J. Oper. Res. 2015, 242, 304–315. [Google Scholar] [CrossRef]
- Yu, Y.; Han, X.; Hu, G. Optimal production for manufacturers considering consumer environmental awareness and green subsidies. Int. J. Prod. Econ. 2016, 182, 397–408. [Google Scholar] [CrossRef]
- Chen, Y.J.; Sheu, J.-B. Non-differentiated green product positioning: Roles of uncertainty and rationality. Transp. Res. Part E Logist. Transp. Rev. 2017, 103, 248–260. [Google Scholar] [CrossRef]
- Raza, S.A.; Rathinam, S.; Turiac, M.; Kerbache, L. An integrated revenue management framework for a firm’s greening, pricing and inventory decisions. Int. J. Prod. Econ. 2018, 195, 373–390. [Google Scholar] [CrossRef]
- Tsai, W.; Lin, W.; Fan, Y.; Lee, P.; Lin, S.; Hsu, J. Applying a mathematical programming approach for a green product mix decision. Int. J. Prod. Res. 2012, 50, 1171–1184. [Google Scholar] [CrossRef]
- Tsaur, R.C. Green product pricing decision analysis with application to personal computers. Int. J. Prod. Res. 2015, 53, 307–320. [Google Scholar] [CrossRef]
- Chen, S.; Wang, X.; Wu, Y.; Ni, L. Pricing policies in green supply chains with vertical and horizontal competition. Sustainability 2017, 9, 2359. [Google Scholar] [CrossRef]
- Basiri, Z.; Heydari, J. A mathematical model for green supply chain coordination with substitutable products. J. Clean. Prod. 2017, 145, 232–249. [Google Scholar] [CrossRef]
- Jamali, M.-B.; Rasti-Barzoki, M. A game theoretic approach for green and non-green product pricing in chain-to-chain competitive sustainable and regular dual-channel supply chains. J. Clean. Prod. 2018, 170, 1029–1043. [Google Scholar] [CrossRef]
- Zhang, Q.; Tang, W.; Zhang, J. Who should determine energy efficiency level in a green cost-sharing supply chain with learning effect? Comput. Ind. Eng. 2018, 115, 226–239. [Google Scholar] [CrossRef]
- Castro-Lacouture, D.; Sefair, J.A.; Flórez, L.; Medaglia, A.L. Optimization model for the selection of materials using a leed-based green building rating system in Colombia. Build. Environ. 2009, 44, 1162–1170. [Google Scholar] [CrossRef]
- Marker, A.W.; Mason, S.G.; Morrow, P. Change factors influencing the diffusion and adoption of green building practices. Perform. Improv. Q. 2014, 26, 5–24. [Google Scholar] [CrossRef]
- Zuo, J.; Zhao, Z.-Y. Green building research–current status and future agenda: A review. Renew. Sustain. Energy Rev. 2014, 30, 271–281. [Google Scholar] [CrossRef]
- Wang, T.; Seo, S.; Liao, P.-C.; Fang, D. Ghg emission reduction performance of state-of-the-art green buildings: Review of two case studies. Renew. Sustain. Energy Rev. 2016, 56, 484–493. [Google Scholar] [CrossRef]
- Wimala, M.; Akmalah, E.; Sururi, M.R. Breaking through the barriers to green building movement in Indonesia: Insights from building occupants. Energy Procedia 2016, 100, 469–474. [Google Scholar] [CrossRef]
- Hwang, B.-G.; Shan, M.; Supa’at, N.N.B. Green commercial building projects in singapore: Critical risk factors and mitigation measures. Sustain. Cities Soc. 2017, 30, 237–247. [Google Scholar] [CrossRef]
- Teng, J.; Xu, C.; Wang, W.; Wu, X. A system dynamics-based decision-making tool and strategy optimization simulation of green building development in China. Clean Technol. Environ. Policy 2018, 20, 1259–1270. [Google Scholar] [CrossRef]
- Ding, G.K. Sustainable construction—The role of environmental assessment tools. J. Environ. Manag. 2008, 86, 451–464. [Google Scholar] [CrossRef] [PubMed] [Green Version]
- Ali, H.H.; Nsairat, S.F.A. Developing a green building assessment tool for developing countries—Case of Jordan. Build. Environ. 2009, 44, 1053–1064. [Google Scholar] [CrossRef]
- Huang, M.; Wang, B. Evaluating green performance of building products based on gray relational analysis and analytic hierarchy process. Environ. Prog. Sustain. Energy 2013, 33, 1389–1395. [Google Scholar] [CrossRef]
- Sinha, A.; Gupta, R.; Kutnar, A. Sustainable development and green buildings. Drvna Ind. 2013, 64, 45–53. [Google Scholar] [CrossRef]
- Luo, Z.; He, J.; Pan, H.; Yang, Y. Research on the selection strategy of green building parts supplier based on the catastrophe theory and kent index method. Adv. Mater. Sci. Eng. 2016, 2016, 4673526. [Google Scholar] [CrossRef]
- Zhang, Y.; Wang, J.; Hu, F.; Wang, Y. Comparison of evaluation standards for green building in China, Britain, United States. Renew. Sustain. Energy Rev. 2017, 68, 262–271. [Google Scholar] [CrossRef]
- Sackey, S.; Kim, B.-S. Environmental and economic performance of asphalt shingle and clay tile roofing sheets using life cycle assessment approach and topsis. J. Constr. Eng. Manag. 2018, 144. [Google Scholar] [CrossRef]
- Meng, Q.; Li, Z.; Liu, H.; Chen, J. Agent-based simulation of competitive performance for supply chains based on combined contracts. Int. J. Prod. Econ. 2017, 193, 663–676. [Google Scholar] [CrossRef]
- Li, Z.; Lv, X.; Zhu, H.; Sheng, Z. Analysis of complexity of unsafe behavior in construction teams and a multiagent simulation. Complexity 2018, 2018, 6568719. [Google Scholar] [CrossRef]
- Meng, Q.; Chen, J.; Qian, K. The complexity and simulation of revenue sharing negotiation based on construction stakeholders. Complexity 2018, 2018, 5698170. [Google Scholar] [CrossRef]
- Newman, M.E. Models of the small world. J. Stat. Phys. 2000, 101, 819–841. [Google Scholar] [CrossRef]
- Zhang, T.; Zhang, D. Agent-based simulation of consumer purchase decision-making and the decoy effect. J. Bus. Res. 2007, 60, 912–922. [Google Scholar] [CrossRef]
- Kim, B.D.; Blattberg, R.C.; Rossi, P.E. Modeling the distribution of price sensitivity and implications for optimal retail pricing. J. Bus. Econ. Stat. 1995, 13, 291–303. [Google Scholar]
- Patel, S.; Schlijper, A. Models of consumer behaviour. In Proceedings of the 49th European Study Group with Industry, Oxford, UK, 29 March–2 April 2004; Volume 29. [Google Scholar]
- Huang, J.H.; Chen, Y.F. Herding in online product choice. Psychol. Mark. 2006, 23, 413–428. [Google Scholar] [CrossRef] [Green Version]
- Adepetu, A.; Keshav, S.; Arya, V. An agent-based electric vehicle ecosystem model: San Francisco case study. Transp. Policy 2016, 46, 109–122. [Google Scholar] [CrossRef]
- Eppstein, M.J.; Grover, D.K.; Marshall, J.S.; Rizzo, D.M. An agent-based model to study market penetration of plug-in hybrid electric vehicles. Energy Policy 2011, 39, 3789–3802. [Google Scholar] [CrossRef]
- Liu, Z.L.; Anderson, T.D.; Cruz, J.M. Consumer environmental awareness and competition in two-stage supply chains. Eur. J. Oper. Res. 2012, 218, 602–613. [Google Scholar] [CrossRef]
- Shi, Y.; Eberhart, R. A modified particle swarm optimizer. In Proceedings of the 1998 IEEE International Conference on Evolutionary Computation Proceedings: IEEE World Congress on Computational Intelligence, Anchorage, AK, USA, 4–9 May 1998; pp. 69–73. [Google Scholar]
- Kennedy, J. The particle swarm: Social adaptation of knowledge. In Proceedings of the IEEE International Conference on Evolutionary Computation, Indianapolis, IN, USA, 13–16 April 1997; pp. 303–308. [Google Scholar]
- McCoy, D.; Lyons, S. Consumer preferences and the influence of networks in electric vehicle diffusion: An agent-based microsimulation in Ireland. Energy Res. Soc. Sci. 2014, 3, 89–101. [Google Scholar] [CrossRef]
Figure 1.
The system structure diagram.

Figure 2.
Evolution of average green product degree of three manufacturer categories.

Figure 3.
Evolution of average green product degree of products provided by manufacturers and that purchased by customers.
Figure 3.
Evolution of average green product degree of products provided by manufacturers and that purchased by customers.

Figure 4.
Evolution of average product sales of three manufacturer categories.

Figure 5.
Evolution of average profit of three manufacturer categories.

Figure 6.
Evolution of market concentration degree.


Table 1.
The initial value setting of the basic parameters of the model.
| Equation No. | References/Description | Equation No. | References/Description |
|---|---|---|---|
| 1 | [41] | 7 | [45] |
| 2 | [42] | 8 | Considering [46], and Equation (7), Equation (6) can be updated as Equation (8) |
| 3 | [43] | 9 | [47] |
| 4 | [44] | 10 | According to cost-plus pricing method. |
| 5 | [37] | 11 | Calculation of product sales. |
| 6 | put Equations (2) to (5) into Equation (1), the utility can be updated as Equation (6) | 12 | Calculation of profit. |
Table 2.
The initial value setting of the basic parameters of the model.
| Parameter | Range of Value | Distribution | Parameter | Range of Value | Distribution |
|---|---|---|---|---|---|
| 10,000 | Constant | 10 | Constant | ||
| U(1,20) | Uniform distribution | U(0.4,0.6) | Uniform distribution | ||
| 0.067 | Constant | −13.54 | Constant | ||
| U(0.0,0.1) | Uniform distribution | 0.2 | Constant | ||
| 4 | Constant | 5 | Constant | ||
| 0.02 | Constant | 0.1 | Constant | ||
| 1 | Constant | 2 | Constant | ||
| 2 | Constant | N(400,100) | Normal distribution |
© 2018 by the authors. Licensee MDPI, Basel, Switzerland. This article is an open access article distributed under the terms and conditions of the Creative Commons Attribution (CC BY) license (http://creativecommons.org/licenses/by/4.0/).
Share and Cite
MDPI and ACS Style
Meng, Q.; Zhu, H.; Li, Z.; Du, J.; Wang, X.; Jeong Kim, M. How Green Building Product Decisions from Customers Can Be Transitioned to Manufacturers: An Agent-Based Model. Sustainability 2018, 10, 3977. https://doi.org/10.3390/su10113977
AMA Style
Meng Q, Zhu H, Li Z, Du J, Wang X, Jeong Kim M. How Green Building Product Decisions from Customers Can Be Transitioned to Manufacturers: An Agent-Based Model. Sustainability. 2018; 10(11):3977. https://doi.org/10.3390/su10113977
Chicago/Turabian StyleMeng, Qingfeng, Hongming Zhu, Zhen Li, Jianguo Du, Xiangyu Wang, and Mi Jeong Kim. 2018. "How Green Building Product Decisions from Customers Can Be Transitioned to Manufacturers: An Agent-Based Model" Sustainability 10, no. 11: 3977. https://doi.org/10.3390/su10113977
Note that from the first issue of 2016, this journal uses article numbers instead of page numbers. See further details here.