Fuzzy AHP, DEA, and Managerial Analysis for Supplier Selection and Development; From the Perspective of Open Innovation

1
School of Business, Pusan National University, Busan 46241, Korea
2
Director, Pusan National University Press, Pusan National University, Busan 46241, Korea
*
Author to whom correspondence should be addressed.
Sustainability 2018, 10(10), 3779; https://doi.org/10.3390/su10103779
Submission received: 17 September 2018
/
Revised: 15 October 2018
/
Accepted: 15 October 2018
/
Published: 19 October 2018
(This article belongs to the Special Issue Sustainability of Economy, Society, and Environment in the 4th Industrial Revolution)
Abstract
:Supplier management is critical for supply chain management (SCM). The aim of supplier selection is to find an order of preference among potential suppliers. However, the ranking results for supplier selection may not be important, particularly when the performances are conflicting or have minor differences. Different criteria may have different impacts on the ranking results, and different decision makers may place different priorities on multiple criteria. Relatively worse suppliers may still have to be used for many practical reasons. One alternative is supplier development, but it has been focused on categorizing individual suppliers for possible action plans. A new framework is proposed in this research to address supplier selection and supplier development at the same time in the publishing and printing industries. First, the fuzzy analytical hierarchy process (fuzzy AHP) and data envelopment analysis (DEA) are sequentially performed to rank and select the best supplier(s) of a publishing company. In addition to ranking suppliers, a managerial analysis is proposed to assess the impact of important criteria on supplier selection in more detail. Finally, the results of the DEA are provided for direct supplier development without supplier categorization. This research shows that the proposed framework effectively addresses supplier development as well as supplier selection in the publishing and printing industries.
1. Introduction
The printing industry, which produces books, business cards, business forms, labels, newspapers, stationery, and other materials, is basically fragmented and diverse [1,2]. Printing companies range in geographic reach from those serving only local customers to those having global customer bases. Printing companies also range in size from sole proprietorships to large multinational corporations with tens of thousands of employees. Moreover, they vary in the diversity of services and products offered. As products become more commoditized, printing firms focus on the role of service to a much greater extent [1]. The manufacturing operations of such printing companies often reflect a service-at-all-costs philosophy, even at the expense of increased productivity.
It was only in the late 1990s that the printing industry began to use the term “manufacturing” to describe what it does [3]. Even nowadays, the managers of printing companies who describe print production with the term “manufacturing” are often met with skepticism and hostility. Before the digital age, the printing industry relied on a highly skilled workforce without a process engineering department. As many printing companies, especially small printers, do not have an articulated business strategy or established goals for future cost reductions, they often rely heavily on management intuition to guide their investments. Most of their decisions seem to be inspired by a desire to offer better services to their customers for future sales by doing anything and everything necessary to take care of their customers. Printing is very distinctive by nature; it is at the borderline between service and manufacturing, but has not gained much attention thus far.
Publishing is engaged in the publishing of books, magazines, newspapers, and other periodicals [2]. While the NAICS (North American Industry Classification System) classifies printing as manufacturing, publishing is classified in the information sector. Although publishing and printing are often carried out by the same company, the two activities are infrequently done in the same establishment. Printing companies often work as suppliers for publishing companies.
A supply chain starts with the basic suppliers of raw materials and includes manufacturers, wholesalers, retailers, and customers. As business becomes increasingly competitive, supply chain management (SCM) has become more popular and significant. Savings from suppliers are very important for companies that spend a high percentage of their revenue on supplies [4]. Material purchasing costs are more than 50% of the total production costs in most industries [5,6]. For high-tech industries, outsourced components and parts often account for more than 80% of the cost of finished goods [7]. It is thus not surprising that supplier management has increasingly been recognized as a critical decision in SCM and has attracted huge interest [8].
Supplier management requires supplier evaluation at two distinct moments: supplier selection and supplier development [9]. Suppliers are evaluated to select the best supplier(s), while considering multiple criteria simultaneously. Supplier evaluation for supplier selection is performed to find an order of preference among potential suppliers, while supplier evaluation for supplier development has been focused on categorizing individual suppliers [10]. The results of supplier categorization can eventually be used for devising action plans for supplier development.
Price has traditionally been used as a sole criterion for supplier selection [7]. However, it is no longer adequate to identify the best supplier(s) among potential suppliers with a single criterion in competitive business environments. More supplier selection problems are now in formulation by multiple criteria decision-making (MCDM) approaches.
Falsini et al. [11] proposed an efficient and effective decision support system to evaluate third-party logistics service providers. The proposed evaluation method was based on the integration of analytical hierarchy process (AHP), data envelopment analysis (DEA), and linear programming (LP) to effectively manage multi-criterion complexity. Parthiban and Zubar [12] considered a supplier selection problem in the automotive components manufacturing industry of southern India. Their paper integrated AHP and modified interpretive structural modeling (MISM) for supplier selection. Rezaei [13] presented mathematical models for partner selection with several numerical examples. The proposed models involved both buyers and suppliers in the bilateral evaluation and selection procedure using mathematical assignment models. Sodenkamp et al. [4] provided a framework designed to guide and assist decision makers in the process of international supplier evaluation and selection for an agricultural commodity trading company. The proposed model integrated multi-criteria decision analysis and linear programming (LP) for multi-objective collaborative environments. The aforementioned four papers, however, did not address the vagueness of human beings’ subjective judgments.
Parthiban et al. [7] proposed a structured framework for solving a vendor evaluation and selection problem. The proposed framework used fuzzy SWOT (Strengths, Weaknesses, Opportunities, and Threats) and DEA to rank and evaluate the vendors for an automotive components manufacturer. However, pairwise comparisons, consistency checks, and AHP could have improved both the consistency of the decision-making process and the quality of the decisions [14]. Pitchipoo et al. [5] proposed a hybrid model for selecting the best supplier in the electroplating industry. The proposed hybrid model combined the fuzzy analytical hierarchy process (fuzzy AHP) and grey relational analysis (GRA) for the supplier selection problem in the southern part of India. Yayla et al. [15] provided a hybrid approach to evaluate third-party logistics (3PL) service providers for a confectionary company. The hybrid approach integrated fuzzy theory, AHP, and the technique for order preference by similarity to ideal solution (TOPSIS) for evaluating 3PL service providers. While the two preceding papers were concerned with very intriguing approaches, they did not utilize the benefits of the DEA approach.
A major problem with regard to supplier selection in real situations is that different decision makers may emphasize different criteria. Even the same decision maker can put different priorities on multiple criteria in different business environments. Multiple criteria may have different priorities at different companies even in the same industry. Another problem in real situations is that the ranking results of suppliers may not be important, particularly when the performance differences are slight. Furthermore, performances are oftentimes conflicting over different criteria. One more problem is that different criteria can have different impacts on the ranking of the suppliers. Decision makers and suppliers may have to focus on critical criteria for their efficient business. Finally, relatively worse suppliers may still have to be used for a variety of reasons. The best supplier(s) may have overcapacity or may not meet urgent orders for a short period of time. Moreover, certain orders may have special technical or business needs that the best supplier(s) cannot meet.
The alternative to the first three problems is to analyze the impact of important criteria on supplier selection in more detail, in addition to simply ranking suppliers. The alternative to the last problem is supplier development, which is defined as any effort or set of practices of a buying company for improving the capabilities and performance of its suppliers to better meet its supply needs [9]. Few studies have proposed MCDM approaches for supplier evaluation and development [10]. Even those studies have focused on supplier categorization, which may not be the only solution to devising action plans for supplier development.
Aksoy and Ozturk [16] presented a neural network-based approach for supplier selection and evaluation. Their neural network approach classified suppliers into two groups for supplier selection and into three groups for supplier evaluation for development. Omurca [17] proposed a solution for supplier selection and development. The proposed approach clustered suppliers into three groups and generated classification rules to label the three clusters for supplier evaluation and selection. The clustering also identified the core attributes that should be improved for supplier development.
Osiro et al. [9] proposed an approach for decision making in supplier evaluation for development. Their proposed approach, which is based on fuzzy inference combined with the simple fuzzy grid method, categorizes suppliers to help decision makers review supplier development action plans. Lima-Junior and Carpinetti [10] presented an approach for supplier evaluation and development in a manufacturing context. Their approach evaluated and categorized the suppliers by using the supply chain operations reference (SCOR) model and the fuzzy technique for order of preference by similarity to ideal solution (TOPSIS).
This research proposes a new framework to simultaneously tackle two problems, supplier selection and supplier development, in the publishing and printing industries. First, fuzzy AHP is used to address the subjectivity and vagueness of human beings’ subjective judgments and to rank the suppliers of a publishing company while considering several criteria at the same time. Additionally, DEA evaluates the relative performance of suppliers for the publishing company. A managerial analysis is also proposed to assess the impact of important criteria on supplier selection in more detail. Finally, the DEA is adopted for negotiation with each inefficient supplier for further development.
Several contributions of this paper can be summarized, to the best of the authors’ knowledge, as follows. First, no research has yet addressed supplier selection or supplier development for the publishing and printing industries. Second, this paper tackles supplier selection and supplier development from a new and more practical perspective. This study goes beyond ranking suppliers for supplier selection and does not rely on classification or clustering for supplier development. Finally, this research proposes a new methodological framework based on fuzzy AHP, DEA, and a managerial analysis to simultaneously address two problems of supplier selection and supplier development.
The rest of the paper is organized as follows. The next section explains fuzzy AHP and DEA. Supplier selection and development problems for a publishing company are described in Section 3. Section 4 provides the results of the proposed framework for the publishing company. The conclusions follow in the last section.
2. Methodologies
2.1. Fuzzy Analytical Hierarchy Process
Fuzzy AHP has recently been introduced to tackle the vagueness encountered in the decision making process with AHP [5,15,18]. Among others, this research adopts Buckley’s geometric mean method, because Buckley’s method provides a unique solution to the reciprocal comparison matrix [15,19,20,21]. The pairwise comparisons for the alternatives and the criteria are made using a preference scale. They are subsequently used to obtain the fuzzy numbers for the fuzzy AHP computations. The preference scale and corresponding fuzzy numbers are presented in Table 1.
When triangular fuzzy number is defined as a triplet (, , ), is the smallest possible value, is the most likely value, and is the largest possible value [22,23]. The symbol tilde represents a fuzzy number. If two triangular fuzzy numbers are = (, , ) and = (, , ), the basic laws of arithmetic can be expressed as follows:
where denotes the multiplication of two triangular fuzzy numbers to obtain only an approximate triangular fuzzy number.
The steps for the geometric mean method are as follows.
- Step 1:
- A fuzzy matrix is generated from a pairwise comparison matrix based on the comparison ratings given by an expert. The fuzzy matrix from expert h is represented by Equation (4). = () is the fuzzy triangular value that represents the preference of expert h for criterion i over criterion j (or alternative i over alternative j with respect to a criterion). For example, = (4, 5, 6) denotes the first expert’s preference for the third criterion over the fourth criterion that is materialized by fuzzy triangular number (4, 5, 6).where n is the number of criteria (or the number of alternatives).
- Step 2:
- With more than one expert in the pairwise comparisons, the average of the preferences of H experts can be calculated by Equation (5).where is the average of the preferences of H experts.
- Step 3:
- The average matrix is obtained with the average preferences by Equation (6).
- Step 4:
- The geometric mean of the fuzzy comparison values of criterion i with all criteria (or alternative i with all alternatives with regard to each criterion) is computed by Equation (7).
- Step 5:
- The fuzzy weight for criterion i (or fuzzy score for alternative i with regard to each criterion) is calculated by Equation (8).
- Step 6:
- To defuzzify the fuzzy weight for criterion i (or the fuzzy score for alternative i with regard to each criterion), the center of area method [24] is applied using Equation (9).
- Step 7:
- The last step is to normalize by Equation (10).
To calculate the normalized weights of the criteria, the above seven steps should be applied with a pairwise comparison matrix for the criteria. Similarly, the seven-step procedure should be performed with a pairwise comparison matrix for the alternatives, to obtain their normalized scores, with respect to each criterion. The same procedure should be repeated for each criterion. The remaining process is the same as the typical AHP approach that computes the overall score of each alternative. Then, the alternatives are ranked by their overall scores.
2.2. Data Envelopment Analysis
Because of its robustness, data envelopment analysis (DEA) has been widely used to evaluate the relative efficiency of homogeneous decision-making units (DMUs) using several inputs and outputs [7,14,25]. DEA indicates whether a particular unit is inefficient or less productive compared with other units. DEA can not only show how efficient a particular DMU is, but also provide a benchmark on the efficient frontier for each inefficient DMU, that is, each inefficient supplier in the supplier selection problem.
The DEA model used in this paper is an output-oriented Charnes, Cooper, and Rhodes (CCR) model with multiple outputs and a single dummy input. The outputs can be increased with fixed inputs in an output-oriented model [26,27]. When several suppliers are evaluated and selected, their customer focuses on their outputs and does not care about their inputs. Because an output-oriented CCR model without input is meaningless [28], a single constant dummy input with a value of 1 is used in this research [7]. The CCR model assumes constant returns to scale (CRS), while the Banker, Charnes, and Cooper (BCC) model assumes variable returns to scale (VRS) [29,30,31]. However, an output-oriented CCR model with a single constant input coincides with the corresponding BCC model [28].
The values of the outputs in this DEA model are , which is the normalized score of alternative (supplier) i, i = 1, ..., n, obtained by the fuzzy AHP method with respect to criterion j, j = 1, ..., m. To find the efficiency of the alternative, the following DEA model is formulated:
subject to
where
- is the efficiency score of the alternative (supplier), and
- is a non-Archimedean.
To calculate the value of , the following model should be solved:
subject to
3. Problem Statements
3.1. Publishing Company
Pusan National University Press (PNU Press) was founded in 1983 as the publishing house of Pusan National University in Korea. PNU Press, as a nonprofit organization, focuses on publishing academic books, supporting school affairs, and improving the publishing culture. It specializes mainly in university publications, such as scholarly books, scholarly journals, and academic textbooks. PNU Press also handles a variety of university materials, including reports, newsletters, brochures, catalogs, and posters. It works with printing companies as its suppliers. Any delay or problem from the suppliers can negatively impact its performance. In addition, approximately 40 to 45% of the total annual costs of PNU Press have been printing costs, and it has been staggering under deficits over the past several years. Therefore, it was critical for PNU Press to choose the best supplier(s) by considering all of the important criteria to cut unnecessary costs and to rebound from these deficits. It was also important for PNU Press to continuously manage relatively worse suppliers because they may satisfy special or urgent orders that the best supplier(s) cannot meet.
3.2. Criteria
To evaluate suppliers in the publishing and printing industries, it is necessary to choose and use appropriate criteria. The potential criteria were initially selected from a literature survey. Through discussions with the experts at PNU Press, eight criteria were finalized to assess the suppliers in the publishing and printing industries: Quality (C1), Price (C2), Delivery (C3), Flexibility (C4), Technological Capability (C5), Trust (C6), Financial Capability (C7), and Customer Service (C8).
The quality of a supplier is measured by the overall quality of the printed matter, and the quality level considers the defect and rejection rates of the printed matter. Quality is related to minimizing net rejections, the total amount of defective units, and the total rejection rate of a product [32]. A supplier should maintain quality standards to improve organizational performance [33]. Price includes the price of printed matter and the costs of ordering, transportation, delivery, and inspection [7]. Price is involved in minimizing the net cost, the total purchasing price, the net price of products after discounts, the total monetary cost, the transportation cost, and the ordering cost [32]. Delivery refers to delivering printed matter at the time promised and can be measured by the rates of on-time and late deliveries. The objective functions related to delivery are minimizing net late deliveries and the number of late items and maximizing the total amount of on-time deliveries [32]. Delivery can also influence a customer’s costs and velocity to market [34]. Flexibility is the ability of a supplier to cope with sudden changes in customer requirements and order quantities [33].
The technological capability of a supplier concerns the technical levels of the supplier’s employees and facilities that are used to process various customer requirements. Technological capability includes technology, innovation, design capability, and collaboration with research institutes [7]. A supplier should be technically able to adapt themselves to innovations [33]. In the context of supply chain relationships, trust refers to “the belief that a voluntarily accepted duty will prevail ensuring that no party exploits the other’s vulnerabilities” [35]. Financial capability is the ability of a supplier related to its debts and assets, such as debt ratio and current ratio [36]. Customer service indicates order processing accuracy and service quality, such as the levels of after-sales services and technical support [7].
3.3. Suppliers
Six suppliers were identified by the experts at PNU Press: Supplier 1 (S1) to Supplier 6 (S6). All suppliers except for Supplier 6 are in Busan, the second largest city in Korea, where PNU Press is located, while Supplier 6 is near Seoul, the largest city in Korea.
Supplier 1 (S1) is a small printing company that delivers high-quality printed matter at expensive prices. It has a long business history with PNU Press. Supplier 2 (S2) is one of the largest printing companies in Busan and is known for its competitive pricing. It is a relatively new partner of PNU Press, with a business history of approximately one year. The other four suppliers have medium to long business histories with PNU Press. Supplier 3 (S3) is a small company with good customer service and relatively high flexibility, but expensive prices. It is willing to accept a variety of orders, including small, diverse, and urgent orders. Supplier 4 (S4) also has expensive rates. Supplier 5 (S5) is a relatively large company in Busan, but has a relatively low printing quality. Supplier 6 (S6) is a company located near Seoul that offers good quality products at inexpensive prices. The six suppliers were assessed by simultaneously considering the eight criteria adopted in this paper.
4. Results
4.1. The Results of Fuzzy AHP
The supplier evaluation was performed for this study by the experts of PNU Press. Their preferences provided pairwise comparisons for the criteria and alternatives. The preference scale used for this study is shown in Table 1 [20].
The consistency of the pairwise comparisons performed for this research was assessed before the fuzzy AHP method was applied. As a result, all of the pairwise comparisons were consistent. Table 2 presents a pairwise comparison matrix obtained from one expert for all eight criteria as an example. As another example, Table 3 shows a pairwise comparison matrix of the six suppliers for only the first criterion, Quality (C1), because of limited space. Once the consistency of the pairwise comparisons was assessed, the crisp numbers of the pairwise comparisons were converted into fuzzy numbers using the preference scale and the corresponding fuzzy numbers shown in Table 1.
The geometric mean method explained in Section 2.1 was applied to the pairwise comparison matrix in Table 2 to obtain the normalized weights of the criteria in Table 4. With the same geometric mean method, the normalized scores of the suppliers for the criteria were calculated and are summarized in Table 5. For example, column ‘C1’ of Table 5 was obtained by applying the geometric mean method to the pairwise comparison matrix in Table 3.
Once the normalized weights of the criteria and the normalized scores of the suppliers for the criteria are obtained, the overall scores for all suppliers can be computed as in the typical AHP approach and are presented in Table 6. As shown in Table 6, S6 is the best supplier for PNU Press, followed closely by S1. S2 and S5 have similar scores, but lag far behind S6 and S1. S3 and S4 are not good choices for PNU Press.
4.2. The Results of DEA
The scores of the six suppliers with respect to the eight criteria in Table 5 are used as the outputs for the CCR output-oriented DEA model adopted in this paper. The eight outputs and one input for this DEA problem are summarized in Table 7.
The following DEA model was formulated to determine the efficiency of S1 as a test decision-making unit (DMU) under evaluation, among others:
subject to
The efficiency of the other suppliers can be formulated and determined by changing the objective function for each supplier. OSDEA software was used to solve the linear programing problems. The results were also double-checked with Excel. Table 8 provides the results of the efficiency. Among the six suppliers, S1 and S6 are the only efficient suppliers. The other four suppliers, S2, S3, S4, and S5, are inefficient.
4.3. Managerial Analysis
A managerial analysis is proposed by addressing the earlier result of the fuzzy AHP. The managerial analysis is based on sensitivity analysis and considers the weights for the criteria in this research. The analysis is conducted by changing one weight at a time while keeping the other weights in their given proportions to one another. The normalized weight of each criterion in Table 4 is essentially changed from 0 to 1. Once the weight of the criterion under consideration in the analysis is determined, the sum of the remaining weights for the other seven criteria is calculated such that the sum of all weights is always 1. Then, the sum of the remaining weights is proportionally distributed over the other seven criteria according to their original values in Table 4.
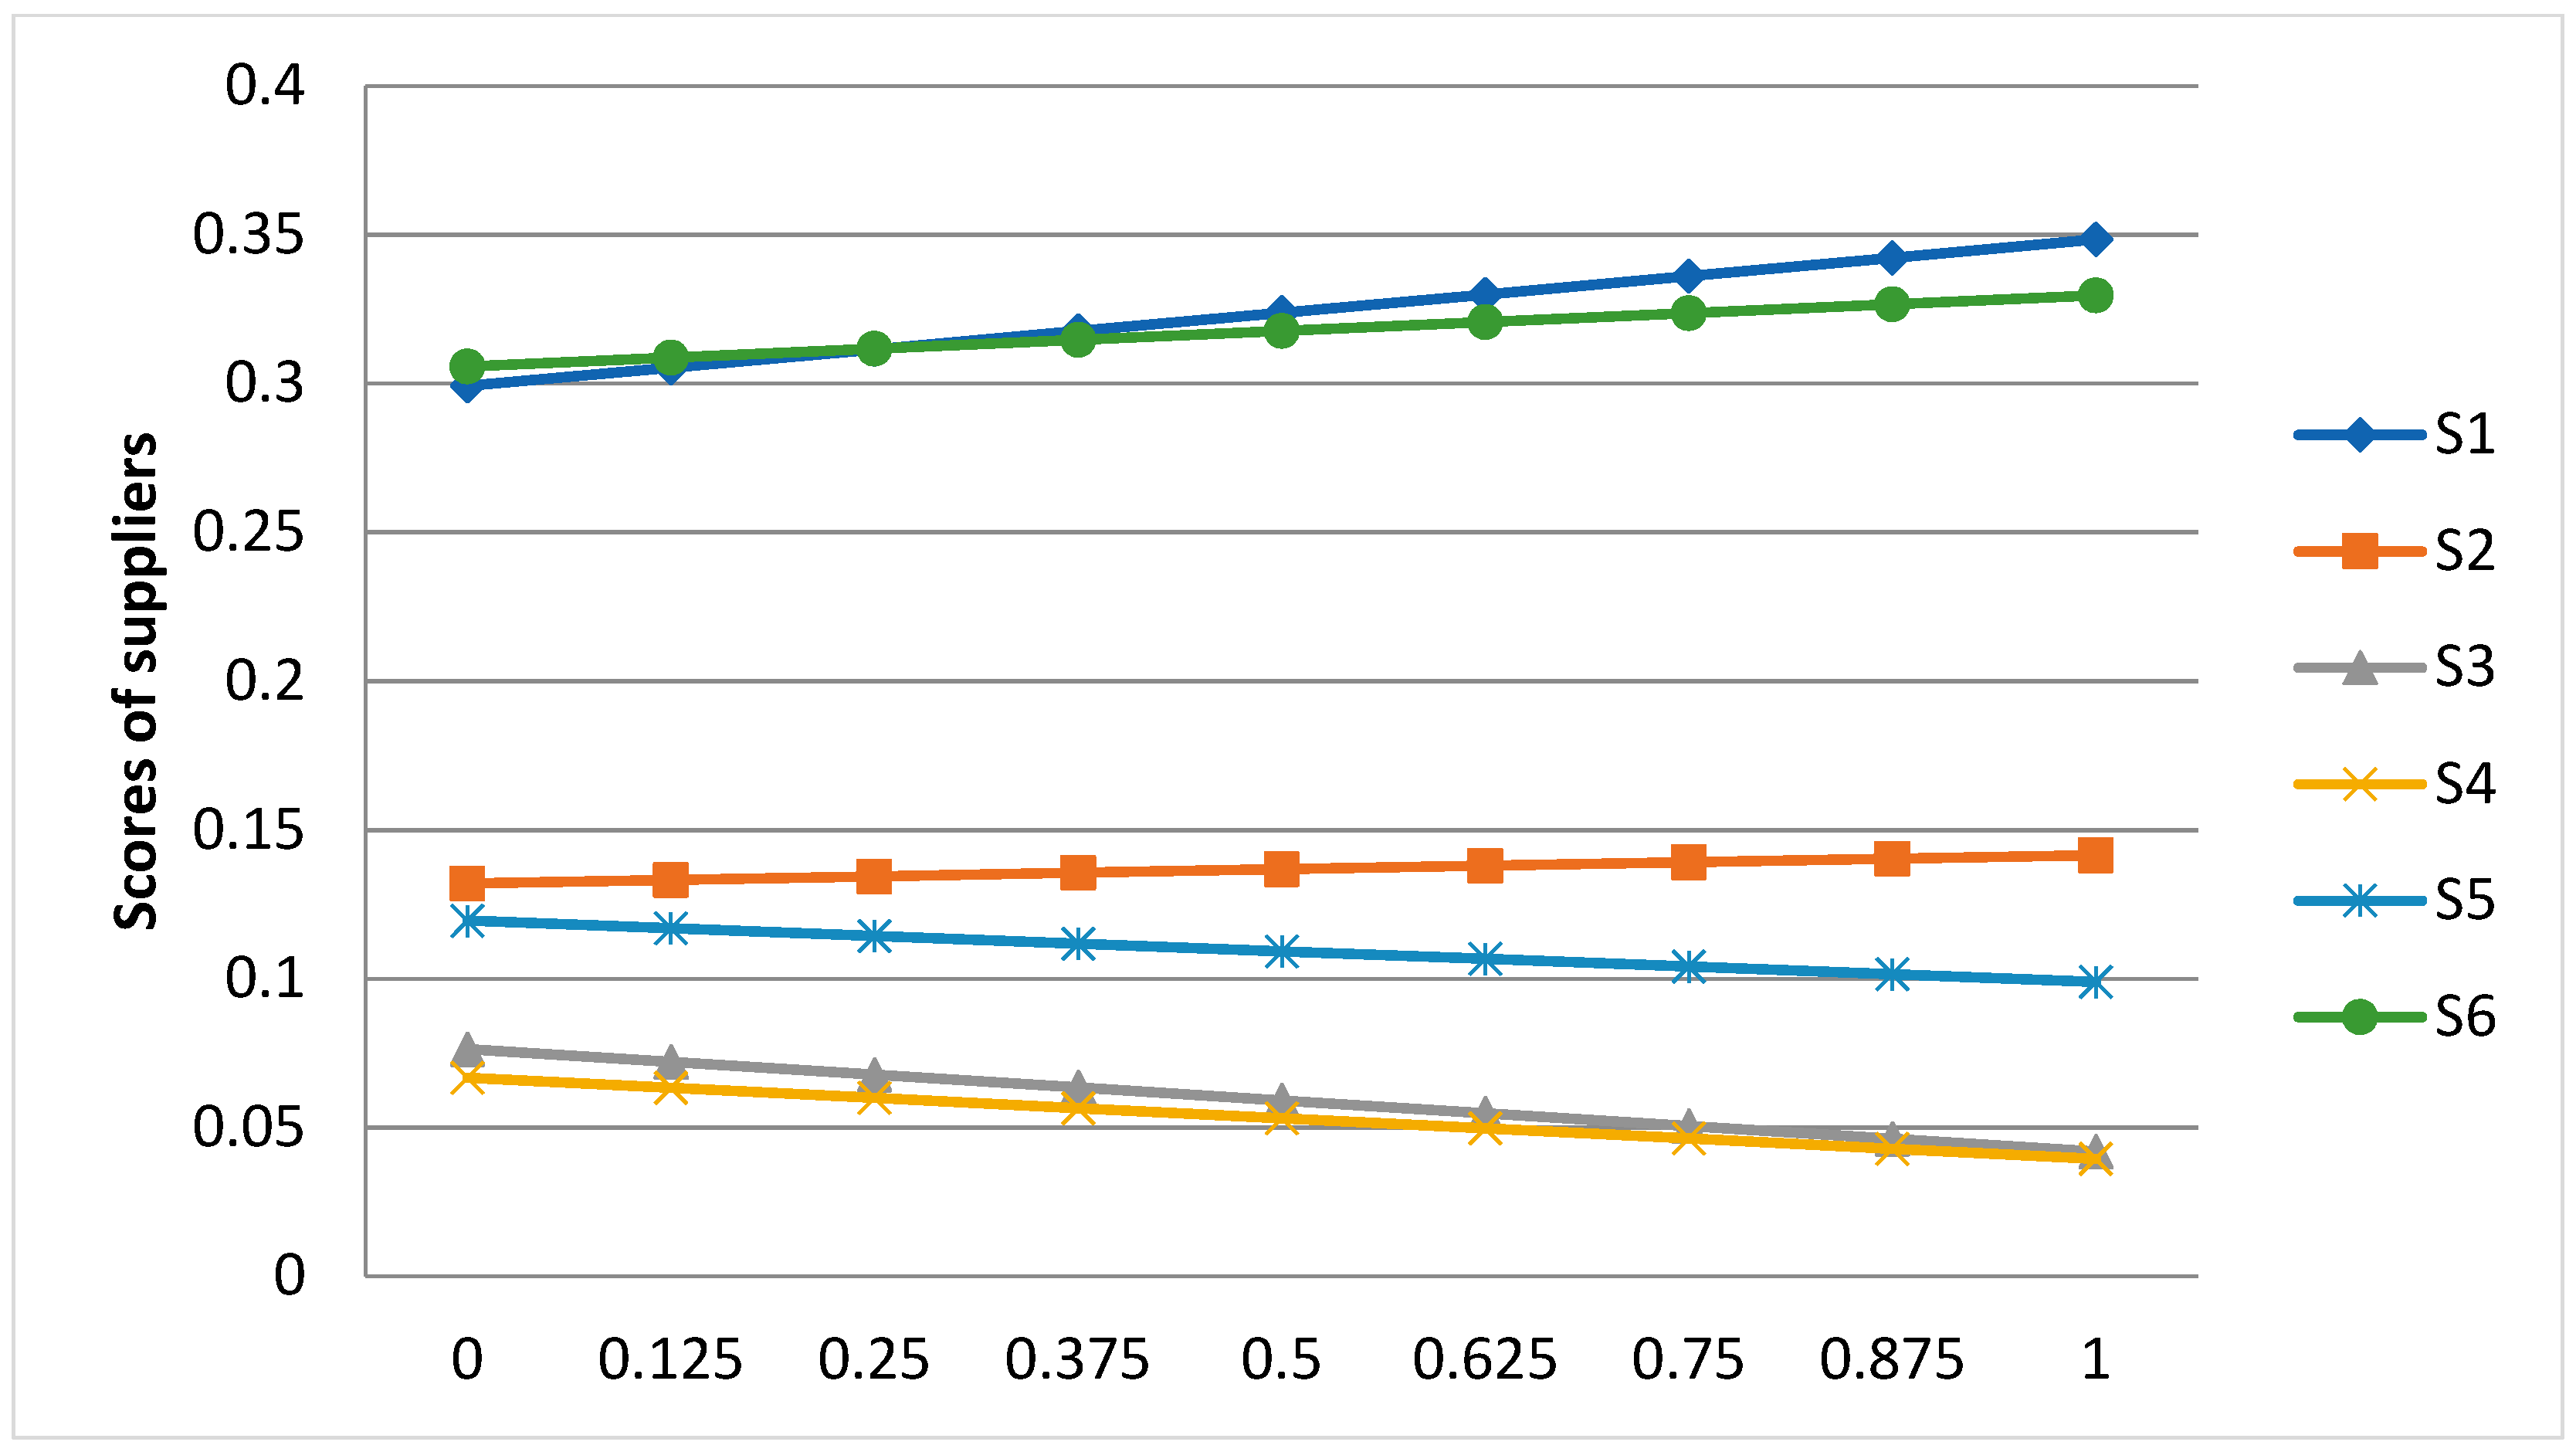
As the weight of quality (C1) changes from 0 to 1 in Figure 1, S6 and S1 remain the best suppliers. S6 starts in the top-ranked position at a weight of 0. However, S1 outranks S6 in the range at weights between 0.25 and 0.375, and maintains its lead until the weight of quality (C1) reaches 1. S1 and S6 are followed by S2, S5, S3, and S4 at a weight of 1. Importantly, when the weight of quality (C1) is 1, the other seven weights are all 0. Thus, the ranking of the suppliers at a weight of 1 in Figure 1 is the same as the ranking of column C1 in Table 5. In fact, this relationship works for all criteria from C1 to C8. That is, the ranking of the suppliers at a weight of 1 in the managerial analysis for each criterion is the same as the ranking of each corresponding column in Table 5. Although both S1 and S6 are very competitive in quality, as shown in column C1 of Table 5, the quality of S1 is slightly better than that of S6.
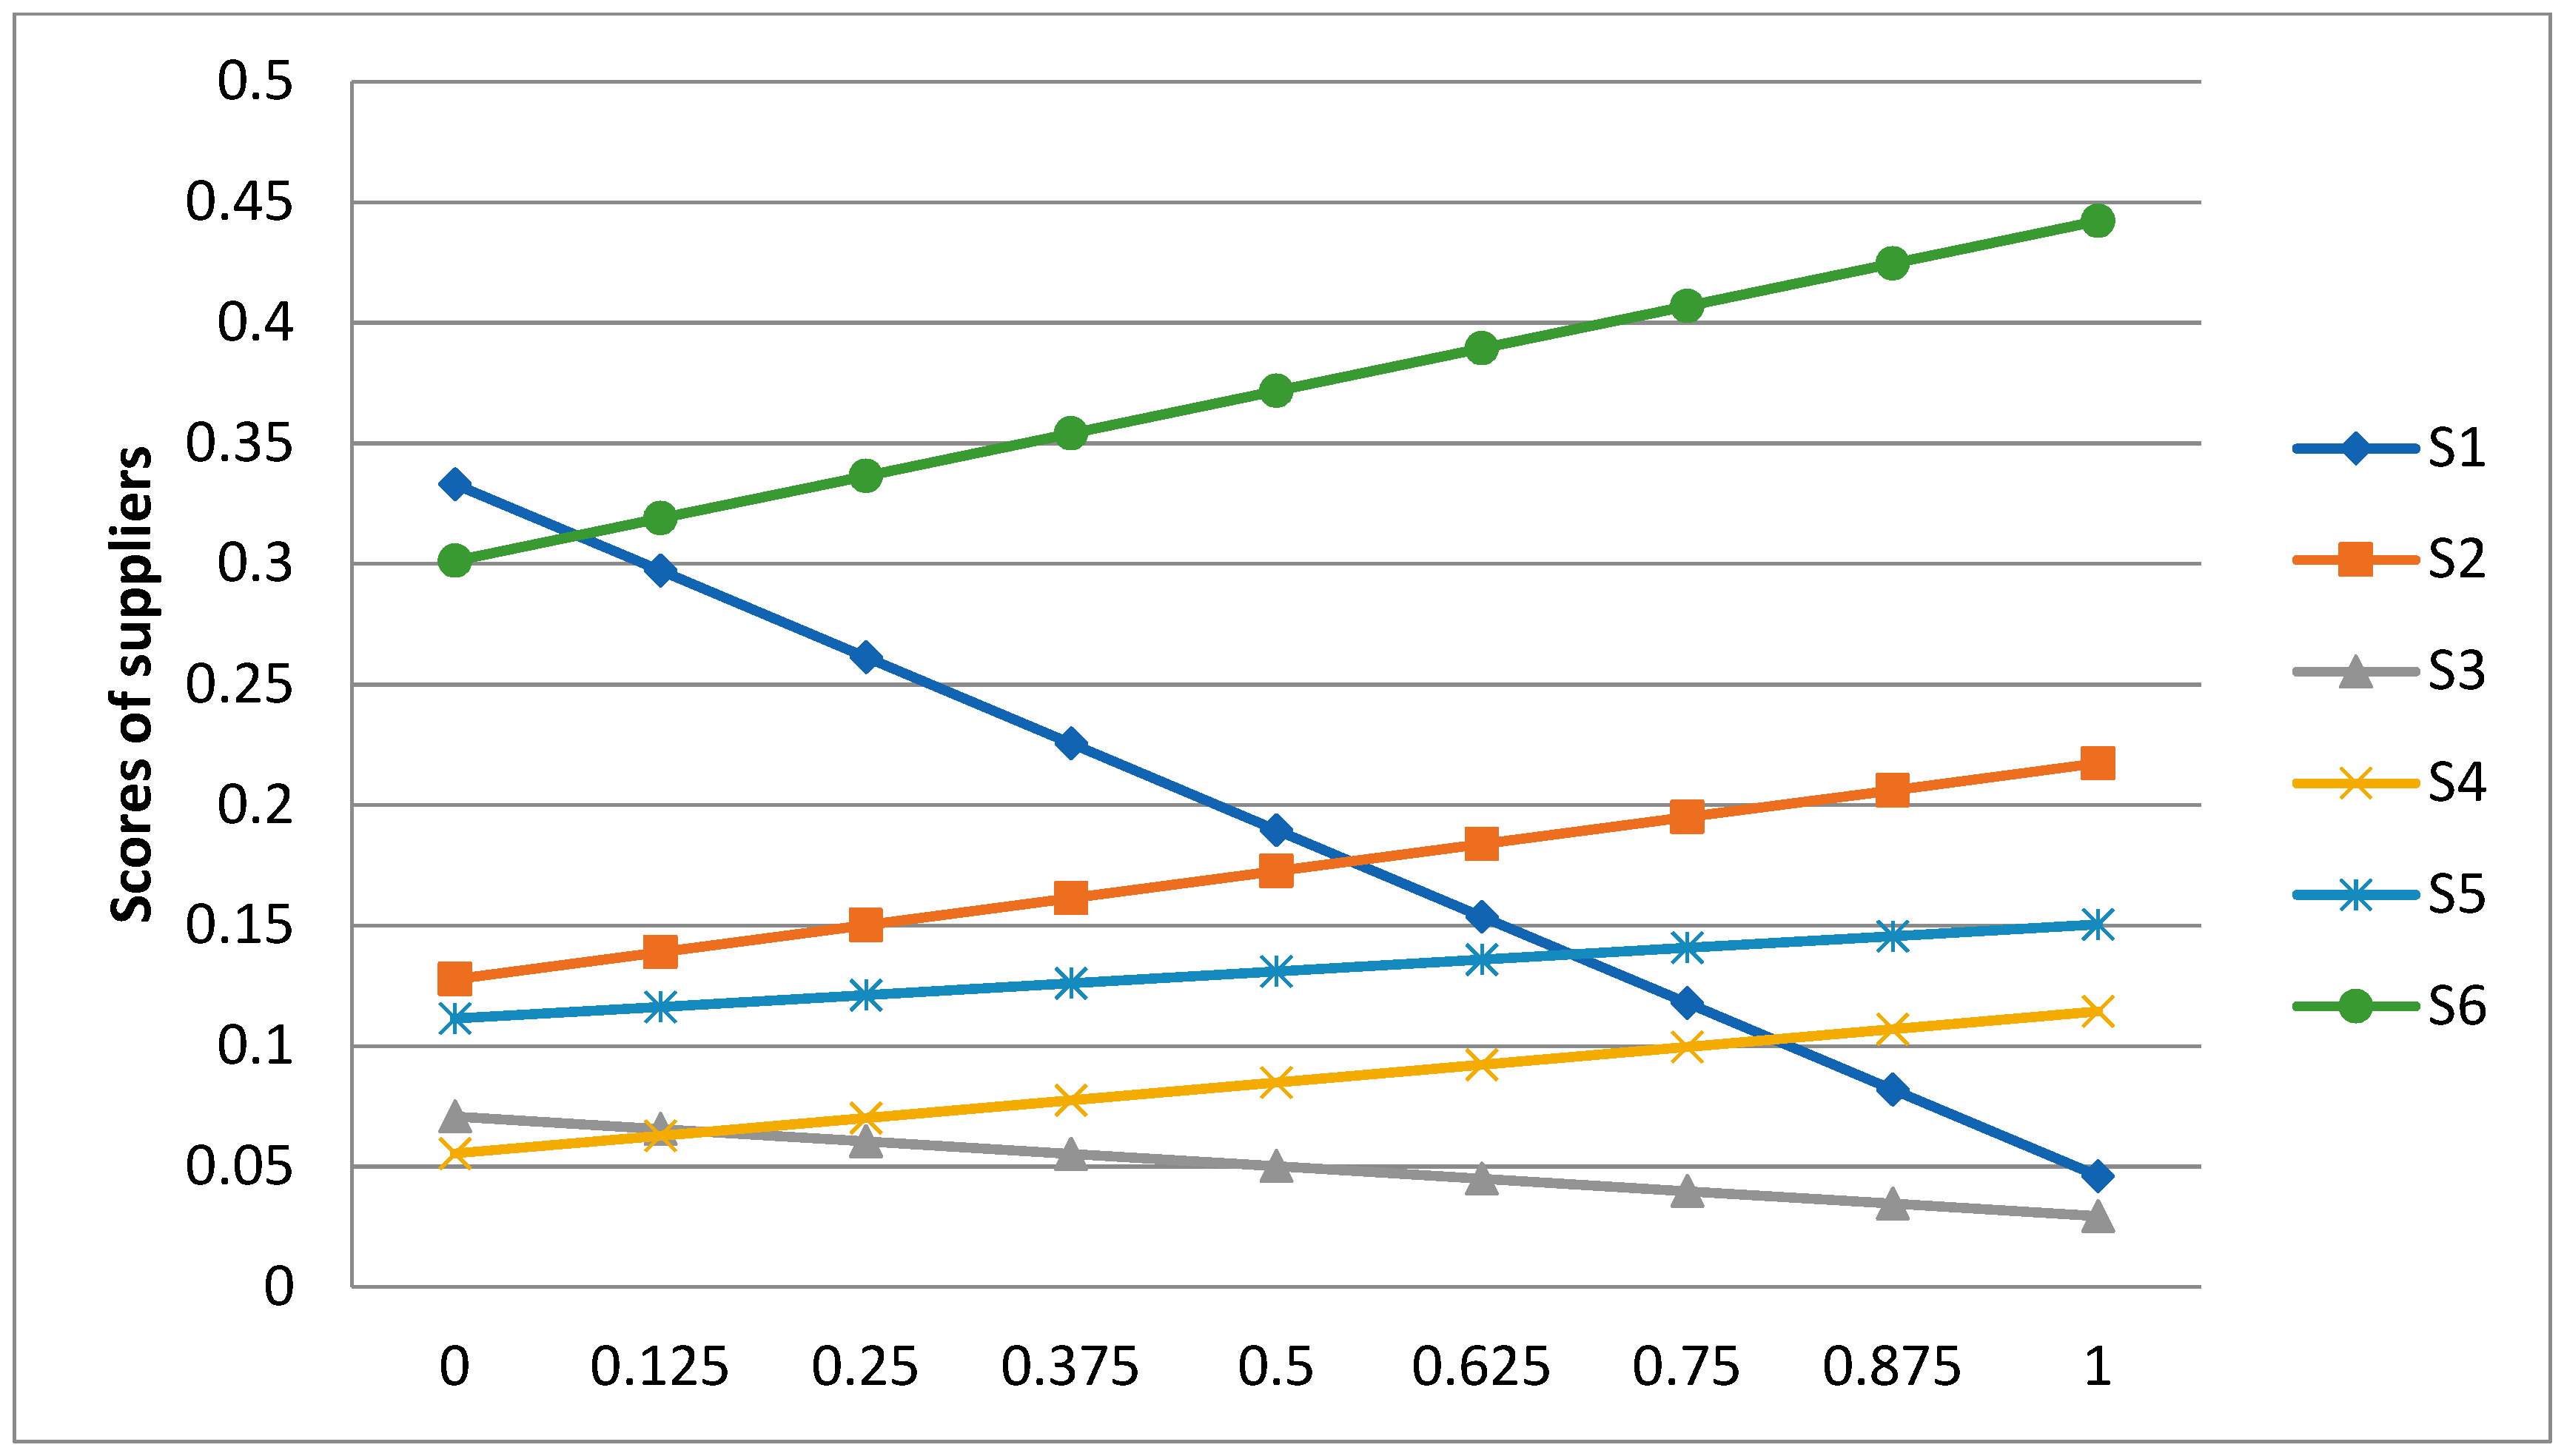
As shown in Figure 2, changes in the weight of price (C2) also alter the ranking of the suppliers in Table 6. When the weight of price (C2) is 0, S1 is the best supplier, followed by S6, S2, S5, S3, and S4. The ranking order is changed to S6, S1, S2, S5, S3, and S4 at a weight of 0.125. As shown in Figure 2, the scores of S1 and S3 decrease continuously, while the other scores increase continuously. When the weight of price (C2) reaches 1, S6 outperforms the other suppliers and is followed by S2, S5, S4, S1, and S3. This result occurs because S6 is the most competitive in price, as indicated in column C2 of Table 5, while S1 is expensive.
This paper presents only two of the results of the managerial analysis with C1 and C2 because of limited space. This managerial analysis indicates that when the weights of the criteria are altered, the ranking of the suppliers in Table 6 is affected. More importantly, this analysis is performed to show the impact of the changes in the weight of each criterion on the ranking and relative performance of the suppliers. The relative performance of the suppliers actually provides more information than the ranking results. This analysis also demonstrates which criteria have more impact on the ranking and relative performance of the suppliers. Overall, notable variations are observed in the ranking of Table 6 when the weights of price (C2), delivery (C3), flexibility (C4), financial capability (C7), and customer service (C8) are changed from 0 to 1. On the other hand, when the weights of quality (C1), technological capability (C5), and trust (C6) are altered from 0 to 1, the relative performance of the suppliers in Table 6 does not significantly change.
4.4. The Second Results of Fuzzy AHP
This section uses another pairwise comparison matrix for the criteria provided by the second expert of PNU Press. The consistency of the pairwise comparisons was checked, and they were all determined to be consistent. Fuzzy AHP computations were performed in the same way as described earlier. The weights of the criteria were calculated by the fuzzy AHP method and are shown in Table 9. Then, the new overall scores for the suppliers can be calculated using Table 5 and Table 9. The new overall scores and ranking are shown in Table 10.
The second expert places more emphasis on quality and the greatest emphasis on price with weights of 0.2780 and 0.4331, respectively, as indicated in Table 9. The sum of the weights for both quality and price amounts to approximately 71%. The weights of the remaining six criteria are only approximately 29%. In fact, the second expert is top management at PNU Press, more specifically, the director, while the first expert is a manager. It is not surprising that the first expert, as a manager, placed an emphasis on quality (C1) and technological capability (C5), and that the second expert, as top management, emphasized price (C2), particularly when PNU Press was in the red.
The ranking of the suppliers by the second expert in Table 10 is slightly different from the ranking shown in Table 6. S6, S1, S2, and S5 remain the first four suppliers, while S4 and S3 change positions in the last two places. More specifically, the overall score of S1 decreases significantly, while that of S3 does not show an appreciable difference. The overall scores of the other four suppliers increase. In addition, S6, which was originally slightly better than S1, outranks all the other suppliers by far.
4.5. The Results for Supplier Development
Table 8 presents the reference set as well as the efficiency for each supplier. The value in brackets in the reference set indicates the weight of each DMU in the reference set used to construct a composite DMU [37,38]. A test DMU under evaluation is inefficient in an output-oriented DEA model if a composite DMU can be identified as a linear combination of DMUs in the reference set with more outputs while keeping the current input levels. Four suppliers, S2, S3, S4, and S5, are inefficient but have potential for improvement that can be calculated by their reference sets. For instance, Supplier 2’s efficiency score of 56.9% shows the extent to which the efficiency of S2 is lacking compared with those of Suppliers 1 and 6 in the reference set.
A composite DMU for Supplier 2 is constructed using a weighted average of the efficient suppliers in the reference set: Supplier 1 (0.151) and Supplier 6 (0.849). For example, the target value of output 1 for Supplier 2 is calculated as the weighted average of the output 1 values for the efficient suppliers in the reference set, that is, 0.333 = 0.151 0.348 + 0.849 0.330. In other words, the target values of the outputs and an input for Supplier 2 are the ones that they should attain from the current values so that Supplier 2 can be efficient as a composite DMU. Table 11 summarizes the current and target values for the eight outputs and one input of all inefficient suppliers.
4.6. Managerial Implications
From the results of both the fuzzy AHP and DEA, it seems that Supplier 1 (S1) and Supplier 6 (S6) are generally the best suppliers for PNU Press. More specifically, S6 is the best, while S1 is the second best supplier in the two results of the fuzzy AHP approach. They are also the only efficient suppliers in the results of the DEA approach.
The performance of S6 can partially be explained by its location in the largest publishing and printing industrial cluster of South Korea. This cluster is near Seoul, the largest city and capital of the country. Although Busan is the second largest city in South Korea, a publishing and printing business in a larger city has its own advantages. A company in a larger city may have better access to a variety of skills in the workforce; more financial options; easier knowledge exchange; a more diverse and larger customer base; and better and larger infrastructure, such as professional organizations and business networks. In fact, it has been only one year since PNU Press started working with S6 in an effort to improve its financial and quality performance by seeking better suppliers, even outside the Busan area. S1 also exhibited good performance. This finding can explain its long, steady, and reliable collaboration with PNU Press. S1 is a relatively small company known for its good quality, but it has high costs. S2, S5, S4, and S3 are outperformed by S6 and S1 in the results of the fuzzy AHP approach and are not recognized as efficient units by DEA.
Management decisions can be different from person to person, from time to time, and from company to company. Price was a top priority for the top management at PNU Press, which had been struggling under the burden of deficits during the past years. A middle manager, who was also in the same situation at PNU Press, placed the largest emphasis on quality. The managerial analysis in this research shows the effect of the changes in the weight of each criterion on the ranking and relative performance of the suppliers. This kind of analysis is important because different decision makers use different weights for the same criteria. Even the same decision maker can place different weights on multiple criteria in different business environments.
The managerial analysis also indicates which criteria have more impact on the ranking and relative performance of the suppliers. The results of this analysis demonstrate that adjusting the weights of price (C2), delivery (C3), flexibility (C4), financial capability (C7), and customer service (C8) significantly changes the ranking and relative performance of the suppliers, while adjusting the weights of quality (C1), technological capability (C5), and trust (C6) does not. This kind of analysis can help decision makers and suppliers concentrate on critical criteria for their efficient business.
Compared with the efficient units, the inefficient suppliers, S2, S5, S4, and S3, have opportunities for further development. Their potential improvement can be calculated using the reference sets and the target values that they should attain to become efficient. Such results can be effectively used by PNU Press for negotiating with its suppliers.
4.7. Discussions from the Perspective of Open Innovation
Supplier management and open innovation can be considered in the same context, because open innovation is the use of external and internal resources to strengthen the innovation capabilities of a company and to improve its innovation performance [39]. More specifically, supplier management is closely related to inbound open innovation, which is the practice of establishing relationships with external individuals or organizations to access their scientific and technical competencies [40].
Open innovation is required not only at big companies, but also at small and medium enterprises [41]. In fact, big firms have more options of creating their own value using the technologies they possess internally [42]. Above all, open innovation aims at reducing the costs and risks of a company. More offensively, open innovation seeks to stimulate the growth of the company. Strategically speaking, companies should drive their business partners to create the most value for the whole network in the long term, rather than focusing on getting the most for themselves [43]. For example, when a buying company obtains benefits from the innovation of a direct supplier, the buying company can share the benefits with the supplier to motivate itself to innovate even further [44].
PNU Press is a small company that can obtain insights from open innovation. It started focusing on supplier management to reduce its costs, but may have to pursue constructing a stable and mutually beneficial supply chain network to stimulate its growth in the long term.
5. Conclusions
Supplier selection and development represent very important decisions for publishing companies, as they do for many other companies in a variety of industries. For the publisher considered in this research, approximately 40 to 45% of the total annual costs were the printing costs from the printing companies that were its suppliers. This paper presents a new framework based on fuzzy set theory, AHP, DEA, and a managerial analysis for supplier selection and supplier development in the publishing and printing industries. Fuzzy AHP is adopted to address the subjectivity and ambiguity of experts’ judgments and to rank the suppliers of the publishing company by several criteria. DEA also measures the relative efficiency of suppliers for the publishing company. A managerial analysis is proposed to check the impact of important criteria on supplier selection in more detail. The DEA results are provided for supplier development.
Supplier 1 (S1) and Supplier 6 (S6) are the best suppliers for the PNU Press. S6 is the best supplier, and S1 is the second best supplier in the Fuzzy AHP results. Both suppliers are also the only efficient suppliers in the DEA results. The remaining four suppliers lag behind S6 and S1 in the results of both Fuzzy AHP and DEA.
The managerial analysis proposed in this research can be very effective for the management decisions of different decision makers in a variety of situations. The same analysis can also show which criteria have more impact on the ranking and relative performance of the suppliers to help suppliers and decision makers. The four inefficient suppliers also have opportunities for further development. Their potential improvement can be calculated using the DEA results. PNU Press can use the DEA results for negotiating with its inefficient suppliers. The framework proposed in this paper can provide insight into supplier selection and development problems in the publishing and printing industries. The framework of this research may be applied to the same supplier selection and development problems in other industries.
DEA can be sensitive to outliers and suffer from the curse of dimensionality [45]. The curse of dimensionality has been tackled by several strategies such as variable reduction or feature selection [46,47,48,49]. Further research may be needed to identify potential outliers and to perform variable reduction or feature selection.
Author Contributions
M.D. drafted the manuscript. C.K. revised the draft and prepared the final manuscript.
Funding
This research received no external funding.
Conflicts of Interest
The authors declare no conflict of interest.
References
- Rothenberg, S.; Cost, F. Lean Manufacturing in Small- and Medium-Sized Printers; Printing Industry Center at RIT: Rochester, NY, USA, 2004. [Google Scholar]
- Romano, F.; Broudy, D. An Investigation into Printing Industry Demographics-2009; Printing Industry Center at RIT: Rochester, NY, USA, 2010. [Google Scholar]
- Cost, F.; Daly, B. Digital Integration and the Lean Manufacturing Practices of U.S. Printing Firms; Printing Industry Center at RIT: Rochester, NY, USA, 2003. [Google Scholar]
- Sodenkamp, M.A.; Tavana, M.; Caprio, D.D. Modeling synergies in multi-criteria supplier selection and order allocation: An application to commodity trading. Eur. J. Oper. Res. 2016, 254, 859–874. [Google Scholar] [CrossRef]
- Pitchipoo, P.; Venkumar, P.; Rajakarunakaran, S. Fuzzy hybrid decision model for supplier evaluation and selection. Int. J. Prod. Res. 2013, 51, 3903–3919. [Google Scholar] [CrossRef]
- Leppelt, T.; Foerstl, K.; Reuter, C.; Hartmann, E. Sustainability management beyond organizational boundaries–sustainable supplier relationship management in the chemical industry. J. Clean. Prod. 2013, 56, 94–102. [Google Scholar] [CrossRef]
- Parthiban, P.; Zubar, H.A.; Katakar, P. Vendor selection problem: A multi-criteria approach based on strategic decisions. Int. J. Prod. Res. 2013, 51, 1535–1548. [Google Scholar] [CrossRef]
- Dubey, R.; Gunasekaran, A.; Ali, S.S. Exploring the relationship between leadership, operational practices, institutional pressures and environmental performance: A framework for green supply chain. Int. J. Prod. Econ. 2015, 160, 120–132. [Google Scholar] [CrossRef]
- Osiro, L.; Lima-Junior, F.R.; Carpinetti, L.C.R. A fuzzy logic approach to supplier evaluation for development. Int. J. Prod. Econ. 2014, 153, 95–112. [Google Scholar] [CrossRef]
- Lima-Junior, F.R.; Carpinetti, L.C.R. Combining SCOR® model and fuzzy TOPSIS for supplier evaluation and management. Int. J. Prod. Econ. 2016, 174, 128–141. [Google Scholar] [CrossRef]
- Falsini, D.; Fondi, F.; Schiraldi, M.M. A logistics provider evaluation and selection methodology based on AHP, DEA and linear programming integration. Int. J. Prod. Res. 2012, 50, 4822–4829. [Google Scholar] [CrossRef] [Green Version]
- Parthiban, P.; Zubar, H.A. An integrated multi-objective decision making process for the performance evaluation of the vendors. Int. J. Prod. Res. 2013, 51, 3836–3848. [Google Scholar] [CrossRef]
- Rezaei, J. A two-way approach to supply chain partner selection. Int. J. Prod. Res. 2015, 53, 4888–4902. [Google Scholar] [CrossRef]
- Taylor, B.W. Introduction to Management Science, 11th ed.; Pearson Education: London, UK, 2013. [Google Scholar]
- Yayla, A.Y.; Oztekin, A.; Gumus, A.T.; Gunasekaran, A. A hybrid data analytic methodology for 3PL transportation provider evaluation using fuzzy multi-criteria decision making. Int. J. Prod. Res. 2015, 53, 6097–6113. [Google Scholar] [CrossRef]
- Aksoy, A.; Öztürk, N. Supplier selection and performance evaluation in just-in-time production environments. Expert Syst. Appl. 2011, 38, 6351–6359. [Google Scholar] [CrossRef]
- Omurca, S.I. An intelligent supplier evaluation, selection and development system. Appl. Soft Comput. 2013, 13, 690–697. [Google Scholar] [CrossRef]
- Samvedi, A.; Jain, V.; Chan, F.T.S. An integrated approach for machine tool selection using fuzzy analytical hierarchy process and grey relational analysis. Int. J. Prod. Res. 2012, 50, 3211–3221. [Google Scholar] [CrossRef]
- Kahraman, C.; Öztayşi, B.; Sarı, İ.U.; Turanoğlu, E. Fuzzy analytic hierarchy process with interval type-2 fuzzy sets. Knowl. Based Syst. 2014, 59, 48–57. [Google Scholar] [CrossRef]
- Kilic, H.S.; Zaim, S.; Delen, D. Development of a hybrid methodology for ERP system selection: The case of Turkish Airlines. Decis. Support Syst. 2014, 66, 82–92. [Google Scholar] [CrossRef]
- Ayhan, M.B.; Kilic, H.S. A two stage approach for supplier selection problem in multi-item/multi-supplier environment with quantity discounts. Comput. Ind. Eng. 2015, 85, 1–12. [Google Scholar] [CrossRef]
- Chan, F.T.S.; Kumar, N.; Tiwari, M.K.; Lau, H.C.W.; Choy, K.L. Global supplier selection: A fuzzy-AHP approach. Int. J. Prod. Res. 2008, 46, 3825–3857. [Google Scholar] [CrossRef]
- Cho, I.J.; Kim, Y.J.; Kwak, C.J. Application of SERVQUAL and fuzzy quality function deployment to service improvement in service centres of electronics companies. Total Qual. Manag. Bus. Excell. 2016, 27, 368–381. [Google Scholar] [CrossRef]
- Chou, S.W.; Chang, Y.C. The implementation factors that influence the ERP (enterprise resource planning) benefits. Decis. Support Syst. 2008, 46, 149–157. [Google Scholar] [CrossRef]
- Weber, C.A. A data envelopment analysis approach to measuring vendor performance. Suppl. Chain Manag. Int. J. 1996, 1, 28–39. [Google Scholar] [CrossRef]
- Kumar, A.; Shankar, R.; Debnath, R.M. Analyzing customer preference and measuring relative efficiency in telecom sector: A hybrid fuzzy AHP/DEA study. Telemat. Inform. 2015, 32, 447–462. [Google Scholar] [CrossRef]
- Hwang, B.Y.; Jun, H.J.; Chang, M.H.; Kim, D.C. Efficiency Analysis of the Royalty System from the Perspective of Open Innovation. J. Open Innov. Technol. Mark. Complex. 2018, 4, 22. [Google Scholar] [CrossRef]
- Lovell, C.A.K.; Pastor, J.T. Radial DEA models without inputs or without outputs. Eur. J. Oper Res. 1999, 118, 46–51. [Google Scholar] [CrossRef]
- Ko, K.; Kim, D.C. Analyses of Regional Retail Shops’ Efficiency Differences and Efficiency Factors. Product. Rev. 2016, 30, 75–101. [Google Scholar]
- Chang, M.; Jang, H.B.; Li, Y.M.; Kim, D.C. The Relationship between the Efficiency, Service Quality and Customer Satisfaction for State-Owned Commercial Banks in China. Sustainability 2017, 9, 2163. [Google Scholar] [CrossRef]
- Ko, K.; Chang, M.; Bae, E.S.; Kim, D.C. Efficiency Analysis of Retail Chain Stores in Korea. Sustainability 2017, 9, 1629. [Google Scholar] [CrossRef]
- Arikan, F. A fuzzy solution approach for multi objective supplier selection. Expert Syst. Appl. 2013, 40, 947–952. [Google Scholar] [CrossRef]
- Rajesh, R.; Ravi, V. Supplier selection in resilient supply chains: A grey relational analysis approach. J. Clean. Prod. 2015, 86, 343–359. [Google Scholar] [CrossRef]
- Abdollahi, M.; Arvan, M.; Razmi, J. An integrated approach for supplier portfolio selection: Lean or agile? Expert Syst. Appl. 2015, 42, 679–690. [Google Scholar] [CrossRef]
- Riddalls, C.E.; Icasati-Johanson, B.; Axtell, C.M.; Bennett, S.; Clegg, C. Quantifying the Effects of Trust in Supply Chains during Promotional Periods. Int. J. Logist. Res. Appl. 2002, 5, 257–274. [Google Scholar] [CrossRef]
- Pani, A.K.; Kar, A.K. A study to compare relative importance of criteria for supplier evaluation in e-procurement. In Proceedings of the 44th Hawaii International Conference on System Sciences, Kauai, HI, USA, 4–7 January 2011; pp. 1–8. [Google Scholar]
- Talluri, S.; Sarkis, J. A Model for Performance Monitoring of Suppliers. Int. J. Prod. Res. 2002, 40, 4257–4269. [Google Scholar] [CrossRef]
- Cook, W.D.; Zhu, J. Data Envelopment Analysis: Balanced Benchmarking; CreateSpace Independent Publishing Platform: Seattle, WA, USA, 2013. [Google Scholar]
- Yun, J.J.; Jeong, E.; Lee, Y.; Kim, K. The Effect of Open Innovation on Technology Value and Technology Transfer: A Comparative Analysis of the Automotive, Robotics, and Aviation Industries of Korea. Sustainability 2018, 10, 2459. [Google Scholar] [CrossRef]
- Yun, J.J.; Park, K.; Kim, J.; Yang, J. Open Innovation Effort, Entrepreneurship Orientation and their Synergies onto Innovation Performance in SMEs of Korea. Sci. Technol. Soc. 2016, 21, 366–390. [Google Scholar] [CrossRef]
- Yun, J.J.; Won, D.; Park, K. Dynamics from open innovation to evolutionary change. J. Open Innov. Technol. Mark. Complex. 2016, 2, 7. [Google Scholar] [CrossRef]
- Yun, J.J. How do we conquer the growth limits of capitalism? Schumpeterian Dynamics of Open Innovation. J. Open Innov. Technol. Mark. Complex. 2015, 1, 17. [Google Scholar] [CrossRef]
- Tani, M.; Papaluca, O.; Sasso, P. The System Thinking Perspective in the Open-Innovation Research: A Systematic Review. J. Open Innov. Technol. Mark. Complex. 2018, 4, 38. [Google Scholar] [CrossRef]
- Yun, J.J.; Yigitcanlar, T. Open Innovation in Value Chain for Sustainability of Firms. Sustainability 2017, 9, 811. [Google Scholar] [CrossRef]
- Carvalho, P.; Marques, R.C. Computing economies of vertical integration, economies of scope and economies of scale using partial frontier nonparametric methods. Eur. J. Oper. Res. 2014, 234, 292–307. [Google Scholar] [CrossRef]
- Kwak, C.; Yih, Y. Data mining approach to production control in the computer integrated testing cell. IEEE Trans. Robot. Autom. 2004, 20, 107–116. [Google Scholar] [CrossRef]
- Kwak, C. Architecture of a Dynamic Production Controller in CIM Enterprise Environments. Int. J. Prod. Res. 2010, 48, 167–182. [Google Scholar] [CrossRef]
- Kwak, C.; Park, E.; Kim, C.O. Situation Dependent Decision Selector for Production Control in Testing and Rework Cell. Int. J. Prod. Res. 2011, 49, 4505–4516. [Google Scholar] [CrossRef]
- Limleamthong, P.; Guillén-Gosálbez, G. Mixed-Integer Programming Approach for Dimensionality Reduction in Data Envelopment Analysis: Application to the Sustainability Assessment of Technologies and Solvents. Ind. Eng. Chem. Res. 2018, 57, 9866–9878. [Google Scholar] [CrossRef]
Figure 1.
Managerial analysis for Quality (C1).

Figure 2.
Managerial analysis for Price (C2).


Table 1.
Preference value scale and corresponding fuzzy numbers.
| Preference Value | Numeric Value | Fuzzy Numbers |
|---|---|---|
| Equally preferred | 1 | (1, 1, 1) |
| Moderately preferred | 3 | (2, 3, 4) |
| Strongly preferred | 5 | (4, 5, 6) |
| Very strongly preferred | 7 | (6, 7, 8) |
| Extremely preferred | 9 | (9, 9, 9) |
Table 2.
Pairwise comparison matrix of the criteria.
| Criteria | C1 | C2 | C3 | C4 | C5 | C6 | C7 | C8 |
|---|---|---|---|---|---|---|---|---|
| Quality (C1) | 1 | 5 | 7 | 5 | 1 | 1 | 3 | 3 |
| Price (C2) | 1/5 | 1 | 3 | 3 | 1/3 | 1/3 | 1/3 | 1 |
| Delivery (C3) | 1/7 | 1/3 | 1 | 3 | 1/5 | 1 | 1 | 1 |
| Flexibility (C4) | 1/5 | 1/3 | 1/3 | 1 | 1/5 | 1/3 | 1/3 | 1 |
| Tech. Cap. (C5) | 1 | 3 | 5 | 5 | 1 | 1 | 3 | 3 |
| Trust (C6) | 1 | 3 | 1 | 3 | 1 | 1 | 3 | 3 |
| Fin. Cap. (C7) | 1/3 | 3 | 1 | 3 | 1/3 | 1/3 | 1 | 3 |
| Cust. Ser. (C8) | 1/3 | 1 | 1 | 1 | 1/3 | 1/3 | 1/3 | 1 |
Table 3.
Pairwise comparison matrix of the suppliers for Quality (C1).
| Quality (C1) | S1 | S2 | S3 | S4 | S5 | S6 |
|---|---|---|---|---|---|---|
| Supplier 1 (S1) | 1 | 3 | 7 | 7 | 5 | 1 |
| Supplier 2 (S2) | 1/3 | 1 | 5 | 5 | 1 | 1/3 |
| Supplier 3 (S3) | 1/7 | 1/5 | 1 | 1 | 1/3 | 1/5 |
| Supplier 4 (S4) | 1/7 | 1/5 | 1 | 1 | 1/3 | 1/7 |
| Supplier 5 (S5) | 1/5 | 1 | 3 | 3 | 1 | 1/5 |
| Supplier 6 (S6) | 1 | 3 | 5 | 7 | 5 | 1 |
Table 4.
Normalized weights of the criteria.
| Criteria | C1 | C2 | C3 | C4 | C5 | C6 | C7 | C8 |
|---|---|---|---|---|---|---|---|---|
| Weights | 0.2524 | 0.0748 | 0.0652 | 0.0410 | 0.2274 | 0.1739 | 0.1047 | 0.0603 |
Table 5.
Normalized scores of the suppliers with regard to the criteria.
| Criteria | C1 | C2 | C3 | C4 | C5 | C6 | C7 | C8 | |
|---|---|---|---|---|---|---|---|---|---|
| Suppliers | |||||||||
| Supplier 1 | 0.3484 | 0.0461 | 0.3091 | 0.3562 | 0.3261 | 0.4206 | 0.1464 | 0.3786 | |
| Supplier 2 | 0.1415 | 0.2173 | 0.0565 | 0.0463 | 0.1479 | 0.1117 | 0.1764 | 0.0881 | |
| Supplier 3 | 0.0418 | 0.0294 | 0.2791 | 0.2503 | 0.0390 | 0.0501 | 0.0367 | 0.0823 | |
| Supplier 4 | 0.0394 | 0.1143 | 0.0565 | 0.0801 | 0.0355 | 0.0590 | 0.0367 | 0.2019 | |
| Supplier 5 | 0.0989 | 0.1504 | 0.2363 | 0.1334 | 0.1065 | 0.0864 | 0.1240 | 0.0823 | |
| Supplier 6 | 0.3296 | 0.4422 | 0.0621 | 0.1334 | 0.3447 | 0.2720 | 0.4796 | 0.1666 | |
| Total | 1 | 1 | 1 | 1 | 1 | 1 | 1 | 1 | |
Table 6.
Overall scores and ranking of the suppliers by the fuzzy analytical hierarchy process (AHP) approach.
Table 6.
Overall scores and ranking of the suppliers by the fuzzy analytical hierarchy process (AHP) approach.
| Suppliers | Scores | Ranking |
|---|---|---|
| Supplier 6 | 0.3118 | 1 |
| Supplier 1 | 0.3117 | 2 |
| Supplier 2 | 0.1344 | 3 |
| Supplier 5 | 0.1143 | 4 |
| Supplier 3 | 0.0676 | 5 |
| Supplier 4 | 0.0598 | 6 |
Table 7.
Data for the data envelopment analysis (DEA) problem.
| DMU | OUTPUTS | INPUT | |||||||
|---|---|---|---|---|---|---|---|---|---|
| 1 | 2 | 3 | 4 | 5 | 6 | 7 | 8 | 1 | |
| Supplier 1 | 0.348 | 0.046 | 0.309 | 0.356 | 0.326 | 0.421 | 0.146 | 0.379 | 1 |
| Supplier 2 | 0.142 | 0.217 | 0.057 | 0.046 | 0.148 | 0.112 | 0.176 | 0.088 | 1 |
| Supplier 3 | 0.042 | 0.029 | 0.279 | 0.250 | 0.039 | 0.05 | 0.037 | 0.082 | 1 |
| Supplier 4 | 0.039 | 0.114 | 0.057 | 0.080 | 0.036 | 0.059 | 0.037 | 0.202 | 1 |
| Supplier 5 | 0.099 | 0.150 | 0.236 | 0.133 | 0.107 | 0.086 | 0.124 | 0.082 | 1 |
| Supplier 6 | 0.33 | 0.442 | 0.062 | 0.133 | 0.345 | 0.272 | 0.48 | 0.167 | 1 |
Table 8.
DEA solution. DMU—decision-making unit.
| DMU | Objective Value | Efficient | Reference Set |
|---|---|---|---|
| Supplier 1 | 1 | Yes | - |
| Supplier 2 | 0.569 | No | S1(0.151); S6(0.849) |
| Supplier 3 | 0.903 | No | S1(1) |
| Supplier 4 | 0.652 | No | S1(0.674); S6(0.326) |
| Supplier 5 | 0.977 | No | S1(0.728); S6(0.272) |
| Supplier 6 | 1 | Yes | - |
Table 9.
Normalized weights of the criteria by second expert’s judgment.
| Criteria | C1 | C2 | C3 | C4 | C5 | C6 | C7 | C8 |
|---|---|---|---|---|---|---|---|---|
| Weights | 0.2780 | 0.4331 | 0.0580 | 0.0445 | 0.0756 | 0.0571 | 0.0232 | 0.0302 |
Table 10.
Overall fuzzy AHP scores of the suppliers by second expert’s judgment.
| Suppliers | Scores | Ranking |
|---|---|---|
| Supplier 6 | 0.3505 | 1 |
| Supplier 1 | 0.2142 | 2 |
| Supplier 2 | 0.1631 | 3 |
| Supplier 5 | 0.1307 | 4 |
| Supplier 4 | 0.0804 | 5 |
| Supplier 3 | 0.0609 | 6 |
Table 11.
Computation of the target values for inefficient suppliers.
| Suppliers | |||||
|---|---|---|---|---|---|
| 2 | 3 | 4 | 5 | ||
| Input | Current | 1 | 1 | 1 | 1 |
| Target | 1 | 1 | 1 | 1 | |
| Output 1 | Current | 0.142 | 0.042 | 0.039 | 0.099 |
| Target | 0.3327 | 0.348 | 0.3421 | 0.3431 | |
| Output 2 | Current | 0.217 | 0.029 | 0.114 | 0.15 |
| Target | 0.3822 | 0.046 | 0.175 | 0.1537 | |
| Output 3 | Current | 0.057 | 0.279 | 0.057 | 0.236 |
| Target | 0.0992 | 0.309 | 0.2284 | 0.2418 | |
| Output 4 | Current | 0.046 | 0.25 | 0.08 | 0.133 |
| Target | 0.1666 | 0.356 | 0.2833 | 0.2953 | |
| Output 5 | Current | 0.148 | 0.039 | 0.036 | 0.107 |
| Target | 0.3421 | 0.326 | 0.3321 | 0.3311 | |
| Output 6 | Current | 0.112 | 0.05 | 0.059 | 0.086 |
| Target | 0.2944 | 0.421 | 0.3724 | 0.3804 | |
| Output 7 | Current | 0.176 | 0.037 | 0.037 | 0.124 |
| Target | 0.4295 | 0.146 | 0.2548 | 0.2368 | |
| Output 8 | Current | 0.088 | 0.082 | 0.202 | 0.082 |
| Target | 0.199 | 0.379 | 0.3098 | 0.3213 | |
© 2018 by the authors. Licensee MDPI, Basel, Switzerland. This article is an open access article distributed under the terms and conditions of the Creative Commons Attribution (CC BY) license (http://creativecommons.org/licenses/by/4.0/).
Share and Cite
MDPI and ACS Style
Diouf, M.; Kwak, C. Fuzzy AHP, DEA, and Managerial Analysis for Supplier Selection and Development; From the Perspective of Open Innovation. Sustainability 2018, 10, 3779. https://doi.org/10.3390/su10103779
AMA Style
Diouf M, Kwak C. Fuzzy AHP, DEA, and Managerial Analysis for Supplier Selection and Development; From the Perspective of Open Innovation. Sustainability. 2018; 10(10):3779. https://doi.org/10.3390/su10103779
Chicago/Turabian StyleDiouf, Maimouna, and Choonjong Kwak. 2018. "Fuzzy AHP, DEA, and Managerial Analysis for Supplier Selection and Development; From the Perspective of Open Innovation" Sustainability 10, no. 10: 3779. https://doi.org/10.3390/su10103779
Note that from the first issue of 2016, this journal uses article numbers instead of page numbers. See further details here.