1. Introduction
Owing to scarcity of land and natural assets in Singapore, more than 95% of resources necessary for electricity generation [
1] and over 90% of food [
2] consumed in the country are imported. The Singapore government aims to reduce the dependency on imports for vital and strategic products such as food and energy [
1,
2], but its options are limited. Additionally, as a part of the 2015 Paris Agreement, Singapore has committed to reducing greenhouse gases (GHG) emissions to 36% of their 2005 level by 2030 [
3].
With a land area of just 7199 km
2 accommodating a population of 5,638,700 [
4], Singapore is the third most densely populated country in the world [
5], with 7796 inhabitants per km
2 [
4]. The total population is expected to increase to approximately 6.5 million by 2030 [
6,
7]. On the other hand, the proportion of residents aged 65 years or above against the population aged 20–64 years has increased from 13% to 19.7% in the last decade [
8]. The aging of the population is expected to further increase in the coming two decades according to the current age pyramid of resident population with the largest number of residents being aged between 40 and 60 [
6,
9]. Regarding the residential building stock, of the total 1.29 million dwellings, 94.6% are apartments in multi-story buildings and 79% comprise public housing developed by the Housing and Development Board (HDB). Landed properties comprise only 5.2% [
10].
Particular conditions related to population density and structure and scarcity of land and natural resources in Singapore require innovative solutions for reducing its dependency on energy and food imports and decrease of GHG emissions and the overall per capita carbon footprint. Apart from its work-force, Singapore’s two main resources are year-round solar irradiation and the manmade built environment. The limited marine area around Singapore archipelago and its current use for fishing and port activities reduce its potential use as a source of solar and wind energy, the latter being not feasible due to average low wind speeds between two and three m/s [
11]. While the government, agencies, and communities in Singapore are responding to the abovementioned challenges by promoting research into and the development of solar energy technologies, advanced farming systems, and community farming, such steps are still insufficient.
Singapore has an annual solar irradiance of 1580 kWh/m
2 [
12], hence investing in photovoltaic (PV) electricity generation is not only the most practical, but a highly promising solution. At the end of 2017, PV installed capacity in Singapore, mostly rooftop-based, reached 143 MWp [
13]. This, however, accounts for only 1% of the total installed power generation capacity in Singapore and even less than 1% of the total electricity generation [
1]. Reliance on rooftop PV installations alone is not sufficient to noticeably reduce the dependency on natural gas. Large façade areas of residential buildings may be affected to a larger extent by urban compactness [
14] and solar irradiation on vertical surfaces is indeed much lower than on horizontal surfaces (approximately 51.5% (East) up to 35.7% (South orientation)) [
15]; however, with the total available surface for rooftop installations being limited [
16], façade PV integrations should be exploited as a means of electricity generation from renewable energy sources [
17] and may significantly contribute to the PV integration potential of the cityscape [
18,
19,
20].
According to the annual report on renewables of the International Energy Agency (IEA) [
21], PVs comprise the largest annual capacity additions for renewables, well above wind and hydropower energy sources. It is expected that solar and wind energy sources will represent more than 80% of the global renewable capacity growth between 2017 and 2022. Such favorable conditions will contribute to 25% reduction of the average PV module cost between 2015 and 2020 [
22]. Therefore, the application of building-integrated photovoltaics (BIPV) is a feasible solution, especially when BIPV devices substitute conventional building materials and elements such as shading devices. Several studies examined the feasibility and benefits of BIPV panels as shading devices. The study performed in Hong Kong by Zhang et al. [
23] determined that the energy saving potential of PV shading devices is significantly larger than that of the conventional interior blinds in terms of electricity used for achieving thermal and visual comfort. For the Mediterranean region, Mandalaki et al. [
24] and Stamatakis et al. [
25] compared a series of BIPV designs acting as shading devices. Multiple criteria decision-making (MCDM) methods were applied to select the preferable designs in terms of visual comfort and energy yield as well as other factors such as aesthetics and outdoor views by applying. A simulation of a dynamic BIPV-shading system for different orientations was performed in Zurich and tested by Jayathissa et al. [
26] on a real façade considering multiple façade criteria functions in addition to the energy yield. Regarding the applicability of BIPV systems in Singapore, Luther, and Reindl [
27] made an estimation of the potential PV area to be installed on Singapore’s building façades resulting in a potential energy yield equivalent to 4 km
2 of roof-top PV panels facing the sun with an optimum angle. On a building scale, Wittkopf et al. [
28] reported on the design development and implementation process of BIPV systems, including shading devices, at the Building Construction Authority (BCA) Academy. Saber et al. [
29] studied the PV performance and energy yield of the same building, the first zero-energy building in Singapore, through data-collection and simulations and concluded that the most effective tilt angle for shading BIPV panels in terms of electricity generation potential is 30°. The study of Ong and Tablada [
30] on residential buildings in Singapore under various sky-view factor conditions obtained multiple optimal shading BIPV designs considering other environmental and performance parameters such as thermal and visual comfort in addition to electricity generation. The most important advances regarding food production in Singapore refer to the application of rooftop and vertical farming technologies both indoors and outside. This is a logical response to the limitations of traditional cultivation methods, which require large areas that pointedly counter the gradually shrinking farming areas in Singapore. Industrialized vertical farming is currently expanding in Singapore. The first commercial tropical vegetable urban vertical farm, Sky Greens, was established in 2012 and uses a method called “A-Go-Gro Vertical Farming”, which enables the production of one ton of fresh vegetables every two days [
31]. Vertical farming high-tech systems including hydroponics, aeroponics and aquaponics are reshaping the traditional approaches to farming and food production by offering efficient and sustainable methods for city farming that minimize maintenance and maximize yield [
32]. Other initiatives developed by the HDB and local communities have focused on using the rooftops of multi-storey carparks and green areas around HDB buildings for installing raised beds for vegetable cultivation. In a study on the potential use of rooftops for vegetable cultivation, Lim and Kishnani [
33] determined that the rooftop surface of the existing residential buildings may be sufficient to satisfy approximately 35% of vegetable demand in Singapore. A design prototype of an apartment tower with farming areas on elevated terraces and balconies was proposed by Surbana Jurong Consultants for Singapore. Bay et al. [
34] reported the design challenges of the integration of farming areas in high-rise buildings, especially the sunlight availability under potential overshadowing in high density urban areas, which require considering the location and type of crops. The study of Tablada and Zhao [
19], focusing on the use of building façades and open areas of residential precincts with different urban densities, determined that all façade orientations in Singapore receive sufficient sunlight for vegetable cultivation. The potential vegetable production could be as high as 50% and 75% for plot ratios of 2.7 and 2.2, respectively, according to the most recent building typology. Song et al. [
35] examined the photosynthetically active radiation (PAR) along exposed corridors of HDB residential apartment blocks and determined that, if the façade experienced a minimum of half-day direct insolation, the vegetables requiring moderate to high-light would sufficient light. The application of farming systems on building façades from the construction point of view was reported by Suparwoko and Taufani [
36]. However, no other studies addressed the façade arrangement and the potential yield.
The integration of both solar and farming systems on building façades was investigated by Tablada and Zhao [
19] and Tablada et al. [
37,
38,
39] at both urban and façade scales, respectively. Apart from these preliminary studies, no other studies have addressed the combining BIPV, as shading devices and building-integrated agriculture (BIA) on the building façades. Therefore, the purpose of this study was to design and analyse possible solutions for simultaneous food and energy production on vertical façades of residential buildings by means of productive façade (PF) systems that include both BIPV and BIA systems, with a view to reducing the dependency on food and energy imports and considering the social, economic, and environmental benefits of BIPV panels [
40,
41,
42,
43,
44,
45,
46] and urban farming [
47,
48,
49,
50,
51]. The paper presents the design optimisation framework applied in the development and optimization of modular PF prototypes and provides clear systematic guidelines through the iterative integrative design process leading to optimal PF solutions for residential buildings in Singapore. These solutions produce both food and electricity and act as passive devices for reduction of solar heat gains, and improve visual and thermal comfort. PFs also contribute to positive changes in the urban environment strengthening biophilia, increasing the awareness of the need for GHG emissions reduction, and positively influencing the well-being of residents while enabling them to grow food in dense urban environments by themselves. Greening systems are a key element of the living architecture, whereas green façade technologies enable a wide range of options allowing designers to accomplish multiple objectives such as aesthetic value [
52], cooling effects [
53], and overall environmental benefits [
54]. The developed PF prototypes rely on these characteristics to create synergies with good ergonomics and user-centered design, thereby providing high-quality, sustainable, and affordable architectural solutions. A total of 2135 design variants were created and analyzed, modified, and assessed in order to obtain optimal design solutions. Grasshopper parametric simulation tool with necessary plug-ins [
55] was used to calculate relevant environmental performance criteria for the analyzed PF design variants.
VIKOR method [
56,
57], developed for solving MCDM problems involving conflicting and non-commensurable criteria, was applied to determine eight (8) optimal PF design variants corresponding to two façade categories—Window façade (WF) and balcony façade (BF)—for 4 orientations (South, North, West, East). Eight (8) PF prototypes will be installed, monitored, and tested at the Tropical Technologies Laboratory (T
2 Lab) located in a fairly open space at the precinct of the staff residences of the National University of Singapore (NUS).
2. Materials and Methods
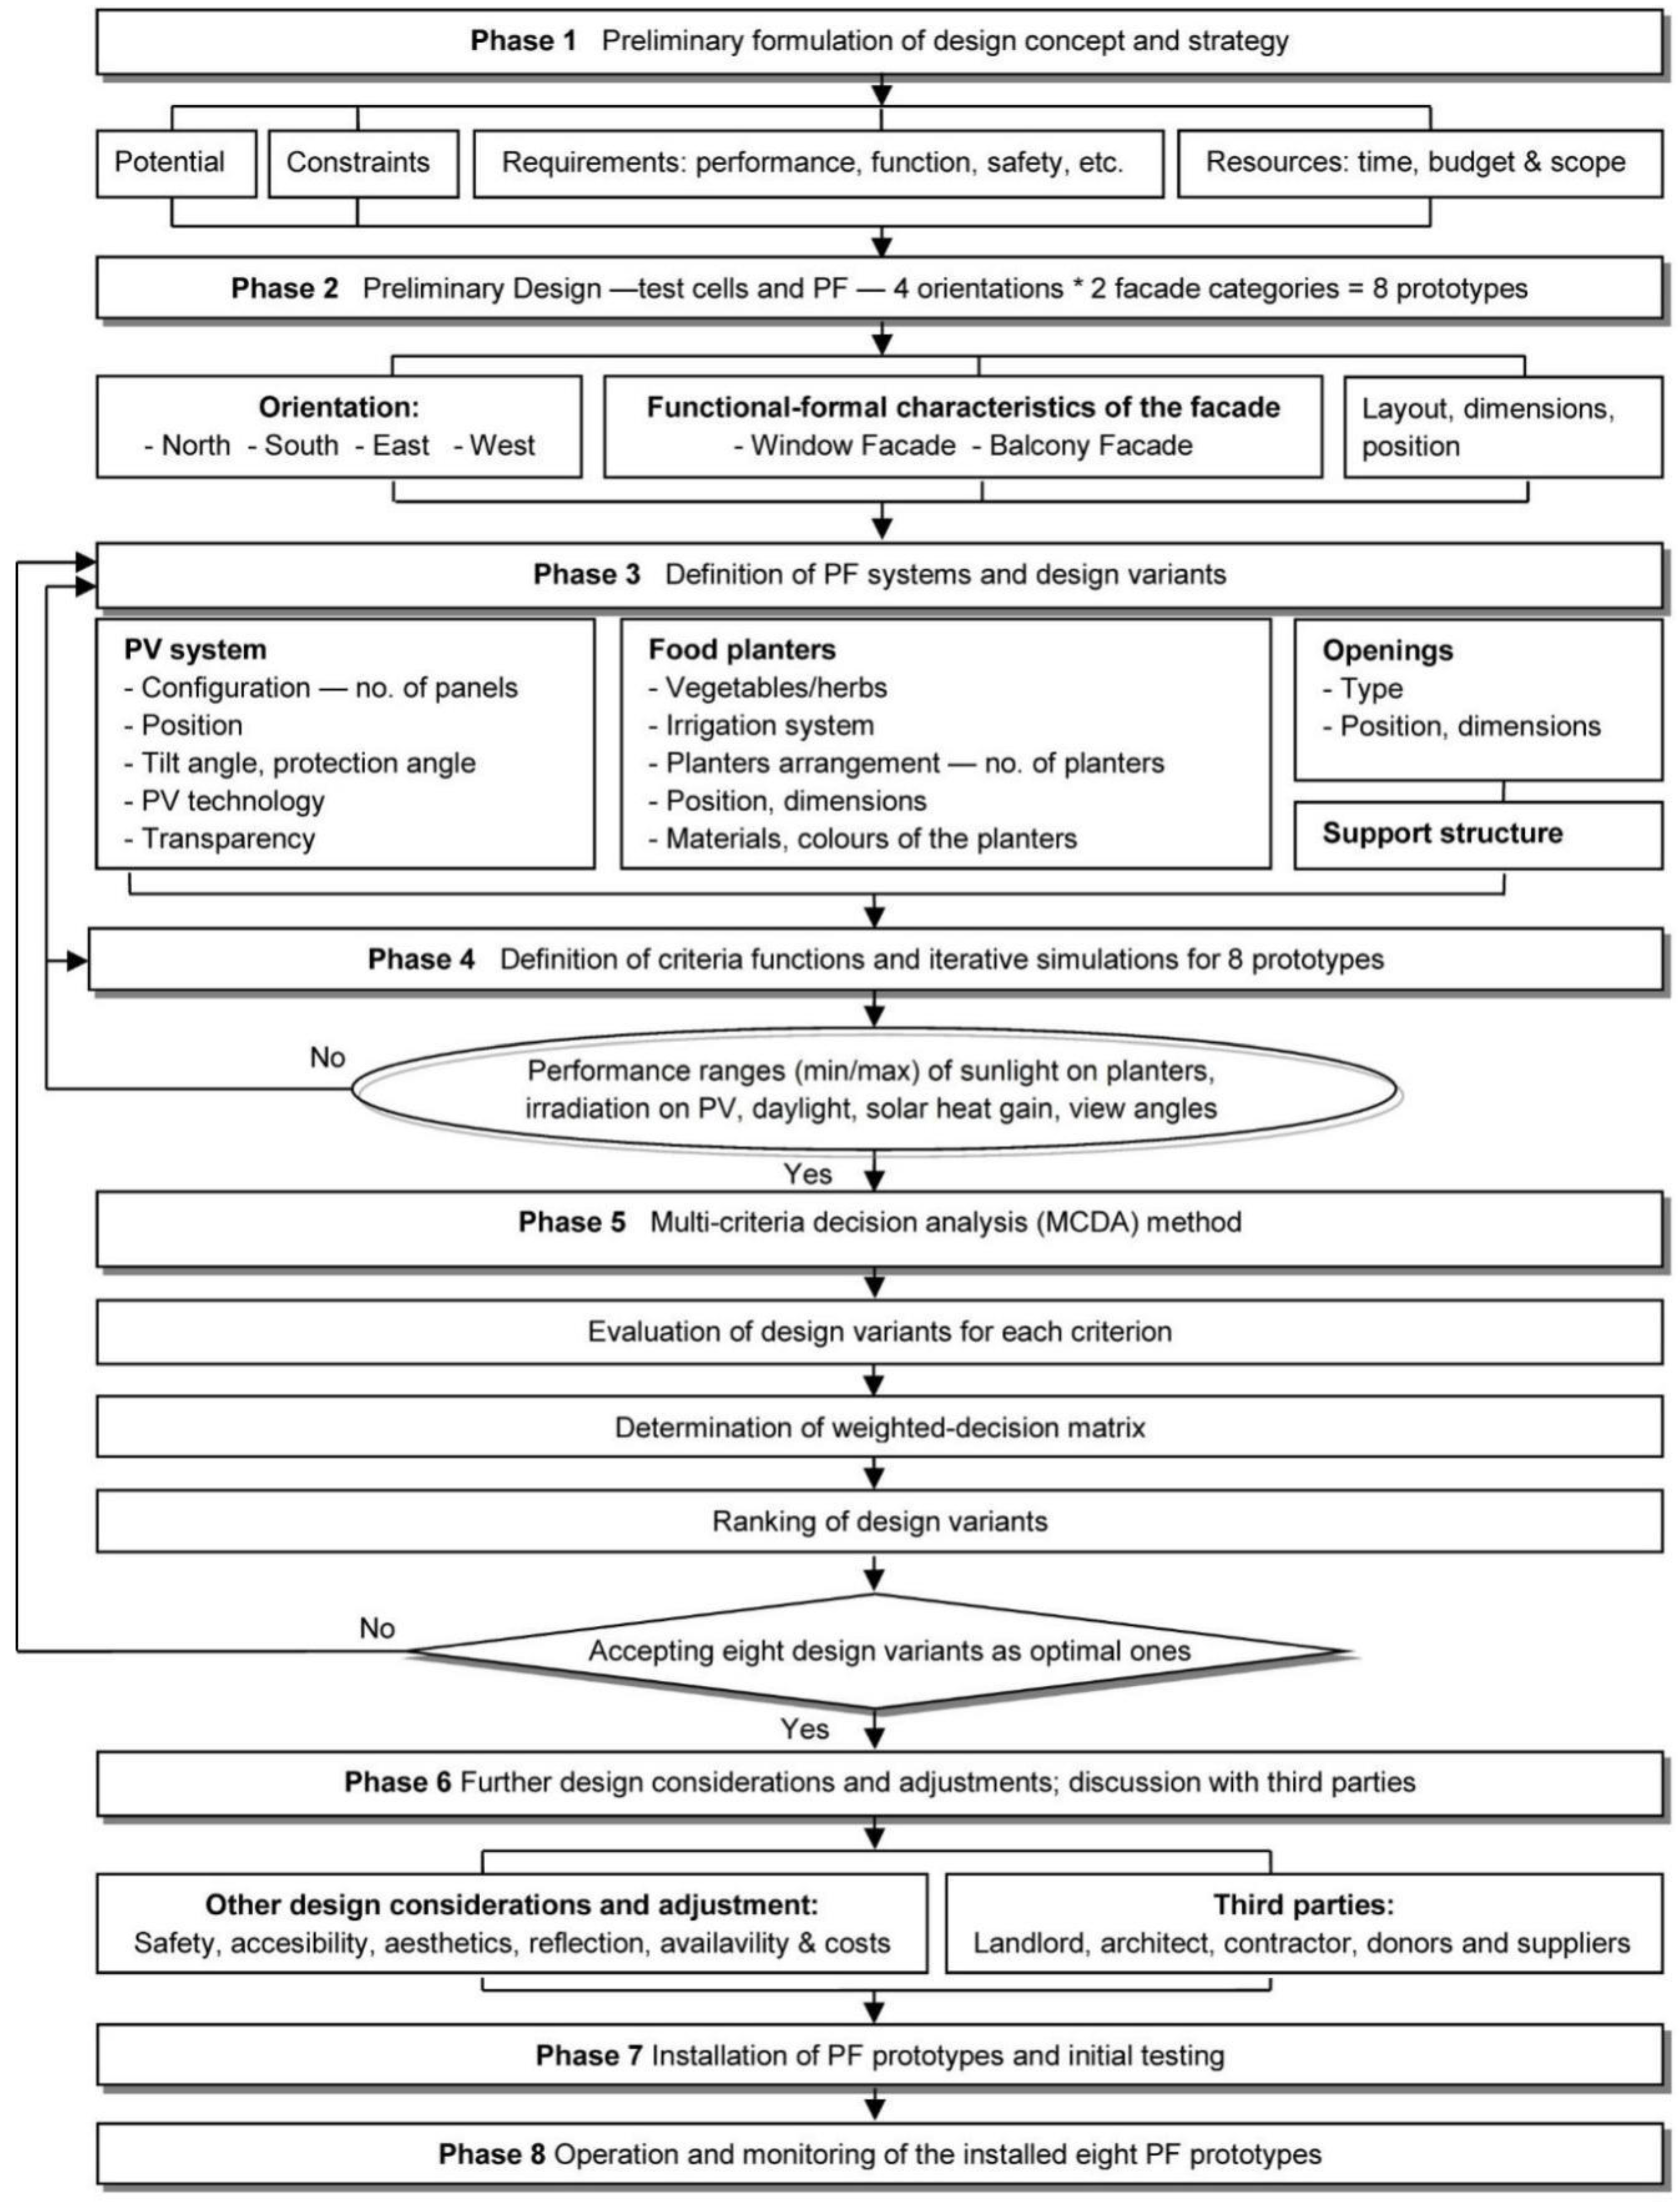
Figure 1 presents the overall framework related to the development, assessment, and optimization of PF prototypes. In phase 1, the scope, design concept, and main strategies for the implementation of PFs were defined based on the available reference literature and discussions with local experts regarding both BIPV panels and BIA systems. In phase 2, the preliminary designs of two categories of façades for four orientations were explored considering two typical façade types in actual residential buildings in Singapore as well as the available budget and space in the T
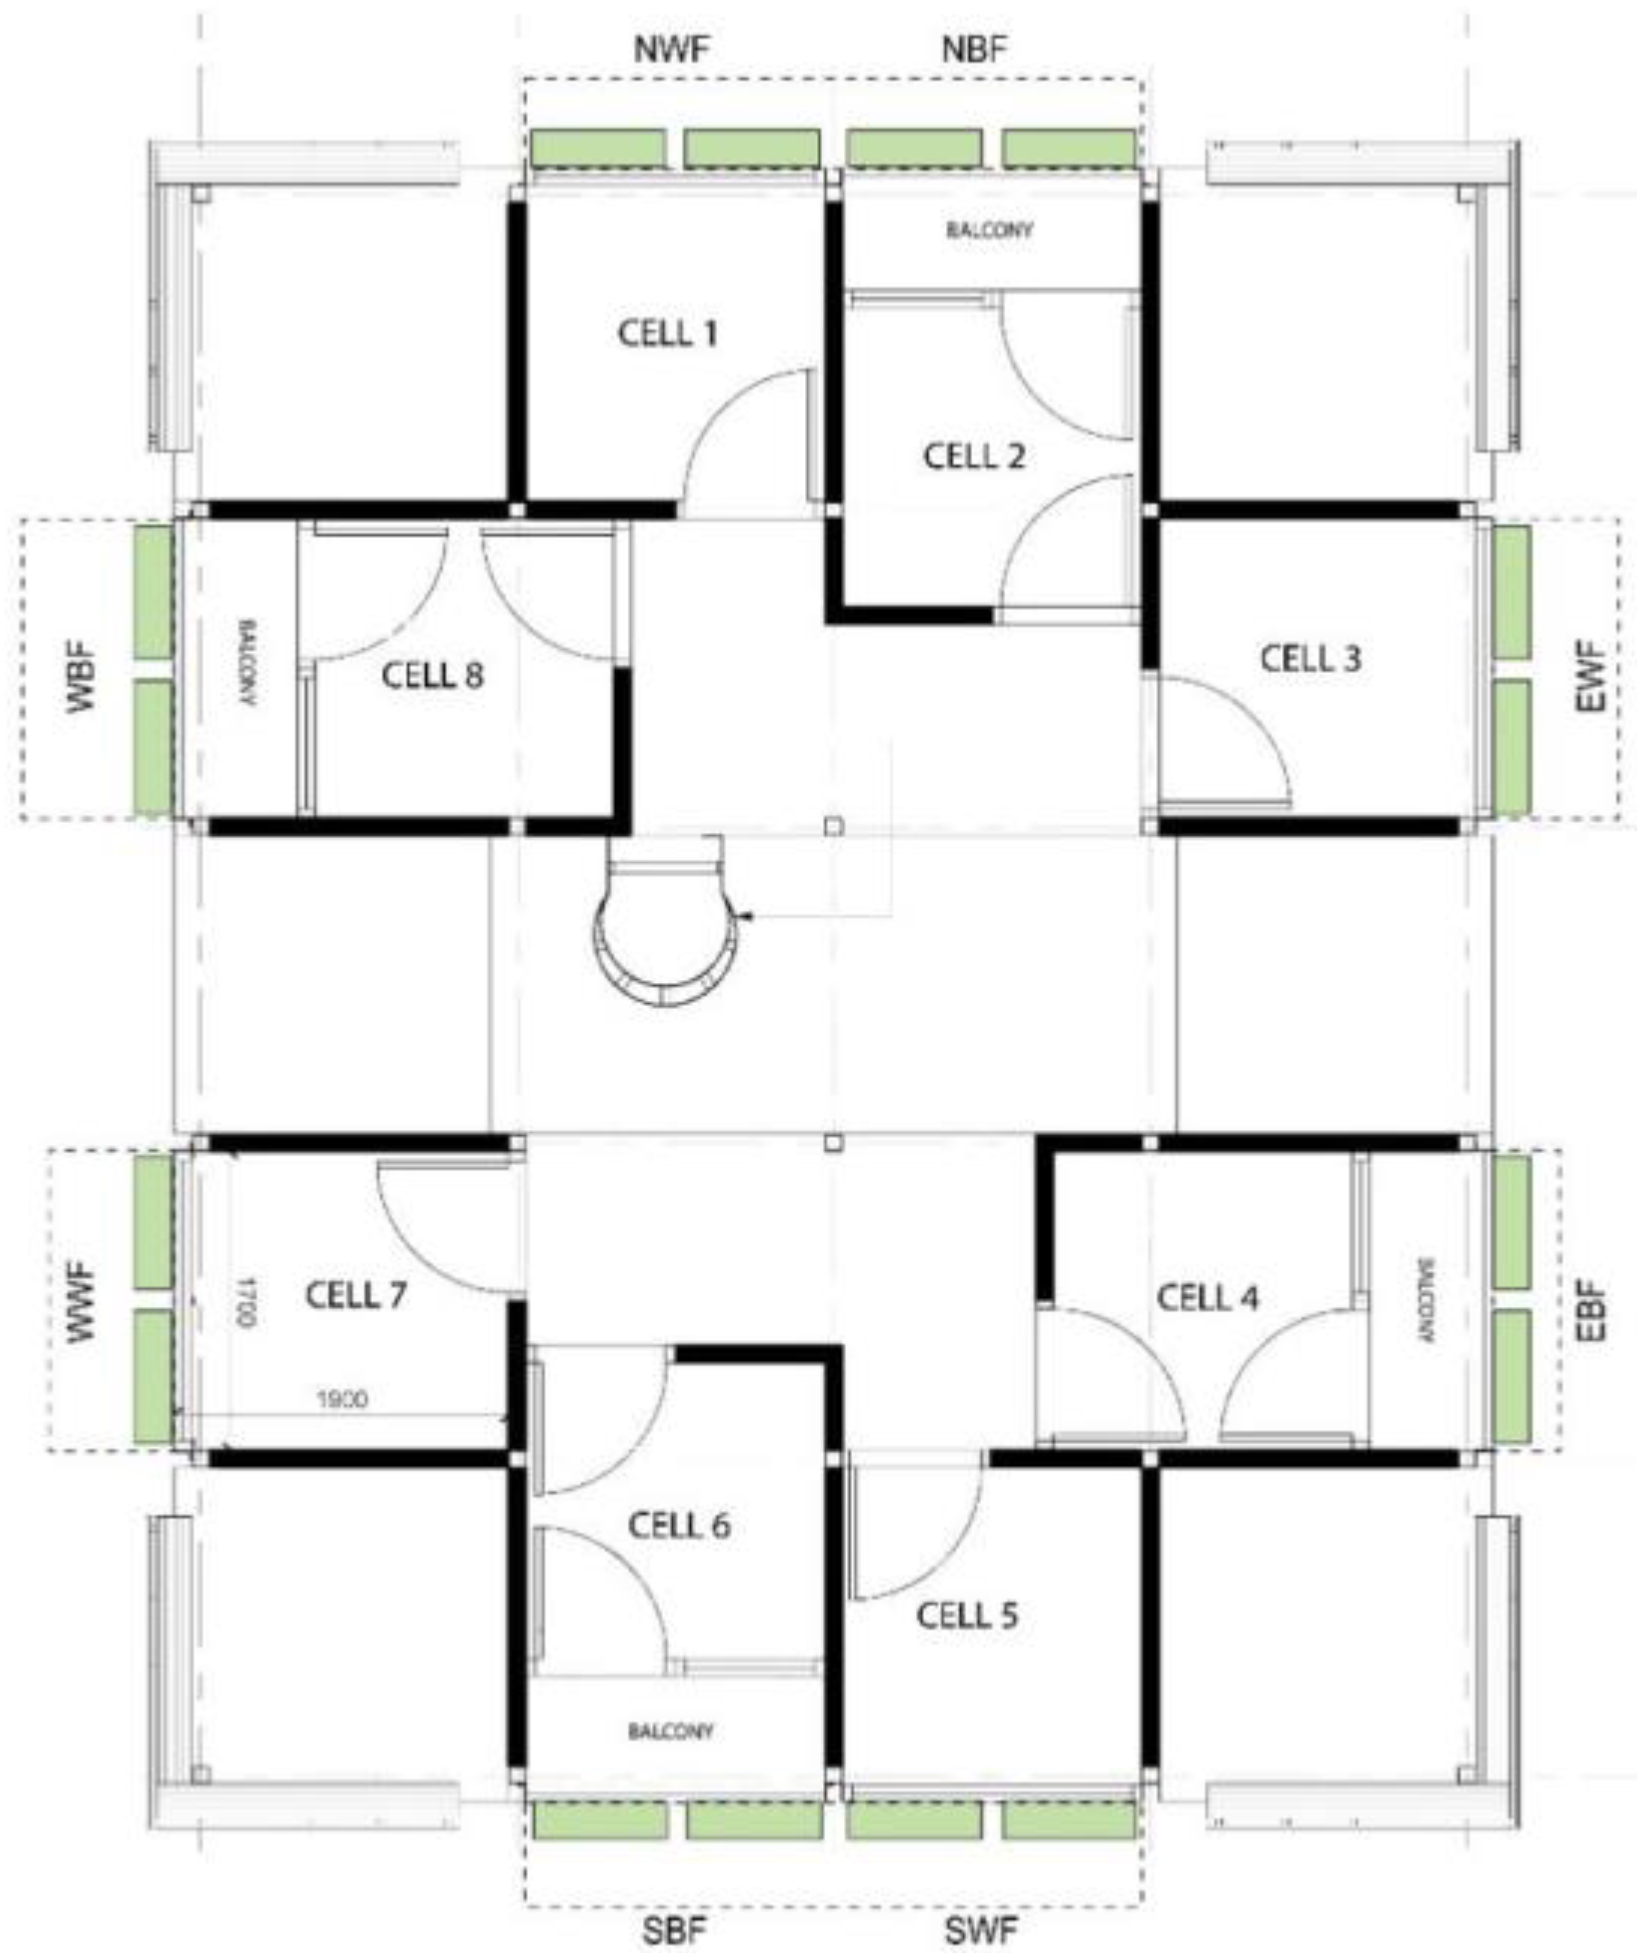
2 Lab. As illustrated in
Figure 2, eight test bed cells are located inside a 60 m
2 facility and are also used for other investigations of tropical technologies. In phase 3, the specifications of the BIPV and BIA systems on PFs were defined. The aspects considered, such as PV tilt angle and dimensions, planter location and configuration, etc., were crucial for the development of the PF design alternatives.
Once the design variants were listed, quantitative and qualitative assessment criteria—the so-called “criteria functions”—were defined in phase 4. The acceptable performance ranges considered were also defined according to Singapore’s building codes and performance benchmarks recommended in the literature relative to the five criteria functions: Food production potential, electricity generation potential, indoor daylight, energy flow on façade, and view angles. A detailed description of each criterion function is presented in
Section 2.2. Computational simulations were then conducted using Grasshopper’s plug-ins in order to optimize the design of the eight PF prototypes. The description of the simulation algorithm and settings is presented in
Section 2.3.
In phase 5, the simulation results were used as inputs in the VIKOR, MCDM method in order to select the eight optimal PF design variants. The VIKOR method selects a compromise solution based on the weighted-decision matrix considering a set of criteria functions, acceptable ranges and targeted performance values. The details of the VIKOR method are explained in
Section 2.4. The final optimal PF prototypes were selected for hypothetical residential buildings. These however, may not coincide with the actual PF designs to be implemented in the T
2 Lab due to the availability of PV technology and the context. Phase 6 addressed this issue by adjusting the final prototypes design. The adjustment of the façade designs is explained in
Section 4. Finally, in phases 7 and 8, the final PF prototypes are installed at the T
2 Lab (see
Figure 2) and monitored, respectively.
2.1. The Model and Initial PF Arrangements
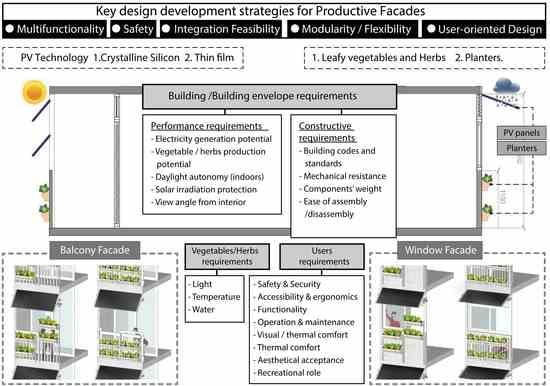
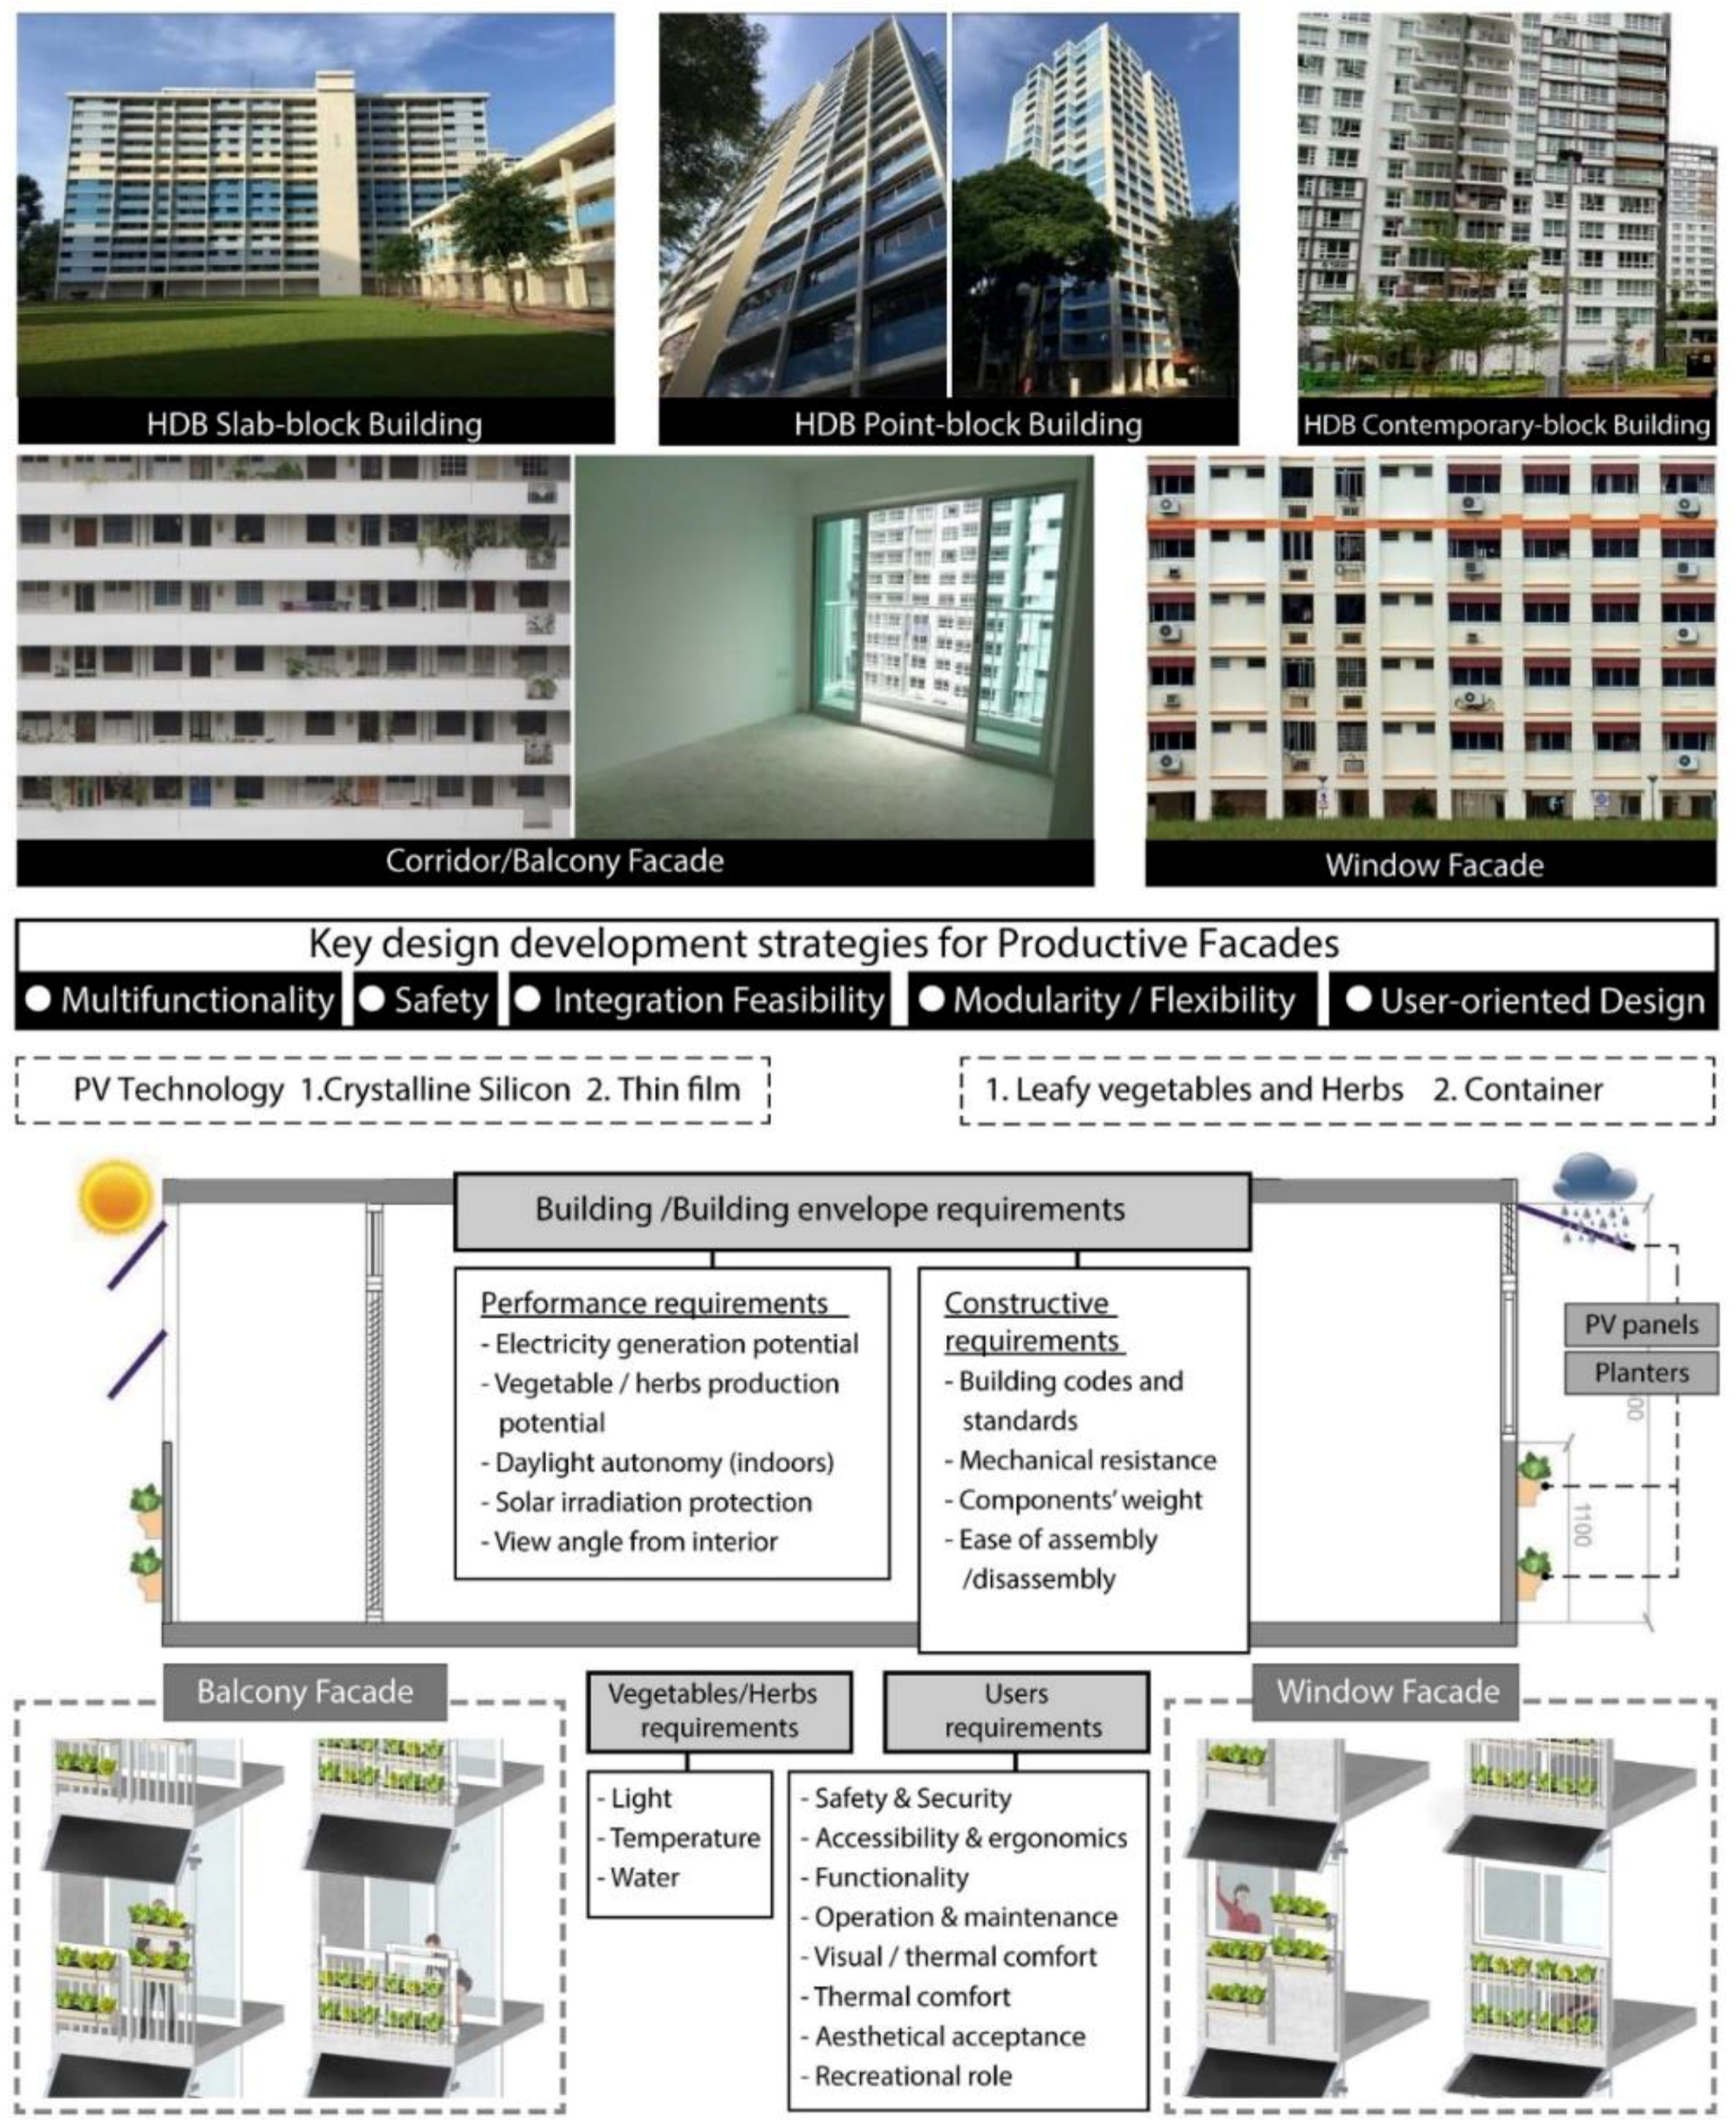
Figure 3 illustrates the main design strategies for the initial PF prototypes development. While the PF design variants are not targeting a specific residential building typology, a survey regarding the existing HDB public housing buildings in Singapore was conducted to determine common façade designs, materials, and arrangements. This helped to identify the two façade categories which were simplified and developed as a prototype to be optimized for four orientations in this study. Other relevant characteristics, including functional and constructive design parameters were also considered, although they are not the main focus of the study.
The PFs have conventional components (fenestration and opaque parapet) and non-conventional components (PV modules as external shading devices and planters outside the parapet or railing). Regarding the WF, two fenestration systems are used on the upper section and an opaque parapet of 1.1 m on the lower section of the façade. The fenestrations are designed to allow maximum wind porosity as well as easy access to planters. On the other hand, a floor-to-ceiling fenestration with operable glass louvers are used on the BF.
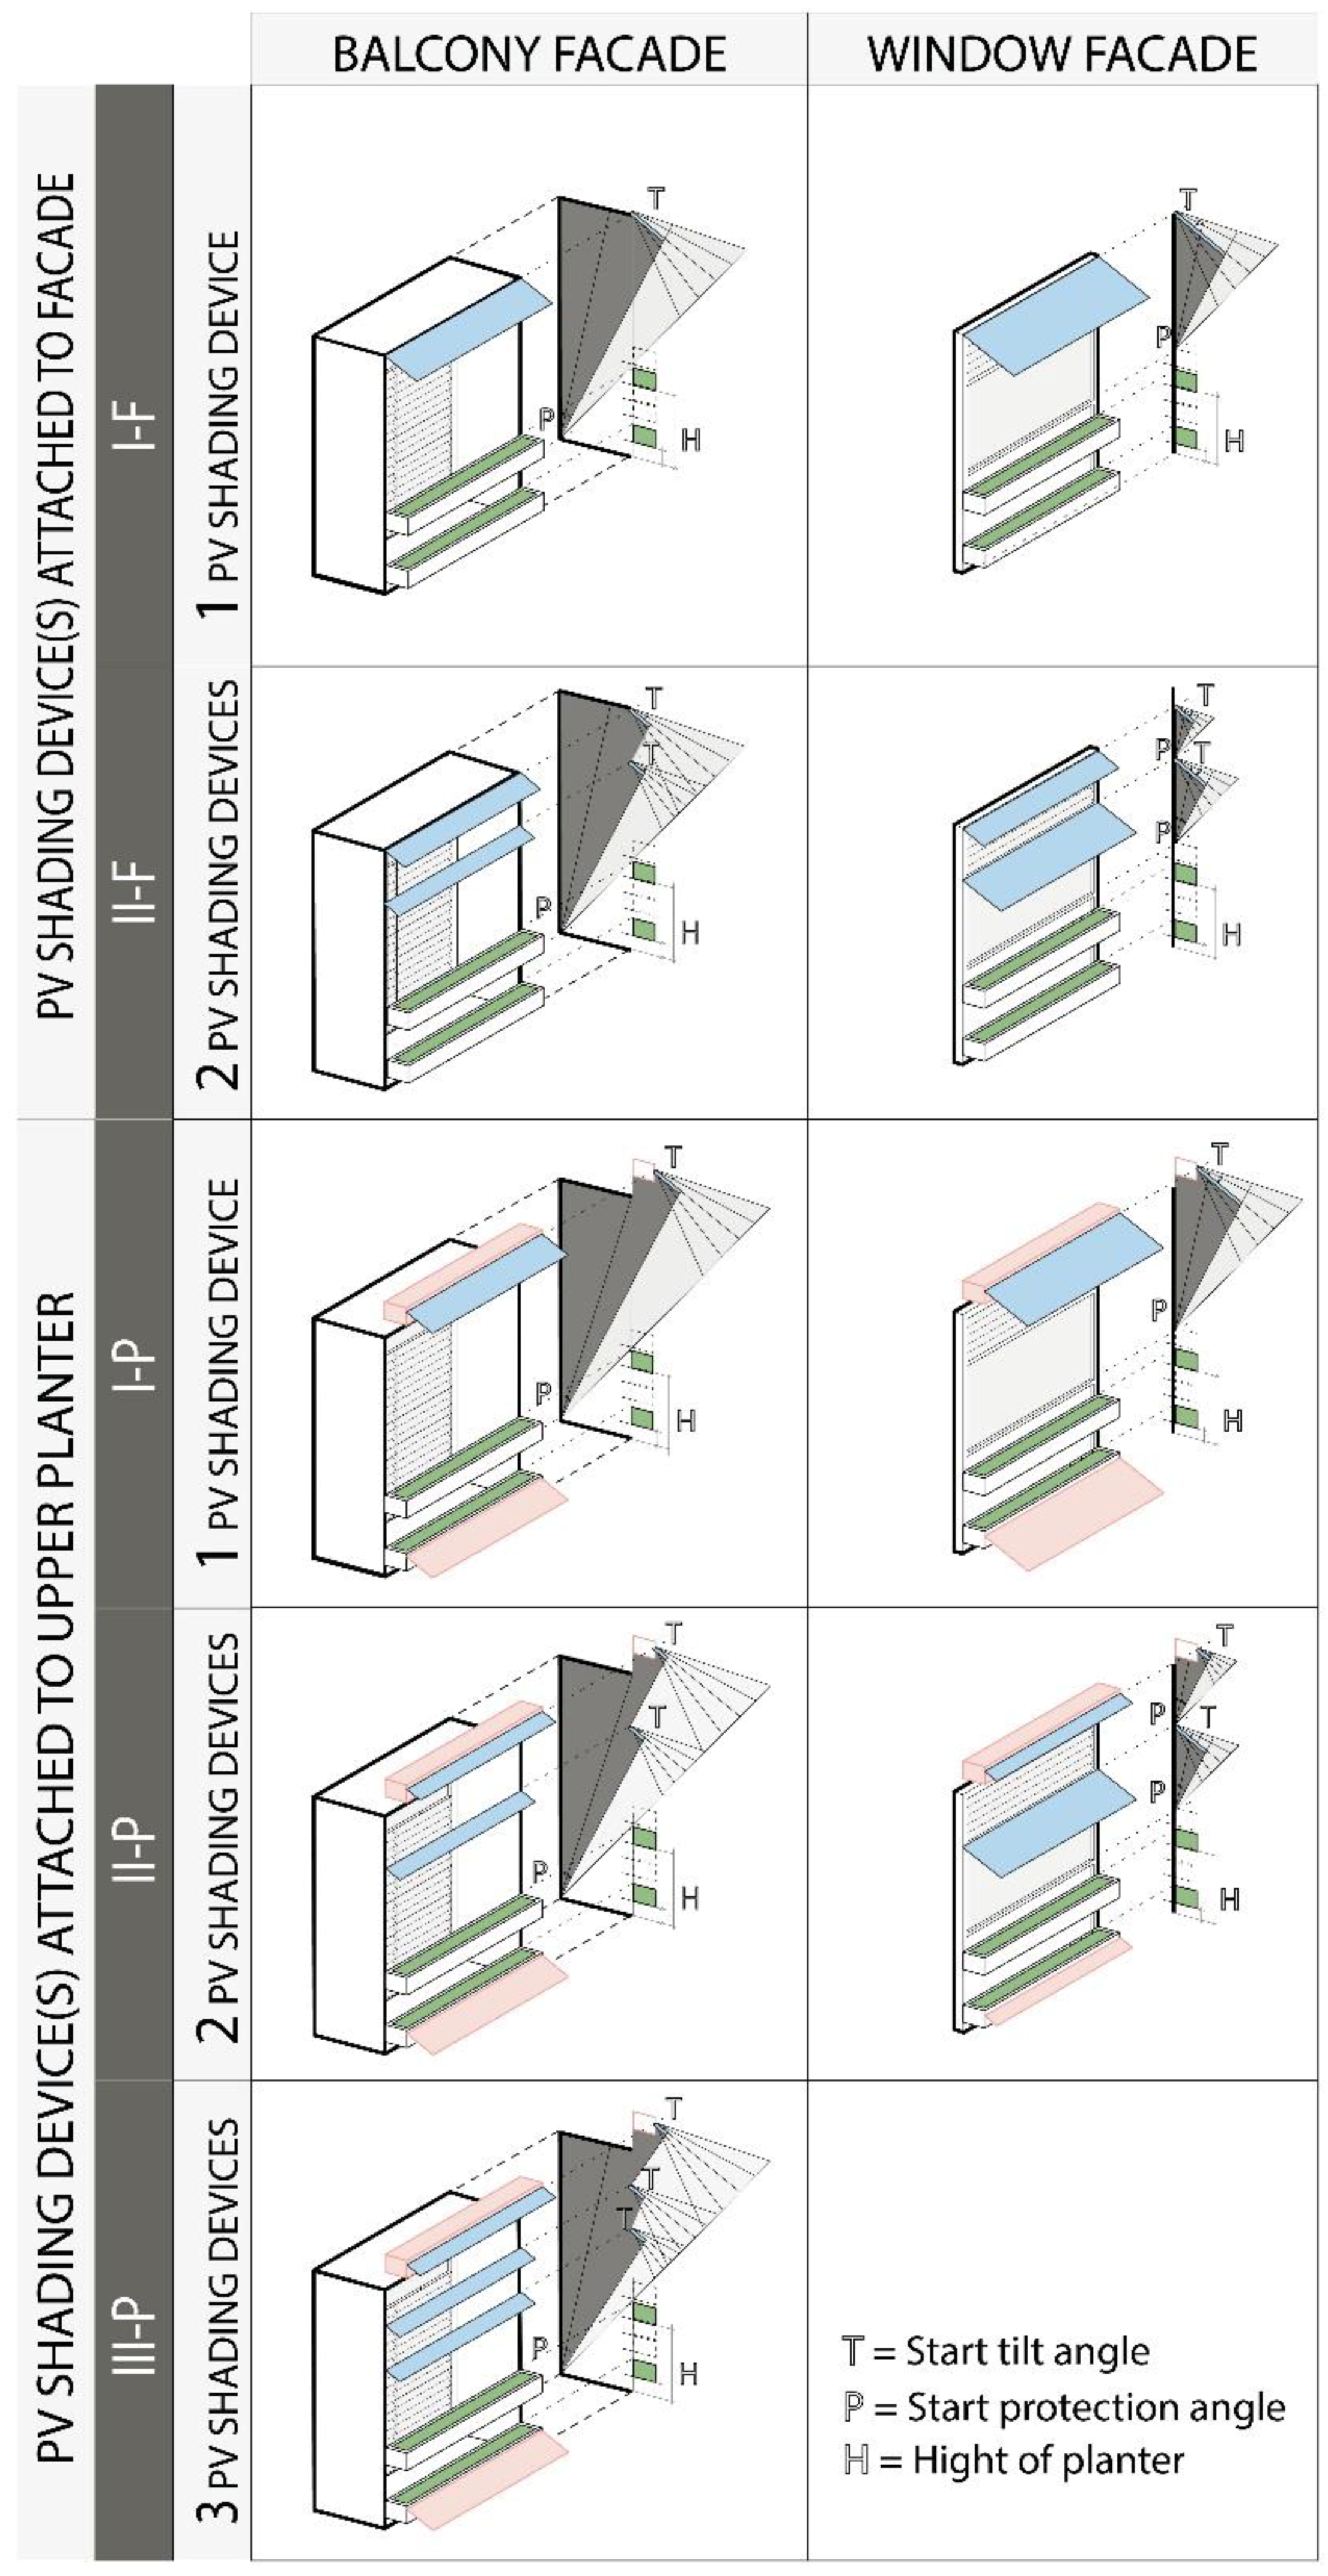
Figure 4 illustrates the following façade arrangements for WF and BF: (I-F) façade with a single PV panel attached on top of the façade, (II-F) façade with two PV panels, the top one is attached to the top of the façade, (I-P) façade with a single PV panel attached to the planter of the level above, (II-P) façade with two PV panels, the top one is attached to the planter of the level above, and (III-P) façade with three PV panels, the top one is attached to the planter of the level above.
Pursuant to the most common floor-to-floor height at HDB apartments, the test bed cells are 2.8 m high (2.6 m ceiling height). However, the cells are 1.8 m wide and 1.8 m deep. A number of constraints related to the position of PV modules and planters significantly reduces the number of potential design variants. The following restrictions may apply: PV modules that function as external shading devices are always placed on the upper third façade section or at the same height as the lowest planter from the upper floor; planters are always positioned in the bottom third façade section due to accessibility and safety reasons; in order to avoid obstructing the view, the central façade section is to be used as little as possible.
In order to provide more space for planters that are to be installed at the lower part of the façade, this study considers 1.1 m to be the window sill height. This allows planters to be positioned at 100 mm, 300 mm, 500 mm, 700 mm, and 900 mm, in two or three rows, while maintaining a 400 mm distance between planters. The sill height complies with BCA regulations [
58].
Singapore is located very close to the Equator at 1°17′ North latitude, meaning that solar irradiance is more evenly distributed among the four façade orientations in contrast to that of higher-latitude regions [
19]. However, the design optimization of the BIPV external-shading devices on different façade orientations is nonetheless highly challenging and complex. The objectives that PF elements should achieve need to be comprehensively and carefully defined. The stated objectives of the shading PV modules are the following: Maximizing the electricity generation, reducing solar heat gain, allowing necessary illuminance indoors, and as unobstructed as a possible view to the outside, at least the minimum required amount of sunlight reaching the planters and PV modules on the same and lower stories, respectively.
The protection angle, defined as the angle between the vertical plane of the façade and the outside edge of the PV module, is the most important geometrical parameter that has to be considered in order to achieve the optimal design variant. The protection angle along with the tilt angle define the width of the BIPV shading element. For a single shading element, the angle is measured from the bottom of the window, whereas for double BIPV shading elements, it will also include the measurement from the top of the lower shading element (illustrated in
Figure 4).
The number of PV modules should also be considered. The initial stage limited the number to two horizontal panels, while it subsequently considered three panels for East and West-oriented façades. Façade orientation also imposes limitations regarding PV panel tilt angles and protection angles as well as the number of hours during which a façade requires protection from direct solar radiation. The Residential Envelope Transmittance Value (RETV) calculation, based on the façade performance and orientation, was used to further define the minimum protection angle as required by the BCA of Singapore [
59]. The RETV performance is dependent on the total thermal transmittance (U-value) of facade elements, the solar heat gain coefficient (SHGC) and orientation of a surface. Opaque surfaces only have static U-value, hence the only variable is the window-to-wall ratio (WWR) of the façade. For the WF, WWR is 0.54, whereas for the BF, it stands at 0.93. Additionally, a minimum threshold of direct sunlight hours was set to before 8:30 a.m. and after 4:30 p.m. for extreme incidence hours. Lastly, a minimum value of the protection angle range was also established so that the operative temperature would not be above 28 °C. In this way, it was possible to ideally intersect the protection and the tilt angle of the shading device. Protection angles that meet the specified requirements were determined to range from 28° to 37° for the North and South orientations, from 47° to 56° for the East orientation, and from 53° to 65° for the West orientation.
2.2. Criteria Functions and Assumptions
2.2.1. Farming System and Food Production Potential
The factors affecting plant growth include light, temperature, water, rooting medium, and cultural practices. Due to the hot and humid weather conditions in Singapore, only a limited number of vegetable species are suitable for cultivation.
Table 1 provides a list of commonly cultivated Singapore leafy vegetables and their evaluation in terms of the optimum daily light integral (DLI) [
34]. They usually have shallow roots, which makes them space-efficient, a shorter growing period, and most of the final product, the aerial portion consisting of the stem and leaves, is edible.
Among other factors, light is a key factor affecting the growth of vegetables as it drives photosynthesis and plant development, morphology, and yield [
60]. At the same time, it is the most crucial factor for integrating farming systems into building façades owing to the reduced amount of sunlight on vertical surfaces in comparison with horizontal unobstructed surfaces. Ideally, shade-tolerant crops with lower daylight demand should be selected for cultivation on building façades, such as lettuce (
Lactuca sativa) and kangkong (
Ipomoea aquatica) in
Table 1.
Apart from light availability, excessive heat may inhibit root elongation, stimulate early bolting and accelerate plant development resulting in smaller-sized plants and a lower vegetable yield [
61,
62]. Vegetables like lettuce originated from cooler climate regions so their heat tolerance is low. However, there are varieties adapted to tropical climates and have been successfully grown in Singapore and other tropical regions. Therefore, due to the high light demand of kai lan, pak choy, red bayam, and cai xin, and the large plant size of kangkong, lettuce was selected for the purposes of this study after considering light availability, heat tolerance, and other factors.
The light intensity range required for growth of plants depends on the environment and time, the desired plant product, heat and CO
2 content of the air surrounding the plants [
63]. The agricultural industry frequently uses DLI to determine the exact lighting condition for plants. It represents the total number of photosynthetically active photons that plants receive in 1 m
2 of growing space in one day. It is expressed in mol/m²/day, and essentially reflects the combined results of the light intensity and duration of the photoperiod. Commercial farms will usually keep the minimum DLI of 10–12 mol/m²/day for optimum growth of plants [
64]. For maximum production, leaf lettuce normally requires 14–17 mol/m²/day or more [
65], although it can still be grown with as little as 4–10 mol/m²/day. However, if the DLI is below 8 mol/m²/day, the quality of the produce will be low [
66,
67], hence, the minimum DLI requirement for lettuce growth can be set at 8 mol/m²/day, which is equivalent to 10,000 lux when DLI is converted to illuminance levels.
2.2.2. BIPV Electricity Generation Potential
Electricity generation potential refers to the potential electricity generation from all PV modules for each façade. In order to focus on the geometrical impact of the PV panel on all design variants, the type of PV technology, performance ratio, and the effect of temperature were not considered in the simulations. Instead, the average of the lowest incident irradiation from all panels on each façade multiplied by the total PV area was obtained from the simulations and used as one of the criteria functions. The lowest incident irradiation were obtained from a row of test-points located at 100 mm from the façade and accounts for the partial shading produced by upper PV panels since PV cells on the same module are considered to be connected in series.
2.2.3. Indoor Daylight
Daylight Autonomy (DA) refers to the percentage of time during the year in which a certain, pre-defined illuminance value is achieved from 8 a.m. to 5 p.m. The bedroom WF and the living room BF were both subdivided into front and back subzones, whereas the DA of 50% was the targeted value. Taking into account the position of a desk in the bedroom, the front bedroom subzone requires 400 lux, whereas the back subzone designated for change of clothing requires only 100 lux. With regards to the living room, the front subzone requires 200 lux and the back subzone 100 lux. It should be noted that an equivalent DA was used rather than the actual values obtained in the simulations since the testbed cell size is smaller in comparison to the actual room dimensions in typical HDB buildings. Therefore, preliminary simulations referring to a living room and a bedroom with two façade arrangements were conducted on actual room dimensions to obtain the DA conversion coefficients for all cases using the reduced room dimensions. For example, the illuminance threshold in rooms with actual dimensions is 100 lux during 50% of the time, whereas in the reduced, smaller version, the said threshold is approximately 230–260 lux depending on the arrangement and dimensions of PV modules. The highest standard for maximum accuracy was achieved by using a larger number of reflections in order to carry out daylight simulation in rooms with actual dimensions, whereas simulations on the reduced scale model were conducted with low accuracy. This conversion process greatly reduces simulation time without compromising the prediction accuracy.
2.2.4. Energy Flow on Façade
The energy flow through the façade is defined as the heat gain minus heat loss (kWh) considering the rest of the walls as adiabatic. Net solar transmittance, which is the result of the façade design related to fenestration and shading devices, largely affects the energy flow of the façade. Therefore, instead of thermal comfort, energy flow values were used directly in order to isolate the impact of the façade design on thermal conditions and to simplify the simulations and analyses. For every case, constant thermal properties of the materials and no occupancy were applied. The energy flow calculations were conducted using the plug-in, Honeybee which connects with the EnergyPlus simulation engine for transient energy calculations. For this criteria function, no specific range was defined since the protection angle already assured compliance with RETV and the two other requirements, as explained in the above section. Therefore, all values from design variants are relative to each other.
2.2.5. View Angle
One of the criteria functions selected to assure the architectural quality of residential building façades is the outdoor view angle. It refers to the average view angle from two points inside the testbed cells towards the exterior. The location of the two points is 1.5 m from the façade at 1.17 m and 1.56 m above the floor. The said points correspond to the viewing height of a person 1.68 m tall, while sitting and standing. Any obstruction effects from the planters and PV panels are considered. For North and South façade orientations, as the most common and the recommended orientations in tropical residential buildings, the minimum view angle was set at 20°. For East and West façade orientations, the minimum view angle was set at 15°.
2.3. Grasshopper Algorithm
The aim of the developed algorithm is to provide a user-friendly platform that performs simulations corresponding to a large variety of façade variants, while complying with standard practices and recommendations found in literature—see
Section 2.1—within a relatively short time-span, from 8 to 45 h simulation time, per façade type on a standard PC. A balance between simulation automation and user intervention is also achieved to support the design process. At first, the algorithm programmed the PF geometry to allow its transformation into multiple varying configurations according to pre-defined parameters and the range of component dimensions. This set-up enabled automatic cycles through all design variants for the same PF category and orientation.
Manual intervention was required in eight instances to input the parameter ranges for each of the eight PF subsets. Grasshopper plugins Ladybug [
68] and Honeybee apply generic qualities to selected geometries and context to all cases. Regarding the building materials, lateral walls, and the ceiling are considered adiabatic while the back wall has a thermal transmittance (U-value) of 1.4 W/m²K. Reflectance value of all interior surfaces is 0.65 corresponding to off-white color, except the floor whose value is 0.51. Single clear glass was used for all fenestrations with U-value of 6.5 W/m²K and visible transmittance of 0.88. PV panels on North and South facades are opaque and those on East and West facades are semi-transparent with a transmittance coefficient of 0.44. All rooms have zero occupancy and no building or obstruction are considered on the opposite position of the facades. Regarding the ventilation settings, ‘Window Natural Ventilation’ was chosen as the ventilation type for all cells. The airflow rate is calculated based on the local weather file data and on the operable area and height of all exterior fenestrations. Half of the area of all fenestrations are set to be fully opened throughout the whole year.
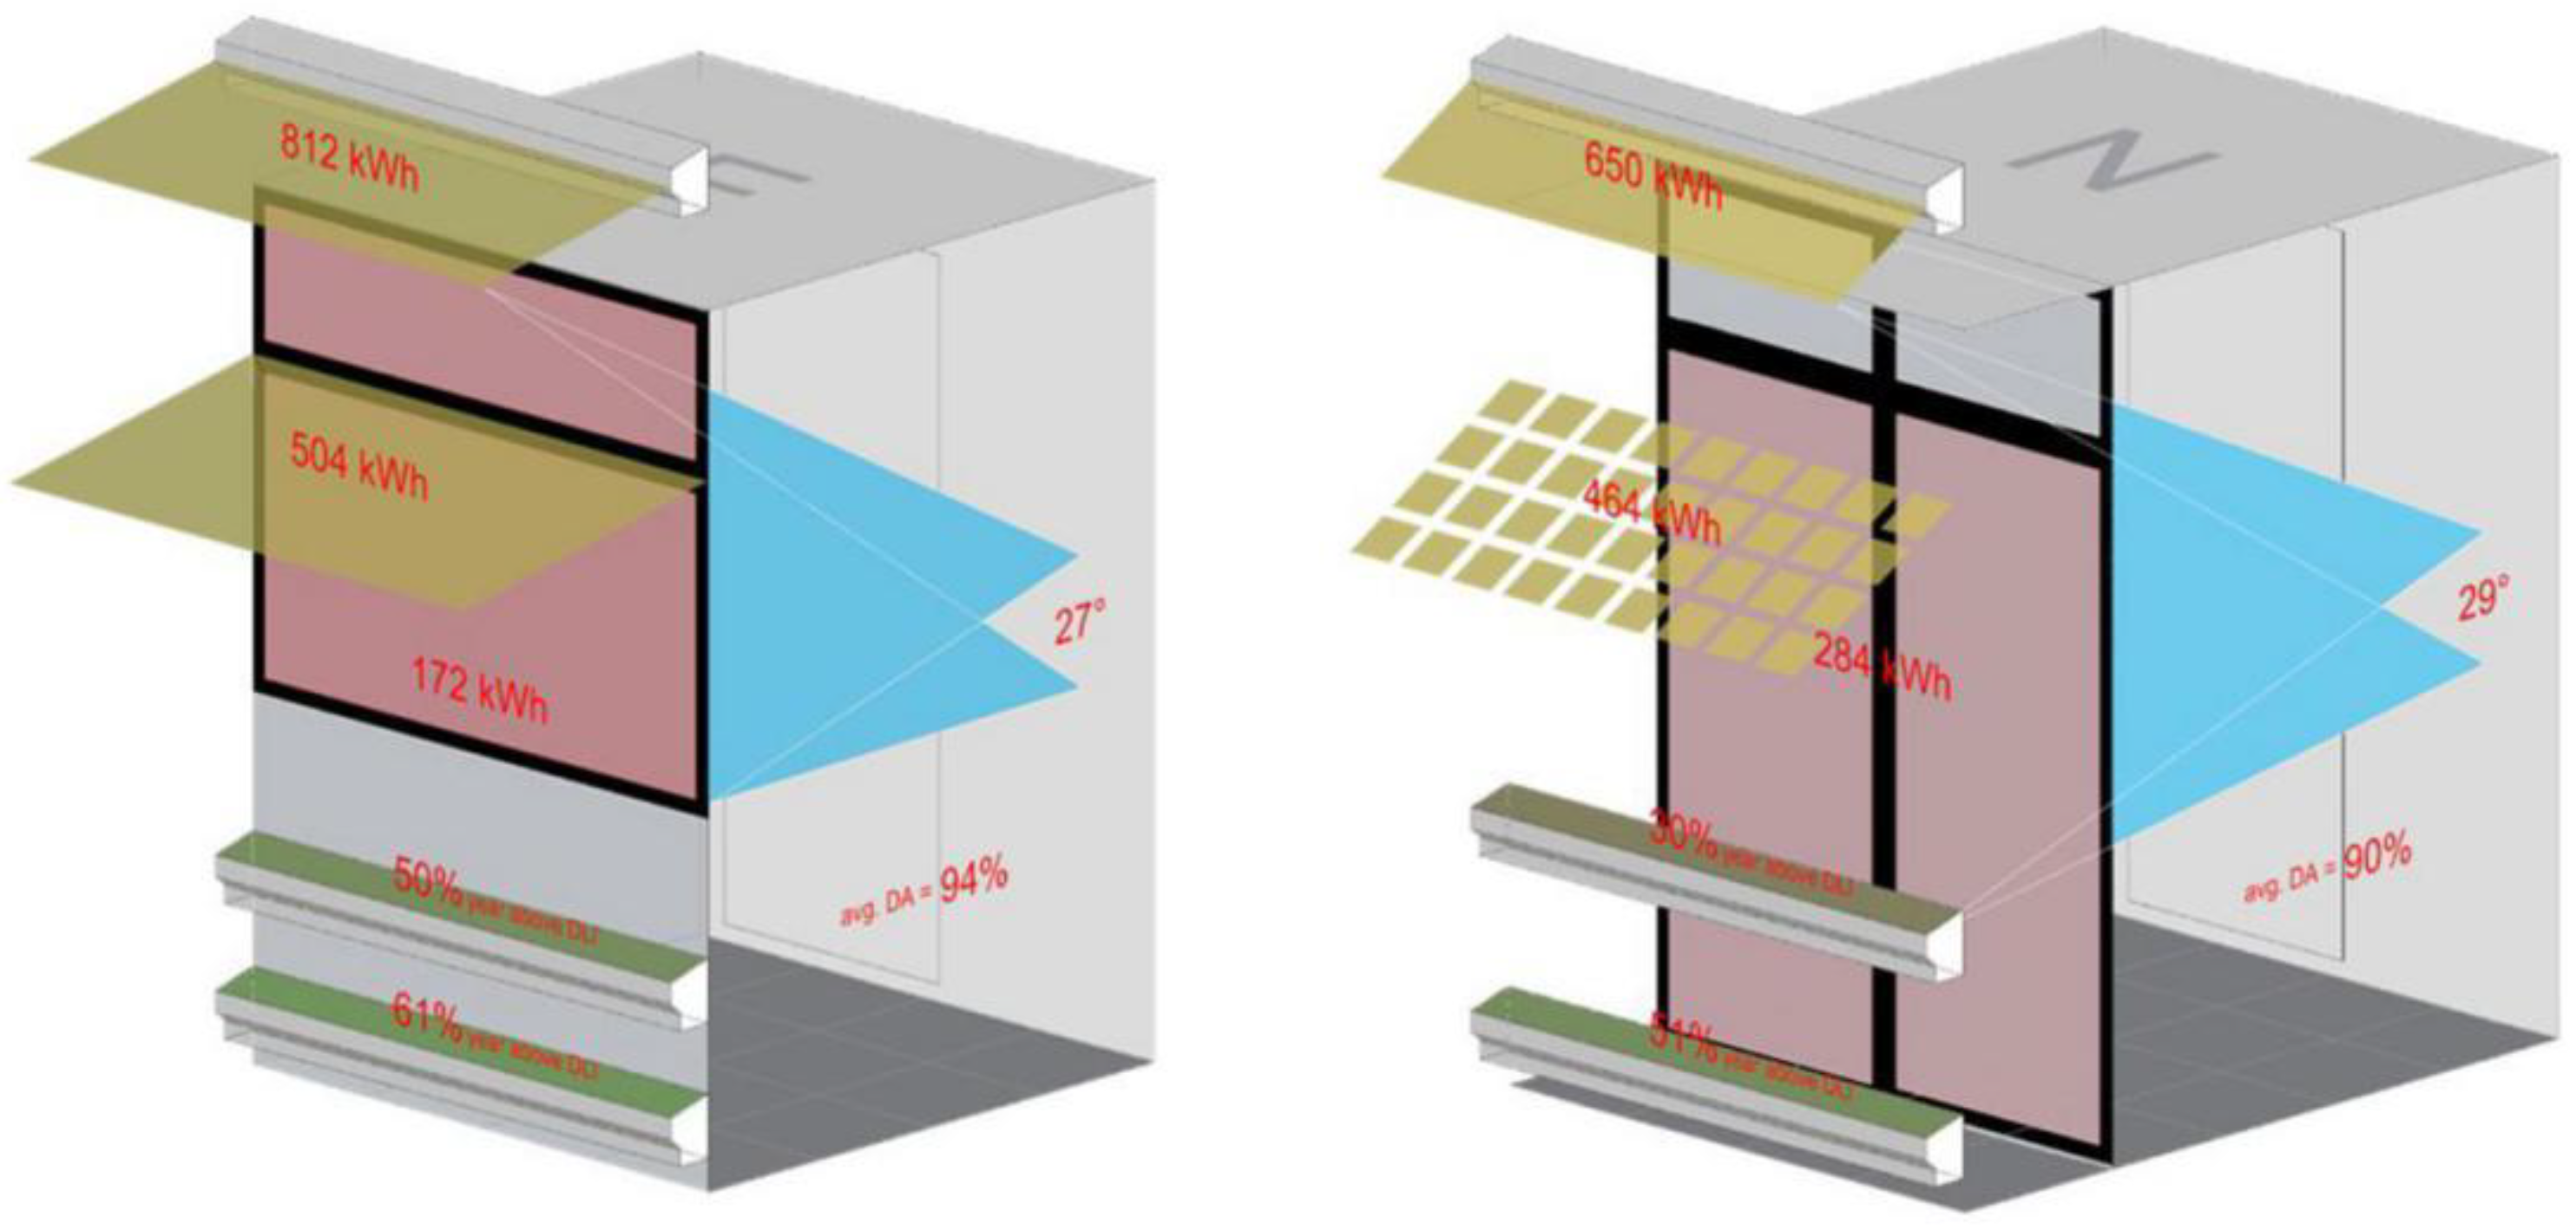
The results are then organized and visual and mathematical analysis is performed in order to verify the results, and if required, further the design development. The results for individual façades are automatically represented in the design variants models as presented in
Figure 5. The tabulated data were organized per variant in the form of a list with values separated by commas, storing variant identification, values for the criteria and support data for error checking and variant development. These data was then imported into Excel for the application of the VIKOR method. More details of the Grasshopper algorithm can be found in Tablada et al. [
39].
2.4. VIKOR Method
The design of PFs is a highly complex and dynamic process. In order to solve the challenges pertaining to the process of finding the optimal PF design variant, VIKOR (in Serbian: VIšekriterijumska Optimizacija i Kompromisno Rešenje) method [
56,
57] is applied, a multi-criteria compromise method developed for the purpose of a multi-criteria optimization of complex systems. The VIKOR method determines a compromise solution from a set of alternatives often based on non-commensurable units (i.e., for optimisation specifically: %, W/m
2, kg) and conflicting requirements (i.e., PF criteria functions: food production potential, BIPV electricity generation potential, indoor daylight, energy flow on façade and view angle), while also allowing easy, highly flexible modelling of the decision maker’s (DM) preference. The method has been successfully applied to resolve practical considerations in complex multidisciplinary fields related to sustainability and renewable energy planning [
69,
70], as well as in the building PV integration field [
20,
71]. It enables holistic evaluation of different design solutions and the optimization of the design variants and aids the sensitivity analysis which tests the robustness of the “optimality” of the selected design variant. The major advantages of the VIKOR method are that it compromises conflicting criteria, and a maximum “group utility” for the “majority” with a minimum of an individual regret for the “opponent” including the relative importance by the weights. The algorithmic steps of the VIKOR method and the Equations (A1)–(A11) related to it are presented in the
Appendix A. The VIKOR compares each alternative by the distances to the ideal solution (point). Here, ideal consists of the maximum
fi*, if the
i-th function represents a benefit, and the minimum
fi ¯, if the
i-th function represents damages or costs, see Equation (A1). In terms of computational complexity, the method is not overly complicated or demanding. Both criteria functions and their weights can be varied easily during the design process and their impact on the optimal solution selection can be analyzed helping DMs and the design team obtain a better insight of the sensitivity of different solutions.
To add values of non-commensurable criteria, VIKOR converts them into the same units first. Normalization is used to eliminate the units of criterion functions, so that all the criteria are dimensionless. The VIKOR method uses linear normalization, whereas the normalized value does not depend on the evaluation unit of a criterion function unlike, for example, the TOPSIS, another widely applied MCDM method, which uses vector normalization, but the normalized values may depend on the evaluation unit [
56].
The application of the VIKOR method helps evaluate PF design variants—i.e., alternatives—and arrive at a compromise solution, the one “closest” to an ideal solution, which is selected from a set of J alternatives, i.e.,: A1, A2, …, AJ, evaluated according to a set of n criteria functions. Value Qj, Equation (A9) is used to select the optimal design alternative as it represents an approximation of the ideal balance, i.e., it compromises two decision-making strategies:
(1) “Maximum group benefit” defined by the value Sj, Equation (A3)—better alternatives are considered to be those deemed good according to the majority of criteria, and
(2) “Minimum of maximum deviation of ideal values” defined by the value Rj, Equation (A4)—those alternatives that are considered to be better must not be very bad according to any criteria.
Prior to the VIKOR method, the cases were filtered according to the established acceptable ranges for values of each parameter. For the evaluation and ranking of all selected types of PV configurations and all façade orientations through the VIKOR method, equal weights (0.2) were initially applied for all 5 criteria functions. However, they were not suitable for obtaining the optimal solution on a sub-set of cases, hence the criteria function weights for each sub-set were adjusted. (1 − v) ∗ QRj part of the VIKOR ranking formula penalizes cases even when a single parameter value is close to the value of the worst performing solution within the set in order to avoid high ranking of a case with extremely poor performance within a single criterion. For example, in the all-cases set, DA parameter may vary between 54% and 98%, hence it is justifiable to strongly penalize the cases whose DA parameter value approaches 54%. For the North Window Façade (NWF) sub-set of cases, DA parameter may vary between 90% and 97% (i.e., all cases have satisfactory DA parameter), hence it is not justifiable to strongly penalize a case since even 1% difference could greatly influence its ranking. Therefore, a weighting system was created to account for the range between minimum and maximum values of the criteria parameters within the sub-set of cases with a lower weight being assigned to the criterion where the differences between the best performing and the worst performing cases are negligible.
For all sub-sets of cases, a total range of possible parameters for each criterion function is calculated. Then the average value of ranges among 8 sub-sets is derived for each of the 5 criteria functions and such average range is used as the basis for scaling criteria functions weights in the analysis of individual sub-sets of cases. The process of obtaining the weight per criteria function for each sub-set is presented in
Appendix B. The final criteria function weights for all 8 PF prototype sub-sets are presented in
Table 2. The lowest final weight of 0.08 was obtained for the “View-Angle” criterion in the WWF cell façade type since the View Angle of all cases in this subset varies between 15° and 18°. The highest final weight of 0.37 was obtained for the irradiance on the PV surface in the same cell façade due to the relatively large difference between the maximum and minimum incident irradiance (548 W/m
2) among that subset of cases.
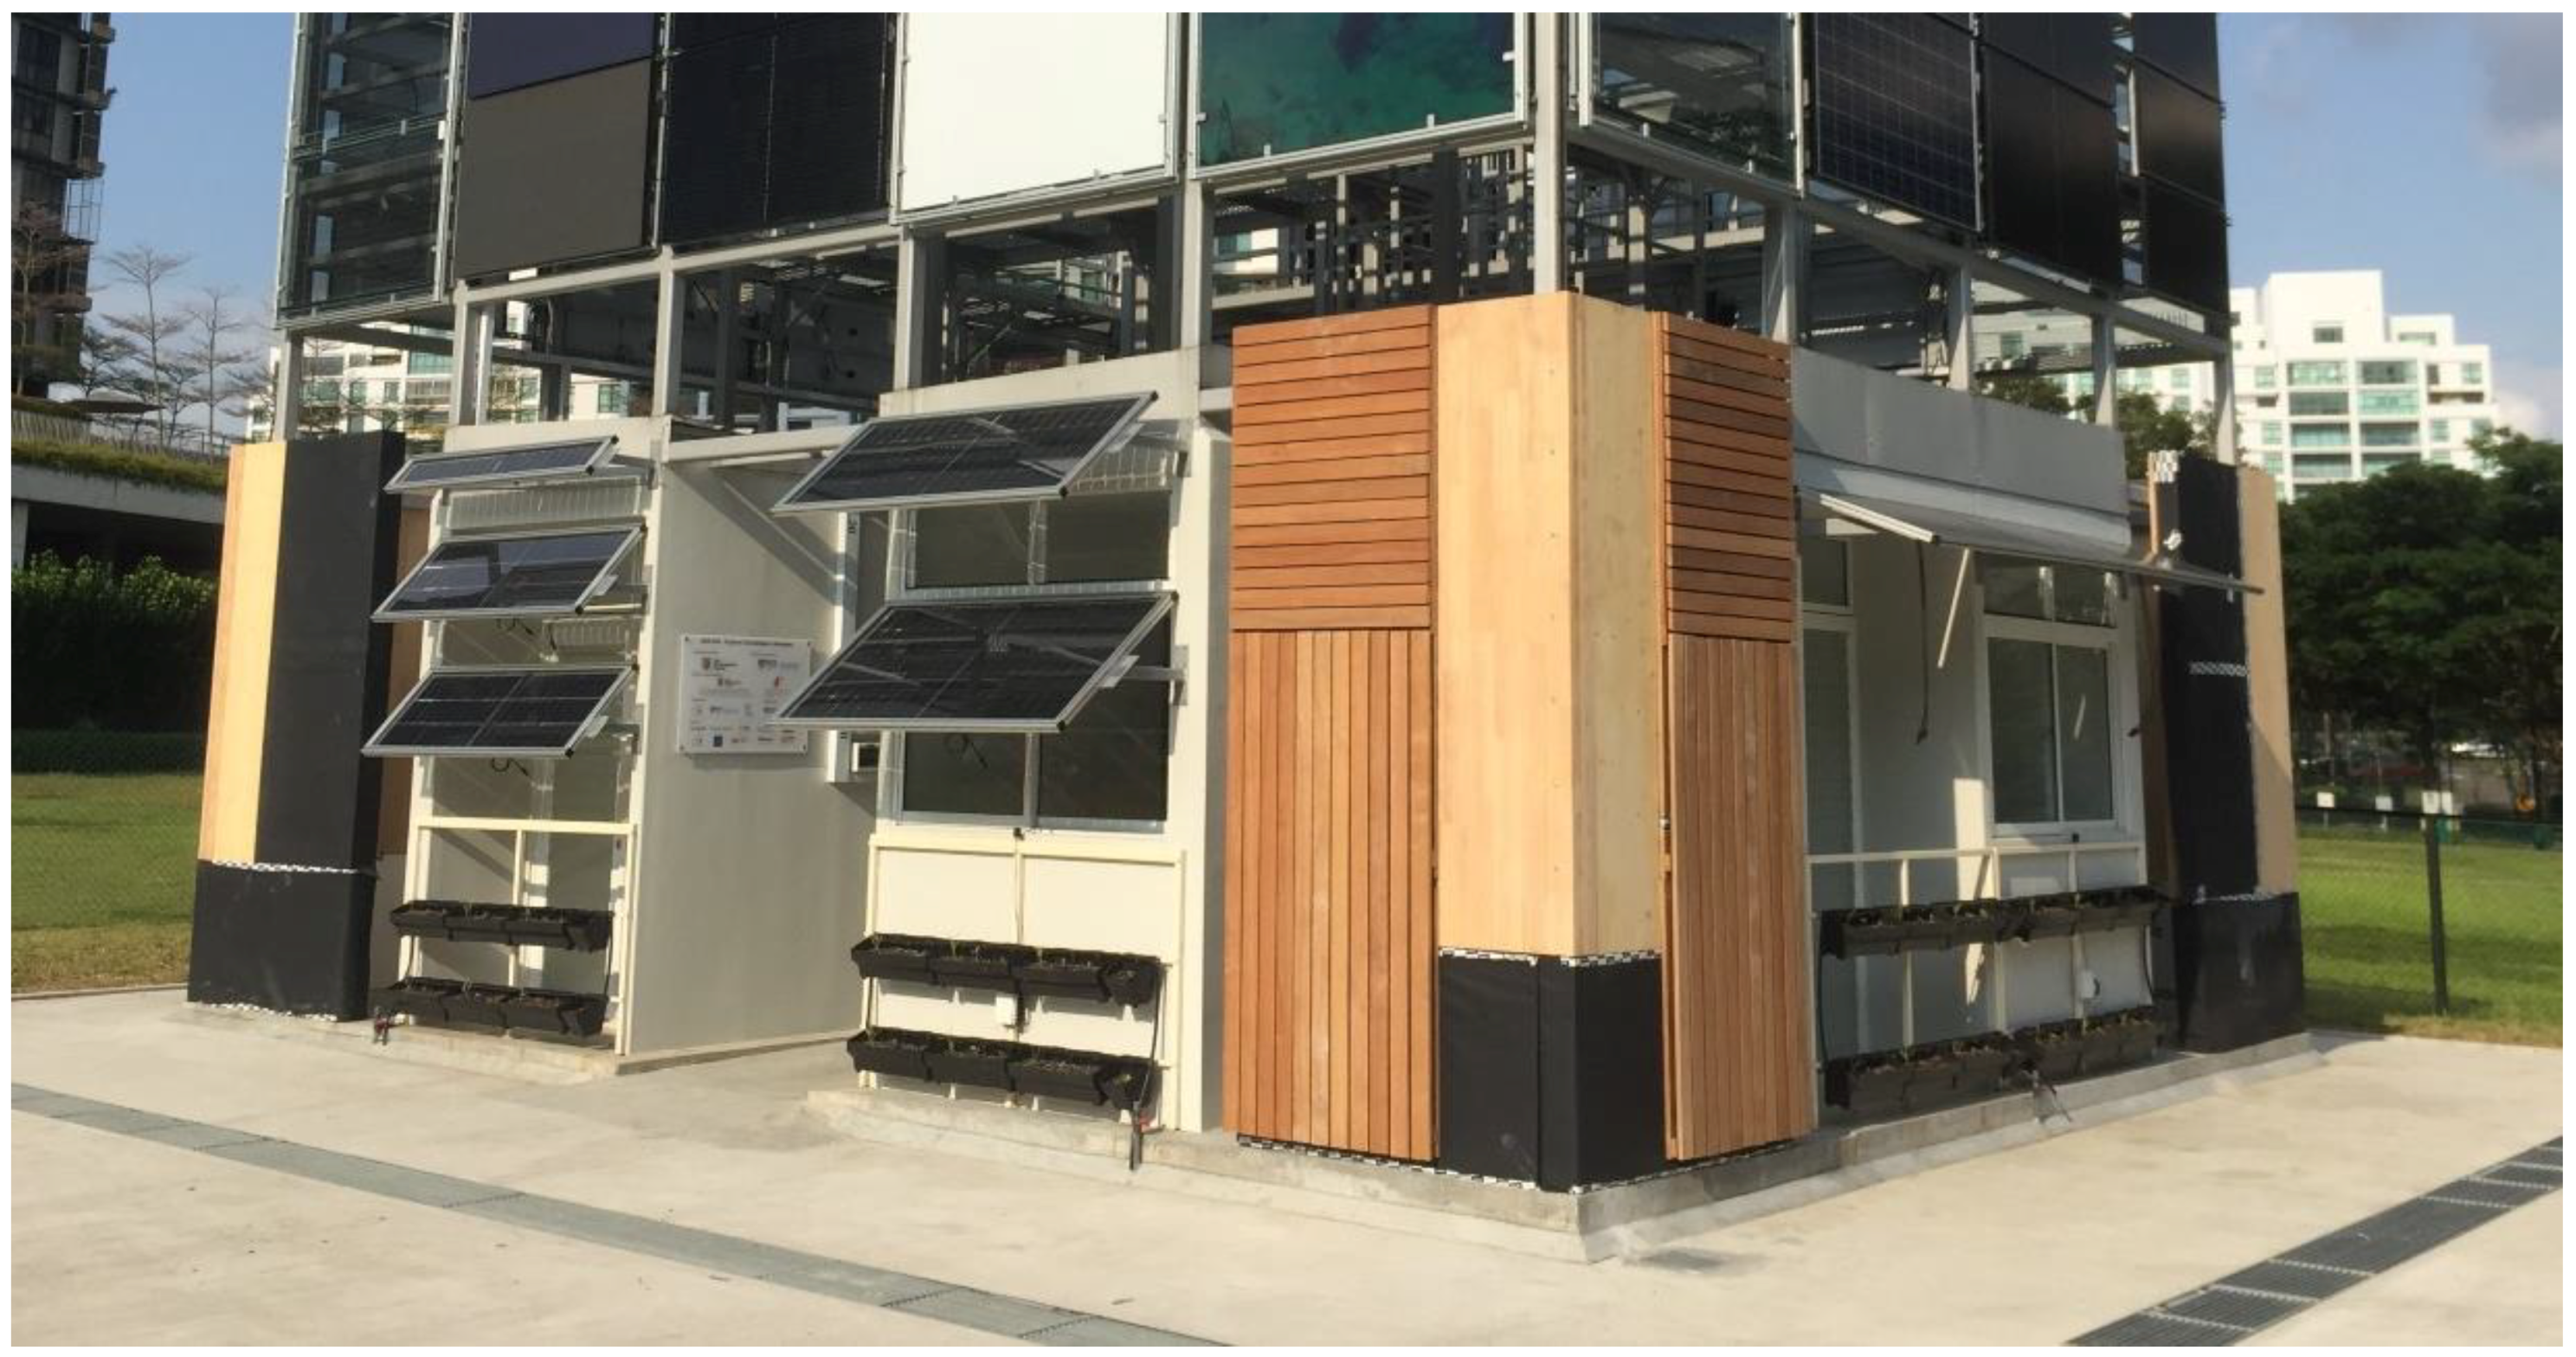
4. Final PF Arrangements for T2 Lab
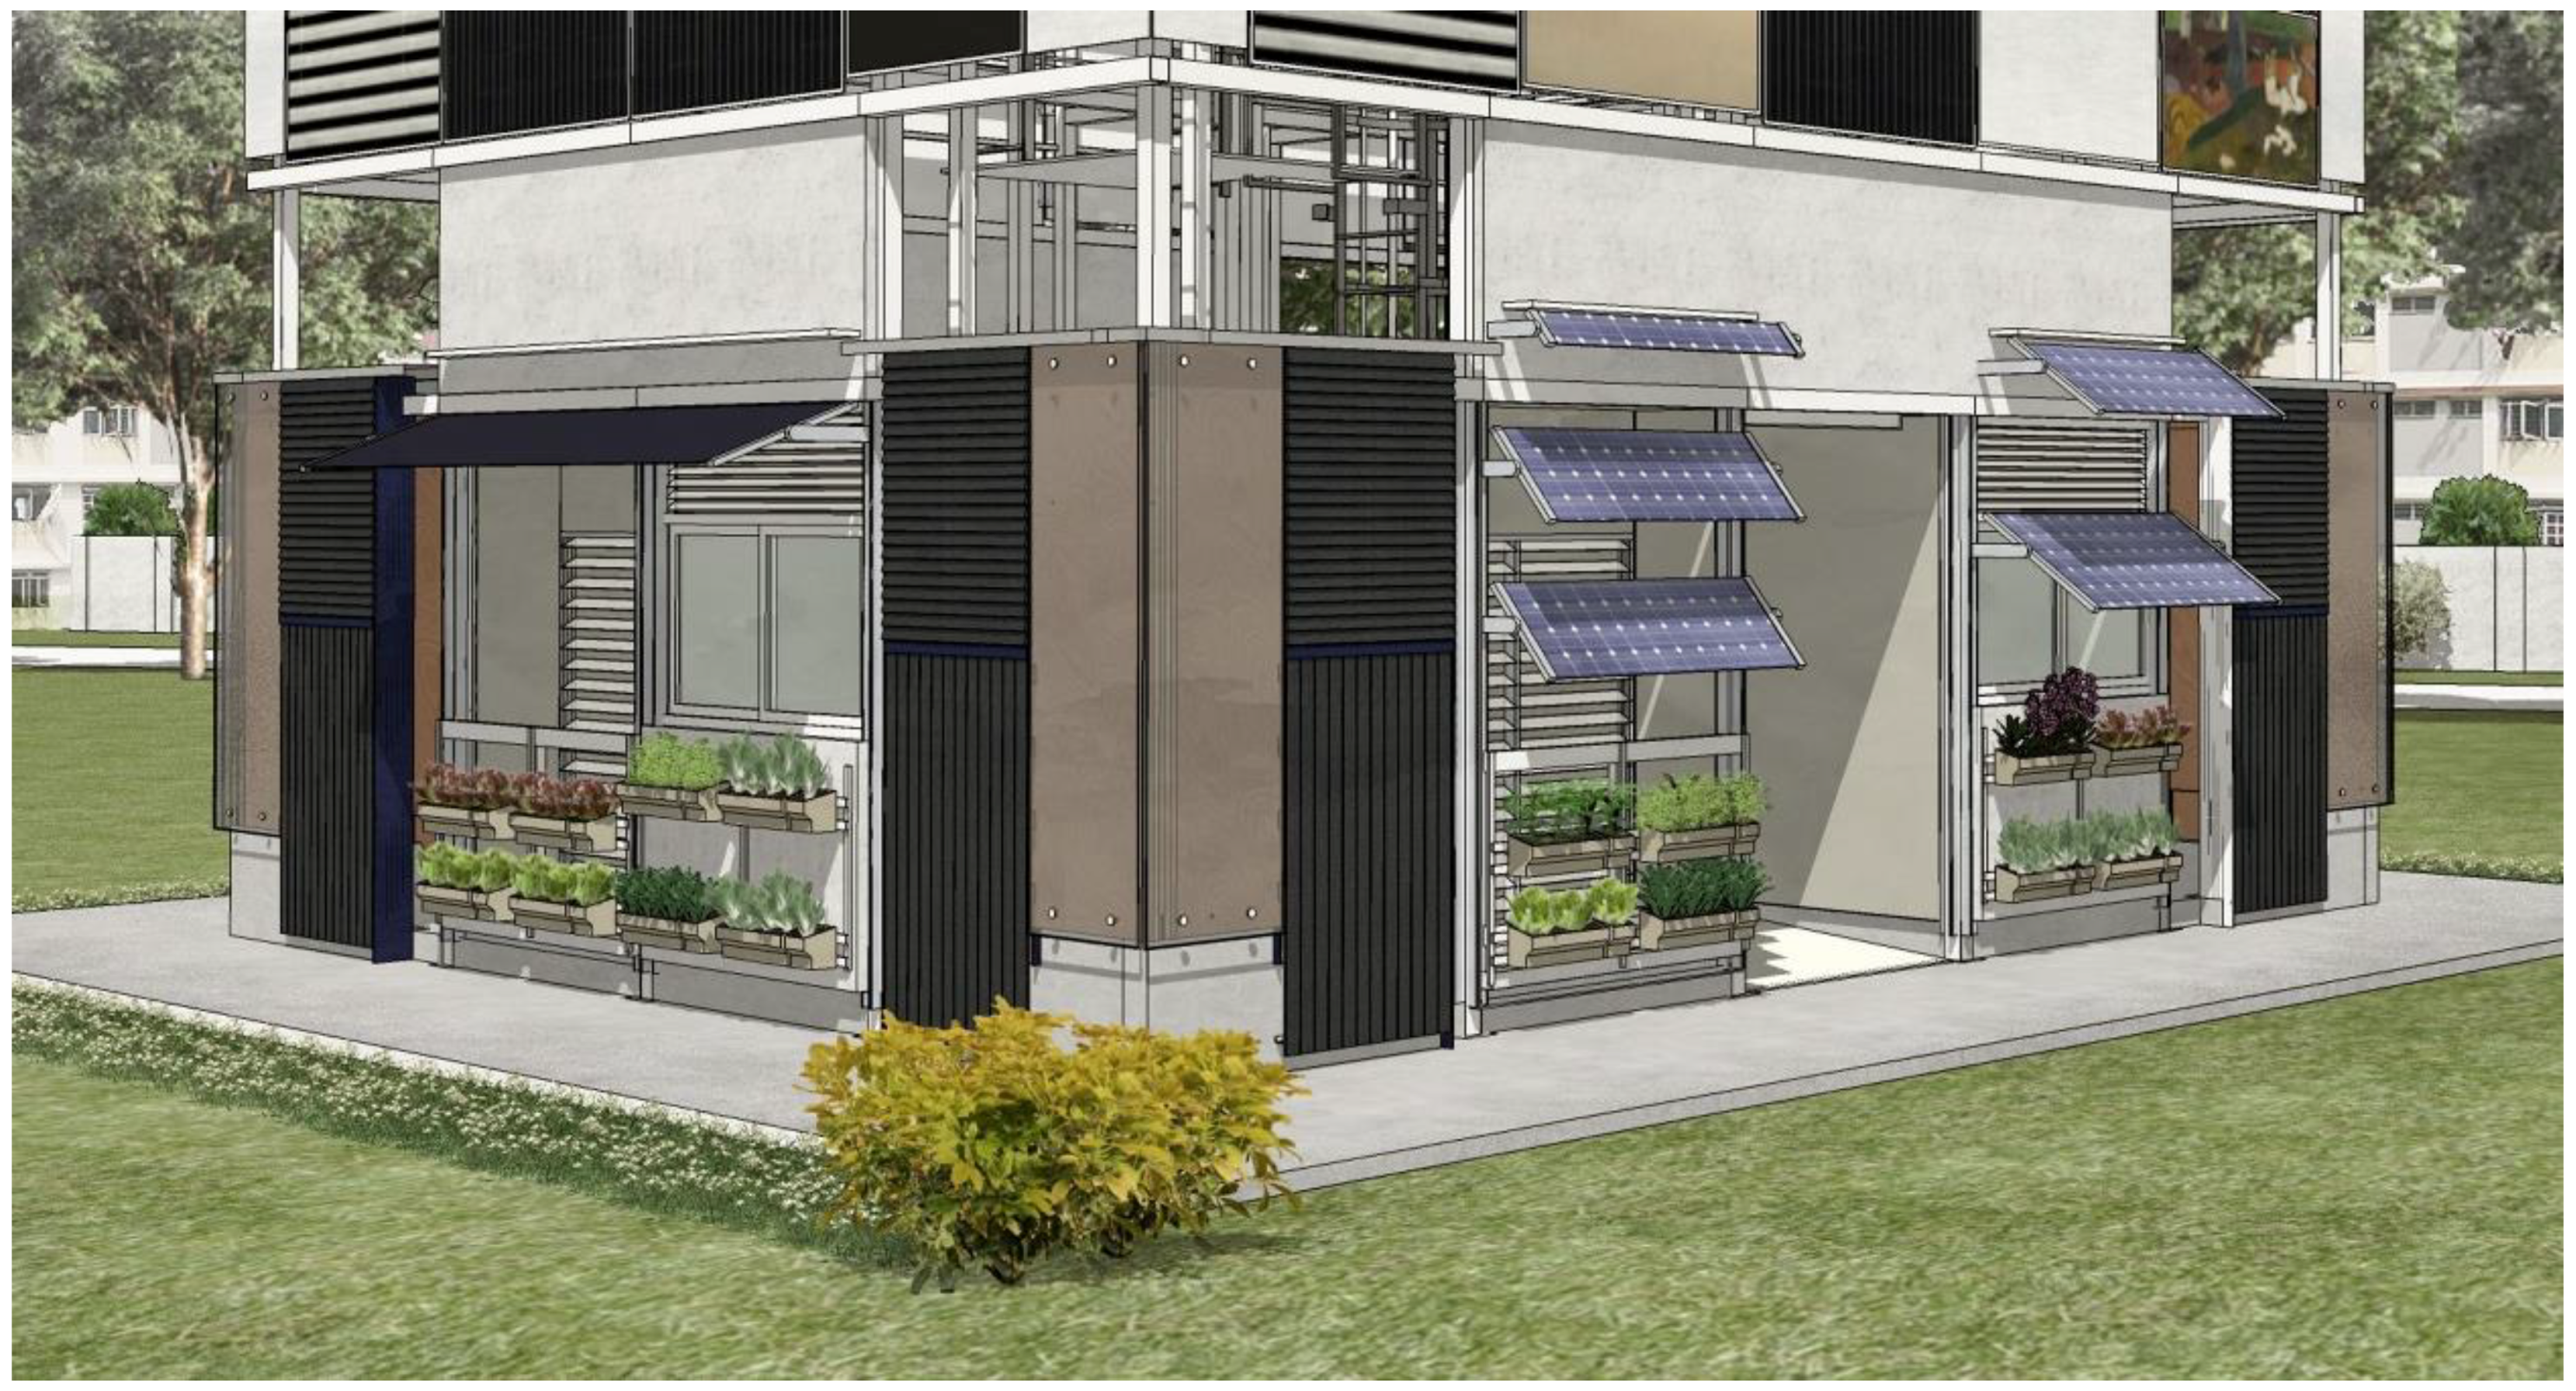
The main objective of the MCDM method in obtaining eight optimal façade arrangements was to implement them at the T2 Lab. However, several contextual, practical and research-related reasons made the actual façade arrangement to be installed at the T2 Lab façades somewhat different.
Regarding the context, it should be noted that the T2 Lab is located in an open lawn, in between three high-rise residential towers accommodating university staff on the South-East side and public housing (HDB) buildings on the North-West side. One of the conditions stipulated by the Urban Redevelopment Authority (URA) in Singapore to allow using the terrain for research purposes was to ensure that no reflection of sunlight is produced from the PV modules onto façades of the surrounding residential buildings. In order to meet this condition, a raytracing study was conducted to verify if the optimal tilt angles from each façade do not cause reflection towards neighbouring façades. With the exception of EBF, all other façades had to be adjusted. This means that most PV tilt angles had to be changed to 20°.
With regard to practical considerations, some PV modules were donated by a collaborating institution. The dimensions of PV modules and quantity were fixed, therefore, the overall shading dimensions had to be adjusted and unified for the two façades on the north and the two façades on the South orientations. Additionally, the pre-designed window with two fixed sections on the East and West façades does not agree with the optimal position of the 3 PV panels. Therefore, the best designs with 2 PV panels were applied.
In addition to the limited amount of available PV modules, an online survey involving 100 PV experts and architects was conducted, as well as a survey among HDB residents, in order to obtain their feedback on several designs and other important issues such as accessibility and maintenance. One of the more consistent results referred to the preference, both of experts and residents, for the single PV panel over the double or triple panels.
Other changes, such as using three rows of planters on the West façade, were also applied to test the limits of the façade arrangements on the potential food and energy production. Considering those elements,
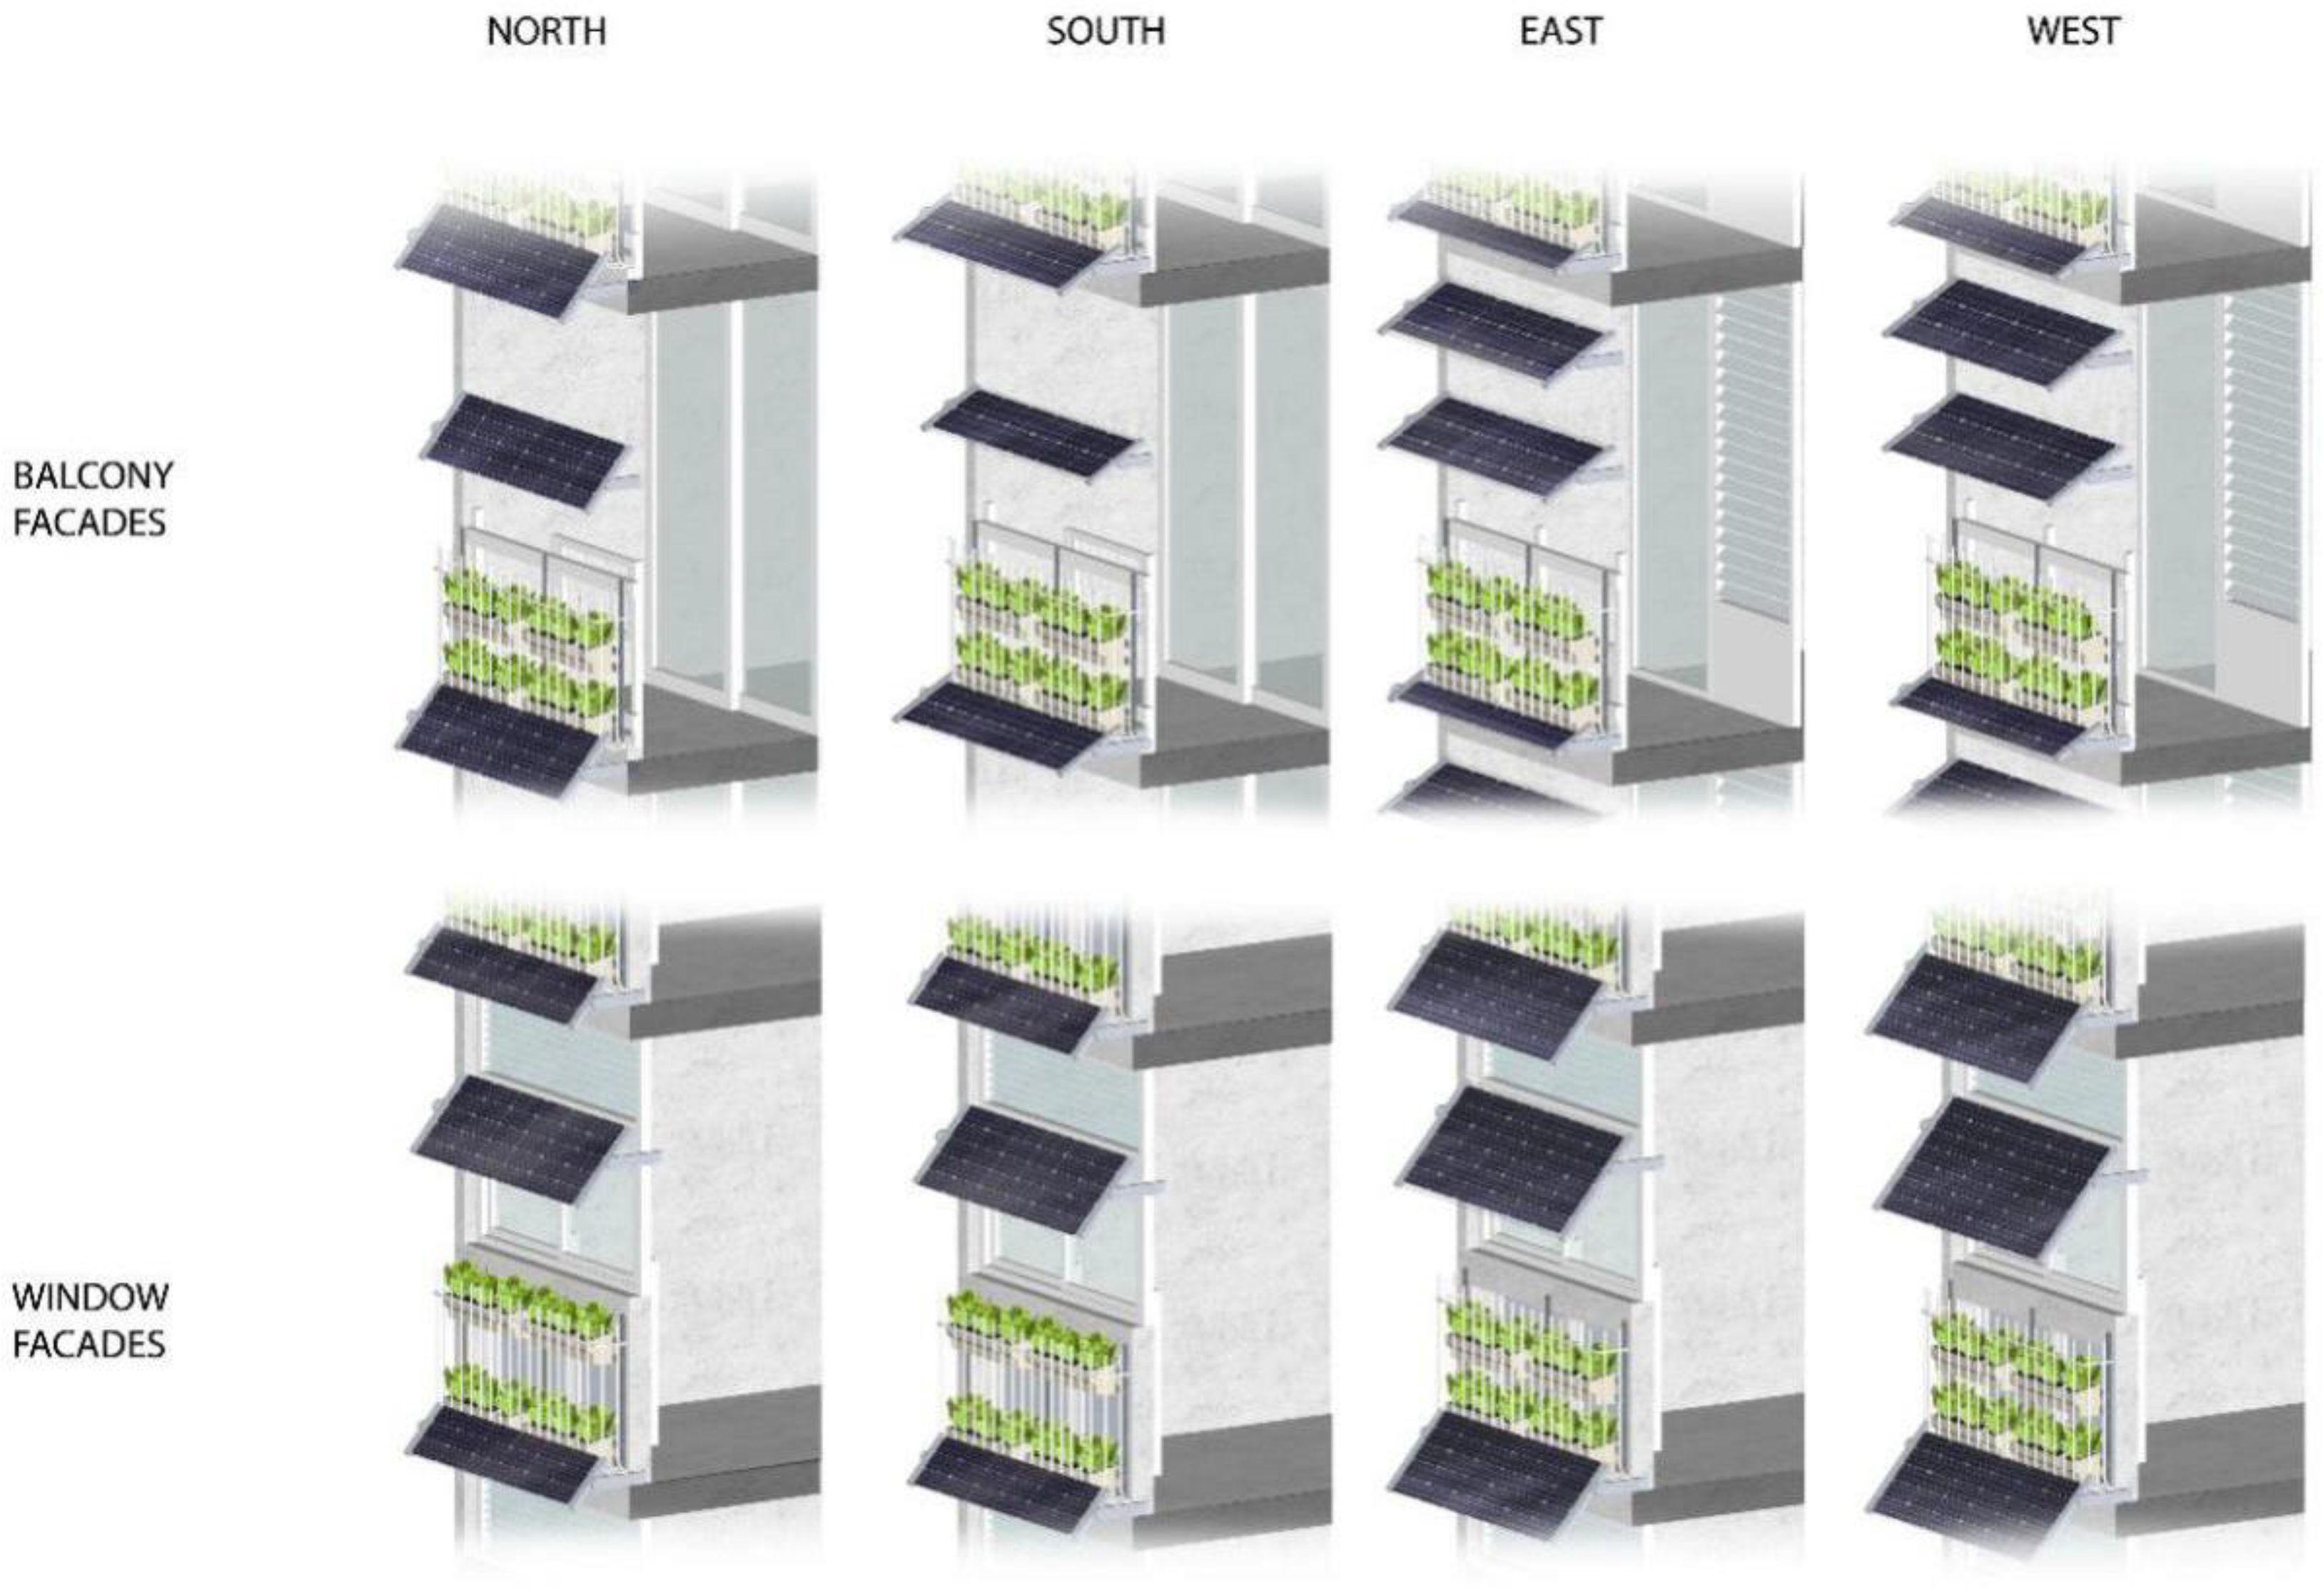
Table 6 and
Figure 7 present the final PFs arrangement to be implemented at the T
2 Lab.
5. Discussion
The results demonstrated that incident solar radiation according to façade orientation is the most crucial environmental variable defining the optimal PF arrangements. As expected, the East and West façades require more extended solar protection at the expense of the average lower outdoor view angle. However, pursuant to passive design strategies in residential public housing, most facades face orientations at angles not larger than 30° from North and South, which drastically reduces the protection angle and therefore the dimensions and tilt angle of the shading PV panel. The smaller area of facades facing East and West orientations are often blank walls that are more appropriate for the installation of vertical BIPV in substitution of conventional cladding [
20]. Those facades with windows correspond with the private areas of the housing unit, which do not require ample view angles.
On the other hand, unlike previous studies which determined the preferable PV sun-shading tilt angles to be between 20° and 30° [
24,
29,
30], the optimal tilt angles in this study are 50° for most cases considering other important criteria such as solar protection and the sunlight required by the planters. However, higher tilt angles are not recommended in dense urban environments due to the reflection from PV panels to neighboring buildings. Therefore, for East and West facades, larger number of PV panels with smaller tilt angle and dimensions is recommended.
Regarding the potential electricity generation, although the share of solar generation may be small at nation scale due to the extremely high energy demand in the Singapore’s industrial sector (43% of electricity) [
72], the share of solar generation in the residential sector could be considerably higher, taking into account that the household electricity consumption is 15% of the total electricity consumption. Therefore achieving 40% of the total electricity demand by the PV shading devices on north and south facades, is remarkable considering the shading effect of upper levels. However, this output should be lower for the facades located at lower levels considering the effect of the neighboring buildings in high density areas. The overshadowing effect and reduction of the sky view factor may be larger for east and west facades. The specific dimensions of PV modules according to façade type and orientation requires design customization. While this may lead to initial higher investment, BIPV customization can respond to some of the barriers on the application of conventional BIPV in terms of aesthetics, efficiency, and flexibility [
73]. The benefits of customized BIPV applications are becoming more evident with the fast acceptance and adaptation of industry for their production. Therefore, the fabrication of affordable customized shading PV panels and the market availability of a wide diversity of design and dimensions is expected to be the norm in the future.
Regarding the arrangement of farming planters, the results are quite similar for all PF variants that accept only two rows of planters at relatively low height to reduce the impact of the PV panels above them. This optimal position, however, requires the use of lower operable fenestrations to access the planters. Safety elements should be incorporated in the façade system, as shown in
Figure 6, especially for the WF. The production of vegetables on the facades is not meant to address the overall vegetables demand. Instead, it should complement other urban farming activities ranging from individual farming installations on each façade and community gardens in each neighborhood to public intensive farming facilities at district-scale. While the PV shading devices would involve a top-down implementation from HDB authorities to complement the energy supply from the grid, the implementation of the PF farming system may be left at the discretion of a household according to their needs and preferences. Despite the limited space for installation of the planters on facades, a façade of 20 m in length (two opposite 10 m facades on a typical HDB apartment) could enable each household to produce an estimated 35 to 66 kg of leafy vegetables. The amount varies according to the façade orientation and the type of crops. This amount represents 55–103% of the average leafy vegetables consumption of a 4-member household in Singapore (ca. 16 kg per year) [
2]. The system also aims to reduce the cost and frequency of maintenance. Laborious activities are unnecessary due to the ergonomic considerations. For example, manual watering is required only once a day or once every two days since the planters include water reservoirs. Fertilizer should be applied once every two to three weeks and pesticide spray, once every two months. Harvesting can be done occasionally and leaves can be plucked when needed or when reaching the desired size.
Both systems can be implemented in higher latitudes providing a similar optimization framework in order to maximize energy and food production, while also complying with indoor thermal and visual performances.
6. Conclusions
Responding to the particular situation of Singapore in relation to the lack of agricultural areas for food production, the lack of energy resources and therefore, the high dependency on energy and food imports, energy, and food, this paper proposes the concept of productive façades (PF) for residential buildings that integrate PV and farming systems.
A design optimization methodology is described utilizing the Grasshopper parametric tool and VIKOR optimization method. The method used in this paper, which was applied to public housing residential building façades in Singapore, proved to be effective for optimizing complex façade designs in which multiple conflicting criteria were assessed. The optimization method allowed automated and manual procedures that both increased the computational efficiency within a limited time, and user control over the design variants and results.
Optimal PF designs were adjusted according to context and available resources. The PF systems have been installed at the Tropical Technologies Lab and their performance in terms of energy and food production will be monitored for at least a year (to capture possible seasonal effects) in conjunction with their impact on indoor thermal and visual conditions. Further improvement of the PF prototypes will be conducted after collecting and analyzing the measurement data for the first six months. Design parameters such as the number of planter rows, the amount of PV panels per façade, their dimensions, tilt angle, and position will be re-evaluated, especially for the East and West facades.
The PF concept in which food and energy-harvesting installations substitute other building envelope elements like sun shading, walls, and railings is a promising design direction that promotes resilience in residential buildings, especially in high-density urban areas in tropical Asia. It is also in line with the broader concept of continuous productive urban landscapes [
74] aiming at integrating energy and food production in urban areas. The design development method and applicability of the results can be of great value for planners, urban designers, architects, engineers, and other environmental experts working towards carbon neutral and resilient urban areas at the low latitudes. Further refinement of the optimization method will be done by explicitly incorporating other criteria functions and extending its applicability to other climatic regions and building typologies.

 ,
, 


