Spatiotemporal Variance Assessment of Urban Rainstorm Waterlogging Affected by Impervious Surface Expansion: A Case Study of Guangzhou, China


Abstract
:1. Introduction
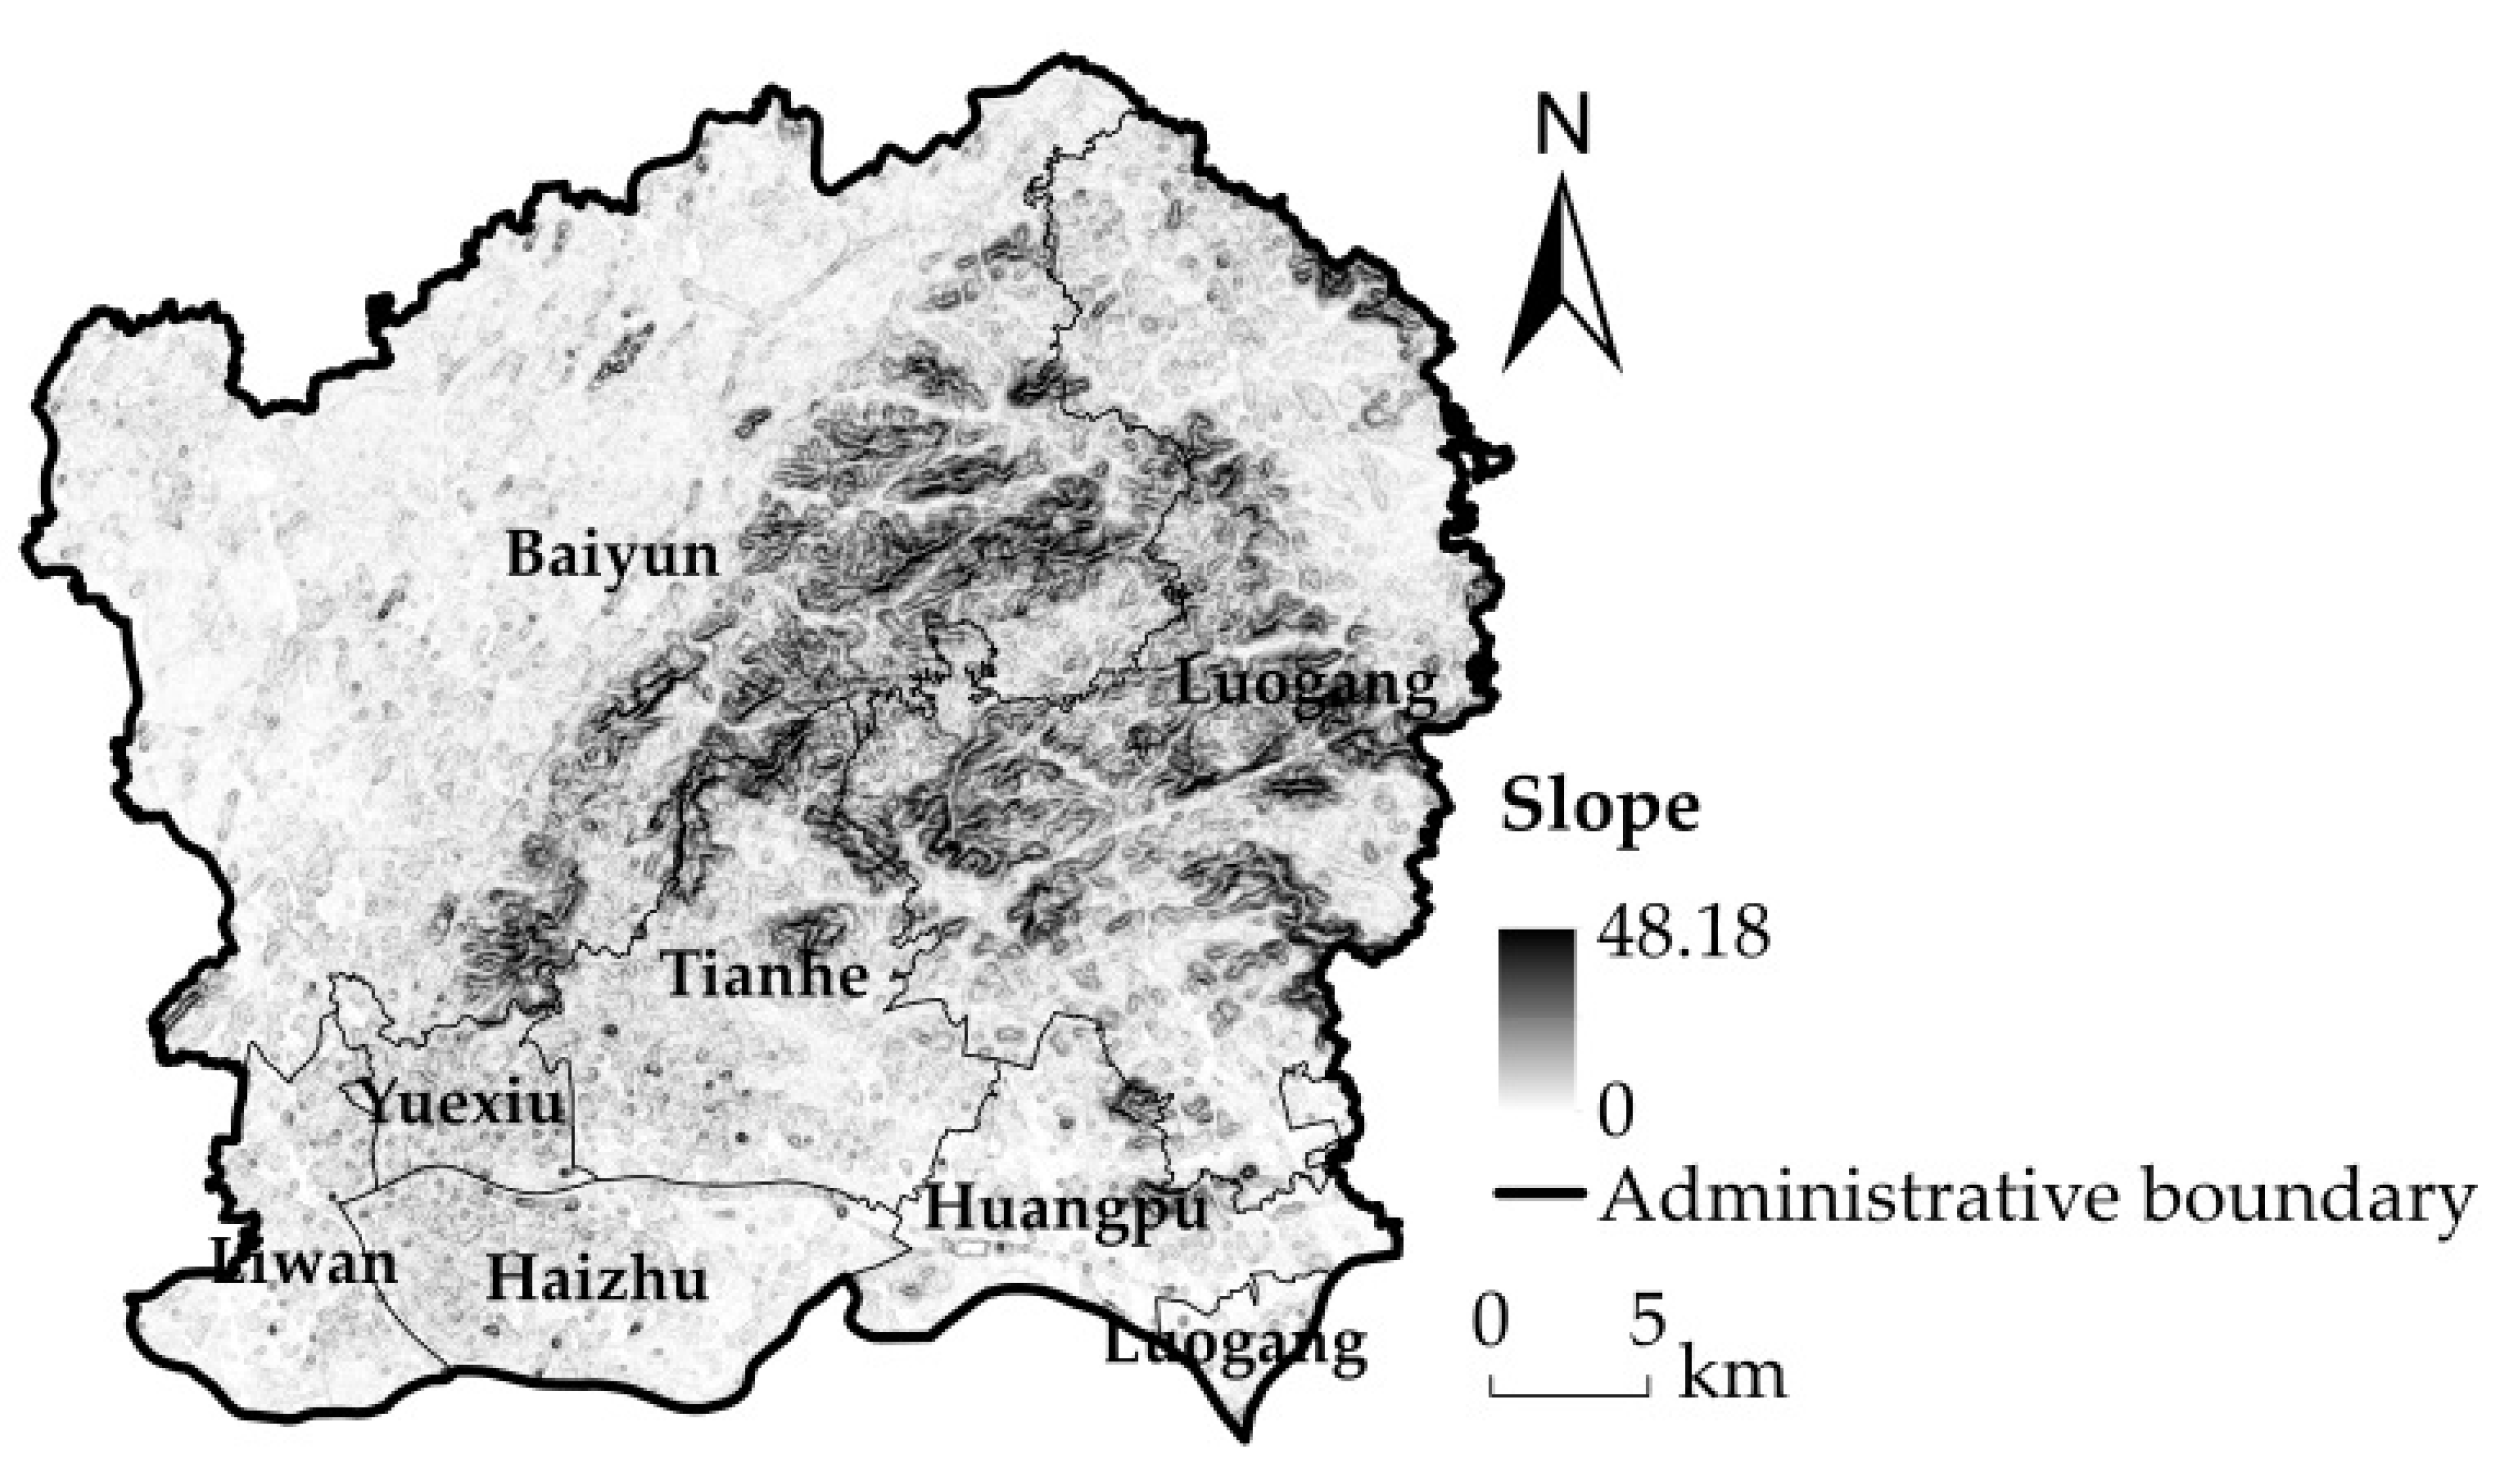
2. Study Area
3. Data and Methods
3.1. Data
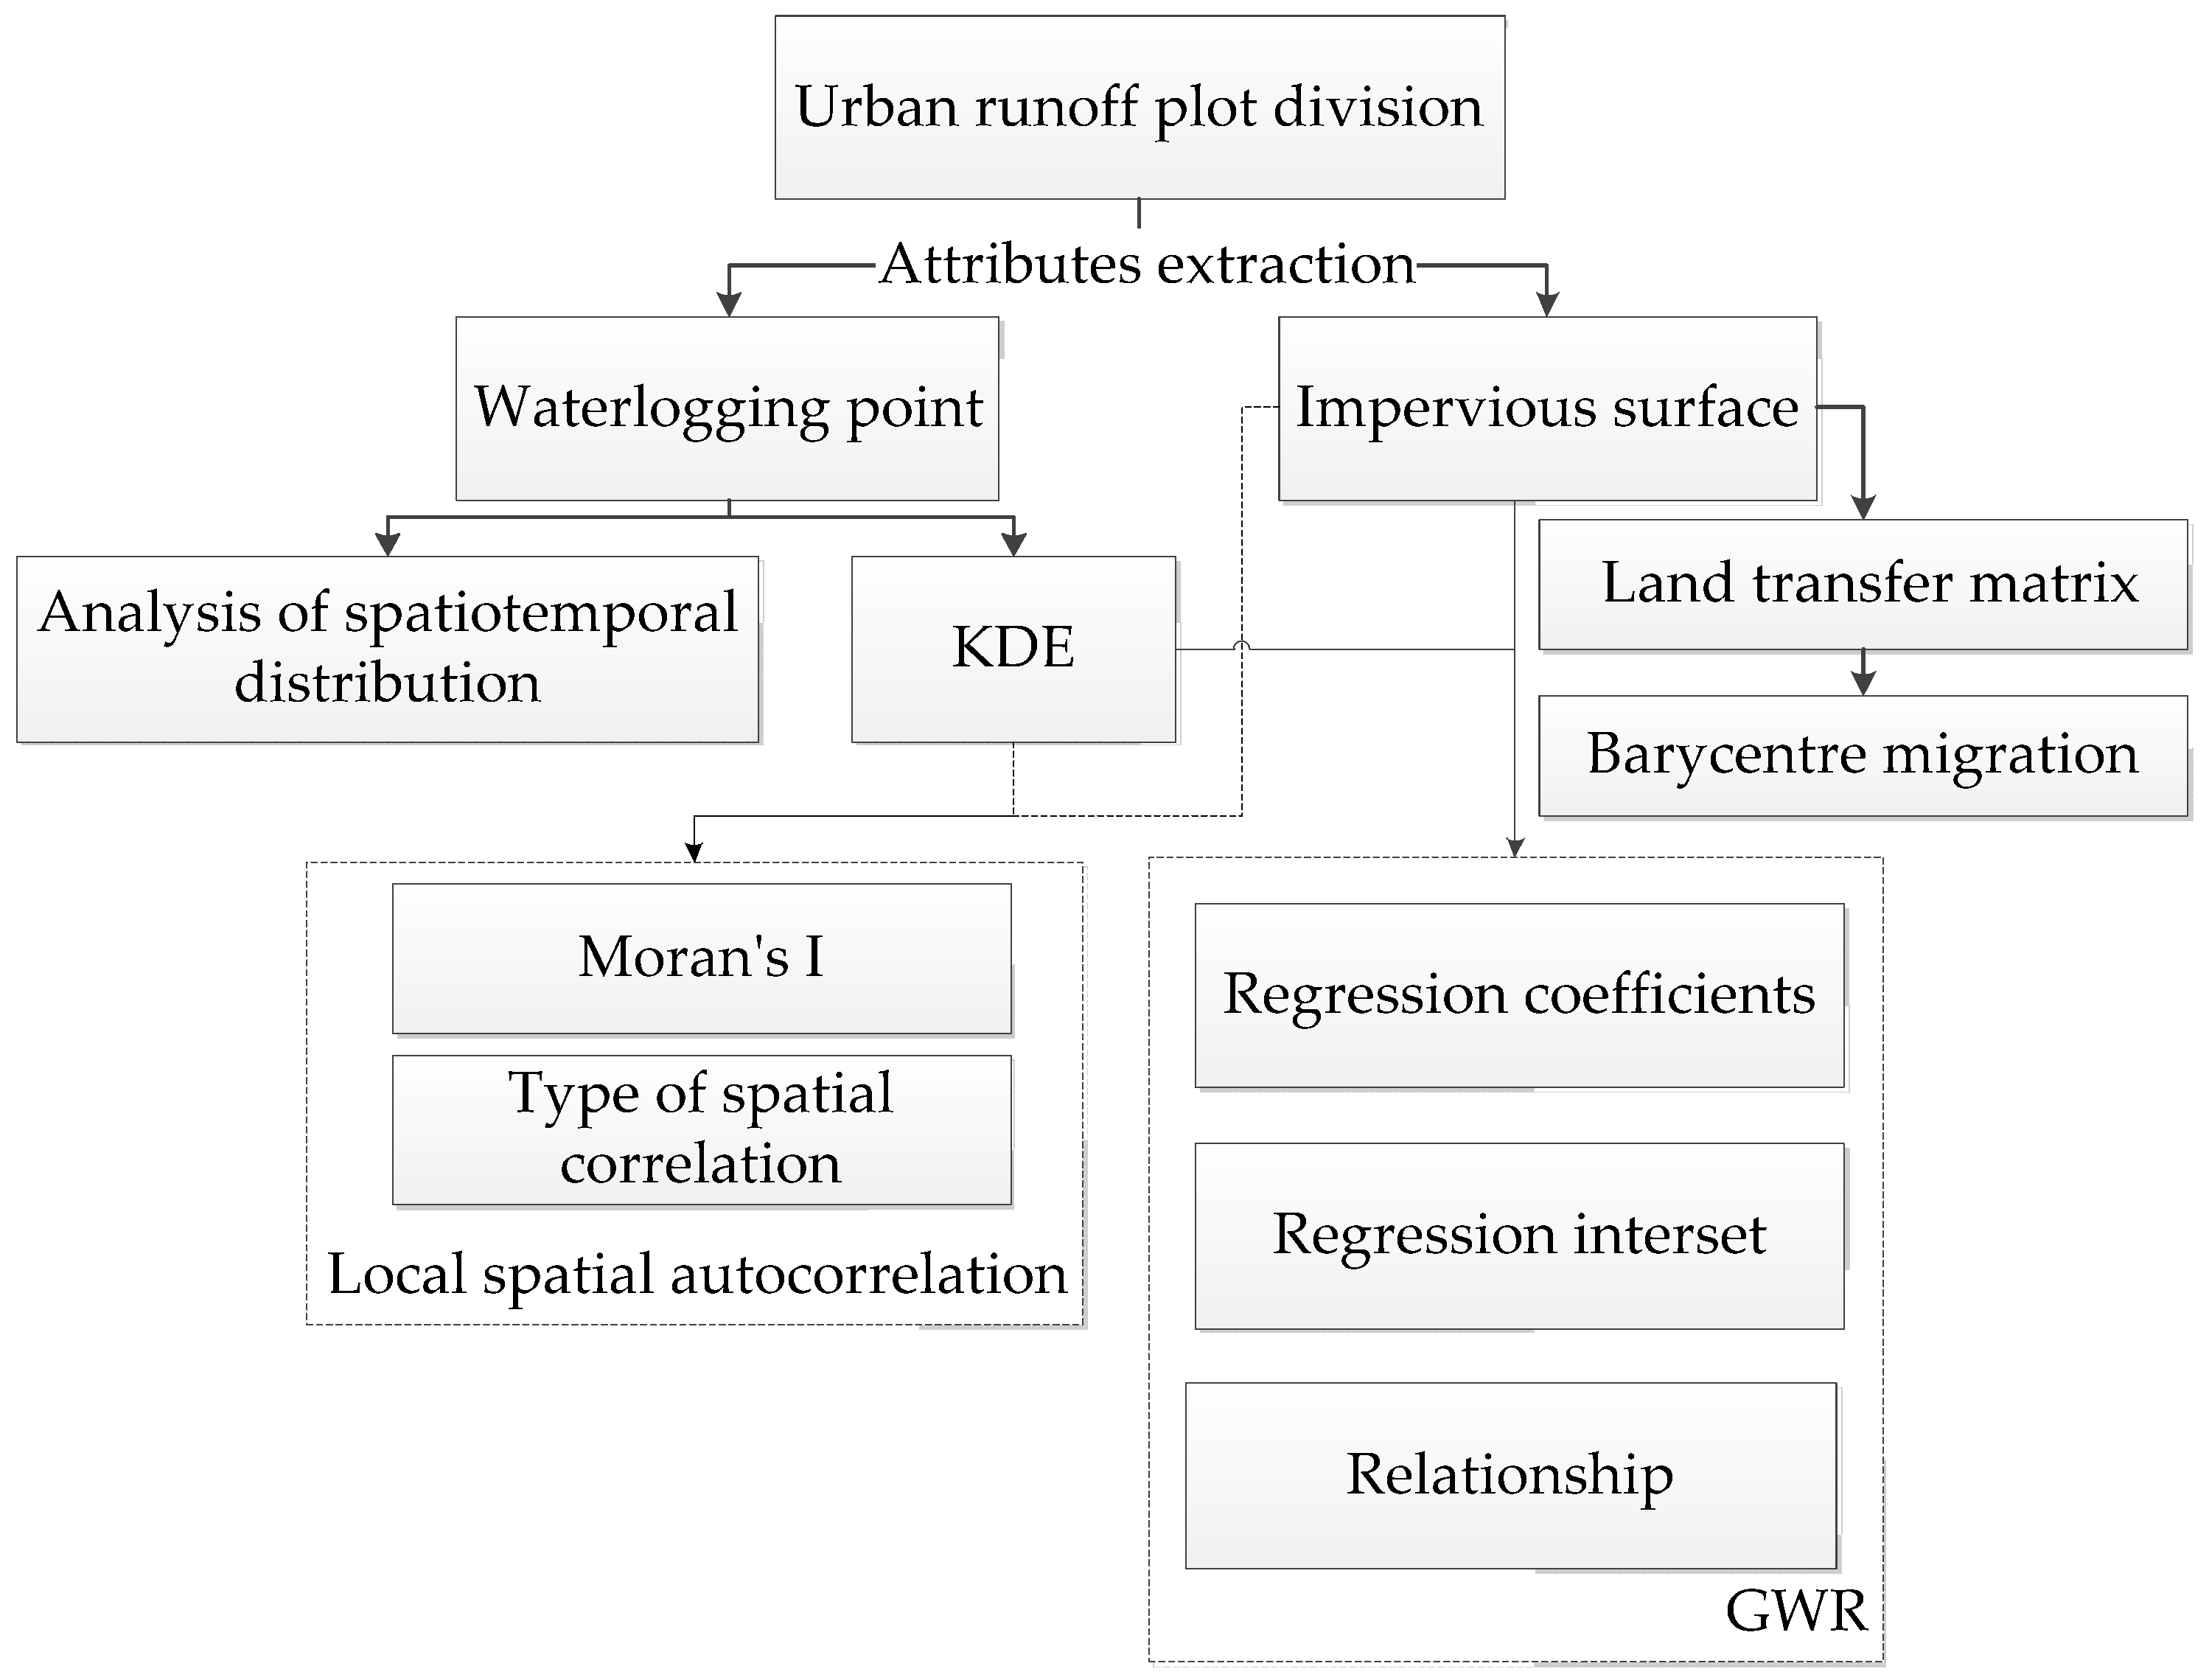
3.2. Spatiotemporal Variance Analysis Method
4. Result
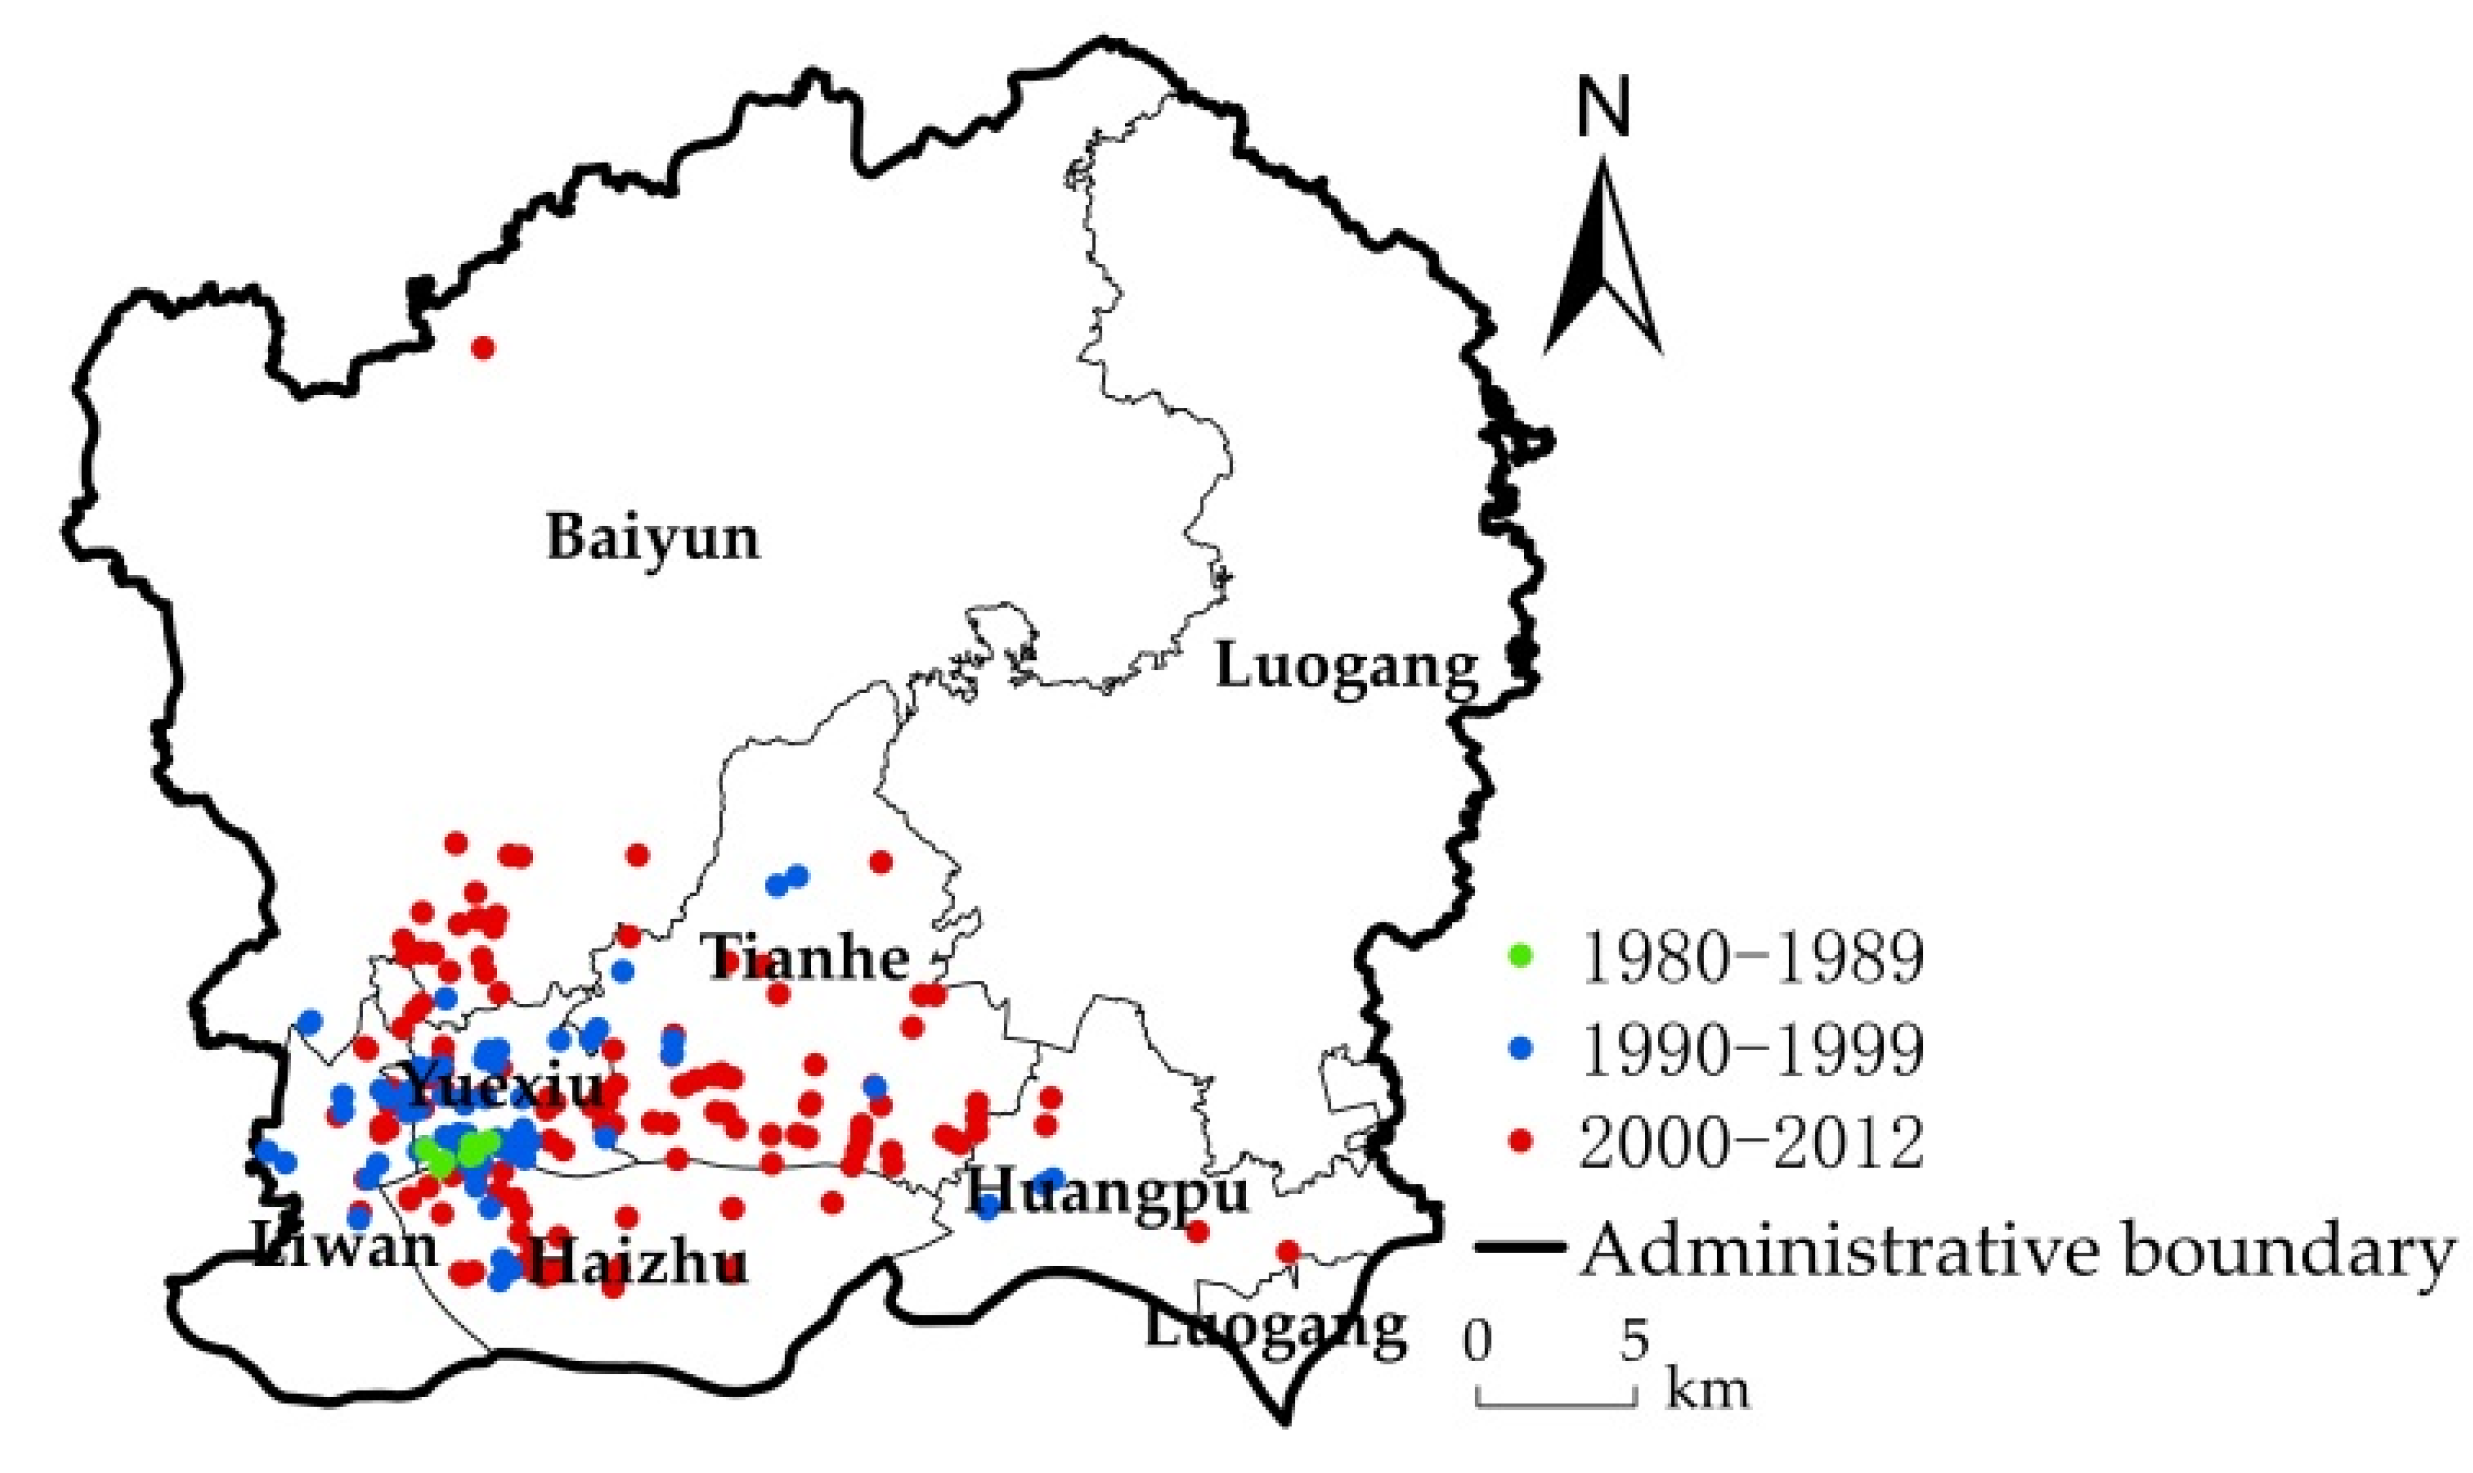
4.1. Spatiotemporal Evolution and Autocorrelation Analysis of Urban Rainstorm Waterlogging
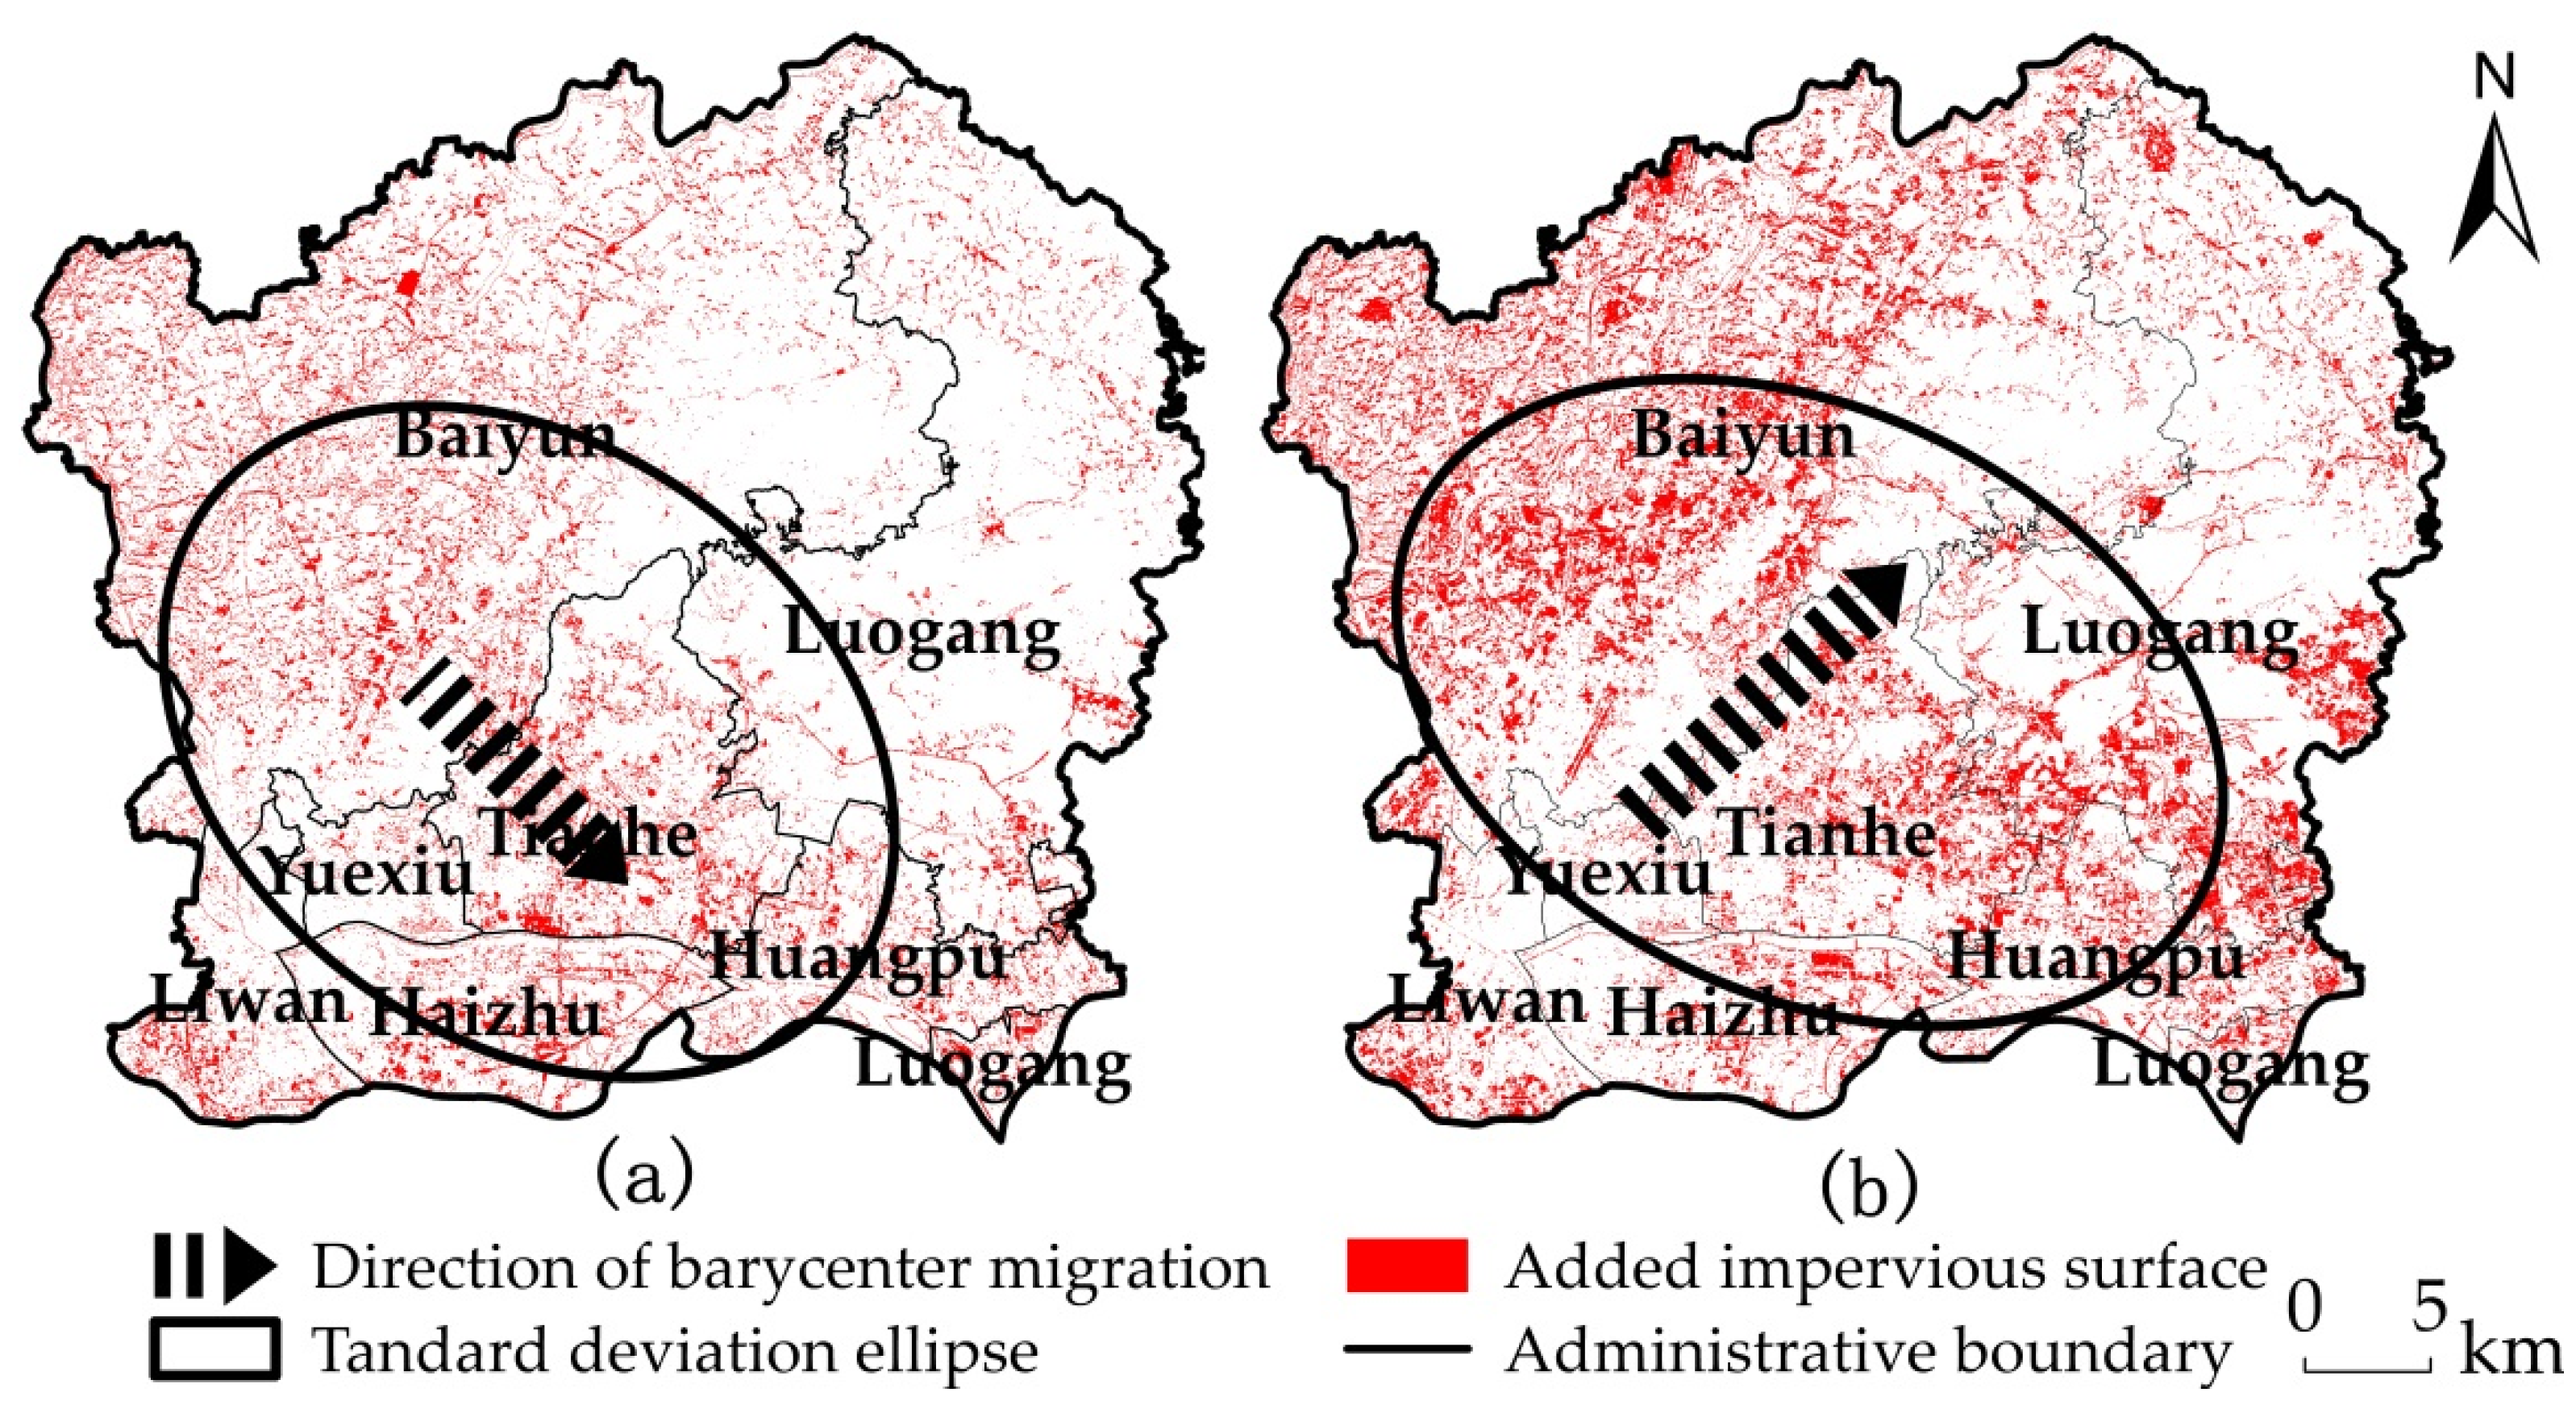
4.2. Expansion of Impervious Surface
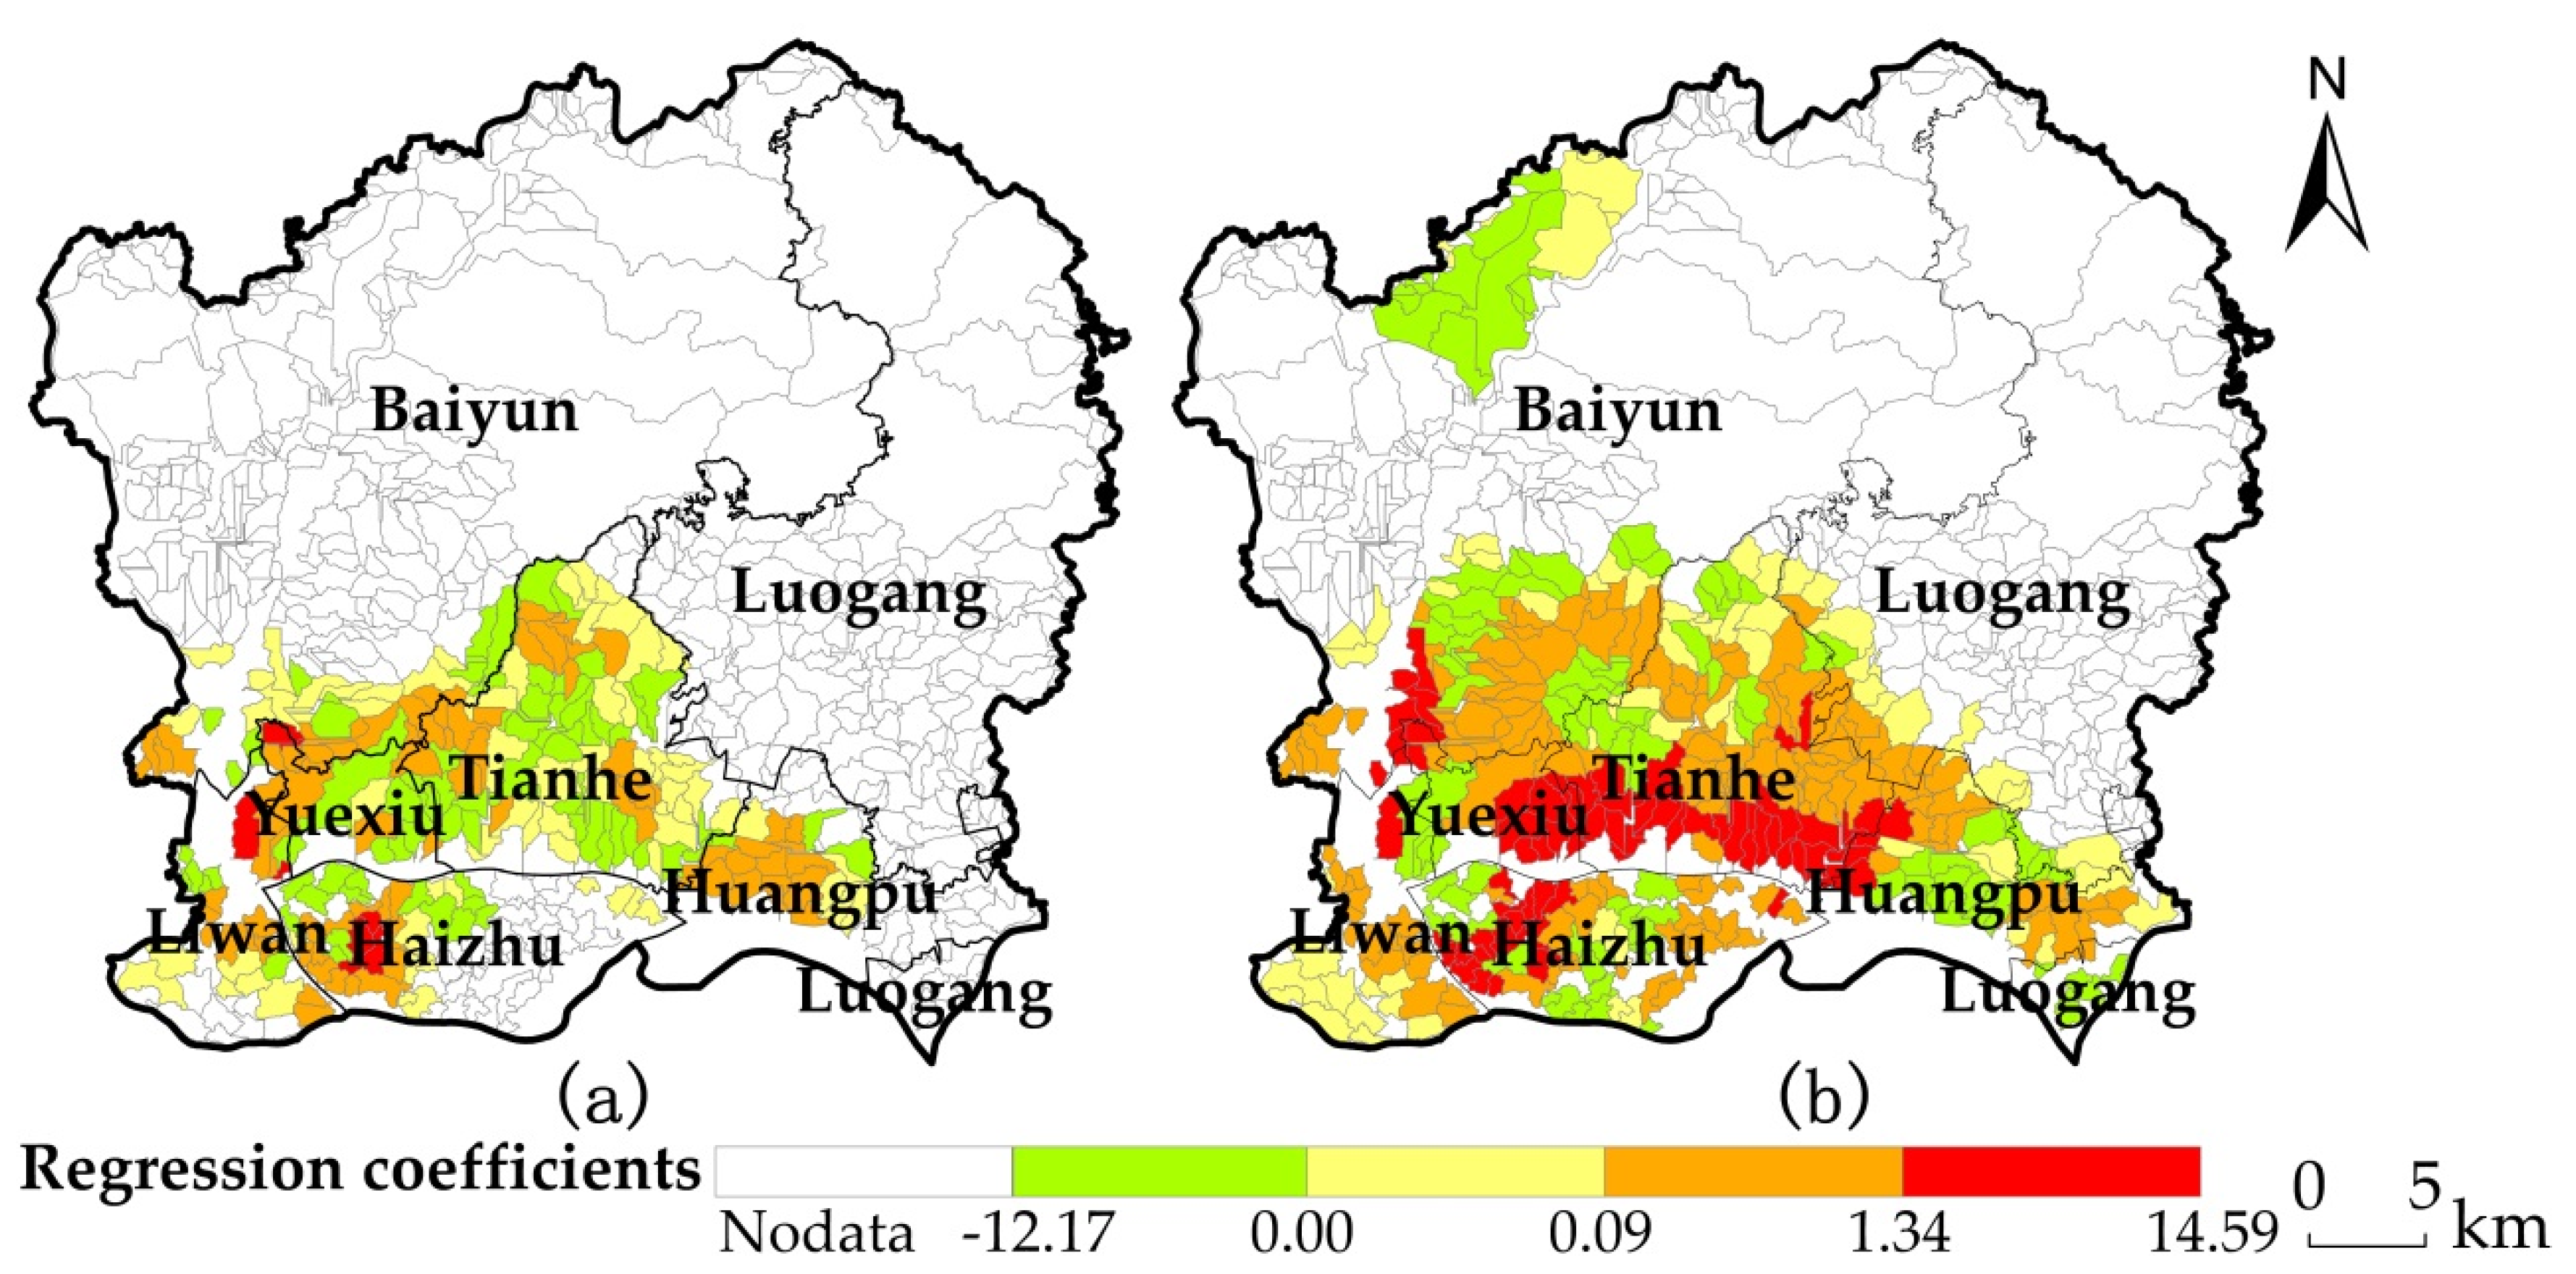
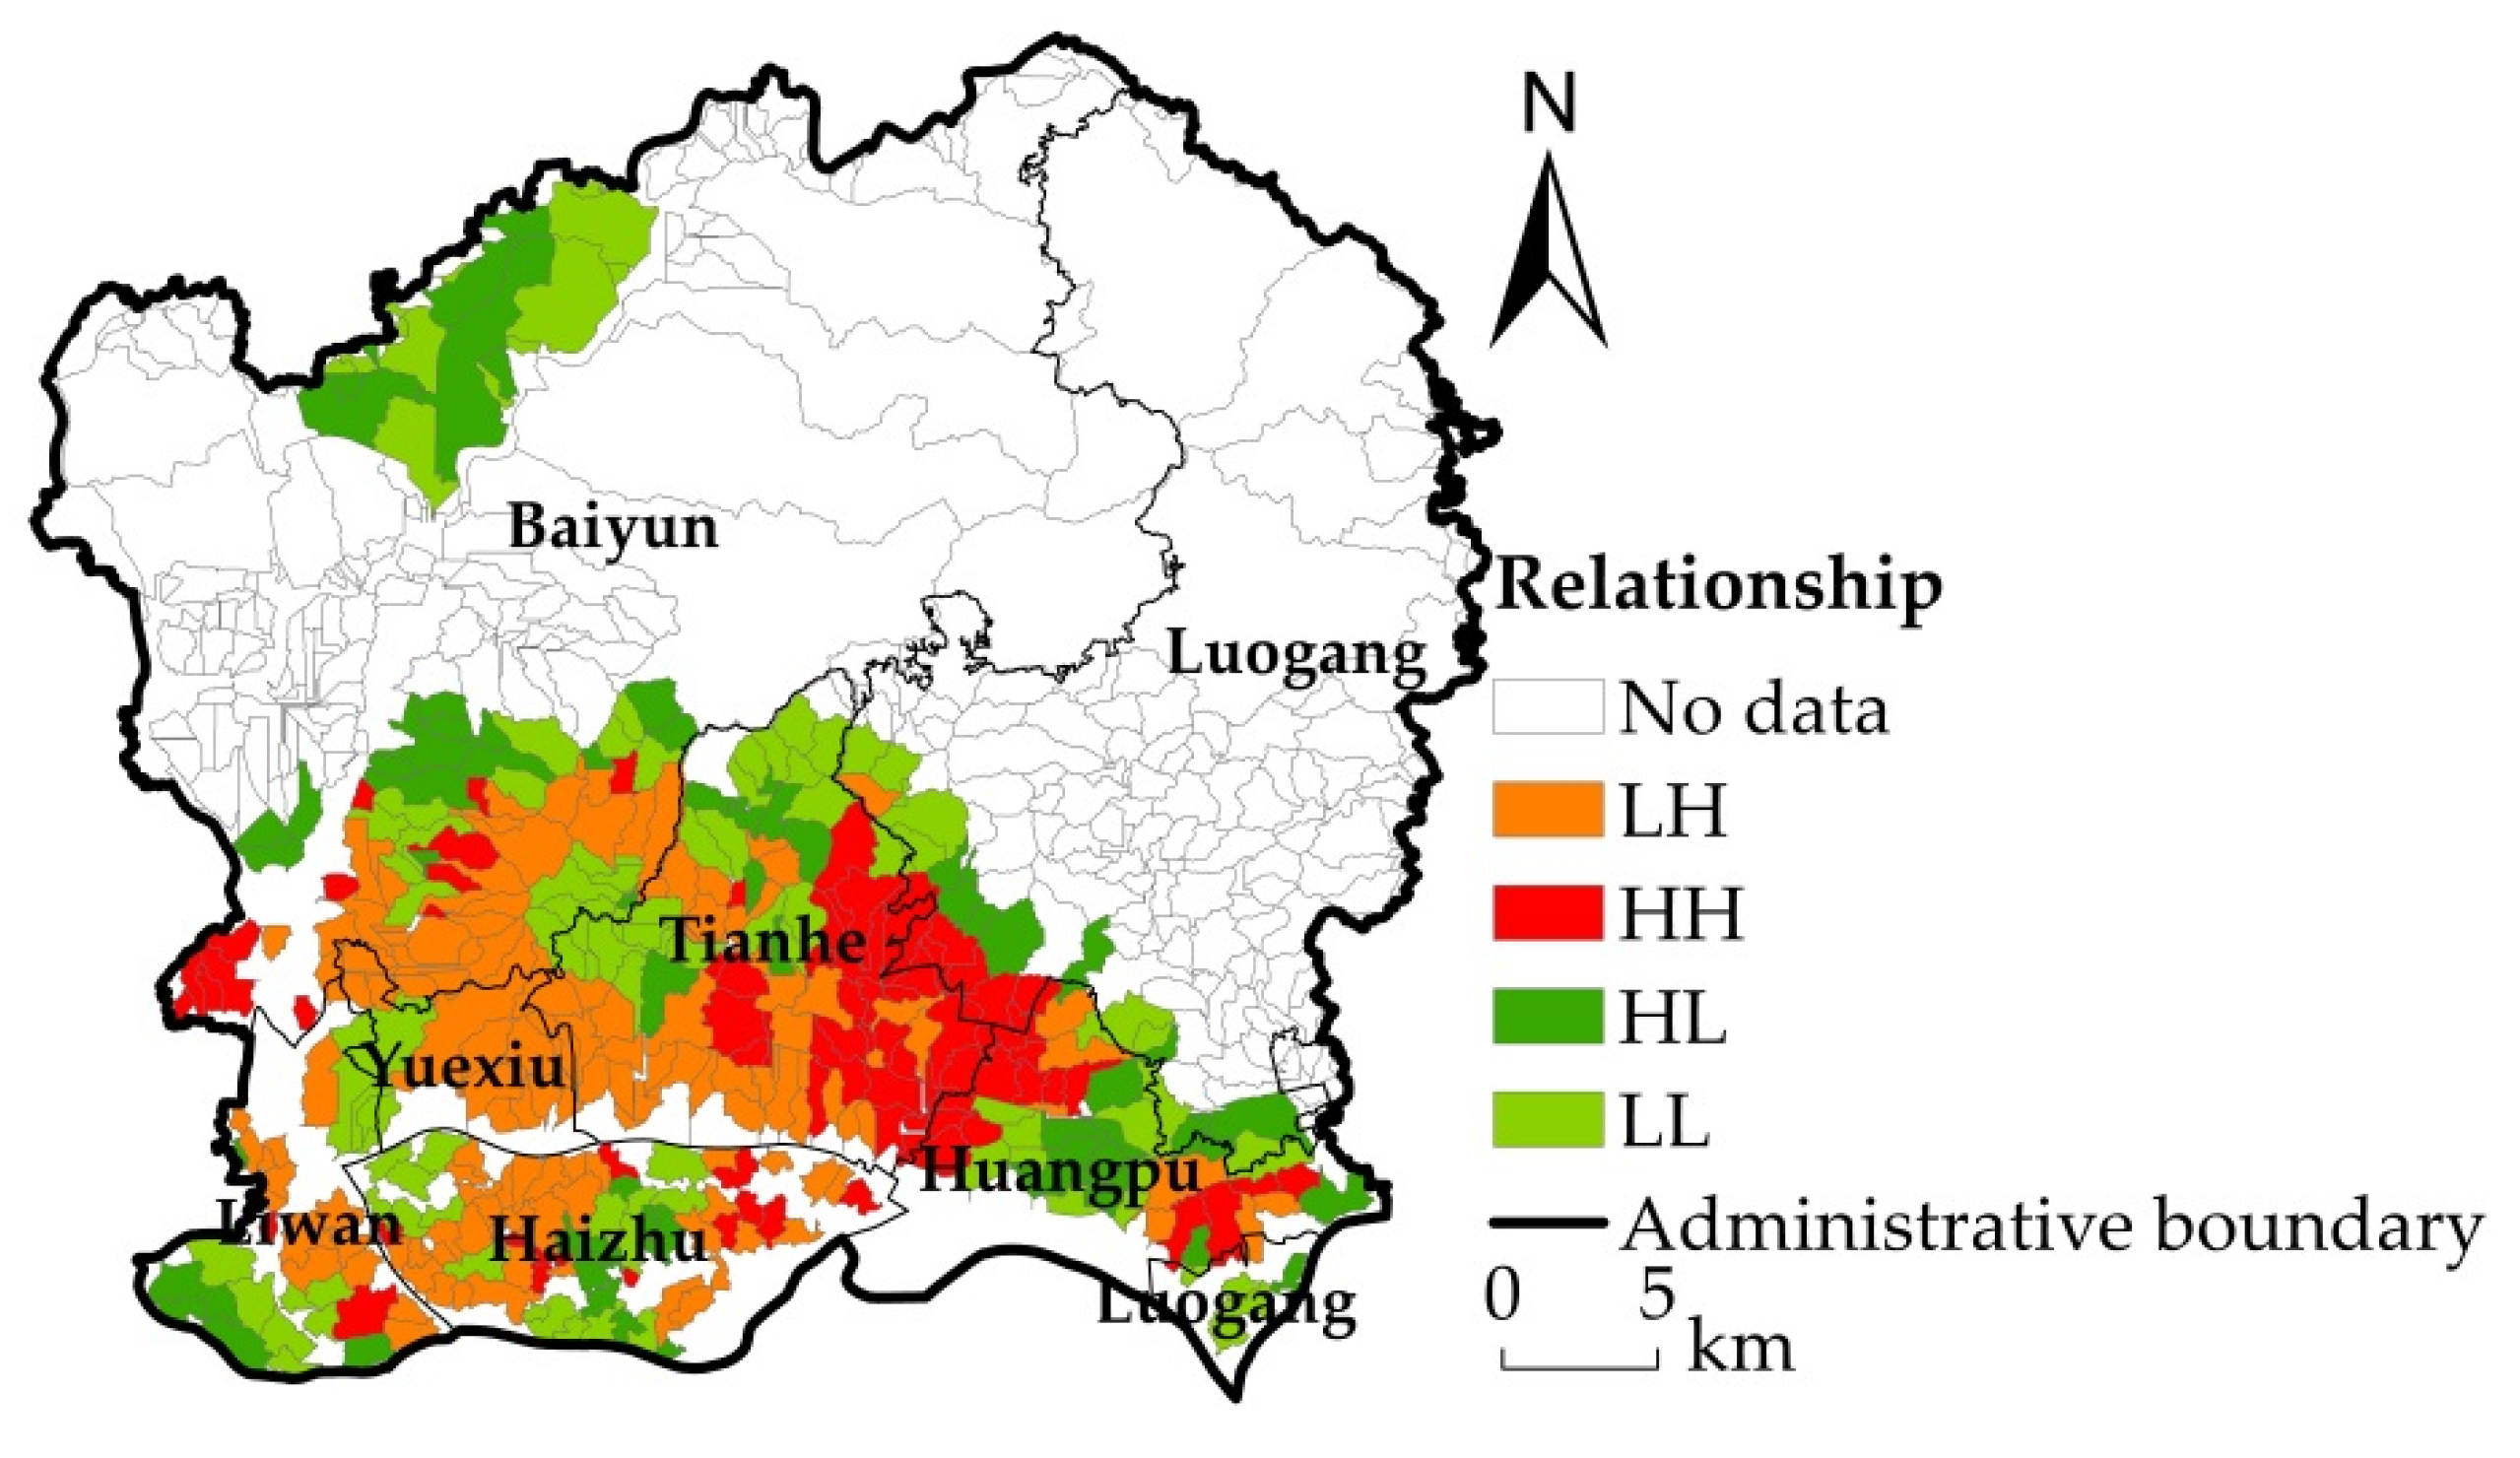
4.3. GWR Analysis of the Relationship between Urban Rainstorm Waterlogging and the Expansion of Impervious Surface
5. Conclusions and Discussion
Author Contributions
Funding
Acknowledgments
Conflicts of Interest
References
- Chen, P.; Zhang, J.; Jiang, X.; Liu, X.; Bao, Y.; Sun, Y. Scenario simulation-based assessment of trip difficulty for urban residents under rainstorm waterlogging. Int. J. Environ. Res. Public Health 2012, 9, 2057–2074. [Google Scholar] [CrossRef] [PubMed]
- Wang, X.; Xie, H. A review on applications of remote sensing and geographic information systems (GIS) in water resources and flood risk management. Water 2018, 10, 608. [Google Scholar] [CrossRef]
- Tan, X.; Shu, Y.; Lian, Y.; Zhao, Y.; Fu, Y. A spatial assessment of urban waterlogging risk based on a weighted naïve Bayes classifier. Sci. Total Environ. 2018, 630, 264–274. [Google Scholar]
- Hu, S.L.; Han, C.F.; Meng, L.P. A scenario planning approach for propositioning rescue centers for urban waterlog disasters. Comput. Ind. Eng. 2015, 87, 425–435. [Google Scholar] [CrossRef]
- Yin, J.; Ye, M.; Yin, Z.; Xu, S. A review of advances in urban flood risk analysis over China. Stoch. Environ. Res. Risk Assess. 2015, 29, 1063–1070. [Google Scholar] [CrossRef]
- Quan, R.; Zhang, L.; Min, L.; Min, L.; Wang, J.; Niu, H. Risk assessment of rainstorm waterlogging on subway in central urban area of Shanghai, China based on scenario simulation. Nat. Hazards 2014, 73, 1569–1585. [Google Scholar] [CrossRef]
- Zhang, X.; Hu, M.; Chen, G.; Xu, Y. Urban rainwater utilization and its role in mitigating urban waterlogging problems—A case study in Nanjing, China. Water Resour. Manag. 2012, 26, 3757–3766. [Google Scholar] [CrossRef]
- Bei-Bei, H.U.; Zhou, J.; Wang, J.; Shi-Yuan, X.U.; Meng, W.Q. Risk assessment on rainstorm waterlogging of Tianjin Binhai new area based on scenario simulation. Sci. Geogr. Sin. 2012, 32, 846–852. [Google Scholar]
- Chen, Z.; Yin, L.; Chen, X.; Wei, S.; Zhu, Z. Research on the characteristics of urban rainstorm pattern in the humid area of Southern China: A case study of Guangzhou City. Int. J. Climatol. 2016, 35, 4370–4386. [Google Scholar] [CrossRef]
- Li, B.; Zhao, Y.; Fu, Y. Spatio-temporal characteristics of urban stormwaterlogging in Guangzhou and the impact of urban growth. Geo-Inf. Sci. 2015, 17, 445–450. [Google Scholar]
- Zhang, H.; Wu, C.; Chen, W. Assessing the impact of climate change on the waterlogging risk in coastal cities: A case study of Guangzhou, South China. J. Hydrometeorol. 2017, 18, 1549–1562. [Google Scholar] [CrossRef]
- Wang, P.; Deng, X.; Zhou, H.; Qi, W. Responses of urban ecosystem health to precipitation extreme: A case study in Beijing and Tianjin. J. Clean. Prod. 2018, 177, 124–133. [Google Scholar] [CrossRef]
- Gomathi, R.; Rao, P.N.G.; Chandran, K.; Selvi, A. Adaptive responses of sugarcane to waterlogging stress: An over view. Sugar Tech 2015, 17, 325–338. [Google Scholar] [CrossRef]
- Wu, X.; Yu, D.; Chen, Z.; Wilby, R.L. An evaluation of the impacts of land surface modification, storm sewer development, and rainfall variation on waterlogging risk in Shanghai. Nat. Hazards 2012, 63, 305–323. [Google Scholar] [CrossRef]
- Schmitt, T.G.; Thomas, M.; Ettrich, N. Analysis and modeling of flooding in urban drainage systems. J. Hydrol. 2004, 299, 300–311. [Google Scholar] [CrossRef]
- Zhou, Y.; Li, T. Case study: The performance and design outline of a buffering stormwater drainage system for a low-lying area. Water Environ. J. 2010, 22, 199–205. [Google Scholar] [CrossRef]
- Hu, M.; Zhang, X.; Siu, Y.L.; Li, Y.; Tanaka, K.; Yang, H.; Xu, Y. Flood mitigation by permeable pavements in Chinese sponge city construction. Water 2018, 10, 172. [Google Scholar] [CrossRef]
- Bryndal, T.; Franczak, P.; Kroczak, R.; Cabaj, W.; Kołodziej, A. The impact of extreme rainfall and flash floods on the flood risk management process and geomorphological changes in small Carpathian catchments: A case study of the Kasiniczanka river (outer Carpathians, Poland). Nat. Hazards 2017, 88, 1–26. [Google Scholar] [CrossRef]
- Deverel, S.J.; Ingrum, T.; Leighton, D. Present-day oxidative subsidence of organic soils and mitigation in the Sacramento-San Joaquin Delta, California, USA. Hydrogeol. J. 2016, 24, 1–18. [Google Scholar] [CrossRef] [PubMed]
- Pietrucha-Urbanik, K. Failure analysis and assessment on the exemplary water supply network. Eng. Fail. Anal. 2015, 57, 137–142. [Google Scholar] [CrossRef]
- Pietrucha-Urbanik, K. Assessing the Costs of Losses Incurred as a Result of Failure; Springer: Cham, Switzerland, 2016; pp. 355–362. [Google Scholar]
- Tabesh, M.; Soltani, J.; Farmani, R.; Savic, D. Assessing pipe failure rate and mechanical reliability of water distribution networks using data-driven modeling. J. Hydroinform. 2009, 11, 1–17. [Google Scholar] [CrossRef] [Green Version]
- Martin-Mikle, C.J.; de Beurs, K.M.; Julian, J.P.; Mayer, P.M. Identifying priority sites for low impact development (lid) in a mixed-use watershed. Landsc. Urban Plan. 2015, 140, 29–41. [Google Scholar] [CrossRef]
- Maryland Department of Environmental Resources. Low-Impact Development Design Strategies: An Integrated Design Approach; Maryland Department of Environmental Resources: Prince Geogre’s County, MD, USA, 1999. [Google Scholar]
- Gu, L.; Gu, N. Urban waterlogging and stormwater management. Appl. Mech. Mater. 2014, 587–589, 554–557. [Google Scholar] [CrossRef]
- Dietz, M.E. Low impact development practices: A review of current research and recommendations for future directions. Water Air Soil Pollut. 2007, 186, 351–363. [Google Scholar] [CrossRef]
- Lanarc Consultants Ltd.; KWL Ltd.; Ngan, G. Stormwater Source Control Design Guidelines 2005; Lanarc Consultants Ltd.: Nanaimo, BC, Canada; KWL Ltd.: Hull, UK, 2005. [Google Scholar]
- Joksimovic, D.; Alam, Z. Cost efficiency of low impact development (lid) stormwater management practices. Procedia Eng. 2014, 89, 734–741. [Google Scholar] [CrossRef]
- Sin, J.; Jun, C.; Zhu, J.H.; Yoo, C. Evaluation of flood runoff reduction effect of lid (low impact development) based on the decrease in CN: Case studies from Gimcheon Pyeonghwa District, Korea. Procedia Eng. 2014, 70, 1531–1538. [Google Scholar] [CrossRef]
- Ben, U. Storm Water; Prentice Hall: London, UK, 1994. [Google Scholar]
- Yazdi, J.; Salehi Neyshabouri, S.A.A. Identifying low impact development strategies for flood mitigation using a fuzzy-probabilistic approach. Environ. Model. Softw. 2014, 60, 31–44. [Google Scholar] [CrossRef]
- Sang, Y.-F.; Yang, M. Urban waterlogs control in China: More effective strategies and actions are needed. Nat. Hazards 2017, 2017, 1291–1294. [Google Scholar] [CrossRef]
- Pindado, M.Á.; Aguado, A.; Josa, A. Fatigue behavior of polymer-modified porous concretes. Cem. Concr. Res. 1999, 29, 1077–1083. [Google Scholar] [CrossRef] [Green Version]
- Yousef, Y.; Hvitved-Jacobsen, T.; Wanielista, M.; Harper, H. Removal of contaminants in highway runoff flowing through Swales. Sci. Total Environ. 1987, 59, 391–399. [Google Scholar] [CrossRef]
- Doug, B.; Hitesh, D.; James, L.; Paul, M. Report on the Environmental Benefits and Costs of Green Roof Technology for the City of Toronto; Ryerson University: Toronto, ON, Canada, 2005. [Google Scholar]
- Lai, L.W.C.; Chau, K.W.; Cheung, P.A.C.W. Urban renewal and redevelopment: Social justice and property rights with reference to Hong Kong’s constitutional capitalism. Cities 2018, 74, 240–248. [Google Scholar] [CrossRef]
- Pérez, M.G.R.; Laprise, M.; Rey, E. Fostering sustainable urban renewal at the neighborhood scale with a spatial decision support system. Sustain. Cities Soc. 2018, 38, 440–451. [Google Scholar] [CrossRef]
- Zhao, P. Sustainable urban expansion and transportation in a growing megacity: Consequences of urban sprawl for mobility on the urban fringe of Beijing. Habitat Int. 2010, 34, 236–243. [Google Scholar] [CrossRef]
- Zheng, H.W.; Shen, G.Q.; Wang, H.; Hong, J. Simulating land use change in urban renewal areas: A case study in Hong Kong. Habitat Int. 2015, 46, 23–34. [Google Scholar] [CrossRef]
- Zheng, H.W.; Shen, G.Q.; Wang, H. A review of recent studies on sustainable urban renewal. Habitat Int. 2014, 41, 272–279. [Google Scholar] [CrossRef] [Green Version]
- Barosio, M.; Eynard, E.; Marietta, C.; Marra, G.; Melis, G.; Tabasso, M. From urban renewal to urban regeneration: Classification criteria for urban interventions. Turin 1995–2015: Evolution of planning tools and approaches. J. Urban Regen. Renew. 2016, 9, 367–380. [Google Scholar]
- Ramamurthy, P.; Bou-Zeid, E. Contribution of impervious surfaces to urban evaporation. Water Resour. Res. 2014, 50, 2889–2902. [Google Scholar] [CrossRef] [Green Version]
- Ridd, M.K. Exploring a V-I-S (vegetation-impervious surface-soil) model for urban ecosystem analysis through remote sensing: Comparative anatomy for cities. Int. J. Remote Sens. 1995, 16, 2165–2185. [Google Scholar] [CrossRef]
- Xu, R.; Zhang, H.; Lin, H. Annual dynamics of impervious surfaces at city level of pearl river delta metropolitan. Int. J. Remote Sens. 2018, 39, 3537–3555. [Google Scholar] [CrossRef]
- Zhang, L.; Zhang, M.; Yao, Y. Mapping seasonal impervious surface dynamics in Wuhan urban agglomeration, China from 2000 to 2016. Int. J. Appl. Earth Obs. Geoinf. 2018, 70, 51–61. [Google Scholar] [CrossRef]
- Verstraeten, G.; Poesen, J. The nature of small-scale flooding, muddy floods and retention pond sedimentation in central Belgium. Geomorphology 1999, 29, 275–292. [Google Scholar] [CrossRef]
- Bhaskar, A.S.; Jantz, C.; Welty, C.; Drzyzga, S.A.; Miller, A.J. Coupling of the water cycle with patterns of urban growth in the Baltimore Metropolitan Region, United States. J. Am. Water Resour. Assoc. 2016, 52, 1–15. [Google Scholar] [CrossRef]
- Urbonas, B.R.; Doerter, J.T. Master planning for stream protection in urban watersheds. Water Sci. Technol. J. Int. Assoc. Water Pollut. Res. 2005, 51, 239–247. [Google Scholar] [CrossRef]
- Brun, S.E.; Band, L.E. Simulating runoff behavior in an urbanizing watershed. Comput. Environ. Urban Syst. 2000, 24, 5–22. [Google Scholar] [CrossRef]
- Booth, D.B.; Jackson, C.R. Urbanization of aquatic systems: Degradation thresholds, stormwater detection, and the limits of mitigation. J. Am. Water Resour. Assoc. 2010, 33, 1077–1090. [Google Scholar] [CrossRef]
- Rose, S.; Peters, N.E. Effects of urbanization on streamflow in the Atlanta Area (Georgia, USA): A comparative hydrological approach. Hydrol. Process. 2001, 15, 1441–1457. [Google Scholar] [CrossRef]
- Su, W.; Ye, G.; Yao, S.; Yang, G. Urban land pattern impacts on floods in a new district of China. Sustainability 2014, 6, 6488–6508. [Google Scholar] [CrossRef]
- Zheng, P.Q.; Baetz, B.W. GIS-based analysis of development options from a hydrology perspective. J. Urban Plan. Dev. 1999, 125, 164–180. [Google Scholar] [CrossRef]
- Poff, L.R.; Bledsoe, B.P.; Cuhaciyan, C.O. Hydrologic variation with land use across the contiguous united states: Geomorphic and ecological consequences for stream ecosystems. Geomorphology 2006, 79, 264–285. [Google Scholar] [CrossRef]
- Mejía, A.I.; Moglen, G.E. Spatial patterns of urban development from optimization of flood peaks and imperviousness-based measures. J. Hydrol. Eng. 2009, 14, 416–424. [Google Scholar] [CrossRef]
- Zhang, H.; Cheng, J.; Wu, Z.; Li, C.; Qin, J.; Liu, T. Effects of impervious surface on the spatial distribution of urban waterlogging risk spots at multiple scales in Guangzhou, South China. Sustainability 2018, 10, 1589. [Google Scholar] [CrossRef]
- Tobler, W.R. A computer movie simulating urban growth in the Detroit region. Econ. Geogr. 1970, 46, 234–240. [Google Scholar] [CrossRef]
- Guan, Y.; Zheng, F.; Zhang, P.; Qin, C. Spatial and temporal changes of meteorological disasters in China during 1950–2013. Nat. Hazards 2015, 75, 2607–2623. [Google Scholar] [CrossRef]
- Thorn, A.M.; Wake, C.P.; Grimm, C.D.; Mitchell, C.R.; Mineau, M.M.; Ollinger, S.V. Development of scenarios for land cover, population density, impervious cover, and conservation in New Hampshire, 2010–2100. Ecol. Soc. 2017, 22. [Google Scholar] [CrossRef] [Green Version]
- Cheung, L.T.O.; Hui, D.L.H. Influence of residents’ place attachment on heritage forest conservation awareness in a peri-urban area of Guangzhou, China. Urban For. Urban Green. 2018, 33, 37–45. [Google Scholar] [CrossRef]
- HRNUO. 2017 Latest National Top 100 Cities GDP Rankings. Available online: https://www.hrnuo.com/about/xinwenzixun/314.html (accessed on 4 February 2017).
- Liu, X. Waterlogging Points in Guangzhou 30 Years Spread 16 Times. Available online: http://gd.qq.com/a/20160105/008699.htm (accessed on 5 January 2016).
- Huang, H.; Chen, X.; Zhu, Z.; Xie, Y.; Liu, L.; Wang, X.; Wang, X.; Liu, K. The changing pattern of urban flooding in Guangzhou, China. Sci. Total Environ. 2017, 622–623, 394. [Google Scholar] [CrossRef] [PubMed]
- Zimmerman, C.L.; Runkle, J.R. Using ecological land units for conservation planning in a southwestern Ohio Watershed. Nat. Areas J. 2010, 30, 27–38. [Google Scholar] [CrossRef]
- Zhang, S.L.; Gan, J.Y.; Zeng, Q.L.; Lu, G.N. Automatic compartmentalization of urban rainwater catchments on water outlet supported by GIS technology. J. Hydraul. Eng. 2007, 38, 325–329. [Google Scholar]
- Xue, F.; Sheng, J.; Qian, H. Research on classification of Rainstormwatershed delineation approach for plain urban regions. Geo-Inf. Sci. 2015, 17, 462–468. [Google Scholar]
- Wang, Z.; Shi, Y.; Sun, X. Exploration of urban planning administrative map in Guangzhou. City Plan. Rev. 2003, 27, 41–47. [Google Scholar]
- Botev, Z.I.; Grotowski, J.F.; Kroese, D.P. Kernel density estimation via diffusion. Ann. Stat. 2010, 38, 2916–2957. [Google Scholar] [CrossRef] [Green Version]
- Wang, Y.; He, H. Spatial Data Analysis Method; Science Press: Beijing, China, 2007. [Google Scholar]
- Moran, P.A. Notes on continuous stochastic phenomena. Biometrika 1950, 37, 17–23. [Google Scholar] [CrossRef] [PubMed]
- Ord, J.K.; Getis, A. Local spatial autocorrelation statistics: Distributional issues and an application. Geogr. Anal. 1995, 27, 286–306. [Google Scholar] [CrossRef]
- Anselin, L. Local indicators of spatial association—Lisa. Geogr. Anal. 1995, 27, 93–115. [Google Scholar] [CrossRef]
- Mitchel, A.E. The ESRI Guide to GIS Analysis, Volume 2: Spartial Measurements and Statistics; ESRI Guide to GIS Analysis; ESRI Press: Redlands, CA, USA, 2005. [Google Scholar]
- Fotheringham, A.S.; Brunsdon, C.; Charlton, M. Geographically Weighted Regression: The Analysis of Spatially Varying Relationships; International Union of Crystallography: Chester, UK, 2002; pp. 125–126. [Google Scholar]
- Hu, M.; Li, Z.; Wang, J.; Lin, J.; Liao, Y.; Lai, S.; Guo, Y.; Dan, Z.; Yang, W. Determinants of the incidence of hand, foot and mouth disease in China using geographically weighted regression models. PLoS ONE 2012, 7, e38978. [Google Scholar] [CrossRef] [PubMed]
- Luo, J.; Du, P.; Samat, A.; Xia, J.; Che, M.; Xue, Z. Spatiotemporal pattern of PM2.5 concentrations in mainland China and analysis of its influencing factors using geographically weighted regression. Sci. Rep. 2017, 7, 40607. [Google Scholar] [CrossRef] [PubMed]
- McMillen, D.P. Geographically weighted regression: The analysis of spatially varying relationships. Am. J. Agric. Econ. 2004, 86, 554–556. [Google Scholar] [CrossRef]
- Lu, B.; Charlton, M.; Brunsdon, C.; Harris, P. The minkowski approach for choosing the distance metric in geographically weighted regression. Int. J. Geogr. Inf. Sci. 2016, 30, 351–368. [Google Scholar] [CrossRef]
- Wu, R.; Zhang, J.; Bao, Y.; Tong, S. Using a geographically weighted regression model to explore the influencing factors of CO2 emissions from energy consumption in the industrial sector. Polish J. Environ. Stud. 2016, 25, 2641–2651. [Google Scholar] [CrossRef]
- Li, S.; Ye, X.; Lee, J.; Gong, J.; Qin, C. Spatiotemporal analysis of housing prices in China: A big data perspective. Appl. Spat. Anal. Policy 2016, 10, 1–13. [Google Scholar] [CrossRef]
- Hu, X.; Wu, C.; Wang, J.; Qiu, R. Identification of spatial variation in road network and its driving patterns: Economy and population. Reg. Sci. Urban Econ. 2018, 71, 37–45. [Google Scholar] [CrossRef]
- Jiansheng, W.U.; Zhang, P. The effect of urban landscape pattern on urban waterlogging. Acta Geogr. Sin. 2017, 72, 444–456. [Google Scholar]
- Wang, C.; Du, S.; Wen, J.; Zhang, M.; Gu, H.; Shi, Y.; Xu, H. Analyzing explanatory factors of urban pluvial floods in Shanghai using geographically weighted regression. Stoch. Environ. Res. Risk Assess. 2017, 31, 1777–1790. [Google Scholar] [CrossRef]
- Chakrovorty, S.; Haque, A. Land Market Receptiveness to Water-Logging: A Hedonic Pricing Approach Using GIS; Center for Research and Training (CRT): Dhaka, Bangladesh, 2017. [Google Scholar]
- Kanga, S.; Singh, S.K. Mapping of Salt Affected and Waterlogged Areas Using Geospatial Technique. Int. J. Recent Innov. Trends Comput. Commun. 2017, 5, 1298–1305. [Google Scholar]
- Majumder, A.K.; Hossain, M.S.; Al Nayeem, A. Assessment of people’s perception on water logging in Chittagong City Corporation Area, Bangladesh. Assessment 2018, 5, 104–107. [Google Scholar]
- Lei, W.; Li, C.C.; Ying, Q.; Xiao, C.; Wang, X.Y.; Li, X.Y.; Hu, L.Y.; Lu, L.; Le, Y.; Huang, H.B. China’s urban expansion from 1990 to 2010 determined with satellite remote sensing. Chin. Sci. Bull. 2012, 57, 2802–2812. [Google Scholar] [Green Version]
- Lu, D.; Song, K.; Zang, S.; Jia, M.; Du, J.; Ren, C. The effect of urban expansion on urban surface temperature in Shenyang, China: An analysis with landsat imagery. Environ. Model. Assess. 2015, 20, 197–210. [Google Scholar] [CrossRef]
- Sen, B.I.; Wang, H.; Li, Z.; Tong, L.I.; Dong, L.; Han, R.D. Analysis of expansion of port cities in Hainan province based on impervious surface. J. Appl. Sci. 2017, 35, 346–354. [Google Scholar]
- Chen, J.; Chang, K.T.; Karacsonyi, D.; Zhang, X. Comparing urban land expansion and its driving factors in Shenzhen and Dongguan, China. Habitat Int. 2014, 43, 61–71. [Google Scholar] [CrossRef]
- Wang, Y.; Wang, J.; Cui, H. The historic characterisitc and evolution of Guangzhou urban form. J. Qingdao Inst. Archit. Eng. 2002, 23, 32–37. [Google Scholar]
- Zhao, M.; Xiong, K. Concept planning and the development stretegy of Guangzhou. Urban Plan. 2001, 25, 20. [Google Scholar]
- Peng, J.; Liu, Y.; Shen, H.; Xie, P.; Xiaoxu, H.U.; Wang, Y. Using impervious surfaces to detect urban expansion in Beijing of China in 2000s. Chin. Geogr. Sci. 2016, 26, 229–243. [Google Scholar]
- Committee, C. Review of Guangzhou Urban Planning Development; Guangdong Science & Technology Press: Guangzhou, China, 2006. [Google Scholar]
- Sim, T.; Wang, D.; Han, Z. Assessing the disaster resilience of megacities: The case of Hong Kong. Sustainability 2018, 10, 1137. [Google Scholar] [CrossRef]


| Data | Format | Time | Source |
|---|---|---|---|
| 1:4 Million administrative divisions | Esri shape file | 2005 | National Geomatics Center of China |
| Landsat remote-sensing image | Img | 1990-11-03 1999-11-15 2010-10-28 | USGS |
| High-resolution remote sensing image | Jpeg | 2000 2008 2010 | Google Earth aerial photo |
| Waterlogging information | Text | 1980–2012 | Guangzhou Water Authority, Guangzhou Daily |
| Topographic data | Img | 2009 | LP DAAC |
| Research Period (Year) | Index | Moran’s I | Z | P |
|---|---|---|---|---|
| 1980–1989 | Average Waterlogging Density | 0.15 | 17.86 | 0.00 |
| 1990–1999 | 0.36 | 35.25 | 0.00 | |
| 2000–2012 | 0.60 | 55.16 | 0.00 | |
| 1980–1989 | Impervious Surface Density | 0.73 | 66.32 | 0.00 |
| 1990–1999 | 0.72 | 65.24 | 0.00 | |
| 2000–2012 | 0.63 | 57.75 | 0.00 |
| Land Use | 1999 | |||||
|---|---|---|---|---|---|---|
| Green Land | Farmland | Water | Bare Land | ISA | ||
| 1990 | Green land | 414.3 | 63.37 | 2.536 | 35.51 | 27.68 |
| Farmland | 54.9 | 62.53 | 1.106 | 30.19 | 45.03 | |
| Water | 4.3794 | 1.5345 | 30.8385 | 1.9836 | 11.1069 | |
| Bare land | 59.4018 | 43.4781 | 2.8314 | 88.6734 | 67.2084 | |
| ISA | 26.1522 | 42.0021 | 8.0541 | 34.4637 | 292.7142 | |
| 2010 | Green land | 336.6144 | 35.3133 | 2.2788 | 23.9994 | 17.3367 |
| Farmland | 106.1271 | 71.2143 | 2.7099 | 70.3044 | 46.4535 | |
| Water | 2.9826 | 1.6452 | 28.7883 | 2.5965 | 9.6786 | |
| Bare land | 32.9535 | 17.514 | 0.54 | 11.1564 | 13.8942 | |
| ISA | 80.5698 | 89.7192 | 11.1906 | 82.6209 | 360.3267 | |
| Research Period | Spatial Autocorrelation of Standard Residual | R2 | Adjusted R2 | ||
|---|---|---|---|---|---|
| 1990–1999 | Moran’s I = −0.008 | Z = −0.605 | P = 0.545 | 0.871 | 0.733 |
| 2000–2012 | Moran’s I = −0.179 | Z = −1.498 | P = 0.134 | 0.864 | 0.774 |
© 2018 by the authors. Licensee MDPI, Basel, Switzerland. This article is an open access article distributed under the terms and conditions of the Creative Commons Attribution (CC BY) license (http://creativecommons.org/licenses/by/4.0/).
Share and Cite
Yu, H.; Zhao, Y.; Fu, Y.; Li, L. Spatiotemporal Variance Assessment of Urban Rainstorm Waterlogging Affected by Impervious Surface Expansion: A Case Study of Guangzhou, China. Sustainability 2018, 10, 3761. https://doi.org/10.3390/su10103761
Yu H, Zhao Y, Fu Y, Li L. Spatiotemporal Variance Assessment of Urban Rainstorm Waterlogging Affected by Impervious Surface Expansion: A Case Study of Guangzhou, China. Sustainability. 2018; 10(10):3761. https://doi.org/10.3390/su10103761
Chicago/Turabian StyleYu, Huafei, Yaolong Zhao, Yingchun Fu, and Le Li. 2018. "Spatiotemporal Variance Assessment of Urban Rainstorm Waterlogging Affected by Impervious Surface Expansion: A Case Study of Guangzhou, China" Sustainability 10, no. 10: 3761. https://doi.org/10.3390/su10103761