Study on Vulnerability and Coordination of Water-Energy-Food System in Northwest China


1
State Key Laboratory of Hydrology-Water Resources and Hydraulic Engineering, Hohai University, Nanjing 210098, China
2
Institute of Management Science, Hohai University, Nanjing 210098, China
3
National Engineering Research Center of Water Resources Efficient Utilization and Engineering Safety, Hohai University, Nanjing 210098, China
*
Author to whom correspondence should be addressed.
Sustainability 2018, 10(10), 3712; https://doi.org/10.3390/su10103712
Submission received: 16 August 2018
/
Revised: 11 October 2018
/
Accepted: 12 October 2018
/
Published: 16 October 2018
(This article belongs to the Special Issue Conflict Analysis and Sustainable Management of Water Resources)
Abstract
:Water, energy and food are the basic resources for human survival and development. The coordination development of water-energy-food (W-E-F) is of great significance to promote regional sustainable development. In this study, Northwest China (Shaanxi, Gansu, Qinghai, Ningxia, Xinjiang) was selected as the research case, and an evaluation index system was constructed to assess the vulnerability and coordination of water-energy-food (W-E-F) system based on PSR model. Then, a coupled model based on cloud-matter element model and coordination degree model was proposed. The cloud-matter element model was adopted to evaluate the vulnerability level of W-E-F system. The coordination degree model was employed to calculate the coordination degrees of W-E-F system. The results showed that, from 2006 to 2015, the vulnerability levels of W-E-F system in Northwest China were mostly at Level 1. The coordination degrees of W-E-F system belonged to the transitional development level (II) in most years. The vulnerability and coordination problems of W-E-F system in Northwest China were severe. The comprehensive vulnerability index values of W-E-F system were generally on the rise, but far from reaching a good level. Moreover, the comprehensive vulnerability index values and coordination degrees of W-E-F system in Northwest China do not match well. Finally, the countermeasures and suggestions to improve the coordinated development of water resource, energy and food in Northwest China were put forward.
1. Introduction
Water, energy and food are important resources for the economic and social sustainable development. They are highly interconnected and affect each other directly and indirectly [1]. Water is used for the production and exploitation of energy and food; energy is consumed in the development and processing of water and food; food can be used to make biological energy [2]. In the context of global population growth, climate warming, environmental degradation, and lack of resources, China’s industrialization and urbanization are accelerating. As a result, China’s water resources have decreased, energy demand has increased, and the uncertainty of food supply has become more serious [3]. The W-E-F system is a complex coupling system. The relationship between the three subsystems of mutual influence, mutual restriction, coordination and vulnerability has become increasingly prominent. The nexus of water resources, energy and food have attracted the attention of scholars and relevant departments. Research on W-E-F system has become an important topic in the field of sustainable development [4].
Vulnerability, as an important research object, has been put on the research agenda by international scientific programs and institutions such as IHDP, IPCC, IGBP [5,6,7]. It has become the frontier and hotspot of global environmental change and sustainable scientific research. In 1999, the United Nations Development Programme (UNDP) formally put forward the concept of “economic vulnerability” [8]. After that, the research object of vulnerability has gradually expanded from the natural ecological environment system to the complex system which includes the natural, social, economic and institutional factors. Cutter [9] summarized the related concepts of vulnerability, pointing out that social vulnerability is a natural risk and social response within a specific region or geographical scope, and stressing the imbalance of social preparedness, response, recovery and adaptation to disasters. The United Nations International Strategy for Disaster Reduction (UNISDR) defined vulnerability as the extent to which the attributes of communities, systems or property and the environment are damaged by disaster-causing factors. It was considered that vulnerability was related to various natural, social, economic and environmental factors, and has certain temporal and spatial attributes [10]. Chen et al. [11] indicated that social vulnerability influenced people’s ability to make full pre-disaster preparations under the pre-existing conditions, and to recover from post-disaster reconstruction. Füssel [12] thought the vulnerability is the degree of damage or threat of adverse effects to the system and classified the vulnerability into two categories, namely, social vulnerability and physical vulnerability. Social vulnerability referred to the ability of social system to respond to disasters. Physical vulnerability was the loss of disaster-bearing body caused by disaster. As a comprehensive concept, vulnerability contains related concepts such as risk, sensitivity, adaptability and resilience, which not only takes into account the influence of the internal conditions of the system on the system vulnerability, but also covers the interaction characteristics between the system and society, economy, institution, and other human factors. The vulnerability of the water-energy-food system is reflected in the tremendous pressure exerted by the subsystems of water resources, energy and food under the influence of the internal elements of the system and the external environment, as well as the lack of adequate response measures to eliminate the negative effects of these pressures. In this paper, the vulnerability of water-energy-food systems was divided into five levels, different level of vulnerability means different level of pressure and responsiveness to the system.
Some scholars have made some definitions of coordination according to different research objectives. Liu analyzed the degree of coordination of the tourism system and proposed that coordination referred to two or more systems working together in a harmonious and sustainable relationship [13]. Yang studied the coordination degree of the urban land use system. In addition, he then used the coordination degree to measure whether the development of all subsystems and elements of urban land use system is reasonable and consistent [14]. Wang thought the coordination degree can reflect the level of system development and better identify the coordinated evolution between subsystems [15]. Sun used coordination degree model to study the coordination relationship between economic, social and environmental benefits, and then the coordination degree could reflect the synergies among systems [16]. In this study, the coordination degree of water-energy-food system means the degree of harmony and consistency between the subsystems in the process of development and evolution. The higher the coordination degree of W-E-F system is, the more harmonious of each subsystem is. The lower the coordination degree of W-E-F system is, the lower the development level of each subsystem is. The relationship between vulnerability and coordination is the interaction of unity and opposites. The vulnerability of the water-energy-food system is reflected in the high pressure of the system and the weak adaptability of the system when exposed to the environment. The coordination of the water-energy-food system is mainly manifested in the consistency of the development level among the internal subsystems. The vulnerability of the water-energy-food system can only reflect the development status of the system, but cannot reflect the relationship between the various subsystems and whether the development is harmonious. The coordination degree of water-energy-food system is calculated on the basis of the comprehensive vulnerability index values of each subsystem, which reflects whether the development of water resources, energy and food subsystems are consistent. To improve the coordination degree of the W-E-F system, the subsystems of water, energy and food must reduce the vulnerability respectively. The ultimate goal of studying vulnerability is to realize the coordination and sustainable development of each subsystem.
Traditional vulnerability assessment methods can be divided into three categories, qualitative evaluation, quantitative evaluation, and qualitative combined with quantitative. At present, the more commonly used methods are AHP, fuzzy comprehensive evaluation, principal component analysis, cloud model, matter element model, etc. Ouma et al. [17] used Analytical Hierarchy Process (AHP) method to assign decision parameters’ weights for creating a flood vulnerability distribution map. Hahn et al. [18] adopted the fuzzy comprehensive evaluation method to estimate the vulnerability of climate change in the Mapo and Moma regions of Mozambique. However, AHP and fuzzy comprehensive evaluation method use expert scoring to assign weights to indices, which are subjective. Cutter et al. [19] used principle component analysis to aggregate county level socio-economic data to assess the social vulnerability of different municipalities in US. The principal component analysis is prone to lack of information. Based on the MOVE framework, Depietri et al. [20] used GIS to evaluate the relative vulnerability of heat wave in 85 Cologne regions, this method is not very practical. Wang et al. [21] adopted the cloud model and attribute identification theory to dynamically evaluate the vulnerability of environment-economy system in Tongling city of China. Cloud models cannot describe the characteristics of things very well. Wang et al. [22] evaluated the vulnerability of the ecological environment in Jilin province of China based on the matter element model. This method does not take into account the fuzziness of the boundary of vulnerability classification. The process of system vulnerability assessment is full of uncertainty such as randomness, fuzziness and incompleteness. Based on this, this paper used cloud-matter element model to evaluate the vulnerability level of water-energy-food system. The cloud-matter element model is improved on the basis of the matter element model proposed by Professor Li of China [23]. It is the combination of cloud model and matter element model. The traditional matter element model does not consider the fuzziness of the classification interval when evaluating vulnerability level, but the cloud model has this advantage. Therefore, cloud model is integrated into the matter-element model to form the cloud-matter element model. Cloud-matter element model considers the ambiguity and uncertainty of grading boundary in the process of evaluating and classifying objects, so that the result of calculation is more accurate. At present, many scholars established cloud-matter element model for grade evaluation. Tian [24] assessed seismic serviceability of water supply network based on cloud-matter element model. Dai et al. [25] used cloud-matter element model to evaluate information security risk. Sun et al. [26] used the cloud-matter element model to evaluate the green grade of the car passenger station. Liu et al. [27] adopted the cloud-matter element model to evaluate the risk grade of flood disaster. Zheng et al. [28] identified the main external risk factors of overseas mining project based on cloud-matter element model. Thus, this paper proposes a water-energy-food system vulnerability level assessment method based on the cloud-matter element model.
The coordination degree model was proposed by Liao [29], which has been widely used to evaluate the coordination degree between two or more subsystems. The coordination degree model is a good representation of the degree of consistency in the development of individual subsystems. In this paper, the coordination model is to use mathematical expressions to relate the various subsystems together based on the calculation of the comprehensive vulnerability index value of each subsystems and W-E-F system and finally to calculate the coordination degree of the water-energy-food system. At present, the coordination degree model has been applied in many fields. Ding et al. [30] used coordination degree model to study the coordination relationship between urbanization and air-environment in Hunan, China. Liu et al. [31] took coordination degree model to calculate the coordination degree of the economy-society-ecology system. Zhao et al. [32] adopted coordination degree model to study the coordination of sea-land system in Hainan province of China. Tang [33] evaluated coordination degree of tourism-environment system based on coordination degree model. Yang et al. [34] took Hunan province of China as the research object and calculated the coordination degree of the ecology-economy-society system by using the coordination degree model. Some scholars studied the vulnerability and coordination of two or more systems. Yang [35] evaluated the vulnerability and coordination of flood system based on fuzzy comprehensive evaluation and coordination degree model. Peng et al. [36] adopted fuzzy comprehensive evaluation method and coordination degree model to evaluate the vulnerability and coordination of marine eco-economic system in coastal areas of China. Chen et al. [37] took the eastern part of Heilongjiang province in China as the research object to study the vulnerability and coordination of the coupling system of urbanization and ecological environment. Chen et al. [38] studied the vulnerability and coordination mechanism of the coupling system of urbanization and eco-environment. Zhang [39] evaluated the vulnerability and coordination of urban ecosystems in China. Wan et al. [40] studied the coordination degree of economy-environment system from the perspective of vulnerability.
PSR [41] (pressure-state-response) model can comprehensively consider social, economic, natural and environmental factors, providing a theoretical framework for the vulnerability and coordination evaluation system. It answers three basic questions about sustainable development: “what happened, why it happened, and how we will do it”. The model distinguishes three kinds of indicators, namely, pressure index, state index and response index. Among them, the pressure index represents the effect of human economic and social activities on the environment, the state index represents the environmental state and environmental changes in a specific period of time, and the response index refers to how society and individuals can act to mitigate, prevent, restore and prevent the negative impact of human activities on the environment. Various factors should be taken into account in building the evaluation index system of vulnerability and coordination. We need to take into account both the current state of the system and the pressures of human activities on the system and the measures taken by humans to remedy the deterioration of the system environment. When the state of the system is poor, human activities have a greater pressure on the system and do not take good measures to improve this situation, which is reflected in the vulnerability of the system. When each subsystem is in good condition and under little pressure from human or society, and human or society takes sufficient measures to improve the conditions of each subsystem of water, energy and food, this reflects the coordination of each subsystem. Thus, from the perspective of system theory, the dynamic development process of vulnerability and coordination of water-energy-food system conforms to the PSR model. That is, external factors exert pressure on the system, constitute stimulus inputs, and the system changes in state (positive or negative effects), the results of which respond in some form, showing the vulnerability or coordination of the system.
At present, studies on the vulnerability of water-energy-food system are very few, and studies on the co-evolution of the vulnerability and coordination of water-energy-food system are poor. The study of vulnerability and coordination is conducive to the comprehensive discovery of the problems of water-energy-food sustainable development. The main factors influencing the development of water-energy-food system are found. We will explore the relationship between the regional water resources, energy and food subsystems, and whether the development of each subsystem is consistent. Based on this, some concrete countermeasures are proposed to promote the coordinated development of regional water-energy-food system and further promote regional economic development. The motivation of this paper is to construct an evaluation index system based on PSR theoretical framework. The weight of each index is calculated by entropy weight method. The vulnerability index of water-energy-food system was classified by cloud matter element model. The comprehensive vulnerability index values of each subsystem or water-energy-food complex system were obtained by simple linear weighting. Based on this, the coordination degree of W-E-F system was calculated by the coordination degree model. In addition, then the comprehensive vulnerability index and coordination degrees of W-E-F system were compared on the space. The research can provide theoretical framework and technical support for the comprehensive management and sustainable development of resources in Northwest China in the future. The paper is organized as follows. Section 2 introduces the study area. Section 3 describes the data and methods. The main results and analysis are presented in Section 4. Section 5 gives the discussion and conclusions of the study.
2. Overview of Study Area
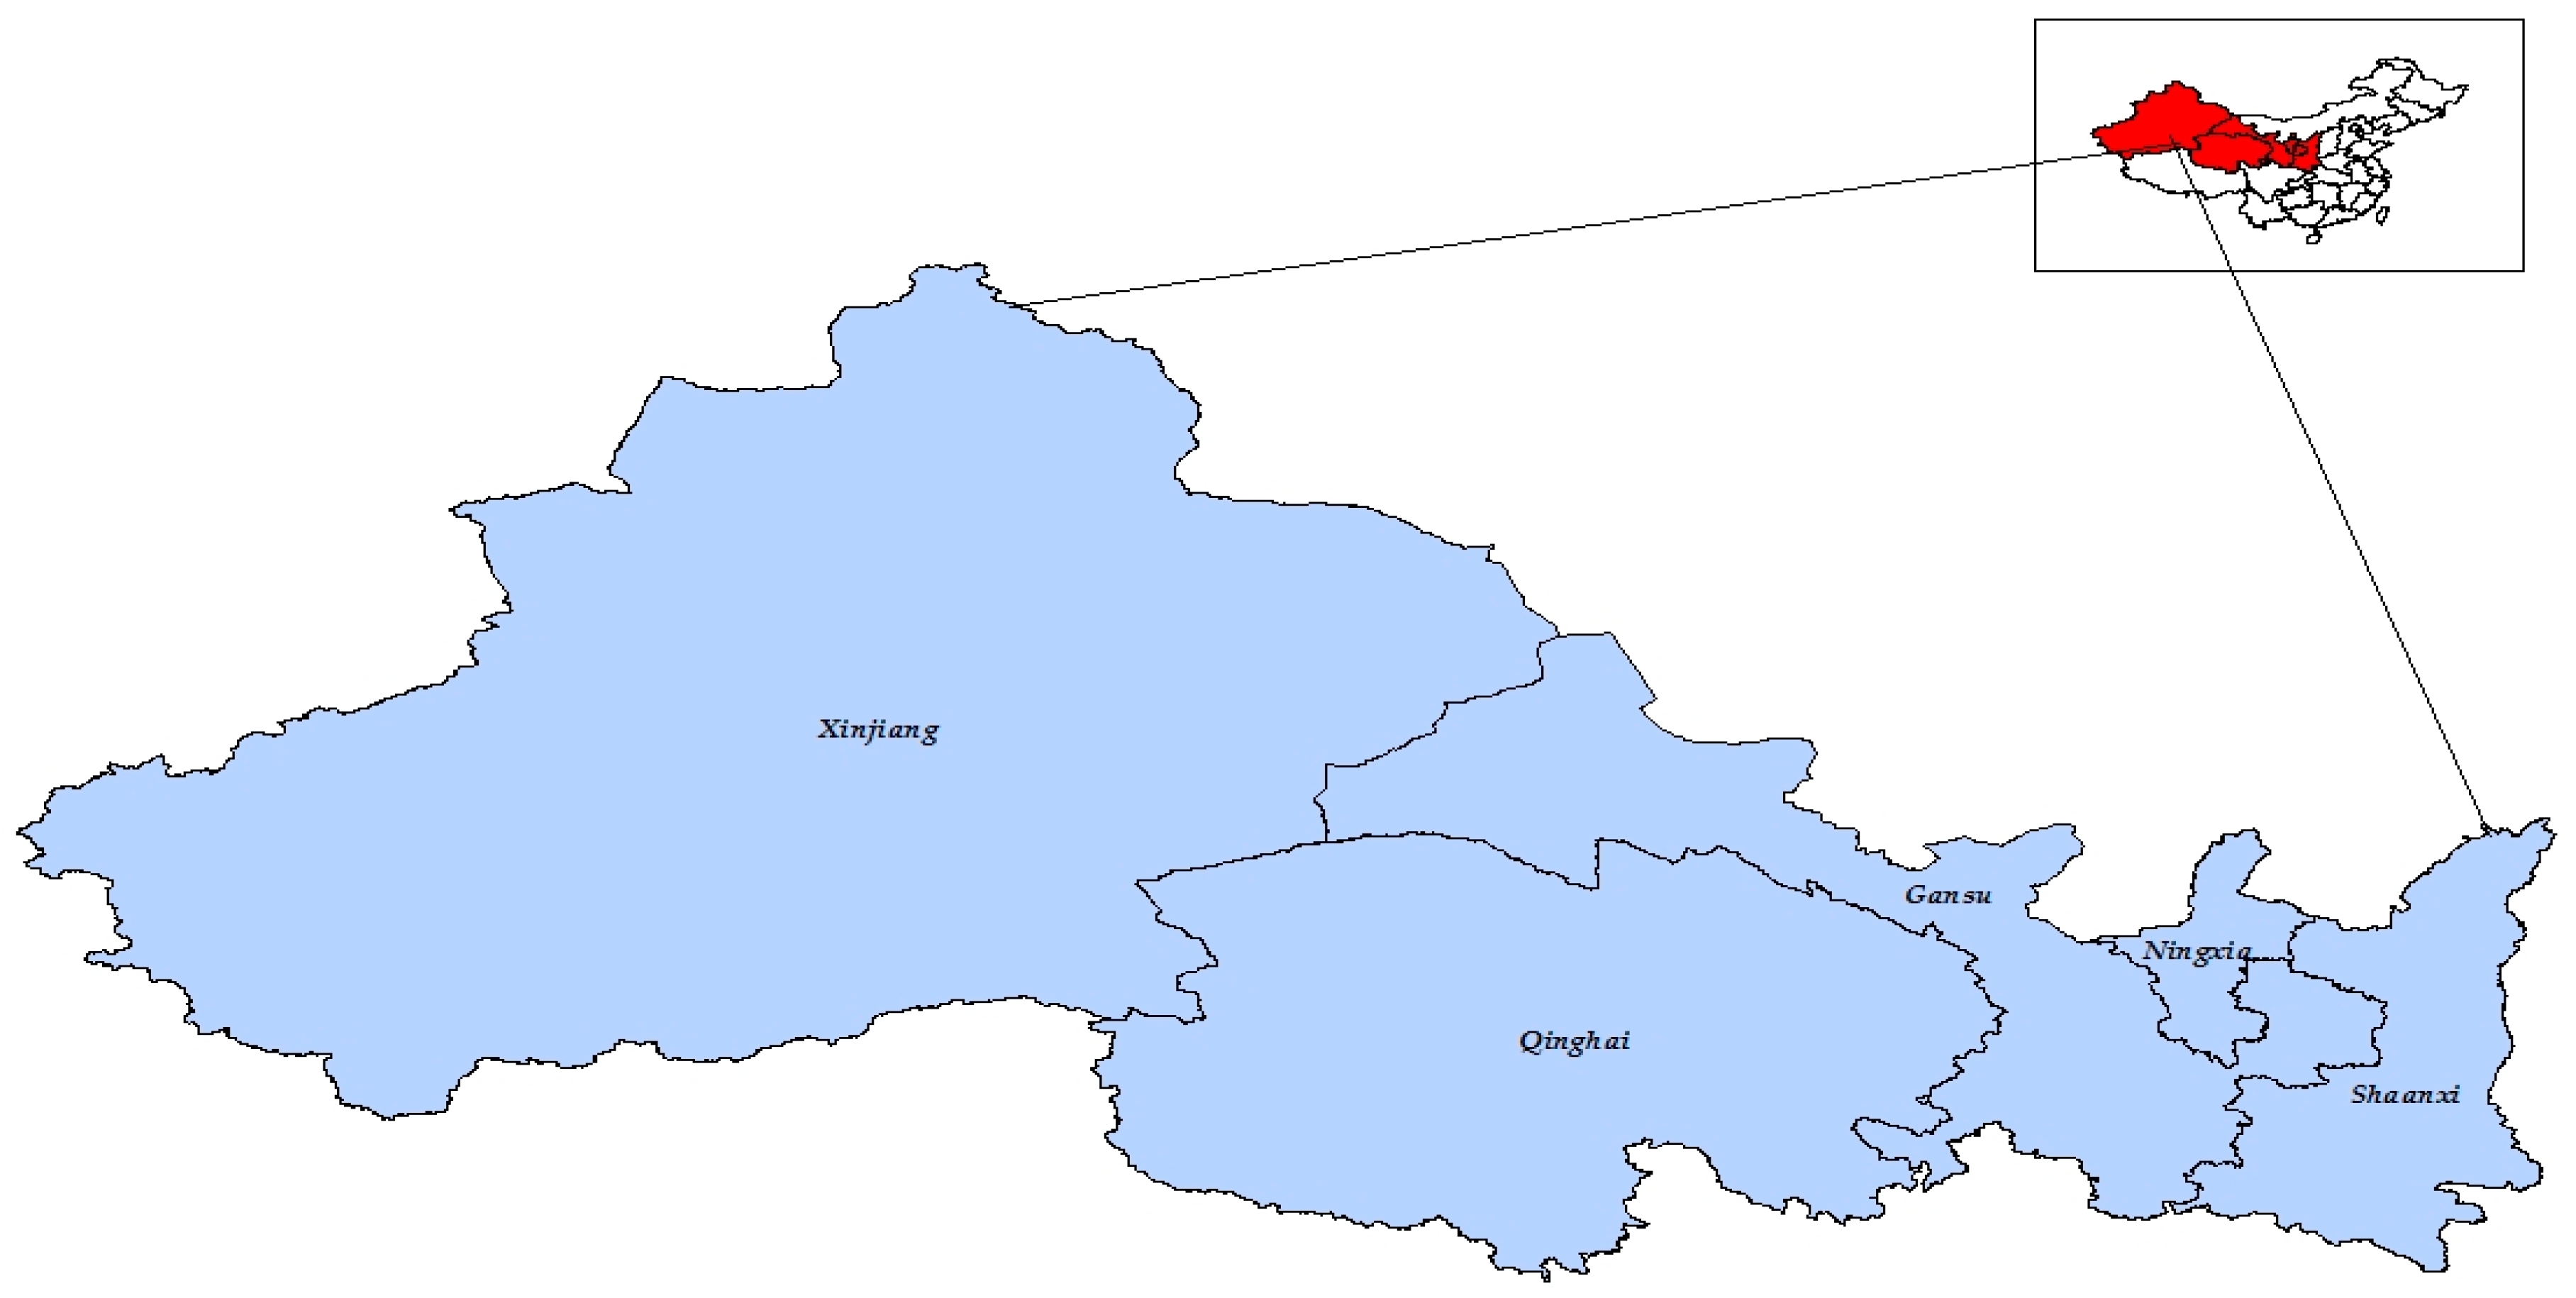
Northwest China is one of the seven geographical divisions in China, including five provinces, that is, Shaanxi, Gansu, Qinghai, Ningxia and Xinjiang (See Figure 1). It is located in the inland of northwest of China. It belongs to continental arid and semi-arid climate and high cold climate. In Northwest China, the climate is dry, rainfall is rare, and water resources are unevenly distributed. The average annual precipitation in the whole region is 230 mm, decreasing from east to west. The food production level in Northwest China is low. Although the land resources are abundant, the cultivated land only accounts for 7.3% of the land area. Northwest China is rich in oil, gas resources, wind resources, and is one of the major energy bases in China. Therefore, it is a typical region for the study of the water-energy-food system.
3. Data and Methods
3.1. Data Sources
Water resources data, for example, per capita water resources, average annual precipitation, came from China Water Conservancy Statistical Yearbook and water resources statistical yearbook of each province. Energy data such as per capita energy consumption, elasticity coefficient of energy production were derived from China Energy Statistical Yearbook and energy statistical yearbook of each province. Food data such as disaster rates and per capita food production were derived from China Food Statistical Yearbook and National Economic and Social Development Bulletins of each province. Environmental indicators such as forest coverage rate and sewage treatment rate came from the Environmental Bulletin of each province. Social and economic indicators such as per capita GDP and urbanization rate came from China Statistical Yearbook and the statistical yearbook of each province. Most of the information can be obtained on the official website. Other data were obtained through field research from government departments of water resources, energy and food.
3.2. Constructe the Evaluation Index System
The construction of evaluation index system for vulnerability and coordination of W-E-F system should follow the principles of systematicness, typicality, dynamics and scientificity. The whole evaluation index system is divided into three subsystems, each of which proposes some indicators from the three dimensions of pressure, state and response based on PSR model. Based on the previous studies [42,43,44,45,46,47,48], a regional evaluation index system of W-E-F system, which including 23 indices will be established (see Table 1). Among them, the pressure indicators of daily water consumption per capita and per capita GDP reflect the impact of human social activities and economy on water resources. Per capita water resources, average annual precipitation, and forest coverage show the state of water resources or the environment. The standard rate of industrial wastewater discharge and urban sewage treatment rate reflect the society or human how to reduce the negative impact of human activities on the environment. Per capita energy consumption, elasticity coefficient of energy consumption and unit GDP energy consumption can show the pressure of human social and economic activities on the energy system. Elasticity coefficient of energy production, elasticity coefficient of electricity production, and energy self-sufficiency rate reflect the energy current production state. Energy processing conversion efficiency and investment proportion in environmental pollution control to GDP show how companies or governments can reduce the negative impact of energy on the environment. The pressure indicators of population growth rate, urbanization rate and disaster rate can exert great pressure on the food subsystem. Per capita food production, per capita cultivated area and effective irrigation rate of farmland all reflect the state of food production and the factors influencing food production. Response indices such as agriculture mechanization and fertilizer application per unit area reflect how humans alleviate the pressure from the environment. Because of the problems of calculation and data collection, each subsystem only selects some representative indicators from three levels of pressure, state and response. The number of indicators of pressure, state and response at each level should be balanced. Otherwise, it will easily lead to a higher degree of vulnerability in a certain region and affect the authenticity of the results.
3.3. Determine Index Weight
In this paper, each index was called a vulnerability index (VI). This paper adopted the entropy weight method to determine the weight of each vulnerability index. The entropy weight method [49] is an objective weight method. Using the entropy weight method to determine the weights of indices at all levels in the index system can reduce the influence of human factors on the weights of indices and make the evaluation results more objective. Entropy is a measure of the degree of disorder in the system. If the information entropy of the index is smaller, the amount of information provided by the index is larger, the greater the role played in the comprehensive evaluation, the higher the weight should be. The main steps of entropy weight method are as follows.
First, construct m evaluation objects, each evaluation object has n indicators, and then obtain a judgment matrix of the evaluation index .
Then, due to the existence of positive and negative indicators and different data dimensions and orders of magnitude, the original data should be normalized by Equation (1) or Equation (2) in advance.
For positive indicators:
For negative indicators:
Here, is the index j of some subsystem in year i; and are the maximum and minimum values of indicators respectively; is the standardized value of each vulnerability index.
Furthermore, the entropy of each evaluation index can be obtained by Equation (3).
Here, , and . If then .
Finally, the entropy weight of the evaluation index can be calculated through Equation (4).
where, and .
3.4. Vulnerability Index Value Evaluation Model
To compare the vulnerability of each province, we used cloud-matter element model to calculate the vulnerability level of water-energy-food system based on the vulnerability index. The cloud-matter element model can well classify the evaluation objects, and can consider the ambiguity of the boundary in the classification process, so that the evaluation results are more accurate. The vulnerability level is divided into five levels, that is, highest vulnerability, higher vulnerability, moderate vulnerability, lower vulnerability, and lowest vulnerability [37] (Table 2). Different vulnerability levels indicate that the degree of injury is different in the process of development. The lower the standardized vulnerability index value is, the higher the degree of vulnerability of the index, the greater the risk of the system. Level 1 means that the system has the highest degree of vulnerability while level 5 means that the system has the lowest degree. When the vulnerability level of water-energy-food system is at level 1, Level 2 and level 3, it means that there is a great risk in the system. Relevant departments need to pay attention to it and take relevant measures to improve the situation.
3.4.1. Cloud Model
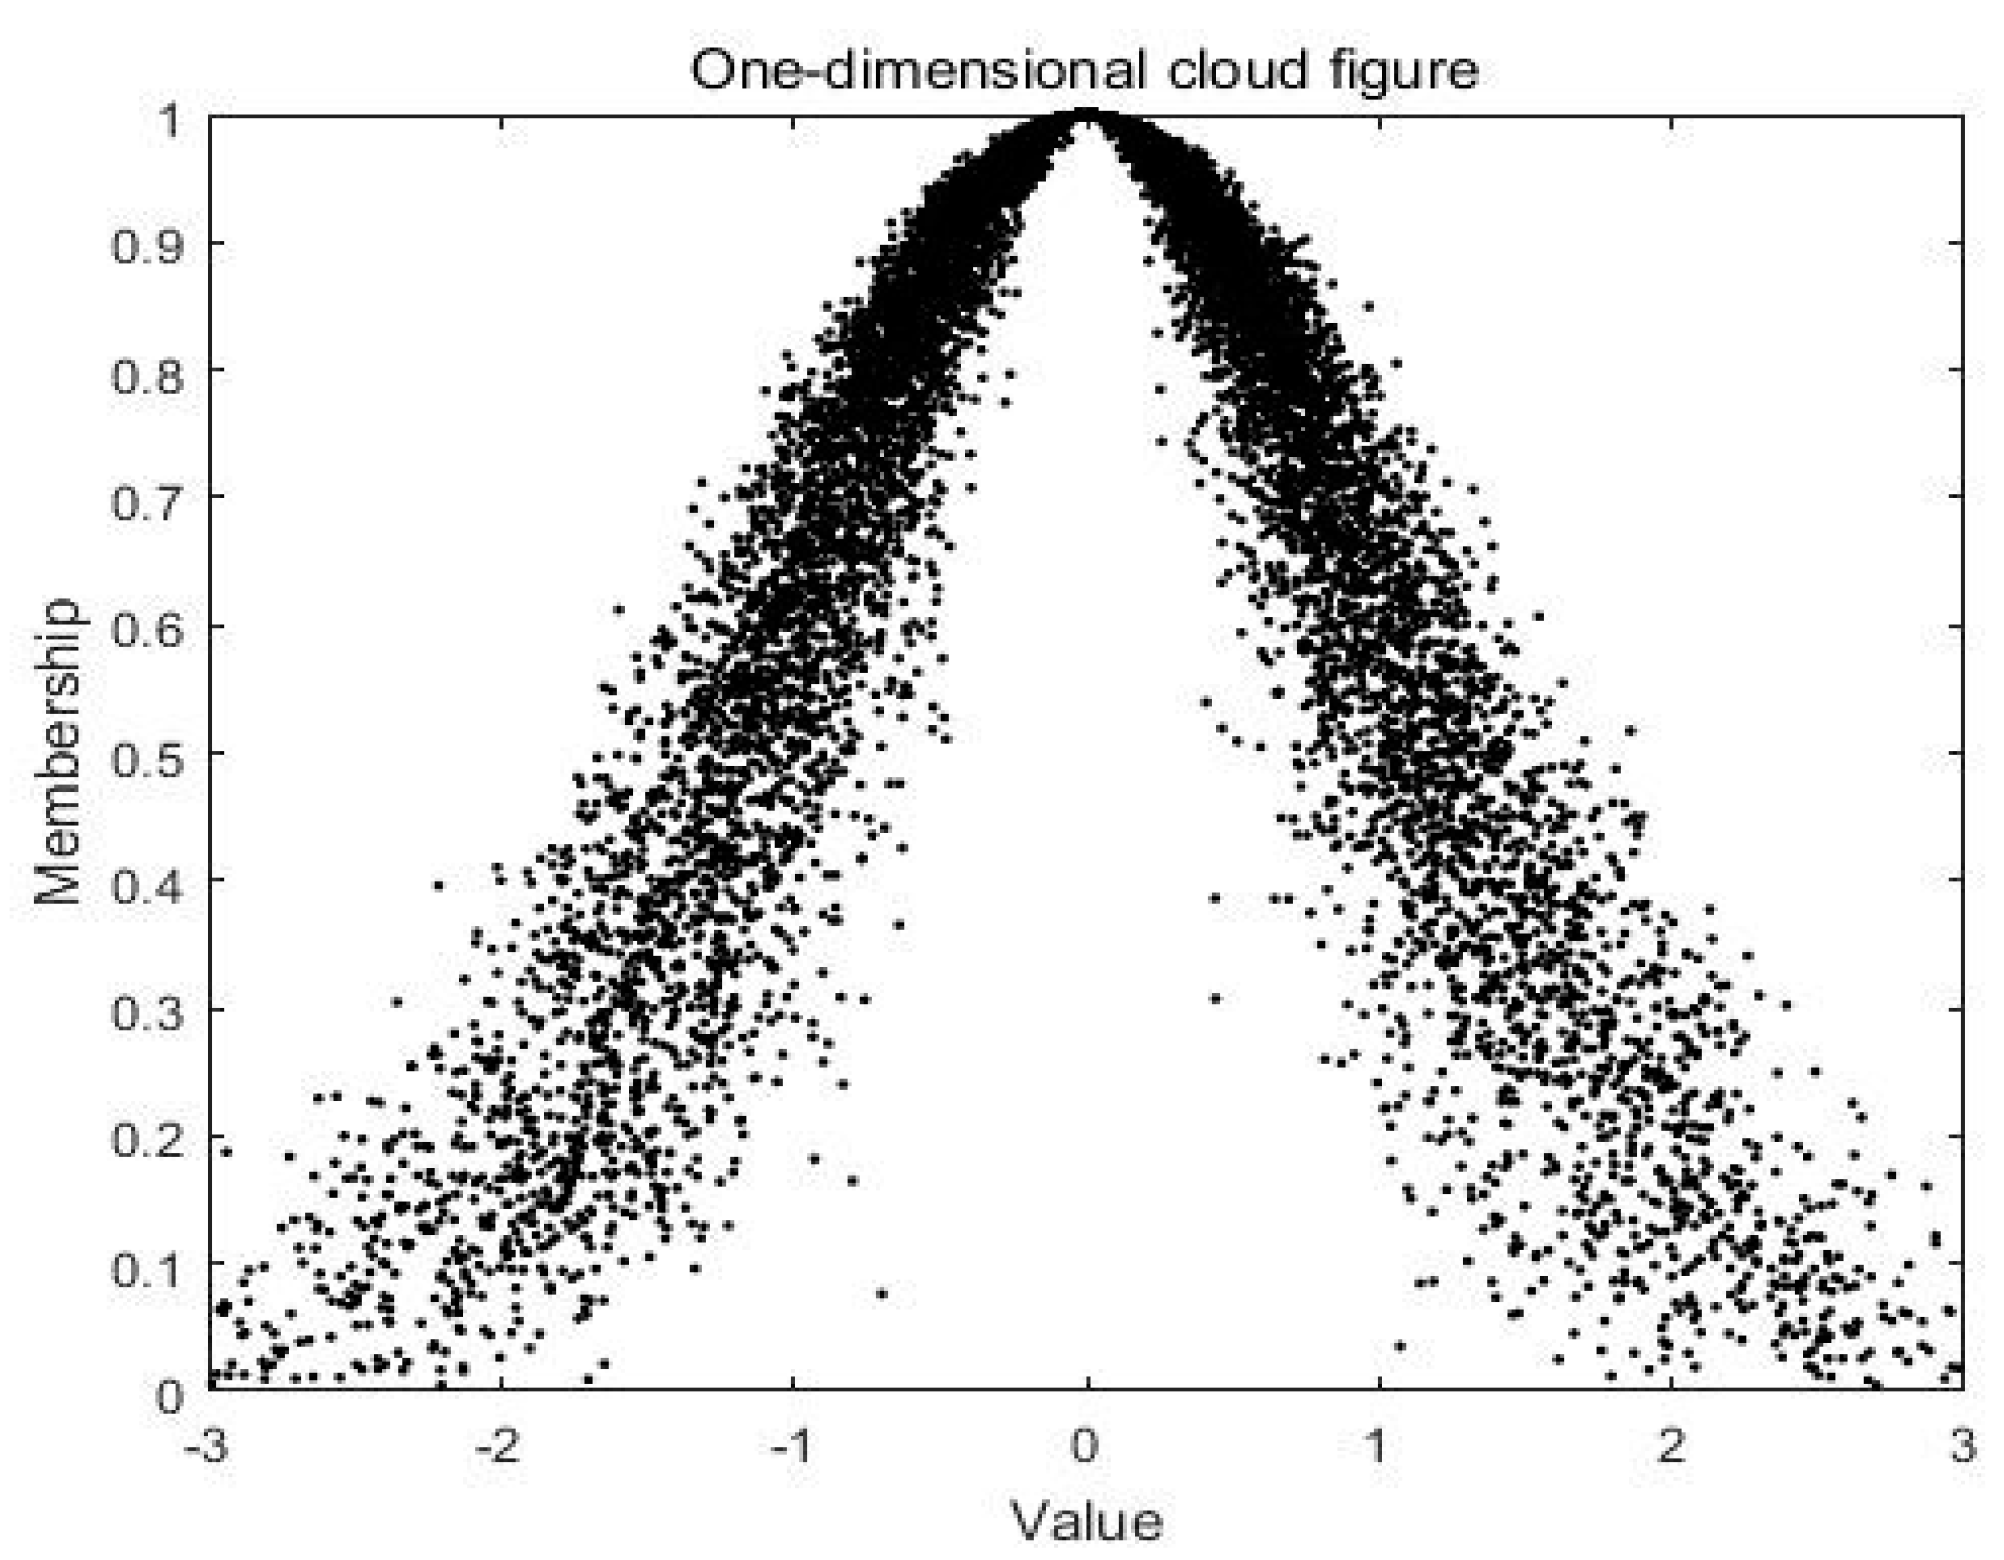
Cloud theory [23] was proposed by Li. It is a mathematical tool used for uncertainty problems and realizes the transformation between the qualitative concept and the quantitative value. At the same time, it takes into account the fuzziness and randomness of the things. The cloud model can be divided into symmetrical cloud, triangular cloud, trapezoidal cloud, normal cloud, etc. Among them, the normal cloud model is the most used. The digital features of a normal cloud can be represented by expectation , entropy , and super entropy . Among them is the average for the domain , which is the most representative cloud drop. The closer the distance to , the more concentrated the cloud drops, indicating the higher consistency. reflects the uncertainty, fuzzy and random of data in the vulnerability level assessment process. reflects the degree of discrete sample data collected in the in the vulnerability level assessment process. The higher the is, the greater the discretization of cloud droplets is, the greater the randomness of membership is, and the thicker the cloud is. A one-dimensional normal cloud diagram is shown in Figure 2.
.
3.4.2. Basic Theory of Matter Element
The concept of matter element is to provide a new way for classification and pattern recognition of things [50]. Matter element analysis often represents things as , N represents the name of things, C means the characteristics of things, and V means the value of C, R is the basic element of a thing. A thing usually has multiple features (), as shown in Equation (5). In the matter element model, is a definite value, and its final result is also calculated from this value, so matter element theory does not consider the randomness and ambiguity of the concept of things.
where, R is called a multidimensional matter element, is the partition element of R.
In matter element theory, each index is usually quantitatively divided into several grades, and the range of values belonging to the same index is combined to form a grade called classical domain. The total value range of each level, that is, the collection of classical domains, is called the node domain. The classical domain is shown in Equation (6).
In this paper, N represents the vulnerability of water resources, energy and food subsystems respectively, and represents the vulnerability level of each subsystem (k = 1, 2, 3, 4, 5). If N is the water resources subsystem, then represents the vulnerability level k (k = 1, 2, 3, 4, 5) of the water resources subsystem, represents the vulnerability evaluation index of the water resources subsystem, indicates the division interval of the index of water resources subsystem at the vulnerability level k. The interval of vulnerability of each indicator is shown in Table 2.
3.4.3. Calculation Steps of Cloud-Matter Element Model
In traditional matter element analysis, each vulnerability level is divided by a rigid interval, while the fuzziness at the boundary of each level and the randomness of each index to the membership of each risk level are ignored. In the cloud-matter element model, the range of each vulnerability level is represented by the cloud model. In addition, the cloud-matter element is expressed as Equation (7).
Before conversion, each vulnerability level is interval number , and each interval number is regarded as a double-constraint index . The calculation formula of the cloud parameter is as follows.
where, and are the minimum and maximum values of each classification interval of vulnerability. S is a constant, and the value of S is generally adjusted according to the randomness and fuzziness of the specific index.
The steps for calculating the relevance degree of the cloud-matter element model are as follows.
Step 1: According to the grade interval of each index, the digital characteristics of the cloud parameters were calculated through Equation (8).
Step 2: Generate a normal random number with expectation and variance . Namely, .
Step 3: Supposing the standardized values of each index are one cloud droplet, and calculate the relevance degree of cloud droplet at vulnerability level k through Equation (9).
Step 4: Calculate the comprehensive relevance degree of each subsystem relative to vulnerability level k through Equation (10).
where, is the weight of the index in each subsystem.
Step 5: According to the principle of maximum relevance (Equation (11)), the vulnerability evaluation grade of thing N is determined. Finally, the vulnerability level of the thing N is L.
3.5. Establish Coordination Degree Model
Before using the coordination degree model to calculate the coordination degree of water-energy-food system, we must first calculate the comprehensive vulnerability index values of each subsystem and water-energy-food system. Then we compare the comprehensive vulnerability index value of each subsystem in pairs to compare the development level of each subsystem. Finally, the comprehensive vulnerability index values of each subsystem and the water-energy-food system are linked by the formula, and the coordination degree of the water-energy-food system is calculated.
3.5.1. Comprehensive Vulnerability Index Value
The vulnerability of a system is defined as the degree of injury and the ability to cope with potential disaster factors both inside and outside the system when the system is exposed to the environment. In this paper, each evaluation index is called vulnerability index (VI), and the value of each evaluation index is called vulnerability index value (VIV). The vulnerability index of each subsystem is linearly weighted to get the comprehensive vulnerability index value (CVIV) of each subsystem. The comprehensive vulnerability index value reflects the current development level of each subsystem and lays a foundation for the calculation of vulnerability level and coordination degree of water-energy-food system. The comprehensive vulnerability index value of water resources, energy, food subsystems and water-energy-food system are calculated by Equations (12) and (13).
where, , , and are the weights of the vulnerability index of the various subsystems; , , and are the standardized vulnerability index values of the three subsystems of water resources, energy and food respectively; , , and are undetermined coefficients, which reflect the weights of the various subsystems. is the comprehensive vulnerability index value of the W-E-F system and reflects the comprehensive benefits and levels of the three subsystems; According to relevant research results [48], it is considered that the three systems are equally important, so that .
3.5.2. Calculate the Comparison Coefficients between Subsystems
To further analyze the contrast relationship between the three subsystems of water resources, energy and food, the comprehensive vulnerability index values (CVIV) of each subsystem were compared in pairs. The formula is as follows.
3.5.3. Coordination Degree Model
Coordination is a kind of benign correlation between two or more systems, which is the relationship between systems or elements within the system with proper synergy, harmony and good circulation. Liao [29] proposed coordination degree model to assess the coordination degree of two subsystems of environment and economy. In this paper, we extend the coordination degree model to evaluate three subsystems of water resources, energy and food (Equation (15)).
where, is the coordination degree; , , and are the comprehensive vulnerability index values of the water resources, energy, and food subsystems, respectively; is the comprehensive vulnerability index value of the W-E-F system. K is the adjustment factor, and k is equal to 3 in this paper. , , and can be calculated through Equations (12) and (13).
Coordination levels are divided into three categories according to coordination degree D, which are uncoordinated declination, transitional development, and coordinated development. Each level is represented by symbol I, II and III. In addition, then each class is divided into several subclasses according to coordination degree D. The higher the value of D, the higher the coordination degree, which represents the high development level of each subsystem of water resources, energy and food and the high degree of consistency of development. The results of coordination degree classification are shown in Table 4.
4. Results and Analysis
4.1. Vulnerability Index Values of W-E-F System in 2015
4.2. Vulnerability Level of W-E-F System
The Equations (5)–(11) were used to calculate the vulnerability level of W-E-F system from 2006 to 2015 in Northwest China (Table 8). This paper analyzed the relevance degree of W-E-F system vulnerability in Northwest China in 2015, as shown in Table 9.
By evaluating the vulnerability levels of W-E-F system in Northwest China from 2006 to 2015, it can be found that the vulnerability levels of the five provinces over the years almost were Level 1, that is, highest vulnerability. Among them, the vulnerability levels have gradually become better from 2007 to 2011, but the vulnerability has begun to decline from 2012 to 2014, in 2015, the vulnerability has increased. The vulnerability results of Qinghai in the five provinces were the worst, except for the 2011 and 2012, the vulnerability levels in the remaining years belonged to highest vulnerability (Level 1). The water-energy-food system in Qinghai was highest vulnerability, and its economic development will be seriously damaged if no measures are taken to improve this phenomenon. The relevance degrees were mainly concentrated on the two levels of highest vulnerability and higher vulnerability, indicating that although the degrees of vulnerability began to decline in 2015, there is still a trend toward highest vulnerability in the future if the development between water resources, energy and food is not coordinated. In a word, the degree of vulnerability in Northwest China was volatile, and the degree of vulnerability was relatively high. It indicated that the current development of water-energy-food system was under great pressure from the social environment and has not taken adequate countermeasures. By analyzing each index value, it was found that the state index value of water resource system was highest vulnerability, indicating that water resource was relatively scarce in Northwest China. The energy subsystem response index was highly vulnerable, and the energy subsystem was negatively affected by social activities and environment. The food subsystem was vulnerable due to population growth and high urbanization level.
4.3. Coordination Degrees of W-E-F System
4.3.1. Analyze Comprehensive Vulnerability Index Value
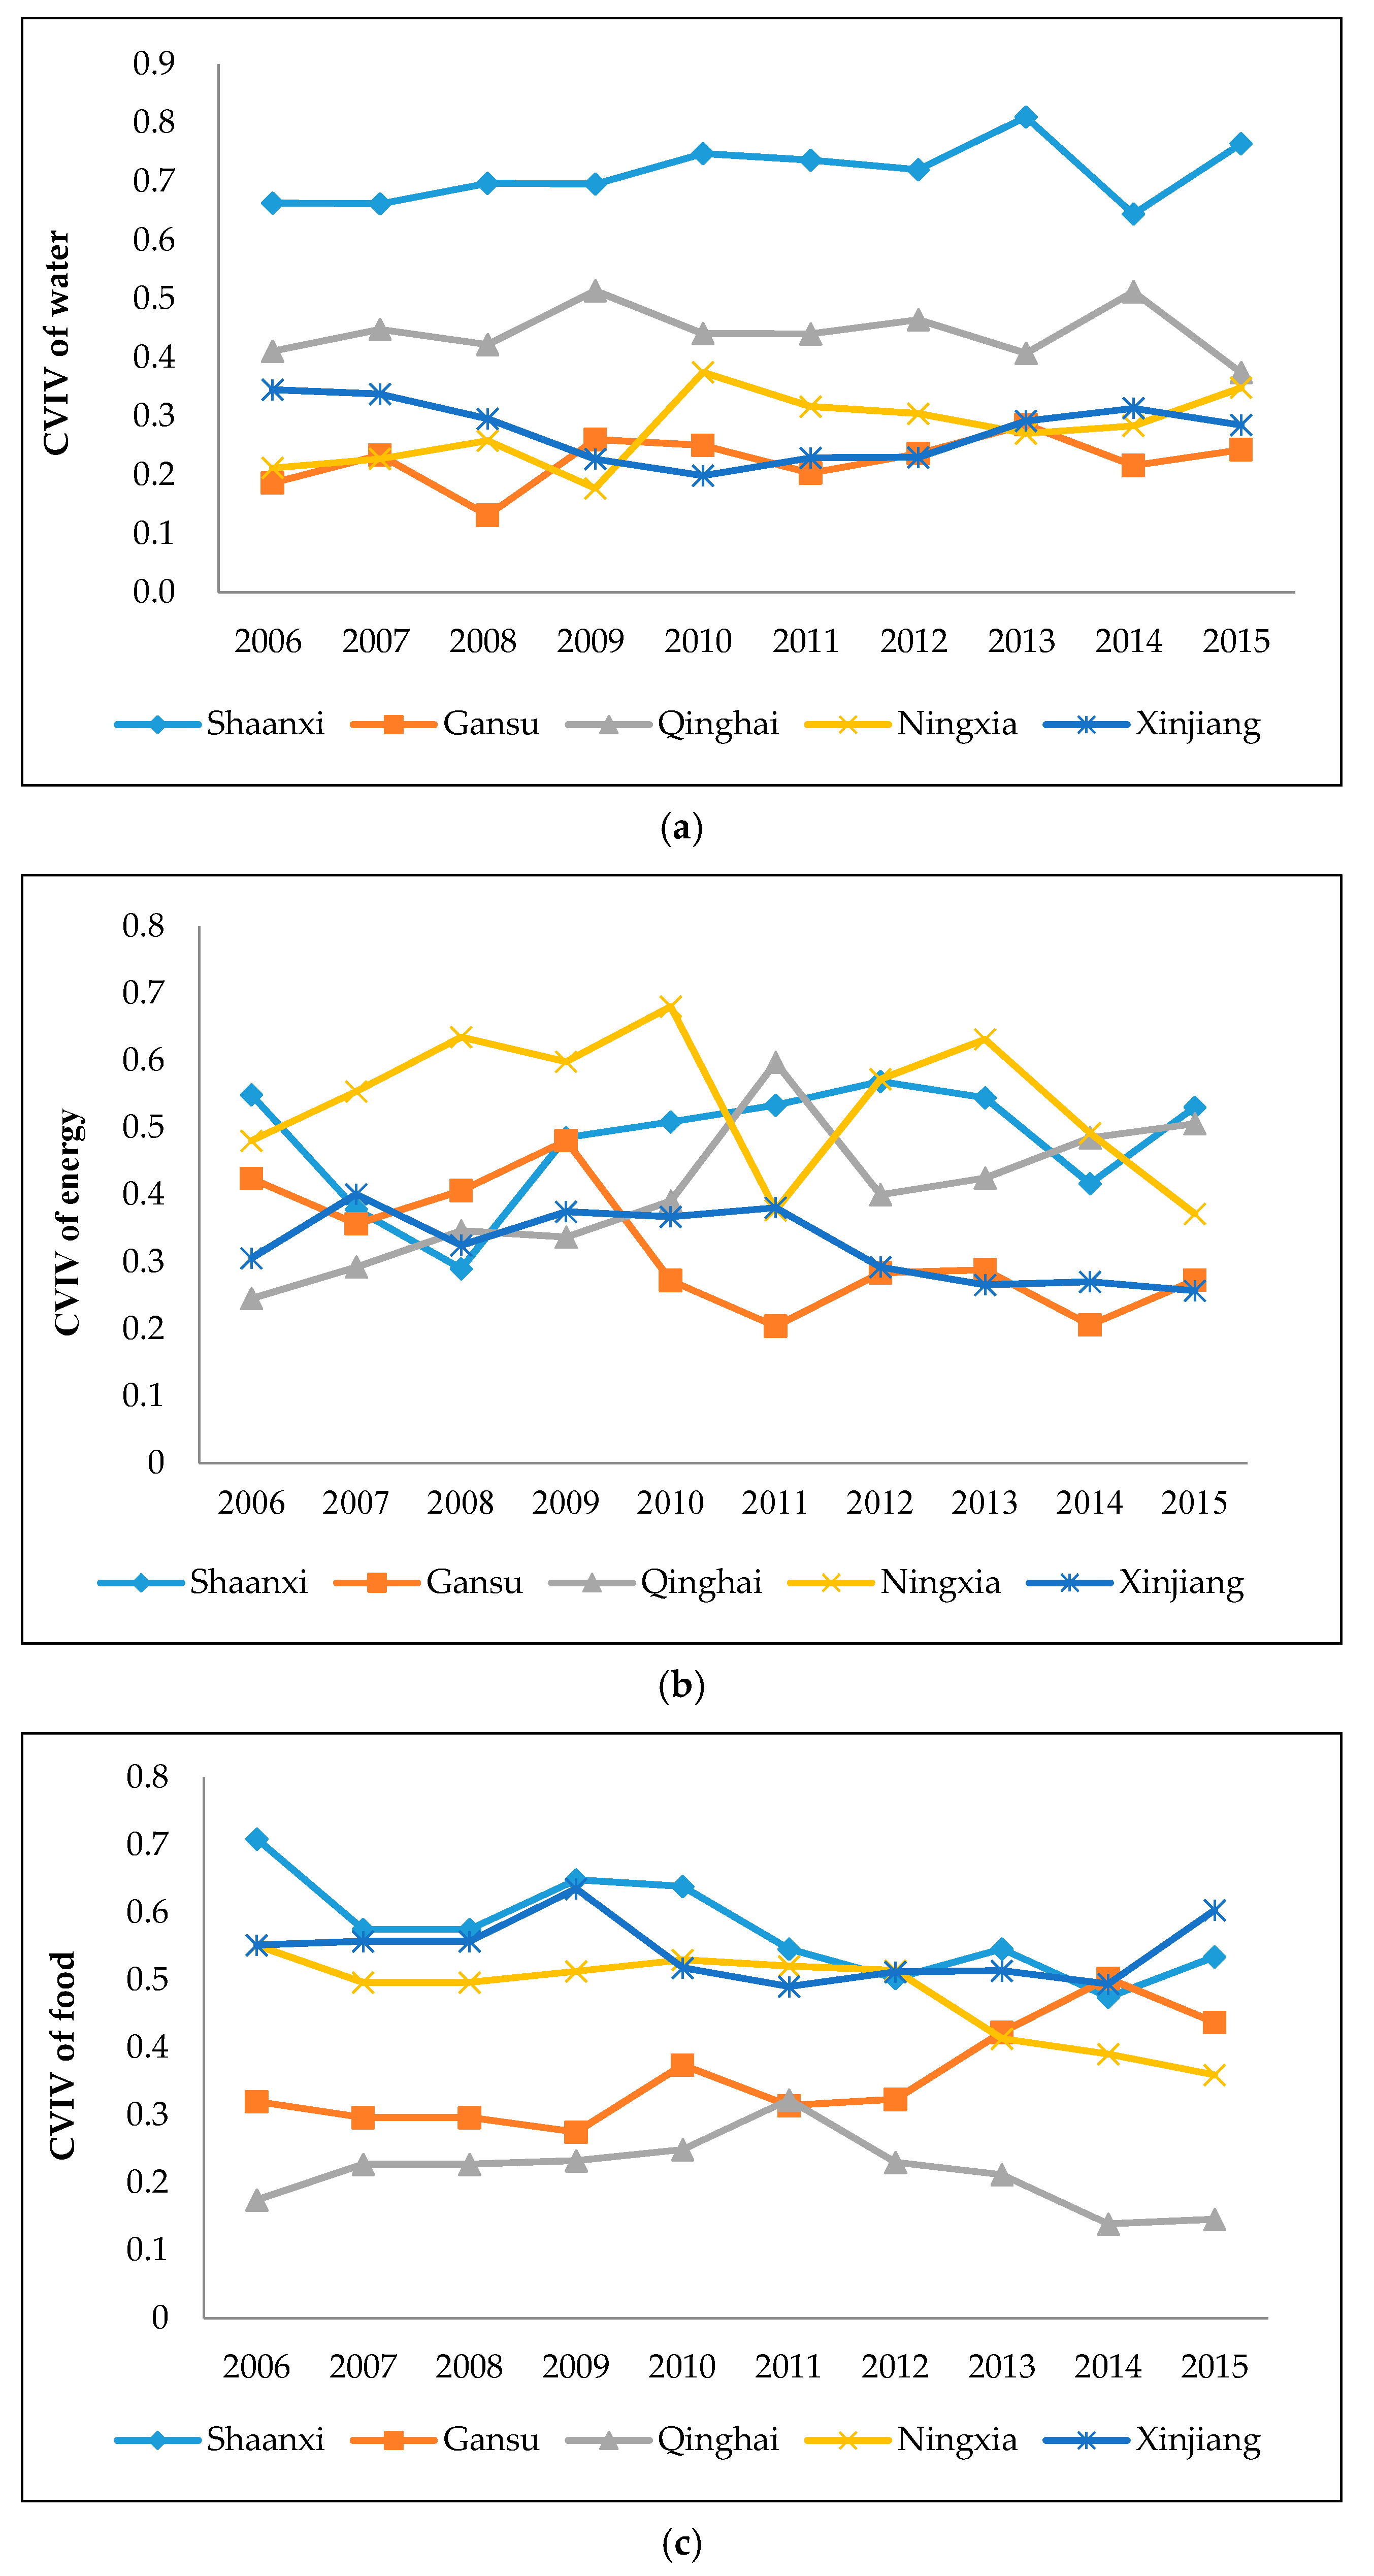
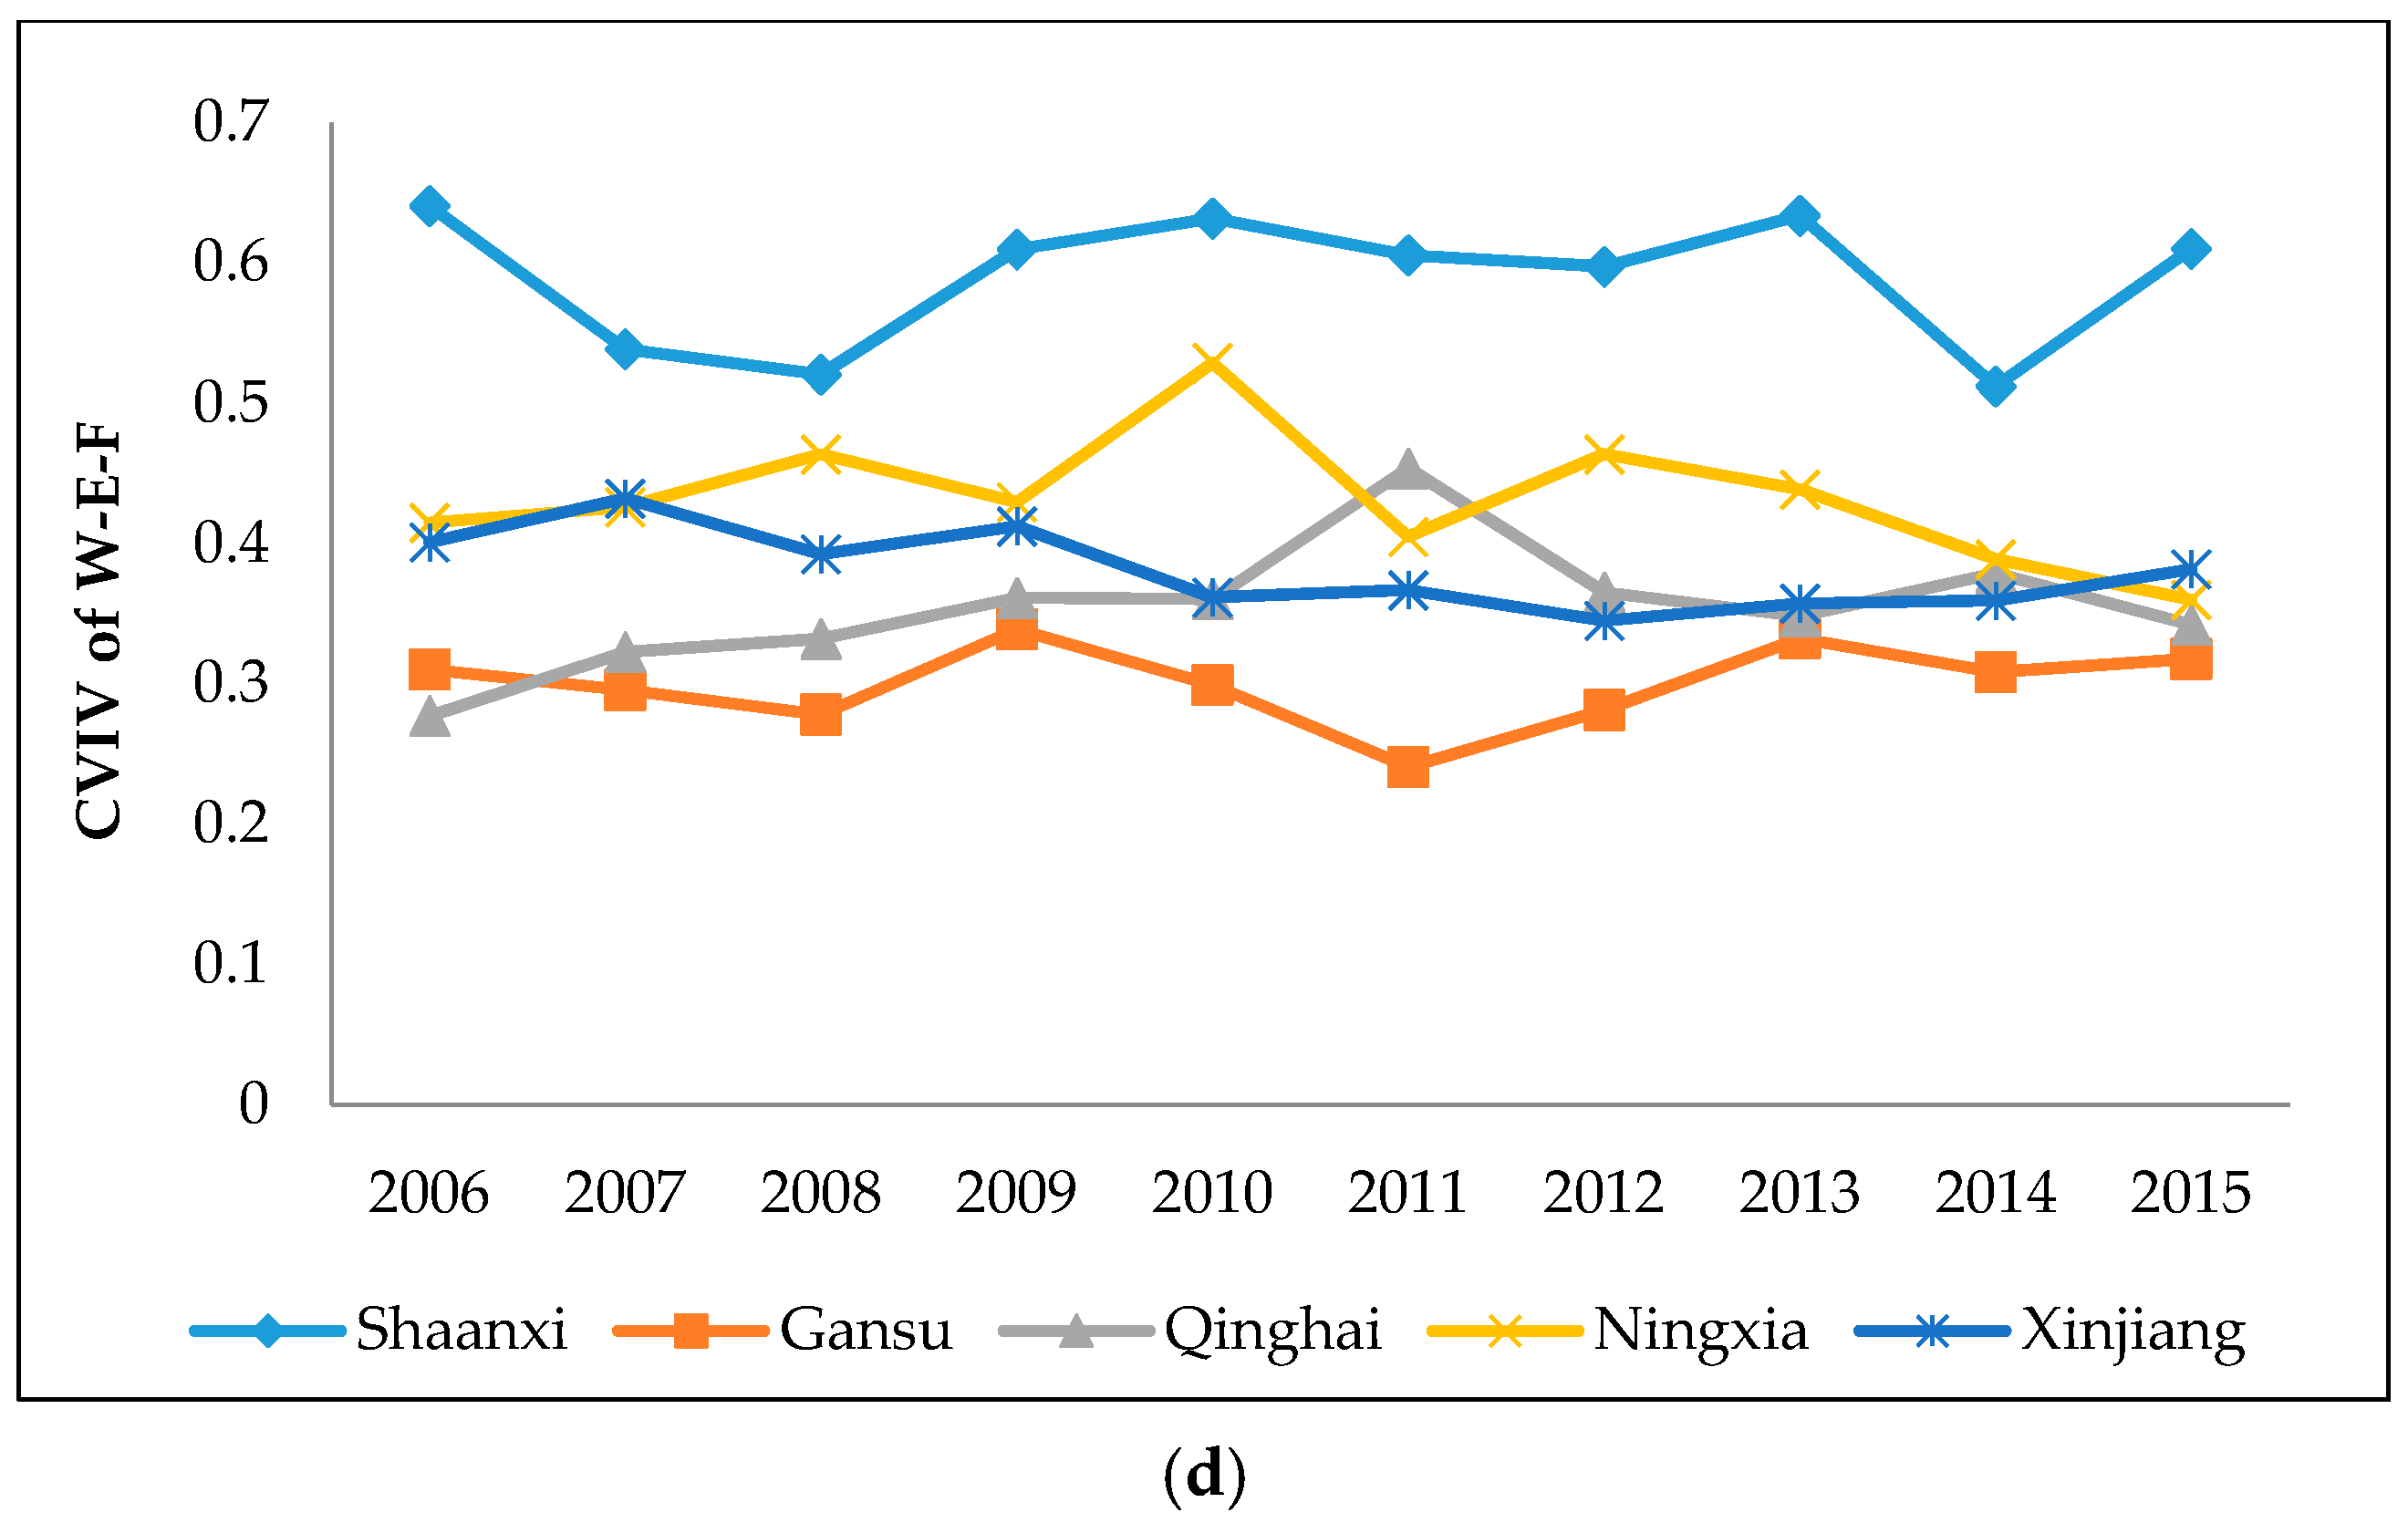
From 2006 to 2015, the comprehensive vulnerability index values (CVIV) of water resource (W(w)), the comprehensive vulnerability index values of energy (E(e)), the comprehensive vulnerability index values of food (F(f)), and the comprehensive vulnerability index values of W-E-F system (T) in Shaanxi, Gansu, Qinghai, Ningxia, and Xinjiang were calculated through Equations (12) and (13). To make a more intuitive comparison of the time series variation trend of the comprehensive vulnerability index values of each subsystem and W-E-F system in each province, the calculation results were represented by line graph, as shown in Figure 3.
It can be seen from the comprehensive vulnerability index values of water resources (Figure 3a), the development of water resources in Northwest China from 2006 to 2015 was slow, the fluctuation was relatively flat and the overall level was low. The water resource comprehensive vulnerability index values in Northwest China except Shaanxi province were less than 0.5, and the water resources of Gansu province was the worst. It showed that the situation of water resources in Northwest China was very bad except Shaanxi Province. One reason is that the water resources themselves are less, and the other is that the water resources are not well used. By analyzing comprehensive vulnerability index values of energy in Northwest China (Figure 3b), we can find that from 2006 to 2015, the comprehensive vulnerability index values of energy fluctuated greatly, and the change trend was roughly divided into two stages, from 2006 to 2011, it was in a slow rising stage, while from 2012 to 2015, it was in a slow declining stage. Mainly because the energy resources were limited and the energy resources were largely opened. The energy subsystem is greatly influenced by social and economic activities. Through the analysis of the comprehensive vulnerability index values of food in Northwest China (Figure 3c), we can get that from 2006 to 2015, the comprehensive vulnerability index value of food in Northwest China continued to decline. The main reasons were that the cultivated land area decreased year by year with the development of the economy and the improvement of urbanization level, which led to the sharp decrease of food output. In Figure 3d, the comprehensive vulnerability index values of W-E-F system in five provinces were shown. It can be concluded that the comprehensive vulnerability index values of W-E-F system in Shaanxi province ranked first. The comprehensive vulnerability index values from 2006 to 2015 were all greater than 0.5 in Shaanxi, while those of Gansu, Qinghai, Ningxia and Xinjiang were all basically less than 0.5. It showed that the development of water-energy-food system in Shaanxi was the best. The economic development of Shaanxi ranked first in the Northwest China, further demonstrating that the coordinated development of water-energy-food was conducive to promote economic development. The comprehensive vulnerability index values of W-E-F system in Gansu from 2006 to 2015 ranked last, mainly because of the slow development of water resources subsystem in Gansu. The comprehensive vulnerability index values of water resource in Gansu were lower than 0.3 from 2006 to 2015, it showed that Gansu is very short of water. In a word, the development of the water-energy-food system in Northwest China was poor except for Shaanxi province. Relevant departments should take measures to reduce the vulnerability of water-energy-food system and improve the coordination degree of water-energy-food in order to promote sustainable development of economy.
4.3.2. Compare the Correlation between Different Subsystems
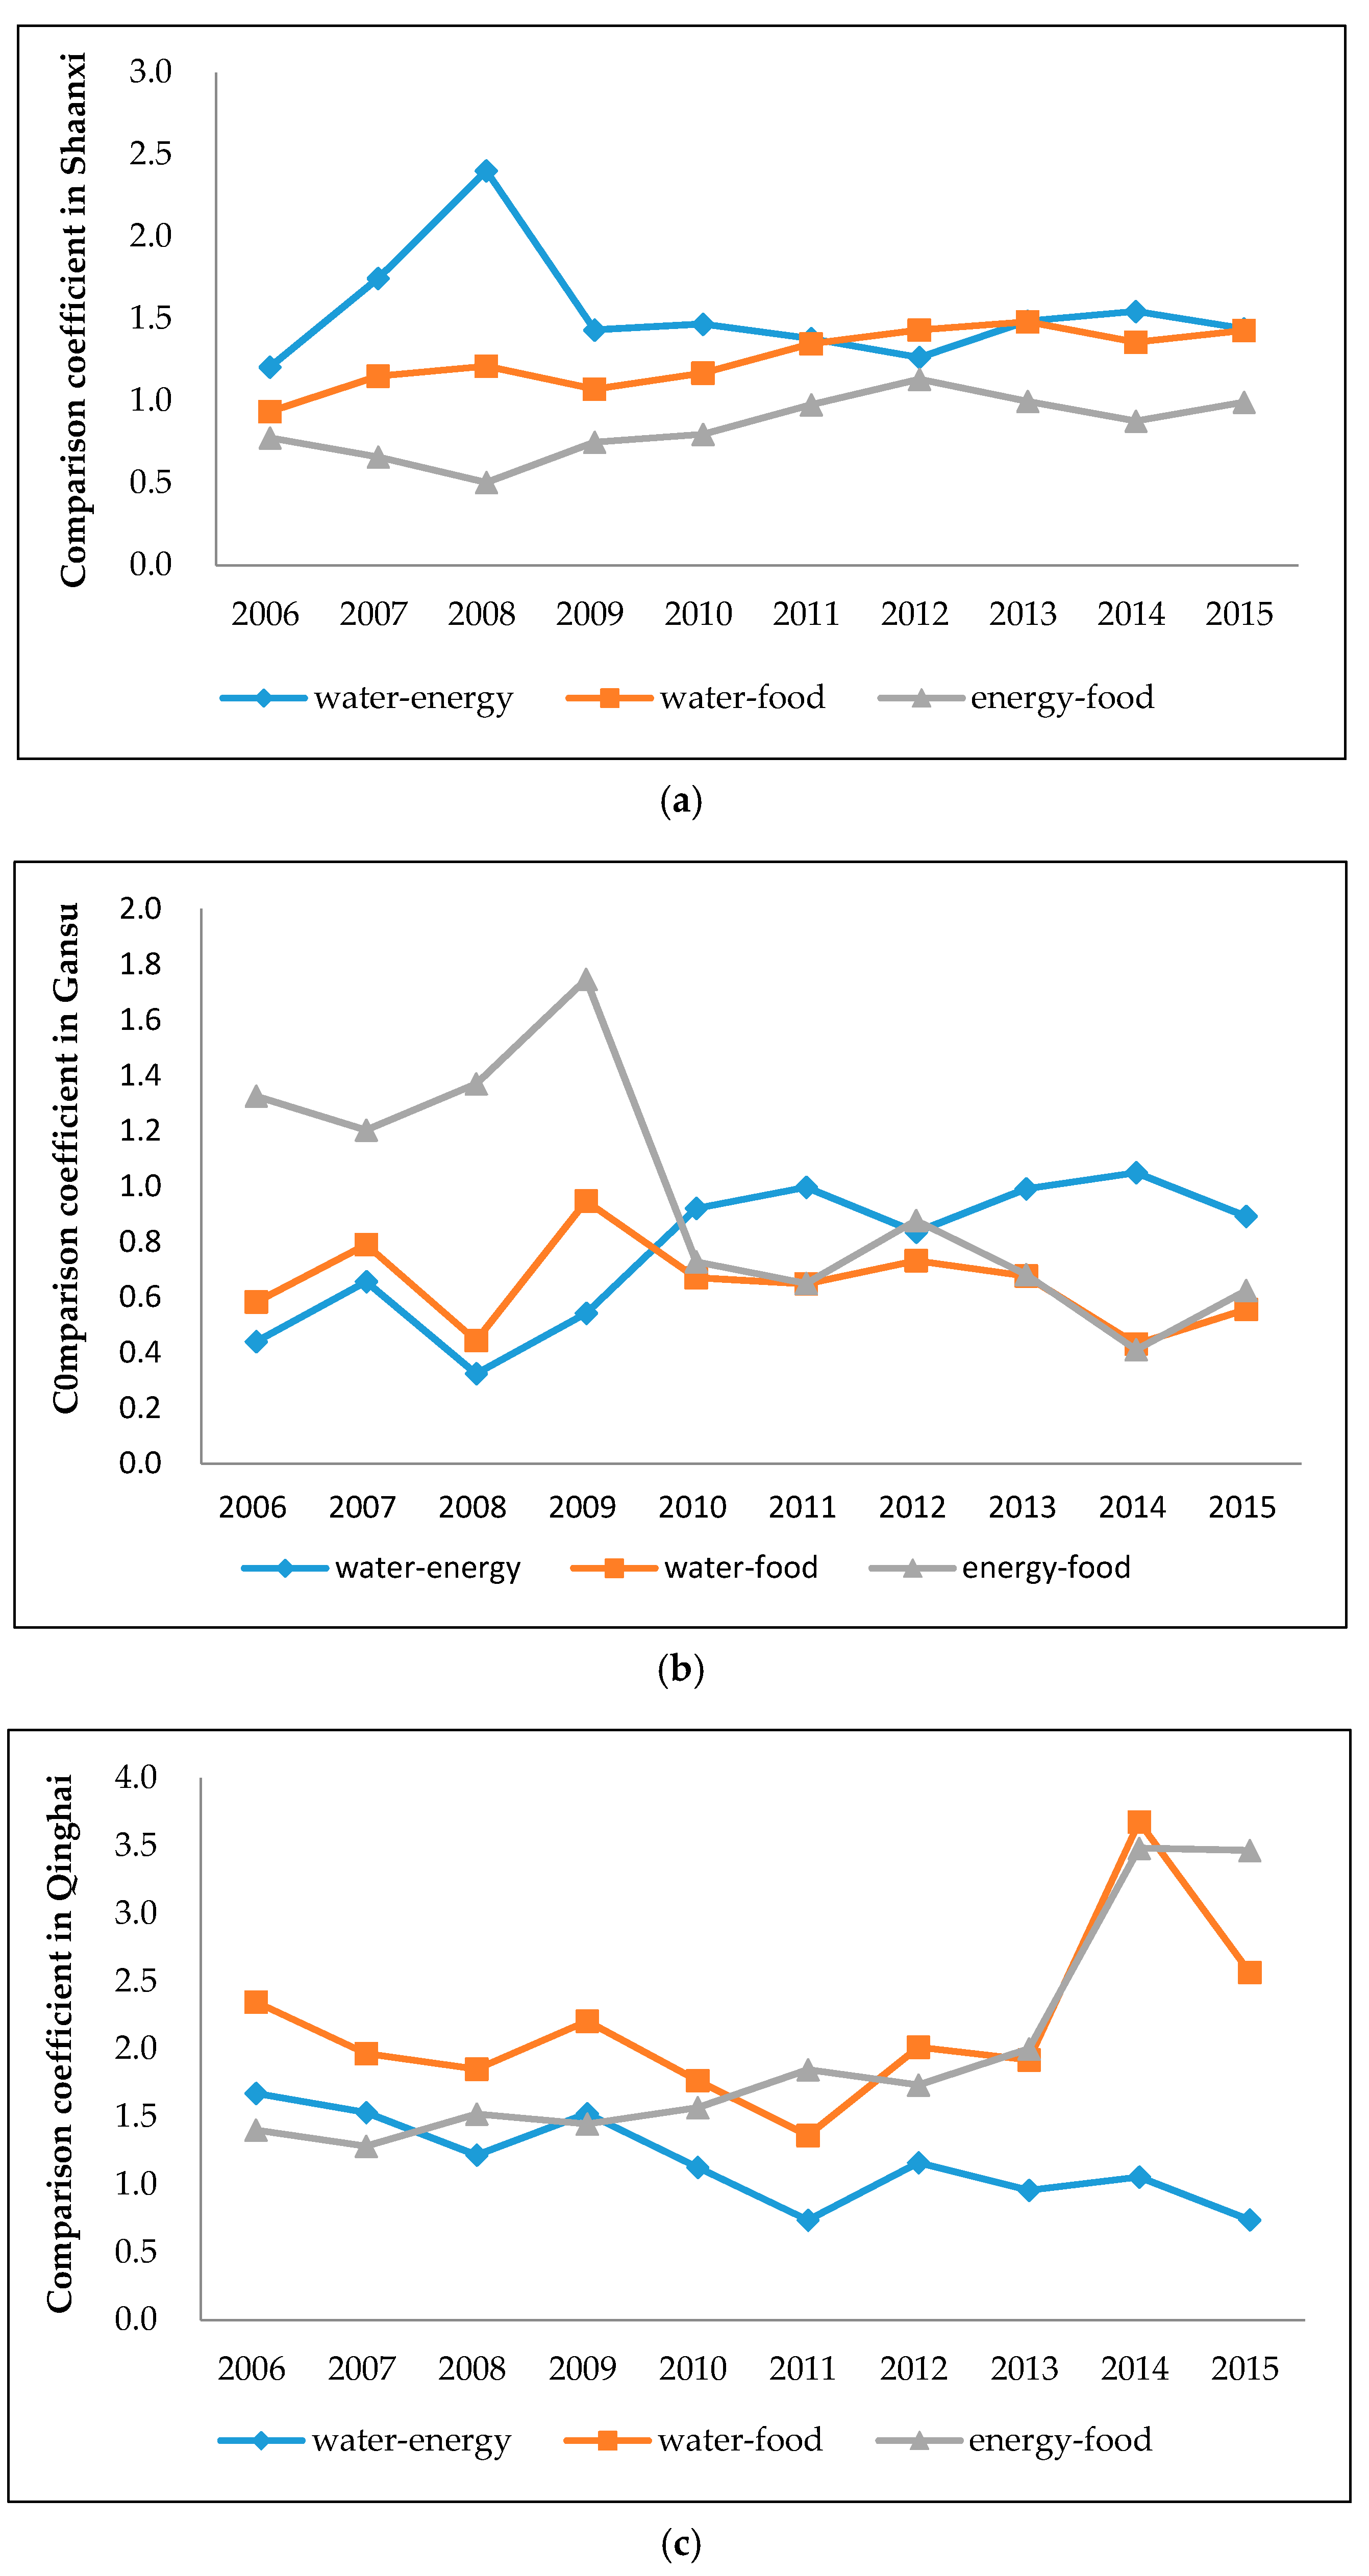
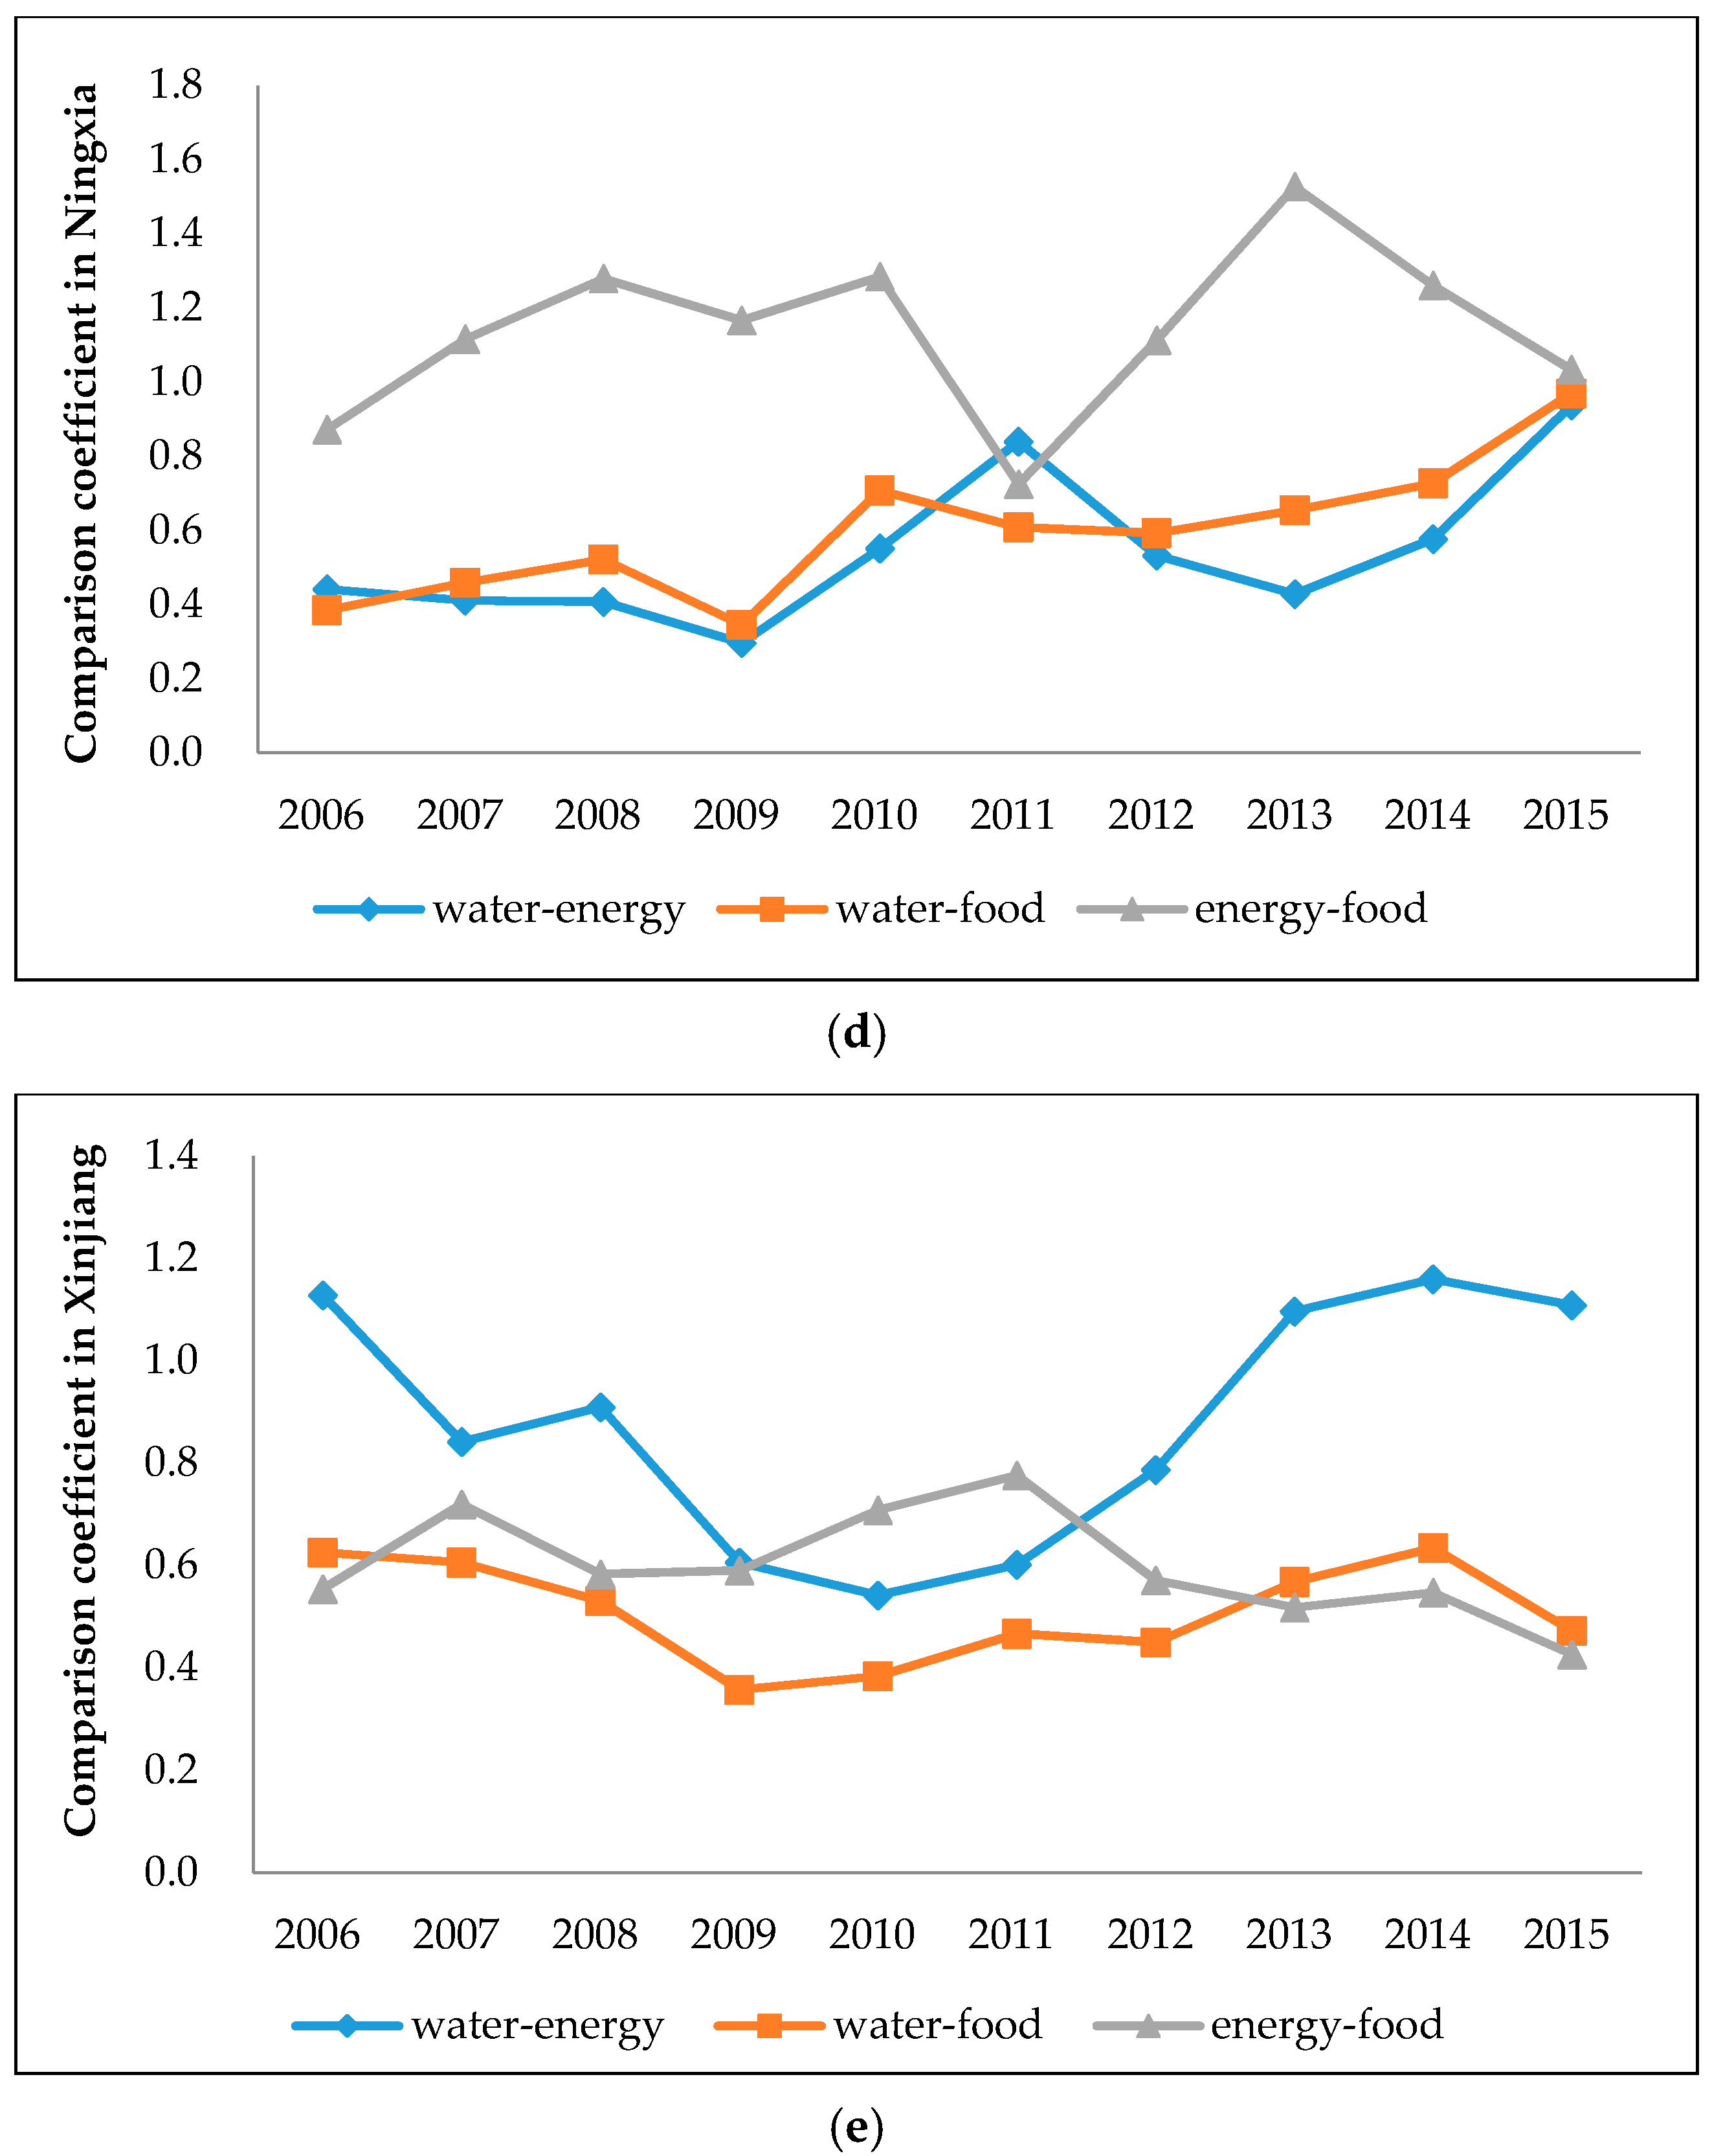
According to Equation (14), the comparison coefficients between the three subsystems of water resources, energy, and food in the five provinces of Northwest China were calculated. The results were shown in Figure 4.
By analyzing the comparison relationship between water resources, energy and food (Figure 4), we can obtain that from 2006 to 2015, the values of and in Gansu, Ningxia and Xinjiang were less than 1, indicating the development of regional water resources relative to energy and food was lagging behind. Even in some years, was less than 0.6, which belonged to the highest shortage type of water resource, it showed that water resources in Gansu, Ningxia and Xinjiang were in bad condition, it was mainly due to the excessive consumption of water resources for the development and use of regional energy and food irrigation in the period of time. Gansu, Ningxia and Xinjiang must adjust the water consumption structure of energy and food so as to promote the coordination degree of W-E-F system. In Shaanxi and Qinghai, the values of and were basically greater than 1, indicating that the situation of water resources in Shaanxi and Qinghai were better than that of energy and food in Northwest China. The main reasons were that there are many rivers and abundant rainfall in Shaanxi and Qinghai, and the comprehensive vulnerability index values of water resources were affected by per capita water resources. The elasticity coefficient of energy production and the elasticity coefficient of electricity production fluctuated greatly, thus affecting the comprehensive vulnerability index of energy subsystem. The economy of Shaanxi was more developed and the level of urbanization was high. Although the total area of land was large in Qinghai, the area of agricultural cultivated land was less, which led to the shortage of food self-sufficiency rate. Therefore, Shaanxi and Qinghai should improve energy production processes and irrigation infrastructure.
From 2006 to 2015, the values of in Shaanxi and Xinjiang were almost less than 1, which indicated that the development and use of energy in the period of time lagged behind food production. The main reasons were the low efficiency of processing and conversion of energy, high energy consumption elasticity and the increasing demand for energy with the rapid development of economy. The values of the in Shaanxi province were slowly rising, which meant that the situation of energy was getting better, but Xinjiang’s was less than 0.8, which belonged to higher shortage and had a downward trend, showing that the energy situation in Xinjiang was getting worse. The main reasons were that the energy resources in Xinjiang were relatively scarce and the use rate of energy was relatively low. Because of the water consumption in every link of energy production and processing, the lack of water resources will also make the situation of energy worse. The values of in Qinghai and Ningxia were mostly greater than 1, which indicated that the development and use of energy was better than food production in the time period. The areas of cultivated land in Qinghai and Ningxia were insufficient, resulting in low food yield. In general, the values of in Gansu had a fluctuating decline trend, and the fluctuation range was relatively large, mainly due to the impact of the volatility of the water resources subsystem. Therefore, the lack of water resources was the main reason for the high vulnerability of water-energy-food system in Gansu. The government should take relevant measures to improve the use rate of water resources.
4.3.3. Calculate the Coordination Degrees of W-E-F system
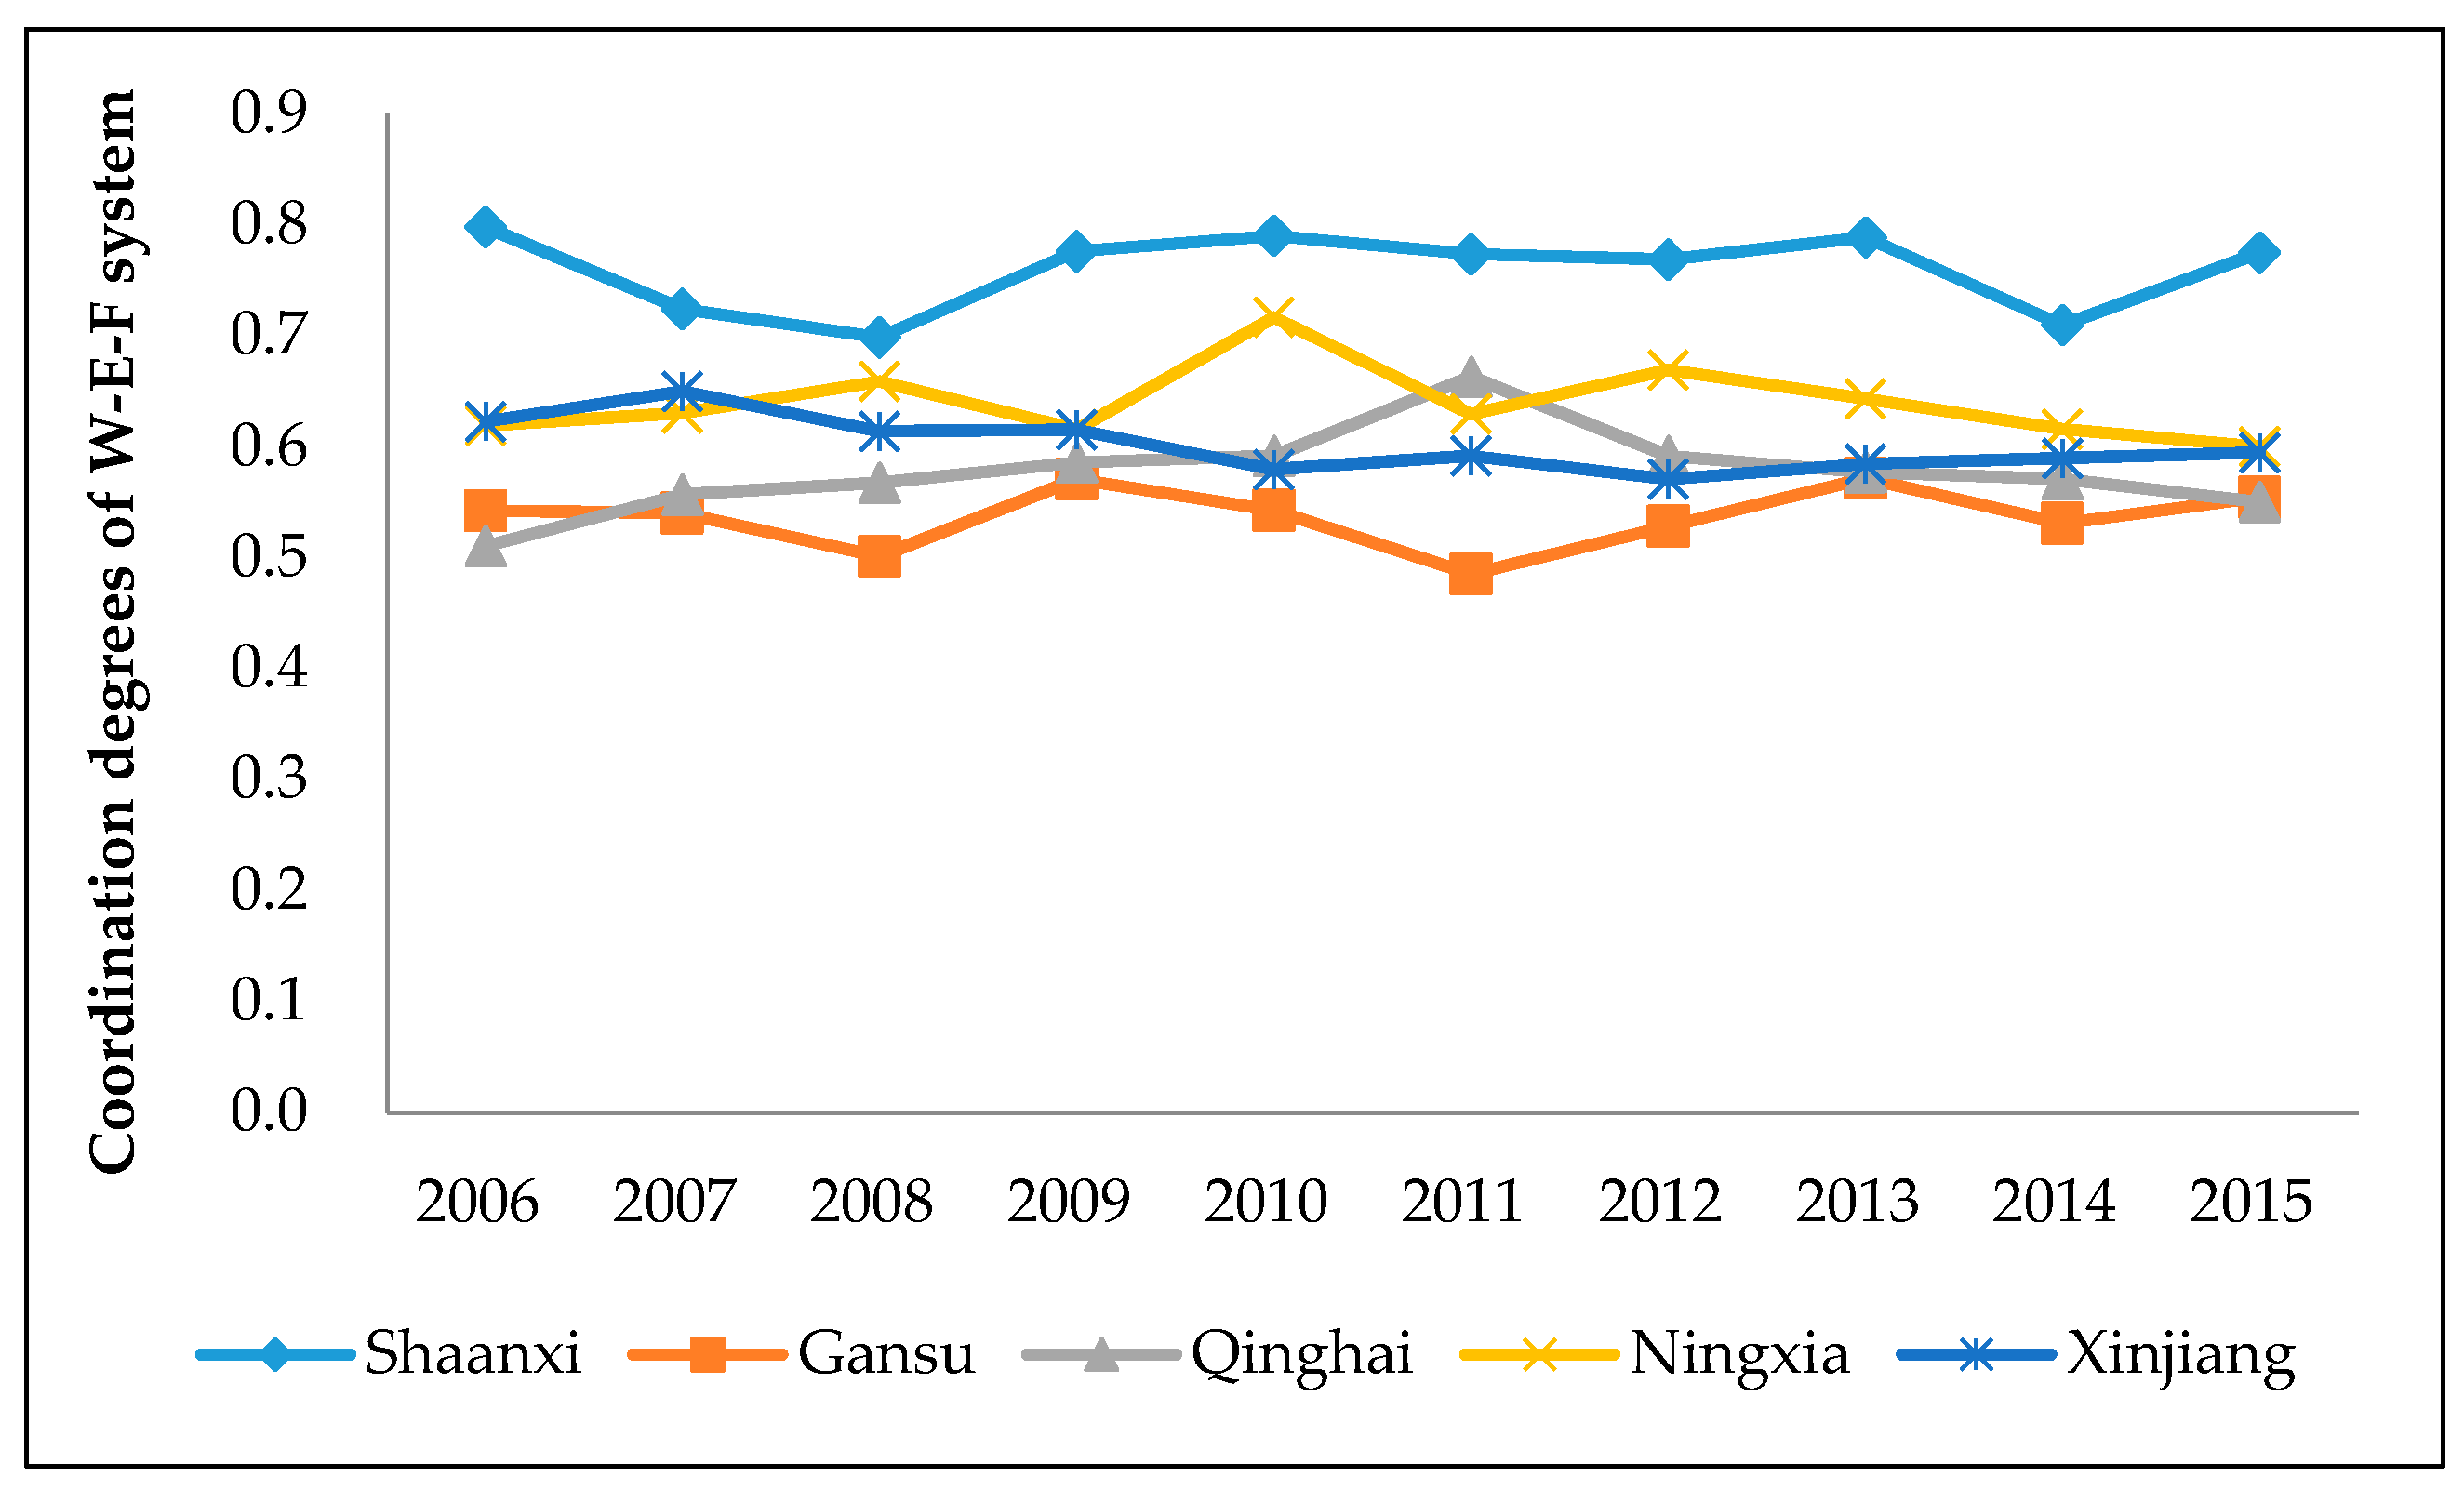
From 2006 to 2015, the coordination degree D of W-E-F system in Northwest China was calculated through Equation (15). The results of the evaluation grade are shown in Table 10. To further analyze the change trend of the coordination degree, the coordination degrees of each province over the years were represented by a line graph (Figure 5).
An analysis of Table 10 can lead to the following. From 2006 to 2015, the coordination degrees of water resources, energy and food in Northwest China belonged to the transitional development level (II) in most years. Among them, the year of the near incoordination (II4) accounted for the majority, the latter was the low coordination (II5), and the intermediate coordination (III6) was the least. Specifically, 26 of the 50 samples belonged to near incoordination (II4), 14 belonged to low coordination classes (II5), and only 10 belonged to intermediate coordination classes (III6). The results indicated that the development of the W-E-F system in Northwest China was uneven. On the whole, the coordination degree of water-energy-food system in Northwest China was low and the development level is low. Shaanxi had the best coordination degrees compared to other provinces. It indicated that the overall development level of water-energy-food system in Shaanxi was high, and all subsystems can develop in coordination. The coordination degrees between Gansu and Qinghai were basically on the near coordination level (II4). It shows that the water-energy-food coordination of Gansu and Qinghai is poor. Poor coordination in Gansu was mainly due to the backwardness of water resource, and Qinghai was lagging behind in food production. The degrees of coordination in Ningxia were barely growing. As shown in Figure 5, the fluctuation of coordination degree in Ningxia was relatively small, and there was a significant increase in 2010. It showed that the development of water resources, energy and food subsystems in Ningxia was relatively stable, and the coordination degree of water-energy-food system had an upward trend. The coordination degree of W-E-F system in Xinjiang can be divided into two stages. From 2006 to 2009, it was the stage of low coordination (II5). From 2010 to 2015, it was the stage of near incoordination (II4). It showed that the coordination of W-E-F system in Xinjiang was declining. The comprehensive vulnerability index values of water resources, energy and food in Xinjiang fluctuated significantly from 2010 to 2015. The main reasons were the low self-sufficiency rate of water in Xinjiang and the development of the energy and food was too dependent on water resources. On the whole, the overall coordination of W-E-F system in Northwest China was poor. The government needs to pay more attention to water conservancy project construction and adjust industrial structure.
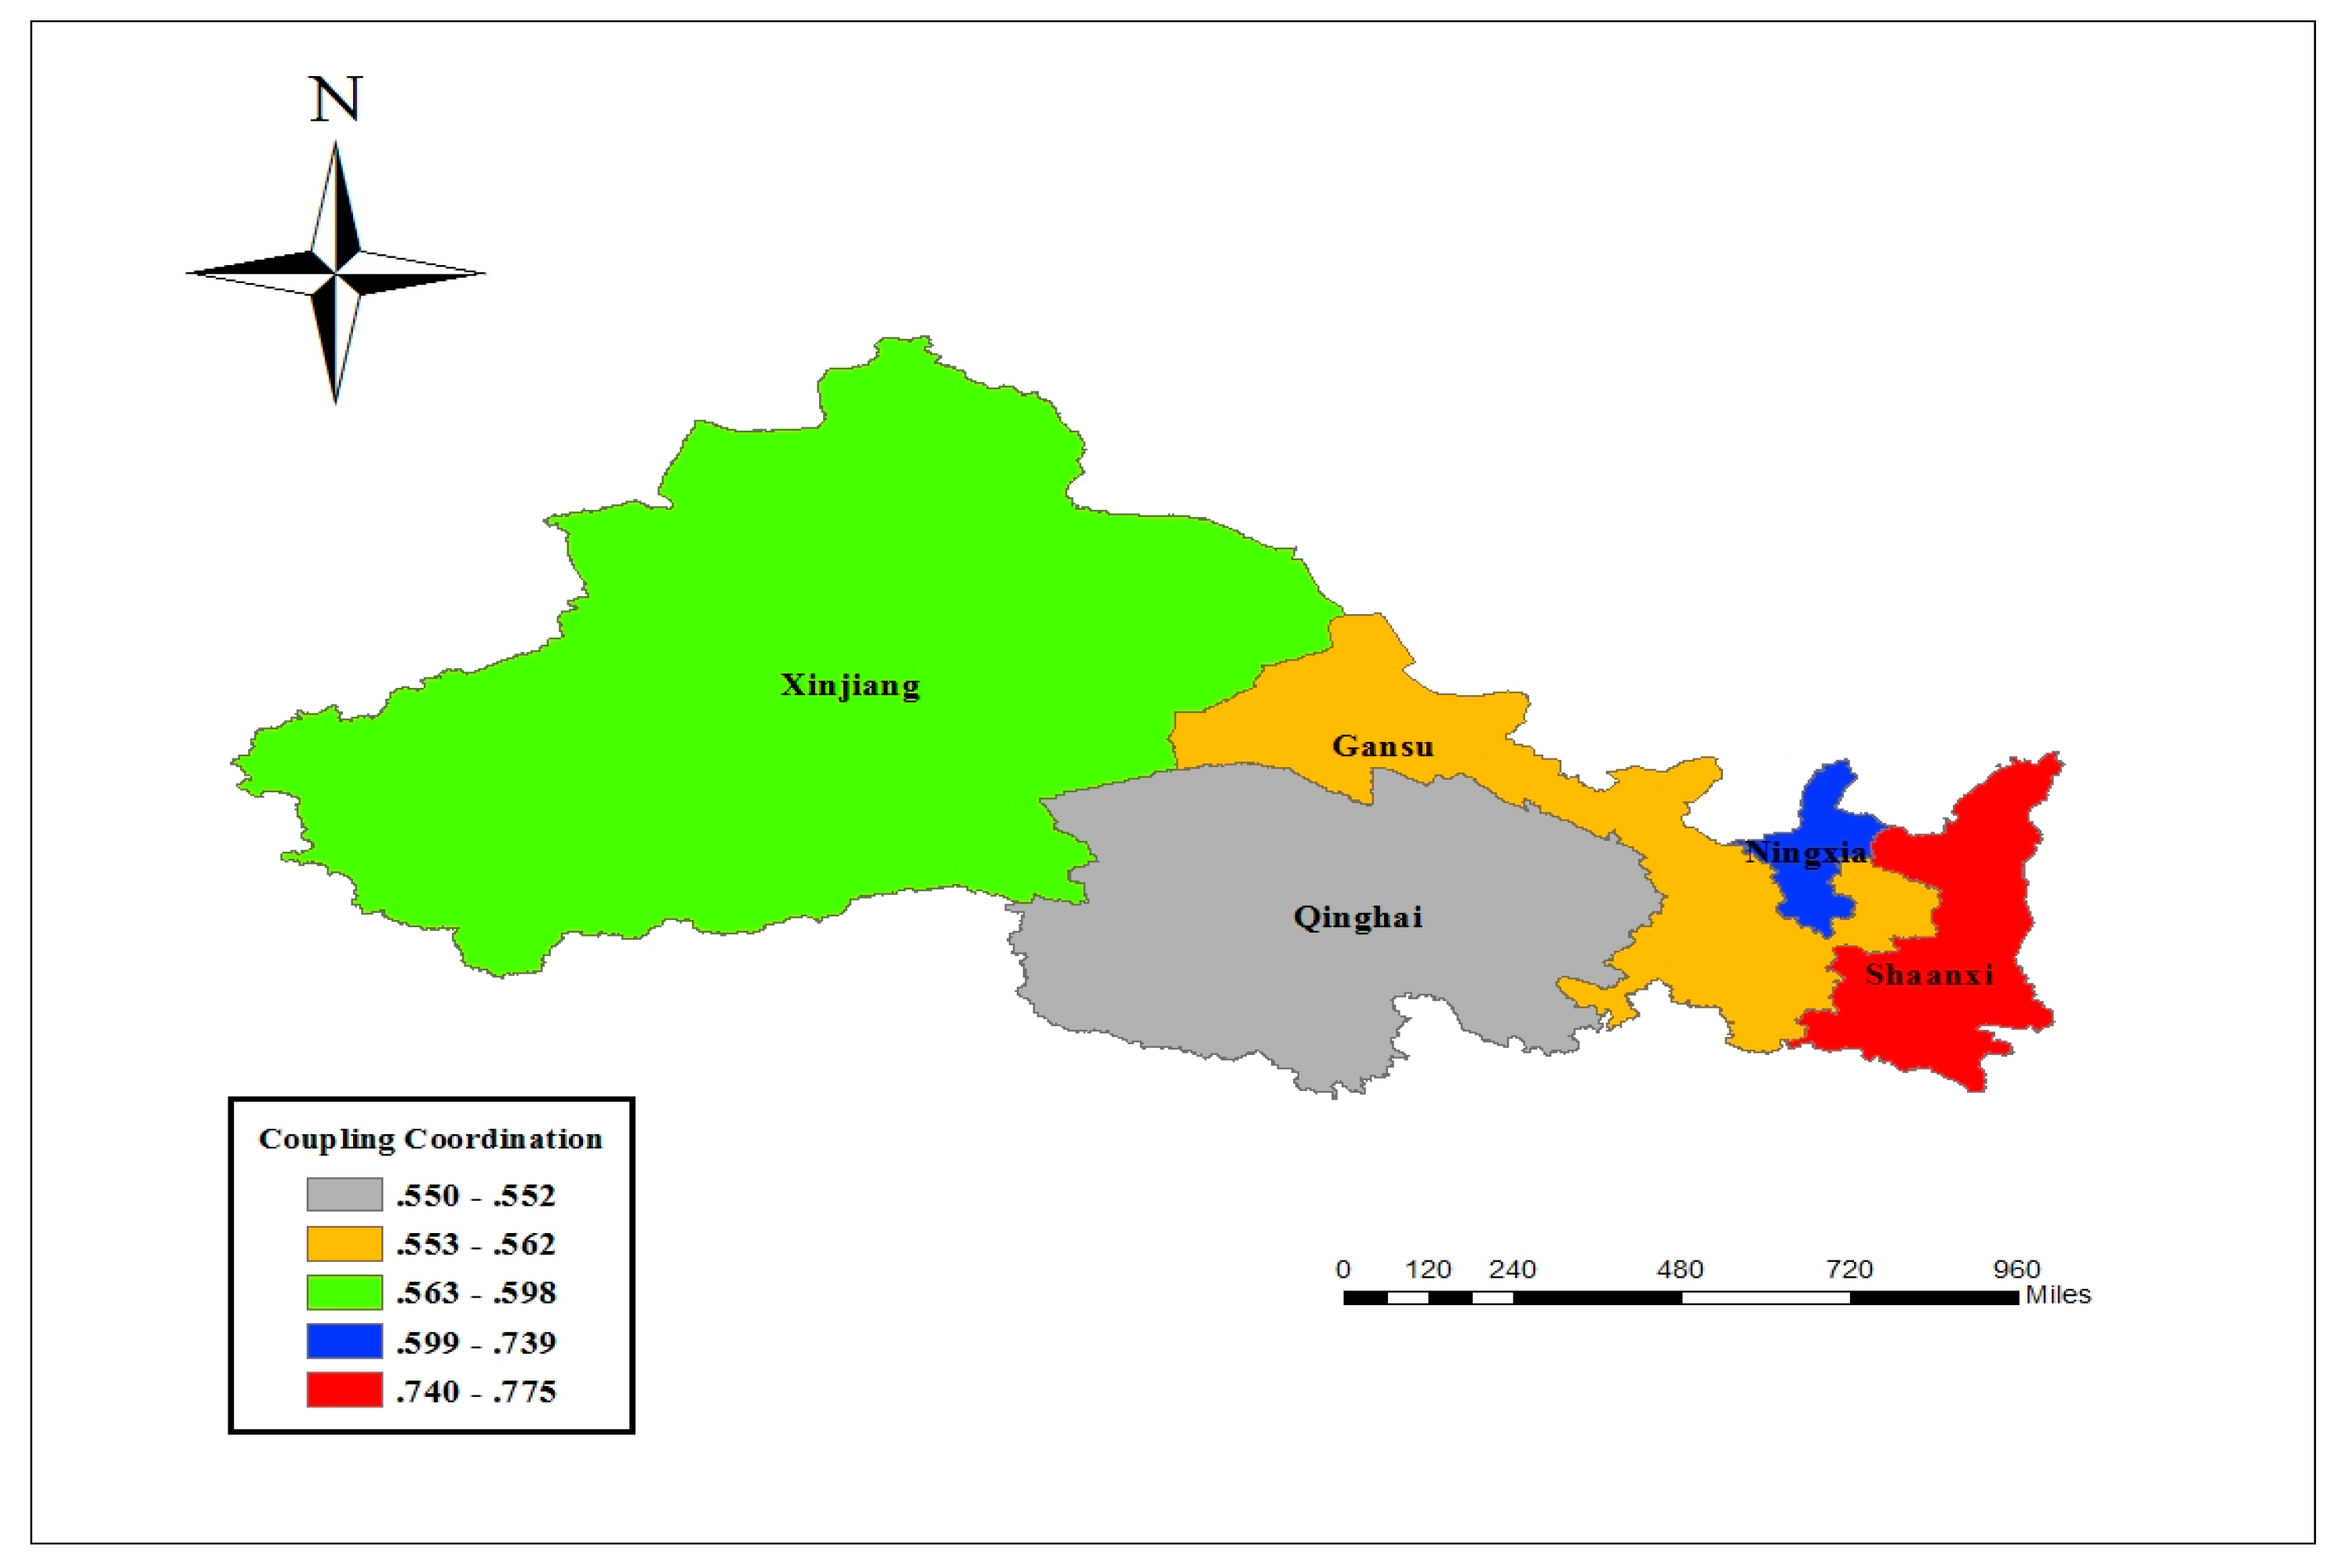
4.4. Distribution Map of Comprehensive Vulnerability Index Value and Coordination Degree
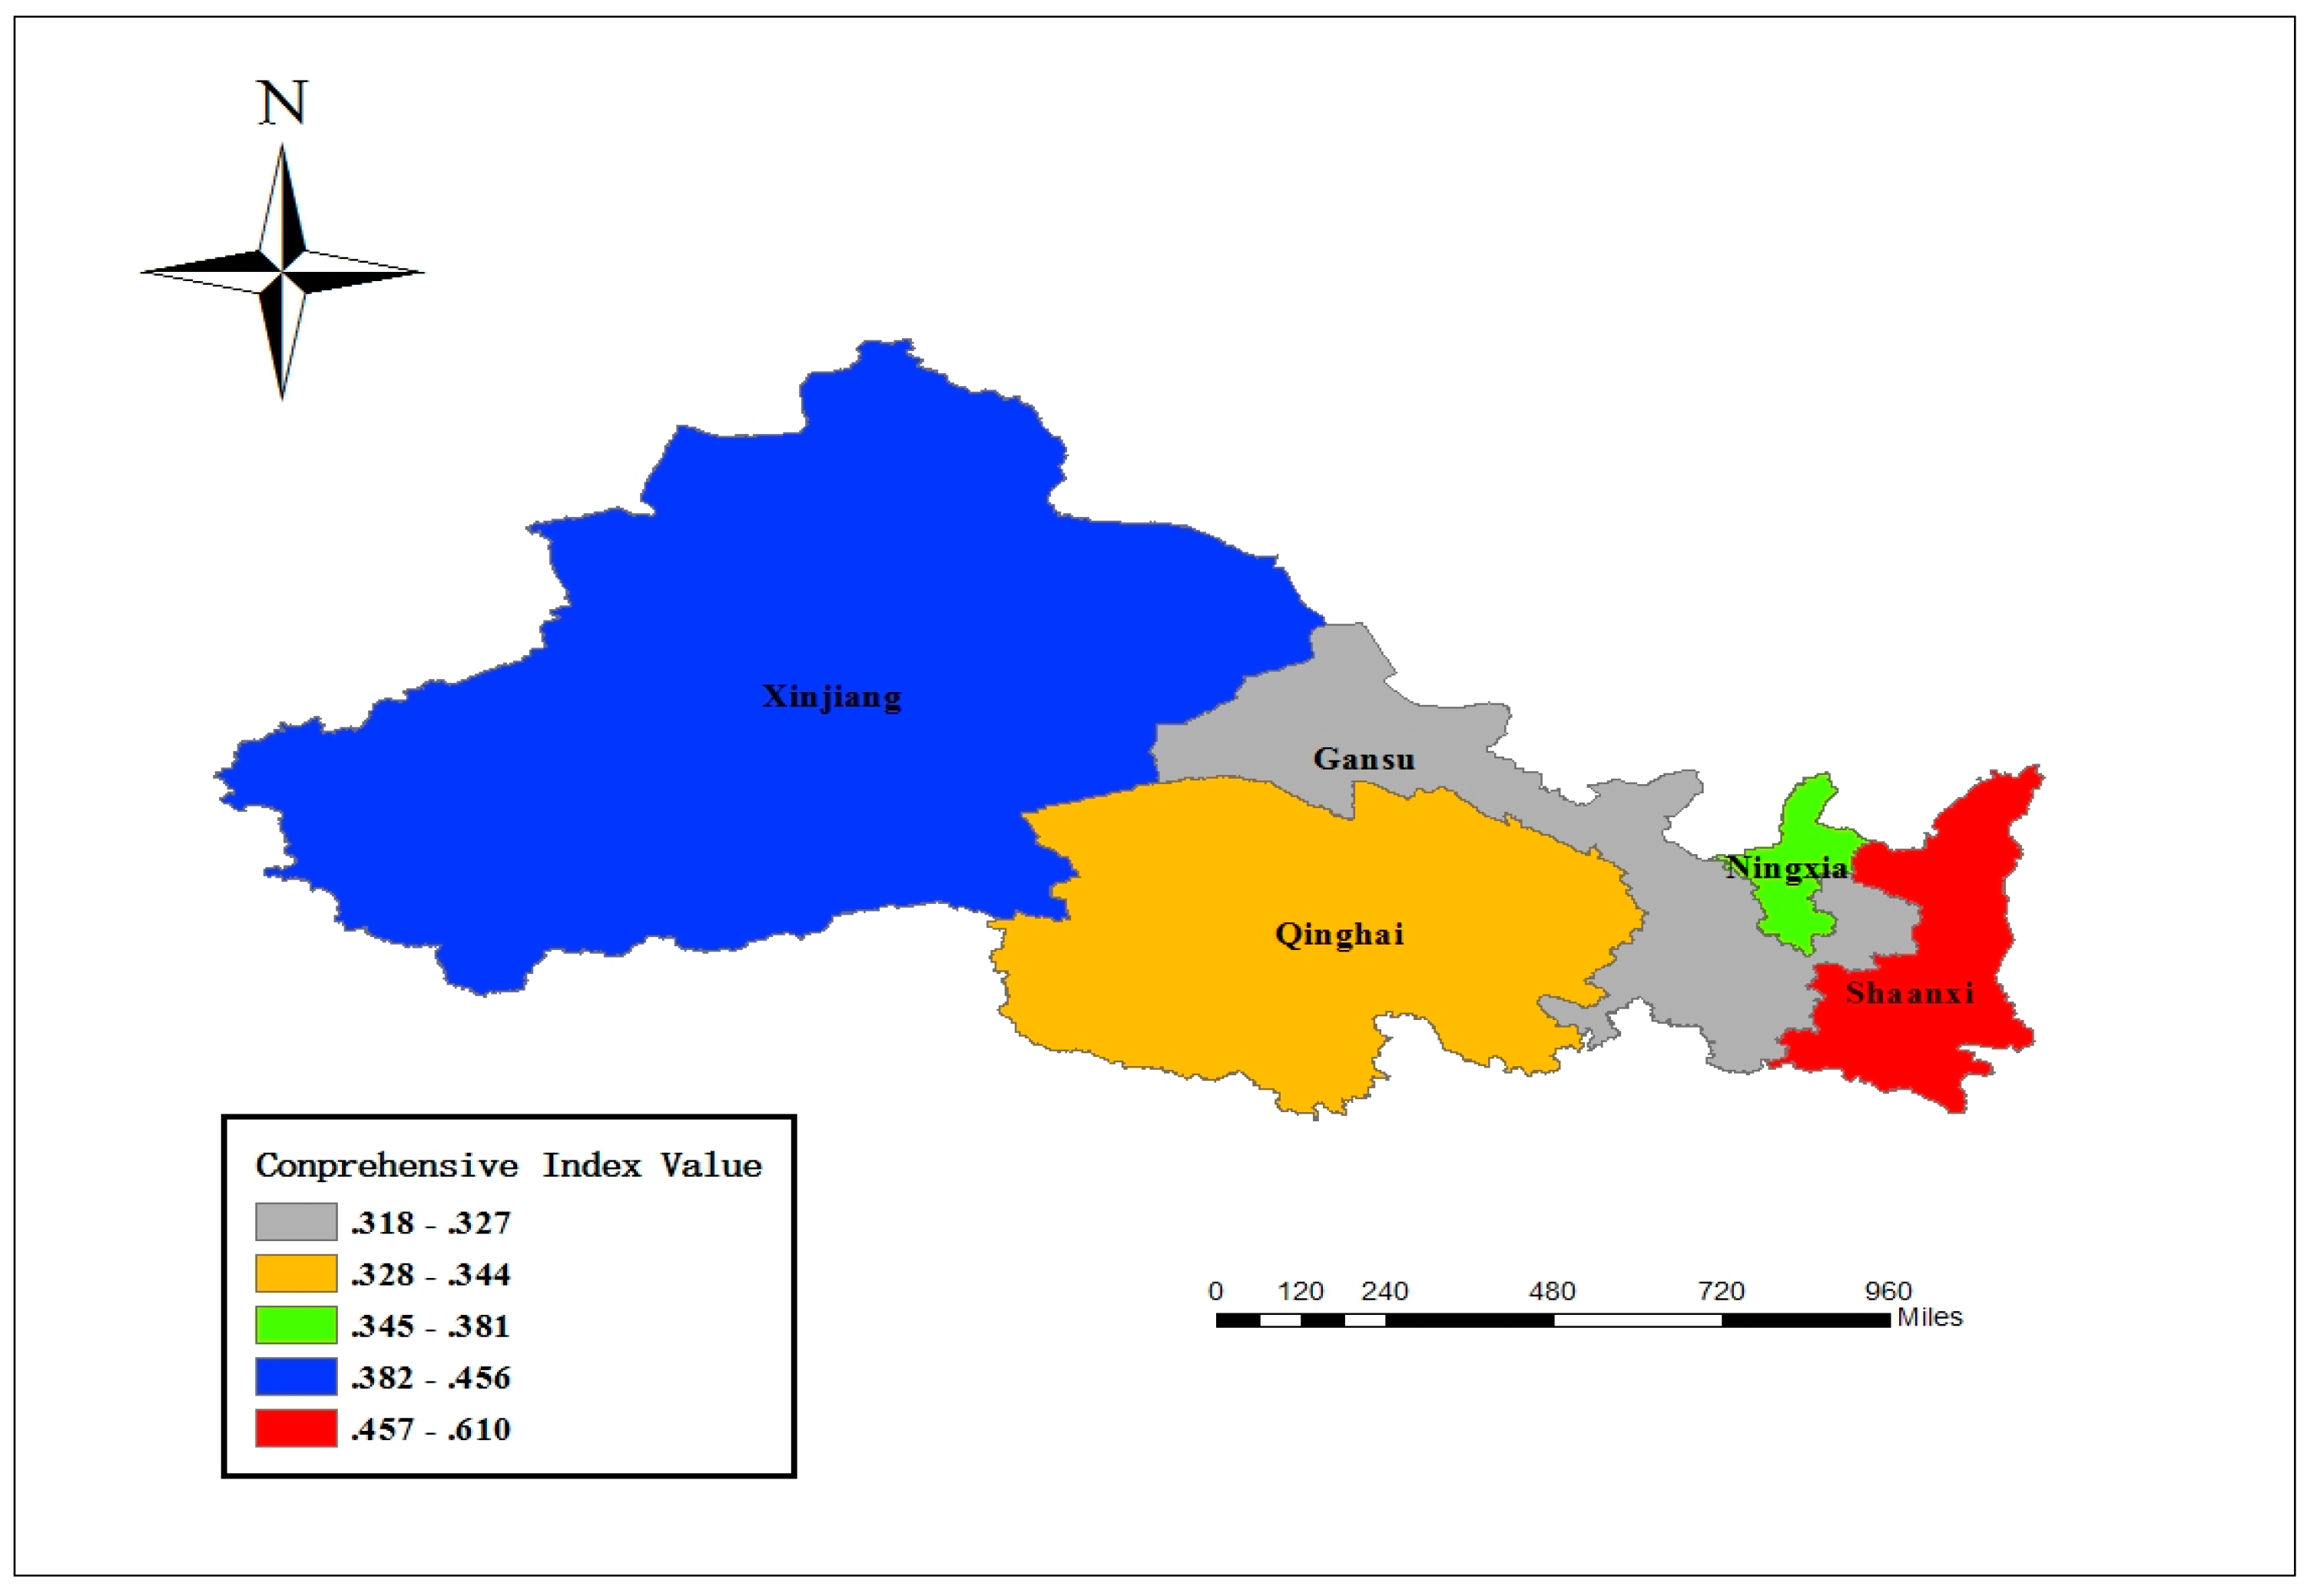
The spatial distribution of the comprehensive vulnerability index value and coordination degrees of W-E-F system in five provinces in 2015 was shown in Figure 6 and Figure 7.
We can see from Figure 6 and Figure 7 that the comprehensive vulnerability index values and coordination degrees of W-E-F system in Northwest China had obvious spatial differentiation and mismatch. Shaanxi province had the highest comprehensive vulnerability index value and coordination degree of W-E-F system, its higher value was due to the coordinated development of various subsystems of water resources, energy, and food. However, the comprehensive vulnerability index values of water, energy and food in other provinces were not well matched with the coordination degree. For example, the comprehensive vulnerability index value of Qinghai was higher than that of Gansu, but the coordination degree was lower than that of Gansu. It indicated that the high comprehensive vulnerability index value of a region does not mean that the region had a high coordination degree. Therefore, in order to achieve sustainable economic development, the coordination degree of W-E-F system should be improved.
5. Discussion and Conclusions
5.1. Conclusions
In this paper, the vulnerability and coordination evaluation index system of the W-E-F system in Northwest China was constructed based on PSR model. Then, the vulnerability and coordination of the W-E-F system in Shaanxi, Gansu, Qinghai, Ningxia and Xinjiang were evaluated by the cloud-matter element model and the coordination degree model, respectively. From the empirical results, the vulnerability and coordination of the W-E-F system was consistent with the actual situation.
- (1)
- The evaluation result of vulnerability level of the W-E-F system showed that the vulnerability levels of the five provinces in Northwest China were mainly Level 1, that is, highest vulnerability. The change trend of vulnerability level can be divided into two stages. From 2007 to 2011, the vulnerability levels have gradually become better. However, the vulnerability has begun to decline from 2012 to 2014. In 2015, the vulnerability has increased slowly. Generally speaking, the water-energy-food system in Northwest China was more vulnerable and the sustainable development of economy was seriously hindered.
- (2)
- The change types of the comprehensive vulnerability index values of water resources, energy and food subsystems were different, but the comprehensive vulnerability index values of water-energy-food system were on the rise. The comprehensive vulnerability index value of water resources subsystem was the lowest. The comprehensive vulnerability index value of the energy subsystem was the highest and the volatility was strong. The comprehensive vulnerability index values of the food subsystem were declining steadily, mainly because the urbanization level was gradually increasing. Among the five provinces, Shaanxi has the highest comprehensive vulnerability index values of W-E-F system, while Gansu has the lowest.
- (3)
- There was a correlation between the changes in the comprehensive vulnerability index values of the three subsystems. Through the comparison coefficient between the subsystems, we can find that the development degree of each subsystem is quite different. In addition, the development of one subsystem may be impeded to the development of another subsystem. For example, the comprehensive vulnerability index values of water resources system in Northwest china were the lowest, with the declining of the comprehensive vulnerability index values of water resources, the other two subsystems also had a downward trend. Improving the development of water resources in Northwest China is one of the most important steps to promote the coordinated development of water-energy-food system.
- (4)
- The Evaluation results of the coordination degree showed that the coordination degree of water resources, energy and food belonged to the class of near coordination (II4) in most years, the low coordination (II5) ranked second. It indicates that the development of water resources, energy and food subsystems were uneven. The lagging of water resources was the main reason that affected the coordination degree of W-E-F system. The coordination degrees of each province were not changed greatly, in general they had a good trend, but they did not reach the coordinated development class (III). Raising the development level of each subsystem is helpful to the sustainable development of the economy.
- (5)
- By comparing the comprehensive vulnerability index value distribution map and the coordinated degree distribution map of the water-energy-food system, we can find that the comprehensive vulnerability index value and coordination degree do not match well. The areas with high comprehensive vulnerability index value of water-energy-food system did not necessarily have high coordination degree. The comprehensive vulnerability index values of each subsystem need to be further promoted to improve the coordination degree of W-E-F system.
5.2. Discussion
It can be seen from the growth trend and fluctuation rule of vulnerability and coordination that the leading factors restricted the coordinated development of water resources, energy and food in different periods are different. However, the low comprehensive vulnerability index of water resource is the weak link in the process of water-energy-food system coordination evolution. The water shortage is the main reason for the low water comprehensive vulnerability index. Furthermore, agricultural irrigation and energy exploitation and processing need consume a large amount of water. As the water shortage is the principal contradiction in the coordinated development of water-energy-food in Northwest China, and the water shortage is an objective problem, we can only adopt auxiliary measures to adapt to the pressure brought by the water shortage. Therefore, we should adopt water-saving measures to improve the situation of water shortage. Therefore, we should take water-saving measures to improve the use rate of water resources, thereby reducing the vulnerability of the water-energy-food system, and improving the coordination of the water-energy-food system in the Northwest region. The specific water-saving measures were shown as follows.
(1) The exploitation and processing of energy requires a large amount of water resources, and the low efficiency of energy processing and conversion and Unit GDP energy consumption in Northwest China lead to the shortage of water resources. We should further optimize the industrial layout, adjust the structure of energy consumption, improve the efficiency of energy use, and reduce the water consumption in all energy production links. The industrial water saving measures can be divided into two categories, namely, technology measures and management measures. Technical measures include: First, establish and improve the recycling water system, which aims to increase the reuse rate of industrial water. The higher the reuse rate of water use, the less water is used and consumed, and the production of industrial sewage decreases accordingly, which can greatly reduce the pollution of water environment and alleviate the pressure of water supply and demand. Second, the production technology and water use technology should be reformed. The main technologies include: the use of new water-saving technology; the use of pollution-free or less pollution technology; and the promotion of new water-saving devices. The main management measures are as follows. First, quicken the pace of tax reform, optimize the management mechanism, and gradually establish a water management system with unified management and integrated operation of source water, water system, water supply, drainage and sewage treatment; Second, the supervision and inspection of water balance test should be done well to improve the water efficiency of enterprises. Third, implement the incentive mechanism of “saving prize, overusing price increase, waste punishment”.
(2) Food requires a lot of irrigation water in the process of planting and the agricultural irrigation efficiency in Northwest area is not high. The shortage of water resources will hinder the development of food, and thus reduce the coordination degree of water-energy-food system. Relevant government departments should pay attention to improve irrigation infrastructure and reduce irrigation water. Firstly, reduce the loss of water transportation and carry out the improvement of irrigation canal system. The main method is to popularize lining of channels and low pressure pipe water conveyance technology; Secondly, improve the efficiency of field water use and introduce advanced ground water-saving irrigation technologies, such as film irrigation and small furrow irrigation; Thirdly, fully storage and rationally use local water resources and develop in situ irrigation, we should implement rainwater gathering irrigation project and make full use of precipitation resources; Finally, implement comprehensive agricultural technical measures to improve water use. For example, choose cold-resistant crops and water-saving varieties, use farming technology of reasonable fertilization and fertilizer transfer water and so on.
Author Contributions
J.C. had the original idea for the study; X.Y. and R.D. were responsible for data collection; X.Y. and M.D. analyzed the data and wrote the paper; J.C. and L.Q. reviewed the paper.
Funding
This research was funded by the National Key R&D Program of China (Grant No. 2017YFC0404600), the Humanities and Social Sciences Fund of Ministry of Education of China (Grant No. 18YJA630009), the Fundamental Research Funds for the Central Universities (Grant No. 2018B33614), the National Natural Science Foundation of China (Grant No. 41877526) and the State Key Program of National Nature Science Foundation of China (Grant No. 71433003).
Conflicts of Interest
The authors declare no competing financial interests.
References
- Yan, X.X.; Jiang, D.; Fu, J.Y.; Hao, M. Assessment of sweet sorghum-based ethanol potential in China within the water–energy–food nexus framework. Sustainability 2018, 10, 1046. [Google Scholar] [CrossRef]
- Taniguchi, M.; Masuhara, N.; Burnett, K. Water, energy, and food security in the Asia Pacific region. J. Hydrol. Reg. Stud. 2015, 11, 9–19. [Google Scholar] [CrossRef]
- Li, G.J.; Li, Y.L.; Jia, X.J.; Du, L.; Huang, D.H. Establishment and simulation study of system dynamic model on sustainable development of water-energy-food nexus in Beijing. Manag. Rev. 2016, 28, 11–26. (In Chinese) [Google Scholar]
- Li, G.J.; Huang, D.H.; Li, Y.L. Water-Energy-Food nexus (WEF-Nexus): New perspective on regional sustainable development. J. Cent. Univ. Financ. Econ. 2016, 12, 76–90. (In Chinese) [Google Scholar]
- Bohle, H.G. Vulnerability and criticality: Perspectives from social geography. IHDP Updat. 2001, 2, 3–5. [Google Scholar]
- Mccarthy, J.J.; Canziani, O.F.; Leary, N.A.; Dokken, D.J.; White, K.S. Climate Change 2001: Impacts, Adaptation, and Vulnerability. J. Environ. Qual. 2007, 37, 2407. [Google Scholar]
- Ojima, D.; Moran, E.; Mcconnell, W.; Stafford, S.M.; Laumann, G.; Morais, J.; Young, B. Global Land Project: Science Plan and Implementation Strategy; IGBP Secretariat: Stockholm, Sweden, 2005; pp. 1–64. [Google Scholar]
- Lino, B.; Gordon, C.; Nadia, F.; Vella, S. Economic vulnerability and resilience: Concepts and measurements. Oxf. Dev. Stud. 2009, 37, 229–247. [Google Scholar]
- Cutter, S.L. Vulnerability to environmental hazards. Prog. Hum. Geogr. 1996, 20, 529–539. [Google Scholar] [CrossRef]
- United Nations International Strategy for Disaster Reduction (UNISDR). 2009 UNISDR Terminology on Disaster Risk Reduction. Abyadh. 2009, 8, 95–105. [Google Scholar]
- Chen, W.F.; Cutter, S.L.; Emrich, C.T.; Shi, P. Measuring Social Vulnerability to Natural Hazards in the Yangtze River Delta Region, China. Int. J. Disaster Risk Sci. 2013, 4, 169–181. [Google Scholar] [CrossRef]
- Füssel, H.M. Vulnerability: A generally applicable conceptual framework for climate change research. Glob. Environ. Chang. 2007, 17, 155–167. [Google Scholar] [CrossRef]
- Liu, C.M.; Zhang, R.Y.; Wang, M.; Xu, J. Measurement and prediction of regional tourism sustainability: An analysis of the Yangtze River Economic Zone, China. Sustainability 2018, 10, 1321. [Google Scholar] [CrossRef]
- Yang, X.D.; Wu, Y.X.; Dang, H. Urban land use efficiency and coordination in China. Sustainability 2017, 9, 410. [Google Scholar] [CrossRef]
- Wang, R.; Cheng, J.H.; Zhu, Y.L.; Lu, P. Evaluation on the coupling coordination of resources and environment carrying capacity in Chinese mining economic zones. Resour. Policy 2017, 53, 20–25. [Google Scholar] [CrossRef]
- Sun, Y.; Cui, Y. Evaluating the coordinated development of economic, social and environmental benefits of urban public transportation infrastructure: Case study of four Chinese autonomous municipalities. Transp. Policy 2018, 66, 116–126. [Google Scholar] [CrossRef]
- Ouma, Y.O.; Tateishi, R. Urban flood vulnerability and risk mapping using integrated multi-parametric AHP and GIS: Methodological overview and case study assessment. Water 2014, 6, 1515–1545. [Google Scholar] [CrossRef]
- Hahn, M.B.; Riederer, A.M.; Foster, S.O. The livelihood vulnerability index: A pragmatic approach to assessing risks from climate variability and change-a case study in Mozambique. Glob. Environ. Chang. 2009, 19, 74–88. [Google Scholar] [CrossRef]
- Cutter, S.L.; Boruff, B.J.; Shirley, W.L. Social vulnerability to environmental hazards. Soc. Sci. Q. 2003, 84, 242–261. [Google Scholar] [CrossRef]
- Depietri, Y.; Welle, T.; Renaud, F.G. Social vulnerability assessment of the Cologne urban area (Germany) to heat waves: Links to ecosystem services. Int. J. Disaster Risk Reduct. 2013, 6, 98–117. [Google Scholar] [CrossRef]
- Wang, N.J.; Huang, X.; Gao, F. Study on vulnerability of environmental economic system in Tongling city based on cloud model. J. Cent. China Norm. Univ. 2016, 50, 913–922. (In Chinese) [Google Scholar]
- Wang, M.Q.; Wang, J.D.; Liu, J.S.; Dou, J.X. Evaluation of ecological environment vulnerability in western Jilin province based on matter-element model. Ecology 2007, 26, 291–295. (In Chinese) [Google Scholar]
- Li, D.Y.; Liu, C.Y.; Gan, W.Y. A new cognitive model: Cloud model. Int. J. Intell. Syst. 2009, 24, 357–375. [Google Scholar] [CrossRef]
- Tian, J.; Wang, W.; Liu, C.F. Seismic serviceability assessment of water supply network based on clouding-matter element model. Disaster Adv. 2013, 6, 350–358. [Google Scholar]
- Dai, Z.Y.; Zhang, W.L.; Shen, Y.A.; Wang, H.T. The application of cloud matter-element in information security risk assessment. In Proceedings of the 3rd International Conference on Information Management, Chengdu, China, 21–23 April 2017; pp. 218–222. [Google Scholar]
- Sun, Q.X.; Sun, Y.X.; Sun, L. Green grade assessment of bus passenger station based on cloud-matter element model. Resour. Environ. Arid Area 2018, 32, 81–86. (In Chinese) [Google Scholar]
- Liu, Y.; Zhao, Y.P. Cloud-matter element coupled model for flood risk assessment. China Rural Water Conserv. Hydropower 2014, 7, 101–104. (In Chinese) [Google Scholar]
- Zheng, M.G.; Wen, W.; Yang, X. External risk assessment of overseas mining project m&a. Resour. Dev. Mark. 2017, 33, 825–829. (In Chinese) [Google Scholar]
- Liao, C.B. Quantitative judgement and classification system for coordinated development of environment and economy-a case study of the city group in the Pearl River Delta. Trop. Geogr. 1999, 19, 76–82. (In Chinese) [Google Scholar]
- Ding, L.; Zhao, W.; Huang, Y.; Cheng, S.; Liu, C. Research on the coupling coordination relationship between urbanization and the air environment: A case study of the area of Wuhan. Atmosphere 2015, 6, 1539–1558. [Google Scholar] [CrossRef]
- Liu, Y.Q.; Xu, J.; Luo, H. An integrated approach to modelling the economy-society-ecology system in urbanization process. Sustainability 2014, 6, 1946–1972. [Google Scholar] [CrossRef]
- Zhao, L.M.; Li, L.; Wu, Y.J. Research on the coupling coordination of a sea–land system based on an integrated approach and new evaluation index system: A case study in Hainan province, China. Sustainability 2017, 9, 859. [Google Scholar] [CrossRef]
- Tang, Z. An integrated approach to evaluating the coupling coordination between tourism and the environment. Tour. Manag. 2015, 46, 11–19. [Google Scholar] [CrossRef]
- Yang, S.Q.; Gao, W.S.; Sui, P.; Chen, Y.Q.; Xu, C. Evaluation of eco-economic and social system coordination in Ziyang District, Hunan Province. China Popul. Resour. Environ. 2005, 15, 71–74. (In Chinese) [Google Scholar]
- Yang, W.C.; Xu, K.; Lian, J.J.; Bin, L.; Ma, C. Multiple flood vulnerability assessment approach based on fuzzy comprehensive evaluation method and coordinated development degree model. J. Environ. Manag. 2018, 213, 440–450. [Google Scholar] [CrossRef] [PubMed]
- Peng, F.; Sun, C.Z.; Liu, T.B.; Li, Y.; Hu, W. Temporal and spatial evolution of vulnerability and coordination of marine eco-economic system in coastal area of China. Econ. Geogr. 2018, 38, 165–174. (In Chinese) [Google Scholar]
- Chen., X.H.; Wu, G.B.; Wan, L.H. Dynamic simulation of vulnerability and coordination of the coupling of urban and ecological environment based on BP: A case of the coal-electricity Base in the eastern Heilongjiang province. Sci. Geogr. Sin. 2014, 34, 1337–1343. (In Chinese) [Google Scholar]
- Chen, X.H.; Wan, L.H. The interactive mechanisms for the coordination and vulnerability between regional urban and eco-environment. Sci. Geogr. Sin. 2013, 33, 1450–1457. (In Chinese) [Google Scholar]
- Zhang, W.P. Study on Vulnerability of Urban Social System; Northwest Normal University: Beijing, China, 2014. (In Chinese) [Google Scholar]
- Wan, L.H.; Zhang, Q.; Chen, X.H. Evaluation index system of coordinated development of economy and environment in the industrial corridor of Hadadqi-a study based on the perspective of vulnerability. Geogr. Res. 2012, 31, 1673–1684. (In Chinese) [Google Scholar]
- Levrel, H.; Kerbiriou, C.; Couvet, D.; Weber, J. OECD pressure–state–response indicators for managing biodiversity: A realistic perspective for a French biosphere reserve. Biodivers. Conserv. 2009, 18, 1719. [Google Scholar] [CrossRef]
- Grosbois, D.D.; Plummer, R. Problematizing water vulnerability indices at a local level: A critical review and proposed solution. Water Resour. Manag. 2015, 29, 5015–5035. [Google Scholar] [CrossRef]
- Pan, Z.W.; Jin, J.L.; Li, C.L.; Ning, S.; Zhou, R. A connection entropy approach to water resources vulnerability analysis in a changing environment. Entropy 2017, 19, 591. [Google Scholar] [CrossRef]
- Vivoda, V. Evaluating energy security in the Asia-Pacific region: A novel methodological approach. Energy Policy 2010, 38, 5258–5263. [Google Scholar] [CrossRef]
- Qi, X.X.; Liu, L.M.; Liu, Y.B.; Yao, L. Risk assessment for sustainable food security in China according to integrated food security—Taking Dongting Lake area for example. Environ. Monit. Assess. 2013, 185, 4855–4867. [Google Scholar] [CrossRef] [PubMed]
- Yao, C.S.; Qu, Y.F.; Huang, L.; Li, Z.T. Coupling relationship between urbanization and food security in China: An Empirical Study. China Soft Sci. 2016, 6, 75–88. (In Chinese) [Google Scholar]
- Deng, P.; Chen, J.; Chen, D. The evolutionary characteristics analysis of the coupling and coordination among water, energy and food: Take Jiangsu Province as an example. J. Water Resour. Water Eng. 2017, 28, 232–238. (In Chinese) [Google Scholar]
- Bi, P.; Chen, D.; Deng, P. The evolutionary characteristics analysis of coupling and coordination of regional water-energy-food. China Rural Water Hydropower 2018, 2, 72–77. (In Chinese) [Google Scholar]
- Lu, J.X.; Wang, W.J.; Zhang, Y.C.; Cheng, S. Multi-objective optimal design of stand-alone hybrid energy system using entropy weight method based on HOMER. Energies 2017, 10, 1664. [Google Scholar] [CrossRef]
- Li, S.Q.; Li, R.R. Energy sustainability evaluation model based on the matter-element extension method: A case study of Shandong province, China. Sustainability 2017, 9, 2128. [Google Scholar] [CrossRef]
- Zhang, K.; Qu, B.L.; Zhao, M. Analyzing coupled regional economic development and land-water resource—A case study of Liaoning province. Resour. Dev. Mark. 2015, 31, 316–320, 374. (In Chinese) [Google Scholar]
Figure 1.
The location of Northwest China on the map of China.

Figure 2.
Normal cloud and digital features .

Figure 3.
From 2006 to 2015, the comprehensive vulnerability index values of water, energy, food and W-E-F system in Northwest China.
Figure 3.
From 2006 to 2015, the comprehensive vulnerability index values of water, energy, food and W-E-F system in Northwest China.


Figure 4.
From 2006 to 2015, the comparison relationship between different subsystems in Northwest China.
Figure 4.
From 2006 to 2015, the comparison relationship between different subsystems in Northwest China.


Figure 5.
Coordination degrees of W-E-F in Northwest China from 2006 to 2015.

Figure 6.
Distribution map of comprehensive vulnerability index values of W-E-F system in Northwest China in 2015.
Figure 6.
Distribution map of comprehensive vulnerability index values of W-E-F system in Northwest China in 2015.

Figure 7.
Distribution map of coordination degrees of W-E-F system in Northwest China in 2015.


Table 1.
Evaluation index system of vulnerability and coordination of W-E-F system.
| Subsystem | System Layer | Element Layer | Data Source |
|---|---|---|---|
| Water resources subsystem | Pressure | Daily water consumption per capita | China Water Conservancy Statistical Yearbook |
| Per capita GDP (yuan/person) | China Statistical Yearbook | ||
| State | Per capita water resources | China Water Conservancy Statistical Yearbook | |
| Average annual precipitation (mm) | |||
| Forest cover rate (%) | Environmental Bulletin of each province in China | ||
| Response | The standard rate of industrial wastewater discharge (%) | ||
| Urban sewage treatment rate (%) | |||
| Energy subsystem | Pressure | Per capita energy consumption (ton/person) | China Energy Statistical Yearbook |
| Elasticity coefficient of energy consumption | |||
| Unit GDP energy consumption | |||
| State | Elasticity coefficient of energy production | ||
| Elasticity coefficient of electricity production | |||
| Energy self-sufficiency rate (%) | |||
| Response | Energy processing conversion efficiency (%) | ||
| Investment proportion in environmental pollution control to GDP (%) | China Statistical Yearbook | ||
| Food subsystem | Pressure | Population growth rate (%) | |
| Urbanization rate (%) | |||
| Disaster rate (%) | China Food Statistical Yearbook | ||
| State | Per capita food production | ||
| Per capita cultivated area | China Statistical Yearbook | ||
| Effective irrigation rate of farmland (%) | National Economic and Social Development Bulletins of China | ||
| Response | Agriculture mechanization (%) | ||
| Fertilizer application per unit area | China Food Statistical Yearbook |
Table 2.
Vulnerability level evaluation system.
| Vulnerability Interval | Vulnerability Degree | Vulnerability Grade |
|---|---|---|
| Highest vulnerability | Level 1 | |
| Higher vulnerability | Level 2 | |
| Moderate vulnerability | Level 3 | |
| Lower vulnerability | Level 4 | |
| Lowest vulnerability | Level 5 |
Table 3.
The type of comparison relationship of the subsystems.
| Contrast Coefficient | |||||
|---|---|---|---|---|---|
| Type of comparison relationship | Highest shortage | Higher shortage | Moderate shortage | Higher enough | Highest enough |
Table 4.
Coordination degree evaluation criteria.
| D | Class | D | Coordination Degree | Coordination Grade |
|---|---|---|---|---|
| 0.00–0.50 | Uncoordinated Declination I | 0.00–0.20 | High Incoordination | I1 |
| 0.21–0.40 | Moderate Incoordination | I2 | ||
| 0.41–0.50 | Low Incoordination | I3 | ||
| 0.51–0.70 | Transitional Development II | 0.51–0.60 | Near Incoordination | II4 |
| 0.61–0.70 | Low Coordination | II5 | ||
| 0.71–1.00 | Coordinated Development III | 0.71–0.80 | Intermediate Coordination | III6 |
| 0.81–0.90 | High Coordination | III7 | ||
| 0.90–1.00 | Complete Coordination | III8 |
Table 5.
Vulnerability index values of water resources for vulnerability and coordination assessment in 2015.
Table 5.
Vulnerability index values of water resources for vulnerability and coordination assessment in 2015.
| Area | Daily Water Consumption Per Capita (m3/person) | Per Capita GDP (yuan/person) | Per Capita Water Resources (m3/person) | Average Annual Precipitation (mm) | Forest Cover Rate (%) | Standard Rate of Industrial Wastewater Discharge (%) | Urban Sewage Treatment Rate (%) |
|---|---|---|---|---|---|---|---|
| Shaanxi | 155.70 | 47,626.00 | 881.10 | 598.10 | 43.06 | 99.30 | 91.52 |
| Gansu | 132.00 | 26,165.00 | 635.00 | 368.20 | 11.28 | 91.25 | 87.80 |
| Qinghai | 168.80 | 41,252.00 | 10,057.60 | 308.09 | 5.63 | 81.46 | 59.98 |
| Ningxia | 171.70 | 43,805.00 | 138.40 | 289.00 | 11.89 | 95.50 | 88.97 |
| Xinjiang | 170.60 | 40,036.00 | 3994.20 | 271.00 | 4.24 | 83.64 | 89.70 |
Table 6.
Vulnerability index values of energy for vulnerability and coordination assessment in 2015.
Table 6.
Vulnerability index values of energy for vulnerability and coordination assessment in 2015.
| Area | Per Capita Energy Consumption (ton/person) | Elasticity Coefficient of Energy Consumption | Unit GDP Energy Consumption (tce/GDP) | Elasticity Coefficient of Energy Production | Elasticity Coefficient of Electricity production | Energy Self-sufficiency Rate (%) | Energy Processing Conversion Efficiency (%) | Investment Proportion in Environmental Pollution Control to GDP (%) |
|---|---|---|---|---|---|---|---|---|
| Shaanxi | 3.20 | 0.69 | 0.56 | 0.02 | 0.41 | 3.96 | 81.09 | 1.33 |
| Gansu | 2.89 | 1.10 | 0.00 | −0.23 | 0.01 | 0.77 | 70.89 | 0.90 |
| Qinghai | 7.03 | 0.69 | 0.44 | −0.40 | −2.39 | 0.80 | 79.10 | 2.19 |
| Ningxia | 16.69 | 1.29 | 0.80 | 0.42 | 0.89 | 1.24 | 69.90 | 2.91 |
| Xinjiang | 6.63 | 1.68 | 0.56 | 2.10 | 0.18 | 1.26 | 65.70 | 4.38 |
Table 7.
Vulnerability index values of food for vulnerability and coordination assessment in 2015.
| Area | Population Growth Rate (%) | Population Growth Rate (%) | Disaster Rate (%) | Per capita Food Production (kg/person) | Per capita Cultivated Area (ton/hectare) | Effective Irrigation Rate of Farmland (%) | Agriculture Mechanization Rate (%) | Fertilizer Application Per Unit Area (ton/hectare) |
|---|---|---|---|---|---|---|---|---|
| Shaanxi | 3.82 | 53.92 | 0.10 | 324.00 | 0.08 | 0.43 | 0.99 | 0.80 |
| Gansu | 6.21 | 43.19 | 0.08 | 451.00 | 0.14 | 0.37 | 0.73 | 0.28 |
| Qinghai | 8.55 | 50.23 | 0.10 | 175.00 | 0.10 | 0.34 | 0.68 | 0.17 |
| Ningxia | 8.04 | 55.20 | 0.12 | 561.00 | 0.38 | 0.39 | 0.73 | 0.31 |
| Xinjiang | 11.08 | 52.77 | 0.09 | 653.00 | 0.39 | 0.54 | 0.92 | 0.27 |
Table 8.
Vulnerability of W-E-F system from 2006 to 2015.
| Area | 2006 | 2007 | 2008 | 2009 | 2010 | 2011 | 2012 | 2013 | 2014 | 2015 |
|---|---|---|---|---|---|---|---|---|---|---|
| Shaanxi | Level 1 | Level 3 | Level 1 | Level 2 | Level 4 | Level 1 | Level 1 | Level 2 | Level 1 | Level 1 |
| Gansu | Level 1 | Level 1 | Level 1 | Level 2 | Level 4 | Level 2 | Level 3 | Level 1 | Level 1 | Level 2 |
| Qinghai | Level 1 | Level 1 | Level 1 | Level 1 | Level 1 | Level 2 | Level 3 | Level 1 | Level 1 | Level 1 |
| Ningxia | Level 1 | Level 1 | Level 3 | Level 1 | Level 2 | Level 2 | Level 1 | Level 2 | Level 1 | Level 2 |
| Xinjiang | Level 1 | Level 2 | Level 2 | Level 4 | Level 5 | Level 2 | Level 1 | Level 1 | Level 1 | Level 2 |
Table 9.
Relevance degree of vulnerability grade in Northwest China in 2015.
| Area | Highest Vulnerability | Higher Vulnerability | Moderate Vulnerability | Lower Vulnerability | Lowest Vulnerability | |
|---|---|---|---|---|---|---|
| Shaanxi | 0.150 | 0.049 | 0.041 | 0.001 | 0.012 | 0.150 |
| Gansu | 0.068 | 0.126 | 0.027 | 0.019 | 0.037 | 0.126 |
| Qinghai | 0.153 | 0.093 | 0.020 | 0.024 | 0.047 | 0.153 |
| Ningxia | 0.045 | 0.049 | 0.009 | 0.015 | 0.029 | 0.049 |
| Xinjiang | 0.059 | 0.085 | 0.008 | 0.021 | 0.014 | 0.085 |
Table 10.
Coordination degrees of W-E-F in Northwest China from 2006 to 2015.
| Area | 2006 | 2007 | 2008 | 2009 | 2010 | 2011 | 2012 | 2013 | 2014 | 2015 |
|---|---|---|---|---|---|---|---|---|---|---|
| Shaanxi | III6 | III6 | II5 | III6 | III6 | III6 | III6 | III6 | III6 | III6 |
| Gansu | II4 | II4 | II4 | II4 | II4 | II4 | II4 | II4 | II4 | II4 |
| Qinghai | II4 | II4 | II4 | II4 | II4 | II5 | II4 | II4 | II4 | II4 |
| Ningxia | II5 | II5 | II5 | II5 | II6 | II5 | II5 | II5 | II5 | II4 |
| Xinxiang | II5 | II5 | II5 | II5 | II4 | II4 | II4 | II4 | II4 | II4 |
© 2018 by the authors. Licensee MDPI, Basel, Switzerland. This article is an open access article distributed under the terms and conditions of the Creative Commons Attribution (CC BY) license (http://creativecommons.org/licenses/by/4.0/).
Share and Cite
MDPI and ACS Style
Chen, J.; Yu, X.; Qiu, L.; Deng, M.; Dong, R. Study on Vulnerability and Coordination of Water-Energy-Food System in Northwest China. Sustainability 2018, 10, 3712. https://doi.org/10.3390/su10103712
AMA Style
Chen J, Yu X, Qiu L, Deng M, Dong R. Study on Vulnerability and Coordination of Water-Energy-Food System in Northwest China. Sustainability. 2018; 10(10):3712. https://doi.org/10.3390/su10103712
Chicago/Turabian StyleChen, Junfei, Xiaoya Yu, Lei Qiu, Menghua Deng, and Ran Dong. 2018. "Study on Vulnerability and Coordination of Water-Energy-Food System in Northwest China" Sustainability 10, no. 10: 3712. https://doi.org/10.3390/su10103712
Note that from the first issue of 2016, this journal uses article numbers instead of page numbers. See further details here.