Analyzing Urban Residents’ Appraisal of Ridepooling Service Attributes with Conjoint Analysis


1
German Aerospace Center, Institute of Transportation Systems, 38108 Braunschweig, Germany
2
Faculty of Cognitive Psychology, Ergonomics University of Twente, 7522 Enschede, The Netherlands
*
Author to whom correspondence should be addressed.
Sustainability 2018, 10(10), 3711; https://doi.org/10.3390/su10103711
Submission received: 29 August 2018
/
Revised: 8 October 2018
/
Accepted: 11 October 2018
/
Published: 16 October 2018
(This article belongs to the Special Issue Sustainable Road Transportation Planning)
Abstract
:Public ridepooling systems could contribute to the reduction of traffic volume and emissions in cities by decreasing the number of rides by private car while increasing the average number of passengers per vehicle. Yet, it is unknown how urban travelers value different attributes of the ridepooling’s operational concept. Which characteristics of ridepooling concepts are most important to the users? In order to obtain a deeper understanding of travelers’ preferences concerning a ridepooling system, choice-based Conjoint Analysis was performed. Based on a literature review and a focus group, six relevant attributes of the operational concept of ridepooling systems were determined: fare, walking distance, time of booking, shift of departure time, travel time, and information provision. Data from 237 German city dwellers were analyzed with the help of Cox regression. Except for time of booking, all service attributes significantly affected the respondents’ choice. Besides the high relevance of fare, the results underline the particular importance of the attribute walking distance to the pick-up point for elderly. The results give guidance for the creation of user-centered public transport systems that meet the requirements of the prospective passengers and thus might contribute to the development of shared passenger transport systems for sustainable urban mobility.
1. Introduction
1.1. The Benefits of Shared Mobility Services for Cities
These days we are witnessing the emergence of an abundance of new mobility concepts that are enabled by the progress in digitalization of entire service chains [1]. Most often, they are driven by the travelers’ requests for higher flexibility; this was found to be the factor with the greatest impact on passengers’ overall satisfaction with the service level of public transport [2]. However, current public transport systems reach very low scores of satisfaction concerning their flexibility, indicating an urgent need for improvement [2].
All around the world, on-demand ride services—often called ridehailing or ridesourcing—like Uber and Lyft have sprung up like mushrooms, marking a transformation of urban mobility [3]. However, there are critical voices claiming that the launches of ridehailing services are leading to significant reductions in the utilization of city buses [4] and to an increase of vehicle kilometers travelled [5]. Thus, the average number of passengers per trip should be increased by sharing rides [4]. Ridepooling aims to match rides of separate passengers [6]. Ridepooling systems like Via [7] offer a user-centered service that is based on real-time routing without fixed schedules and predefined stops. With the help of intelligent matching algorithms, the routes of passengers who are heading in the same direction are pooled.
Ridepooling systems might provide a personalized mobility service on the one hand and ensure the efficiency and sustainability of the transport system on the other hand [8]. Such shared mobility systems might complement public transport [9]; they could also make an important contribution to the improvement of sustainable and livable cities since shared mobility systems might reduce traffic volume and thus decrease CO2 emissions and the number of parking spaces required [8,10,11,12,13]. In a simulation study, the International Transport Forum of the Organisation for Economic Co-operation and Development (OECD) revealed that only 2.8% of today’s fleet size in the city of Lisbon would be necessary to secure citizens’ mobility if shared mobility systems would provide on-demand mobility for citizens [10]. According to their simulation, the use of shared taxis and taxi-buses would reduce CO2 emissions to 66% of today’s level and result in a release of 97% of parking spaces which could be recaptured for living and recreation purposes. Furthermore, the simulation revealed that the total vehicle-kilometers would be 37% less. Based on an agent-based simulation model, Martinez, Correia, and Viegas [11] proved that the introduction of a shared-taxi scheme in the city of Lisbon improved the taxi system performance from the users’ perspective in a way such that the average waiting time, total travel time, and fare could be reduced. The obtained results further showed that the taxis may also benefit from an increase in operational efficiency which was measured by the average revenue per travelled kilometer [11].
The expected dissemination of autonomous vehicles will most likely contribute to the attractiveness of shared mobility services and the efficacy of those systems [12]. Accordingly, the MEGAFON study showed that a combination of a high-performance tramway and a ridepooling system would ensure public mobility in the city of Stuttgart based on a vehicle fleet that includes 7% of today’s number of vehicles [13]. Those findings are in line with results from Fagnant and Kockelmann [14], whose simulation study revealed that each shared autonomous vehicle can replace around 11 private cars.
All of those studies share the idea of reducing the number of private rides with the help of public ridepooling services in order to reduce urban traffic. As proposed by the study of the International Transport Forum, new shared public transport systems should be of superior quality to the current public transport system in order to reach high user acceptance and willingness [10]. Yet, it is still unclear to which extent certain characteristics of a ridepooling system lead to superior quality and hence influence its adoption. Thus, in order to create ridepooling systems that are an attractive alternative to private cars, there is a great need to study travelers’ requirements concerning such ridepooling systems.
1.2. Travelers’ Requirements for Ridepooling Services
When introducing new mobility services to the market, it is essential to take travelers’ preferences into account at an early stage of development [15]. In order to attain higher user acceptance and willingness, it is essential to base the innovative service on the users’ needs and requirements [16]. Several research studies have addressed travelers’ requirements concerning fixed-scheduled bus transport and found reliability, fare, distance of bus stop, frequency, and travel time to be recurring attributes that affected bus service quality from the passengers’ perspective [17,18,19,20,21]. See [22] for a literature review on the attributes of bus services that proved important for passengers’ appraisal in previous studies. Yet, findings concerning fixed-schedule bus transport are hardly transferable to ridepooling services since they are in large parts very different: they lack supply-oriented service elements, like fixed routes and stops, in favor of demand-responsive service elements, like real-time routing.
As public ridepooling systems share important aspects of their operational concept with demand-responsive transport systems (DRT), which have operated for several decades in rural areas [23], it seems reasonable to consider findings in the field of passengers’ requirements concerning DRT systems. Finn, Ferrari, and Sassoli (2004) [24] identified several main needs of users relating to DRT systems based on an excessive user needs analysis. They emphasized the importance of easy access to the service in terms of short walking distances as well as complete and reliable information [24]. Furthermore, they stressed the relevance of the ease and speed of booking, a minimum of detours, and maximum operating hours and network coverage for users’ acceptance [24]. In a further study, short travel and waiting times were revealed as important performance indicators of DRT systems from the customers’ perspective [25]. Kahrs [26] used Conjoint Analysis to model the Willingness-To-Pay (WTP) of regular bus users and nonusers for different DRT systems. He found a high WTP of users and nonusers for short waiting times and a low importance of the location of the pick-up point. Takeuchi, Nakamura, Okura, and Hiraishi [27] examined the feasibility of DRTs based on a demand study with the help of a stated preference survey. They found waiting time and travel time to affect travelers’ appraisal of DRT systems [26]. König and Grippenkoven [28] found the construct of Performance Expectancy of the DRT service to be the best predictor of the users’ behavioral intention to use a DRT system. Nelson and Phonphitakchai [29] conducted a survey in order to examine residents’ awareness, satisfaction, and relative advantage concerning a local DRT system. They showed that respondents perceive the DRT as better in terms of service quality than the conventional bus service but are somehow unsatisfied with the booking procedure via phone [29].
However, those studies [24,25,26,27,28,29] addressed DRT systems in rural areas that are booked solely by phone calls that have to be made several hours or even a day before the ride. Since today’s ridepooling systems are mainly launched in large cities and rely upon online booking via smartphone, the results of the user studies concerning DRT systems are only transferable to a limited extent. As a result, a systematic understanding of the various factors contributing to the utility of ridepooling systems is still lacking. How travelers perceive and assess the service characteristics of ridepooling systems still remains unclear. Thus, further studies should consider the flexibility and dynamics of ridepooling services caused by the evolution of information and communication technology (ICT).
The study presented here builds on the previously found attributes that are important for the success of DRT systems and transfers them to the concept of ridepooling systems. It aims to contribute to a deeper understanding of the relative importance of these attributes and travelers’ preferences concerning ridepooling systems. Hence, the study intends to determine which characteristics of ridepooling service concepts are most important to the users by incorporating various attributes like, for example, walking distances to the pick-up point and fare prices. Furthermore, the study addresses the question of how sociodemographic characteristics of travelers, like age, and situational factors, like the purpose of the trip, affect the appraisal of the ridepooling’s service characteristics. Since new ridepooling systems all over the world emerge mainly in large cities [30], the scope of this research is limited to the analysis of urban residents’ appraisal of ridepooling service characteristics. At the present time (mid-2018), 18 locations in Germany offer ridepooling services to their local residents, 16 of which operate in large cities with more than 100,000 inhabitants [30].
The study presented here is one of the first attempts to assess the effect of ridepooling service characteristics on travelers’ appraisal of ridepooling systems. It aims to make important contributions to the ongoing research in the field of new transportation systems by using the method of Conjoint Analysis.
2. Materials and Methods
2.1. Choice-Based Conjoint Analysis
Conjoint Analysis is a widespread approach used to study human choice behavior in broad fields of applications like transport science, among others [31]. Since its beginnings in the 1970s, Conjoint Analysis has gained widespread acceptance over the different methodological alternatives offered [32]. Conjoint Analysis is a decompositional method used to examine the importance of characteristics of products or services [32]. The method is based on the premise that the utility of an alternative could be decomposed into partial utilities of the individual attributes (CONsidered JOINTly) [32]. In Conjoint Analysis, as a stated preference method, individuals are asked to indicate their preferences among alternatives that are defined by a set of combinations of attributes [33]. Under the premise that individuals select the alternative with the highest subjective utility, the utility of the attributes and the probability of choosing the alternative could be examined by analyzing respondents’ preferences [33]. In contrast to Discrete Choice Models, Conjoint Analysis allows the testing of alternative product features [34]. Choice-based Conjoint Analysis combines features of Discrete Choice Models and Conjoint Analysis [34]; it is considered to be the most realistic form of Conjoint Analysis as respondents are faced with choice situations very similar to the actual marketplace by presenting all attributes considered relevant for an alternative and providing a none-of-these option [35]. Moreover, choice-based Conjoint Analysis allows the inclusion of interaction effects in the statistical model. Therefore, it can be tested whether the valuation of attributes differs across individual characteristics of the respondents, such as age [36].
2.2. Definition of Attributes and Levels
As proposed by Kløjgaard, Bech, and Søgaard [37], relevant attributes and levels for the Conjoint Analysis concerning attributes of public ridepooling systems were elicited through a qualitative process. First, a literature review was performed to identify relevant attributes of ridepooling service characteristics from the travelers’ perspective. Due to the limited empirical findings concerning travelers’ appraisal of ridepooling service characteristics, studies concerning travelers’ perception of bus public transport services were considered as well. To delimit the field of research, only those attributes were considered that were part of the operational service concept of public transport. Therefore, attributes like vehicle cleanliness and stop environment were excluded. Based on the literature review, ten relevant attributes of bus public transport were identified: reliability, frequency, travel time, fare, information provision, walking time to access, number of stops, service provision hours, network coverage, and connectability [22].
As a second step, as proposed by [38], a focus group with nine participants (six female, Meanage = 51.7 years, SDage = 22.5 years) from the city of Braunschweig was formed to validate the list of attributes based on the literature review by the subjective views of travelers. The aim of the focus group was to further define criteria for rejection of the offered service (so called K.O. criteria) and to translate technical terms like network coverage into the comprehensive language of the participants. Overall, 25 attributes were identified by the participants of the focus group. The five attributes of service quality that were rated the most relevant by the participants were time expenses, fare, spatial flexibility, temporal flexibility, and reachability of destinations.
As a last step, the identified attributes of the literature review and the focus group were compared and selected according to the Conjoint Analysis design guidelines given by Omre [39] and Weiber and Mühlhaus [40].
Reliability was renamed shift of departure time since there is no predefined schedule for ridepooling systems. This attribute was linked to the attribute temporal flexibility since the mobility-on-demand concept that lacks fixed schedules entails a shift of departure if other passengers are previously boarding the same vehicle. This is the same for the in-vehicle travel time, which might be prolonged due to detours caused by the access and egress of other travelers. This temporal flexibility affects the time expenses and travel time, which were considered the same attribute and called travel time. Even though frequency is one of the most mentioned attributes within the literature of public transport service quality, it was not considered a suitable attribute for this study since ridepooling systems are not based on a fixed timetable. Reachability of destinations was found to be hardly controllable and a derivation of demand in a specific operation area and was therefore not included in this analysis. The attributes connectability, service provision hours, network coverage, and number of stops were not considered in this study since they were proposed to be linked only to fixed-schedule public transport. Instead, spatial flexibility was included and linked to the attribute walking time to access that has been identified in the literature review. Finally, time of booking was added as an attribute because the service concept of ridepooling requires booking of rides, in contrast to conventional public transport.
Finally, the following six attributes were chosen for inclusion in the choice-based Conjoint Analysis:
- Time of booking describes the minimal number of minutes required to book a ride beforehand.
- Walking distance describes the distance in meters to reach the nearest pick-up point.
- Shift of departure defines the possible shift of the pick-up time caused by the previous access of other passengers.
- Travel time describes the in-vehicle time that is influenced by the detours caused by the access and egress of other travelers.
- Information provision describes the quantity of information that is given to the travelers.
- Fare is defined as the price in euro for a single trip.
Table 1 presents the final attributes and corresponding levels that were used for Conjoint Analysis.
2.3. Experimental Choice Design
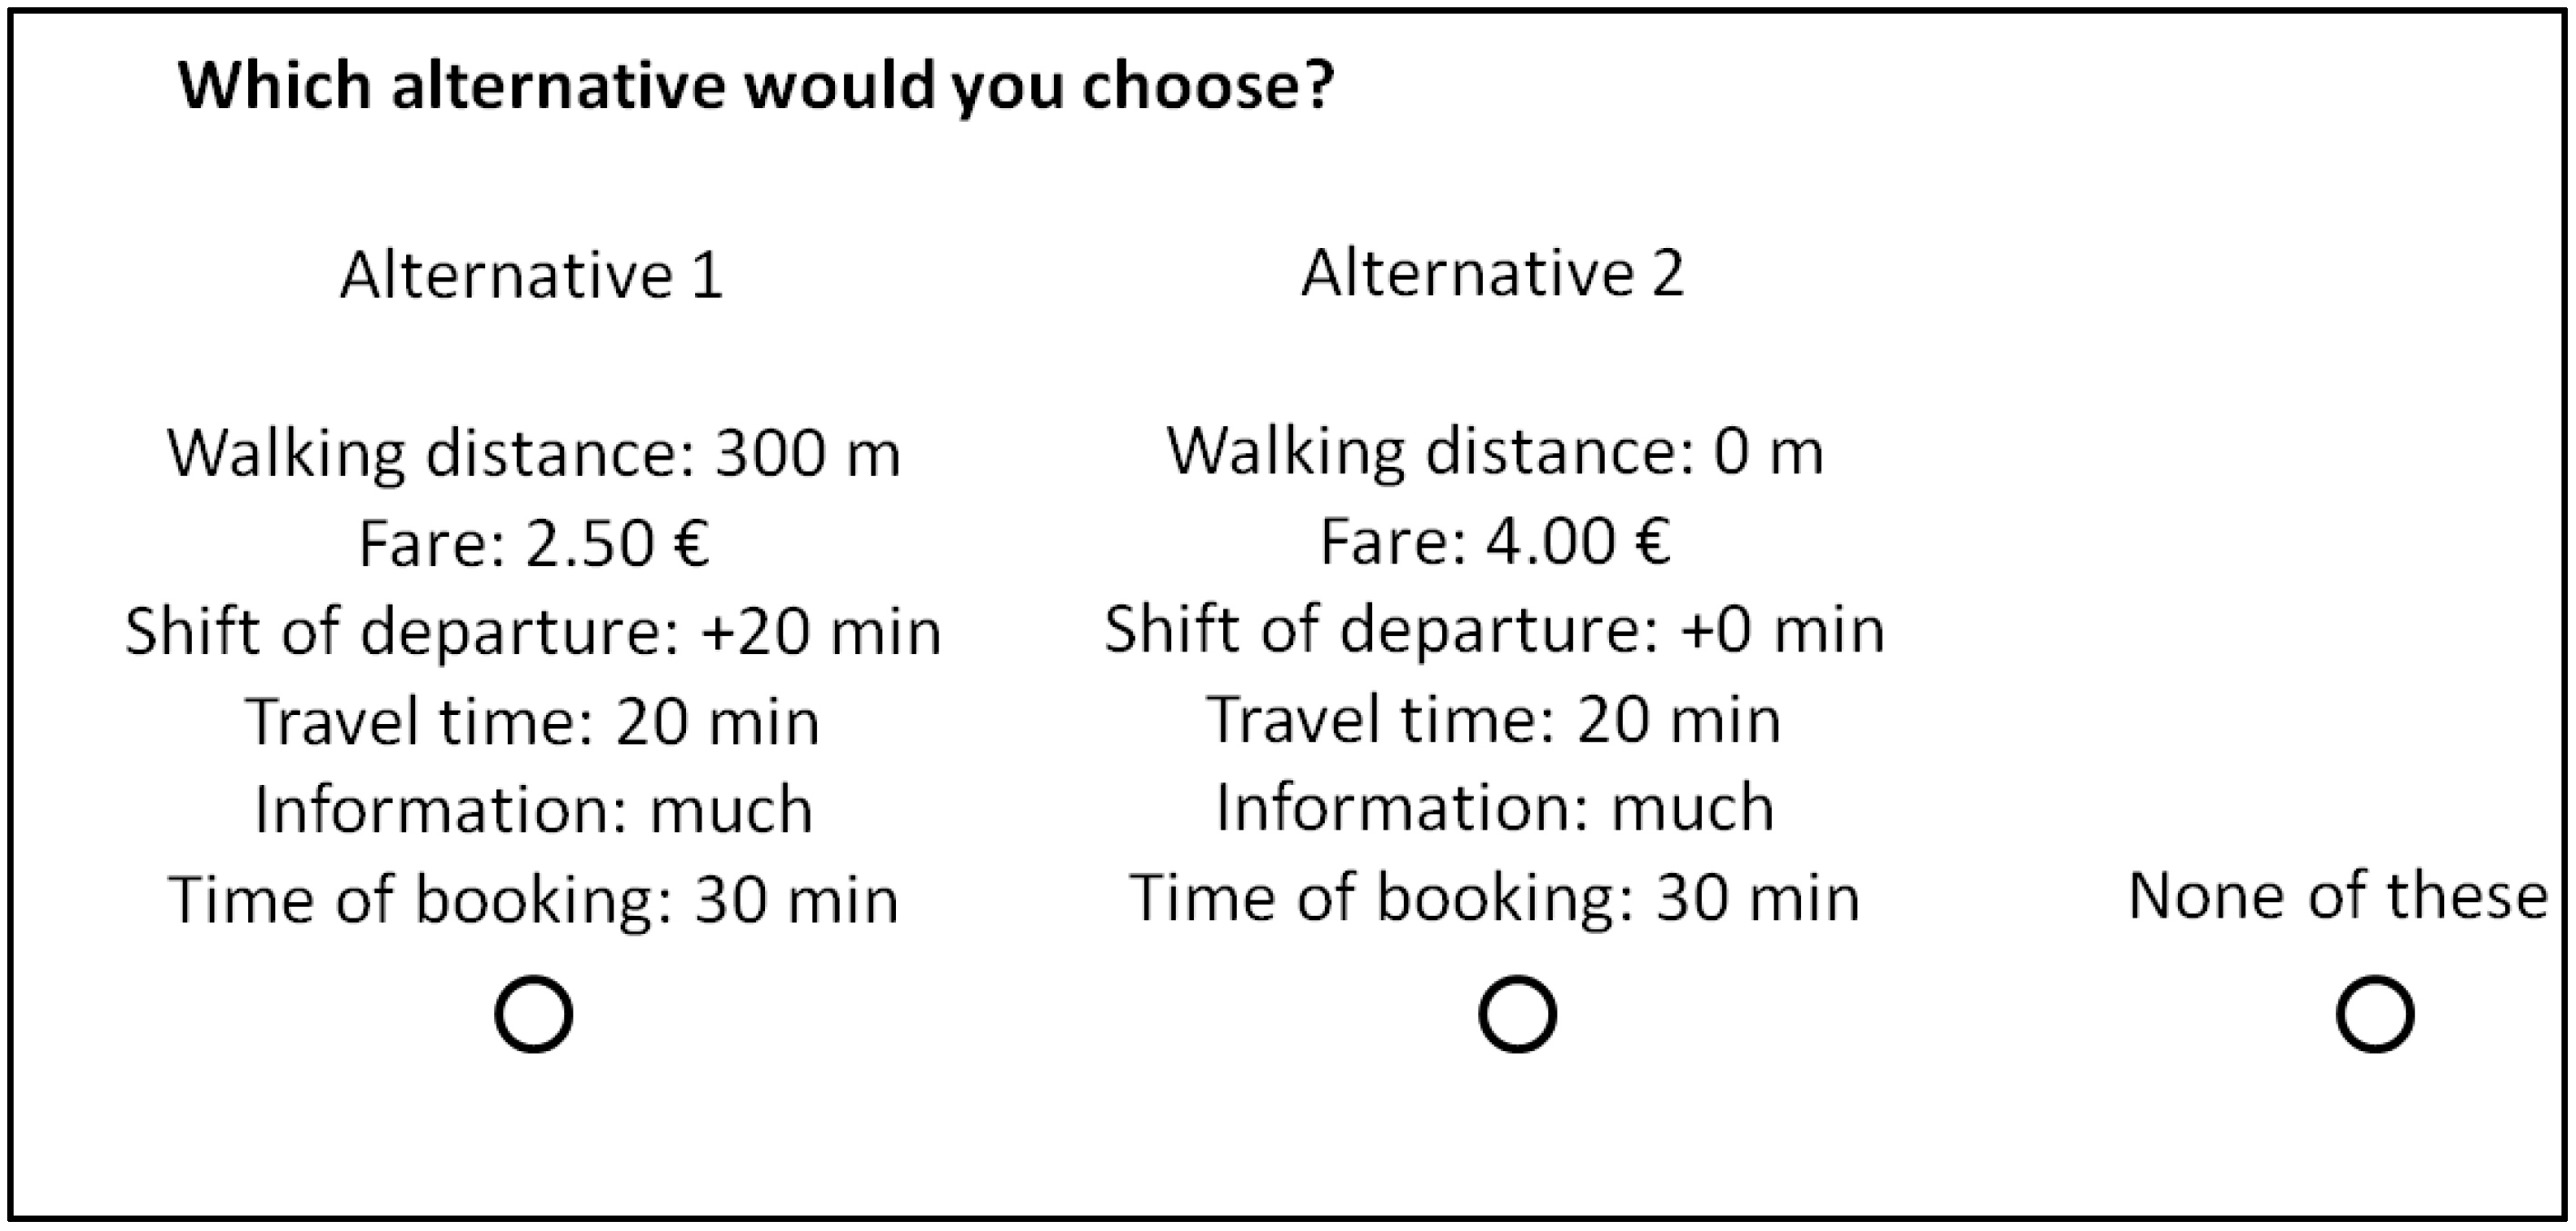
To reduce the number of presented choice sets, a fractional factorial design was produced with the help of the software R, as described in [41]. A total of 24 choice sets were created and presented to the participants in random order. As Figure 1 shows, each choice set consisted of two alternatives and the opportunity to choose none of these to avoid a forced choice, as recommended by [35]. The survey respondents were told that the focus of the study was the service concept of ridepooling systems and that all other attributes of the ridepooling systems were kept constant between the alternatives to avoid those excluded attributes interacting with the choice sets.
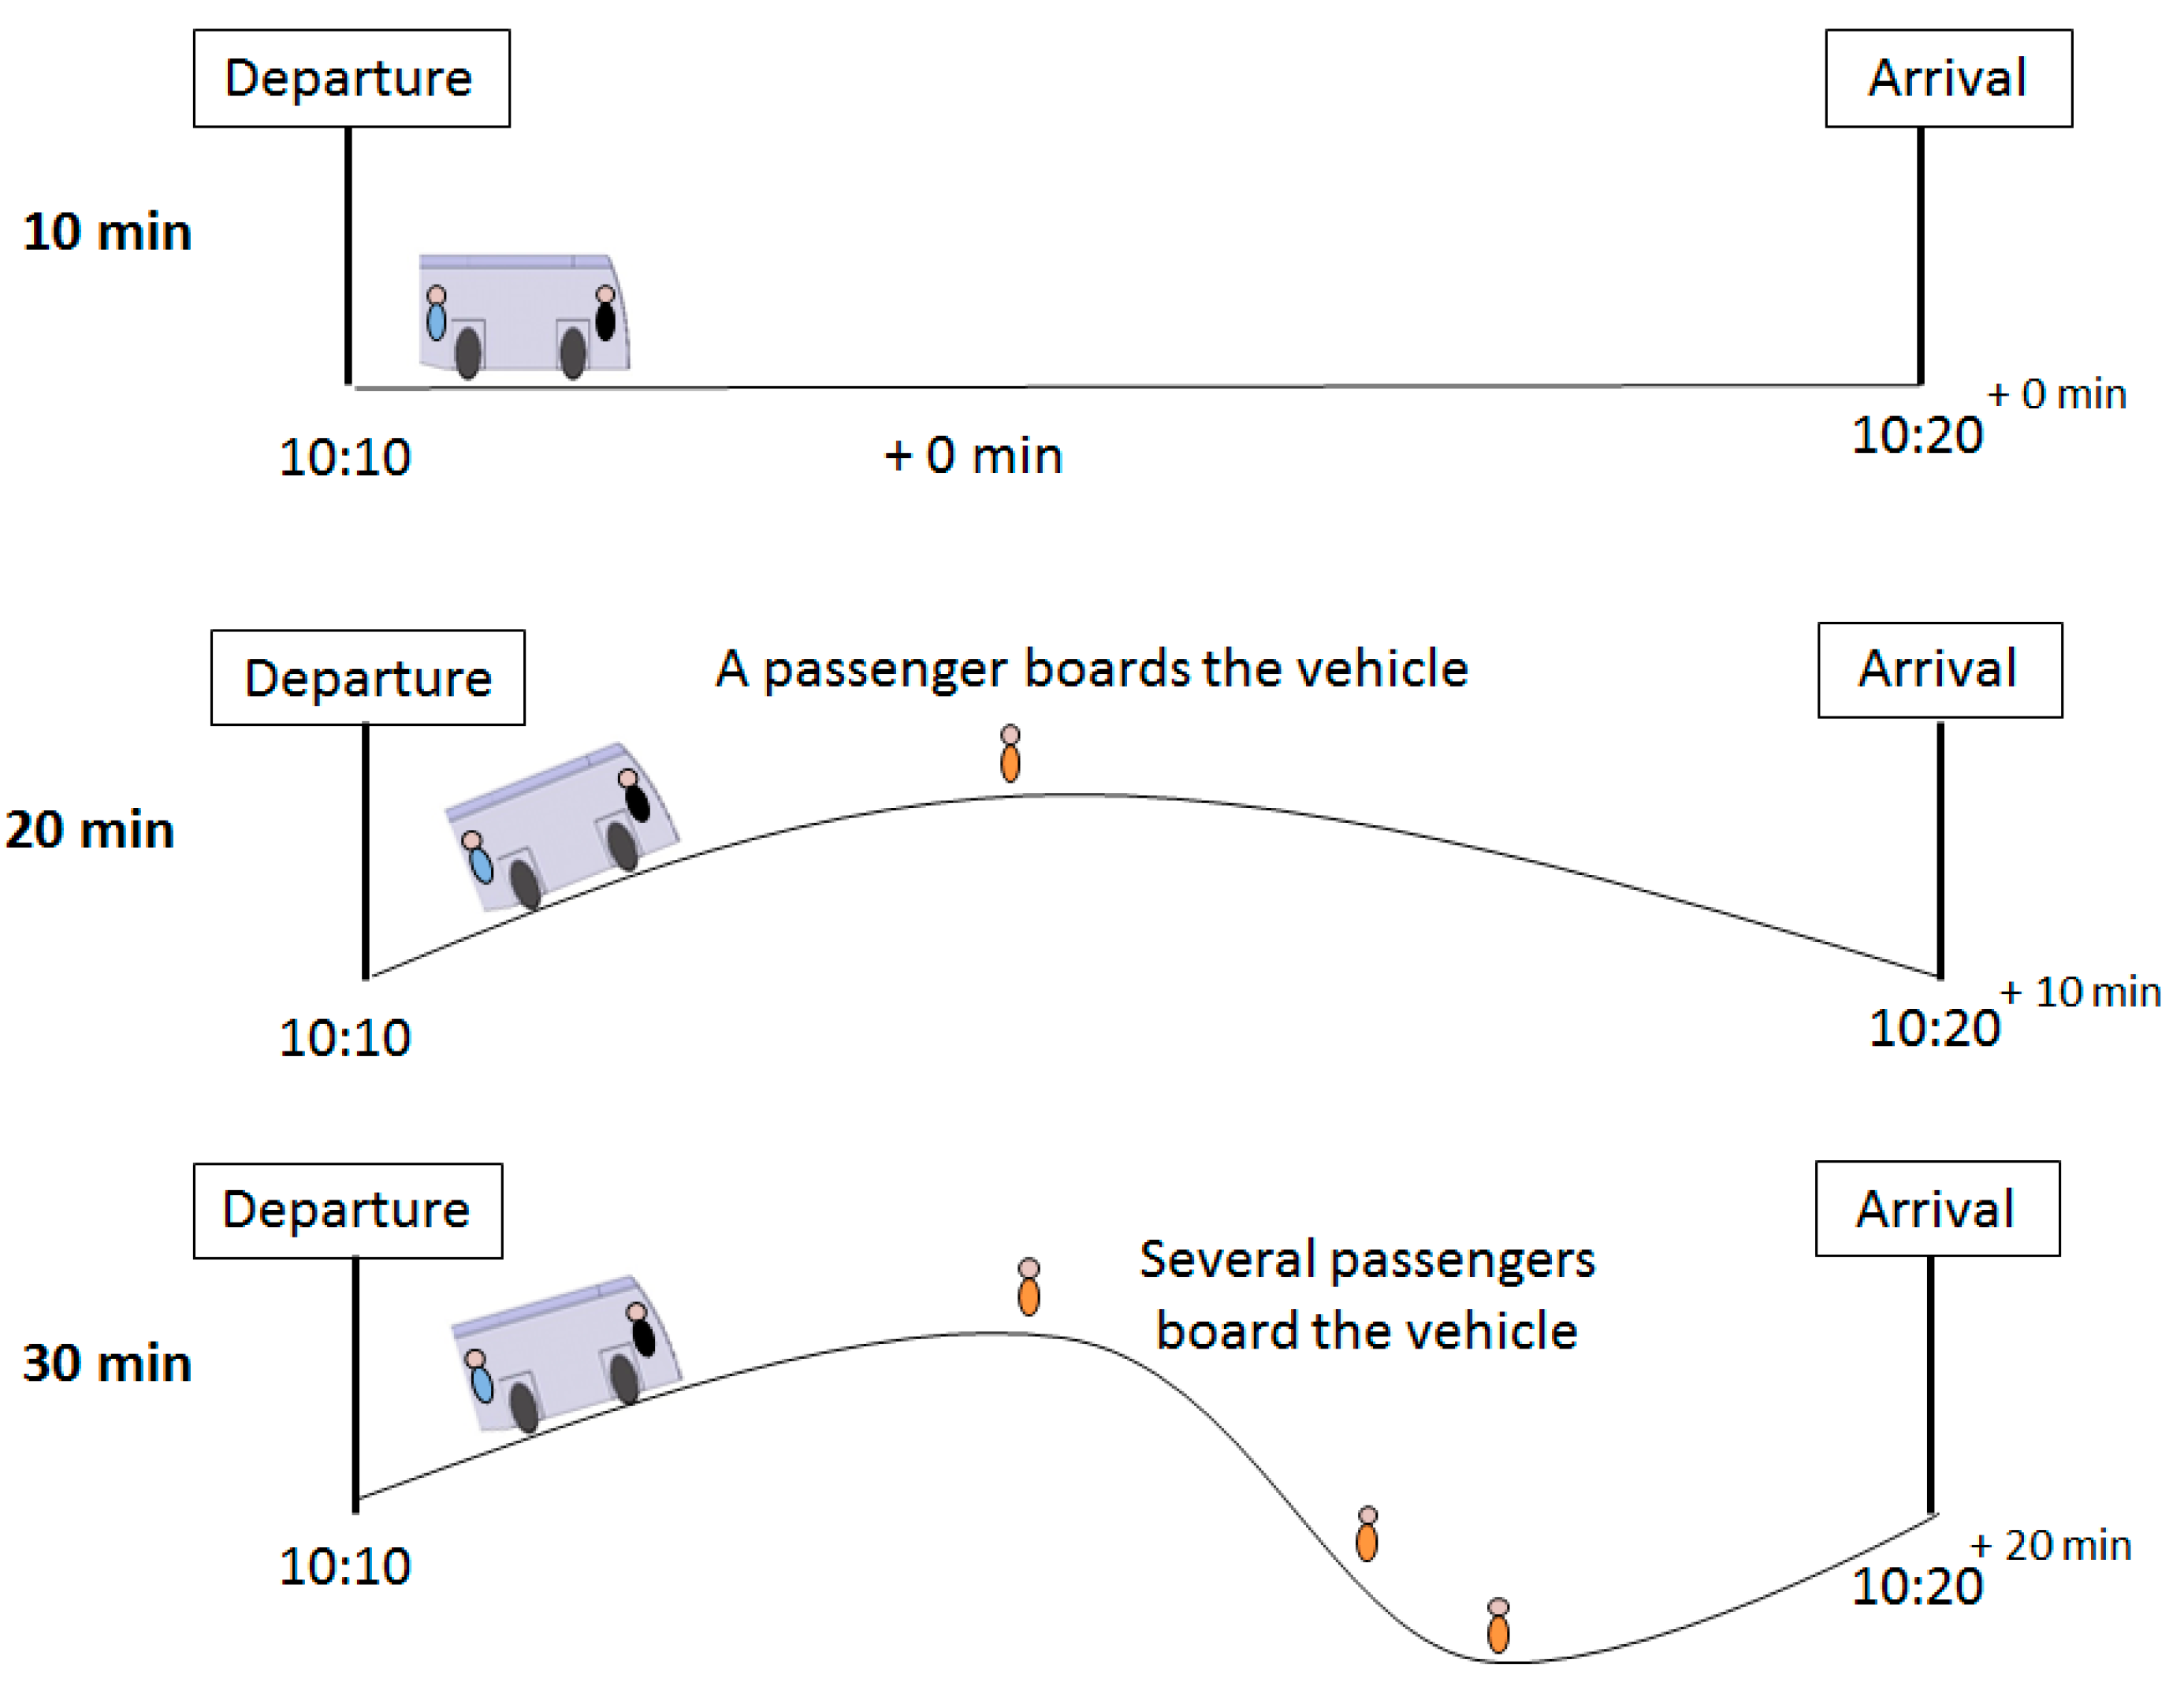
All subjects gave their informed consent for inclusion before they participated in the study. Before starting the choice experiment, the ridepooling concept was introduced and explained in detail to the respondents to make sure that all of them had the same level of knowledge about the system and its characteristics. The ridepooling concept was introduced with the following textual description: “Please imagine a public bus transport system that waives fixed schedules and fixed stops. Instead, an intelligent algorithm computes the route on demand depending on the ride requests of travelers. Travelers could make their ride requests by phone or by using a smartphone app. This transport system aims to match ride requests of travelers in order to pool the rides of different passengers and then presents a route to the traveler. Since further passengers might enter or leave the vehicle on the way, detours are no exception but a system-inherent characteristic, and changes in departure and arrival time happen on a frequent basis. A total number of eight passengers can enter the vehicle”. Subsequently, the service characteristics (attributes) and their specific expressions (levels) were introduced to the participants with the help of textual descriptions as well as graphical representations, as shown in Figure 2.
Half of the participants were introduced to the scenario of a trip of 5 km to the city center for shopping. The other half of the participants were encouraged to imagine using the ridepooling service for a doctor’s visit, which was defined as a trip of 5 km as well. As flexible departure times and shifts of arrival time are inherent aspects in ridepooling services, the scenarios were chosen to control for the effect of time pressure on the choice behavior of the respondents. The doctor’s visit was selected as a scenario to induce time pressure due to the fixed appointment. After the choice experiment, the respondents were asked to answer questions about their sociodemographic data and mobility habits.
The study was performed as an online survey using the software SosciSurvey [42]. The respondents were recruited via social media posts on Facebook and Twitter. The study was introduced to the participants as a research study aiming to assess and model travelers’ appraisal of the service characteristics of ridepooling systems. It was not mentioned that a ridepooling service is being planned to operate in their particular city.
2.4. Sample Description
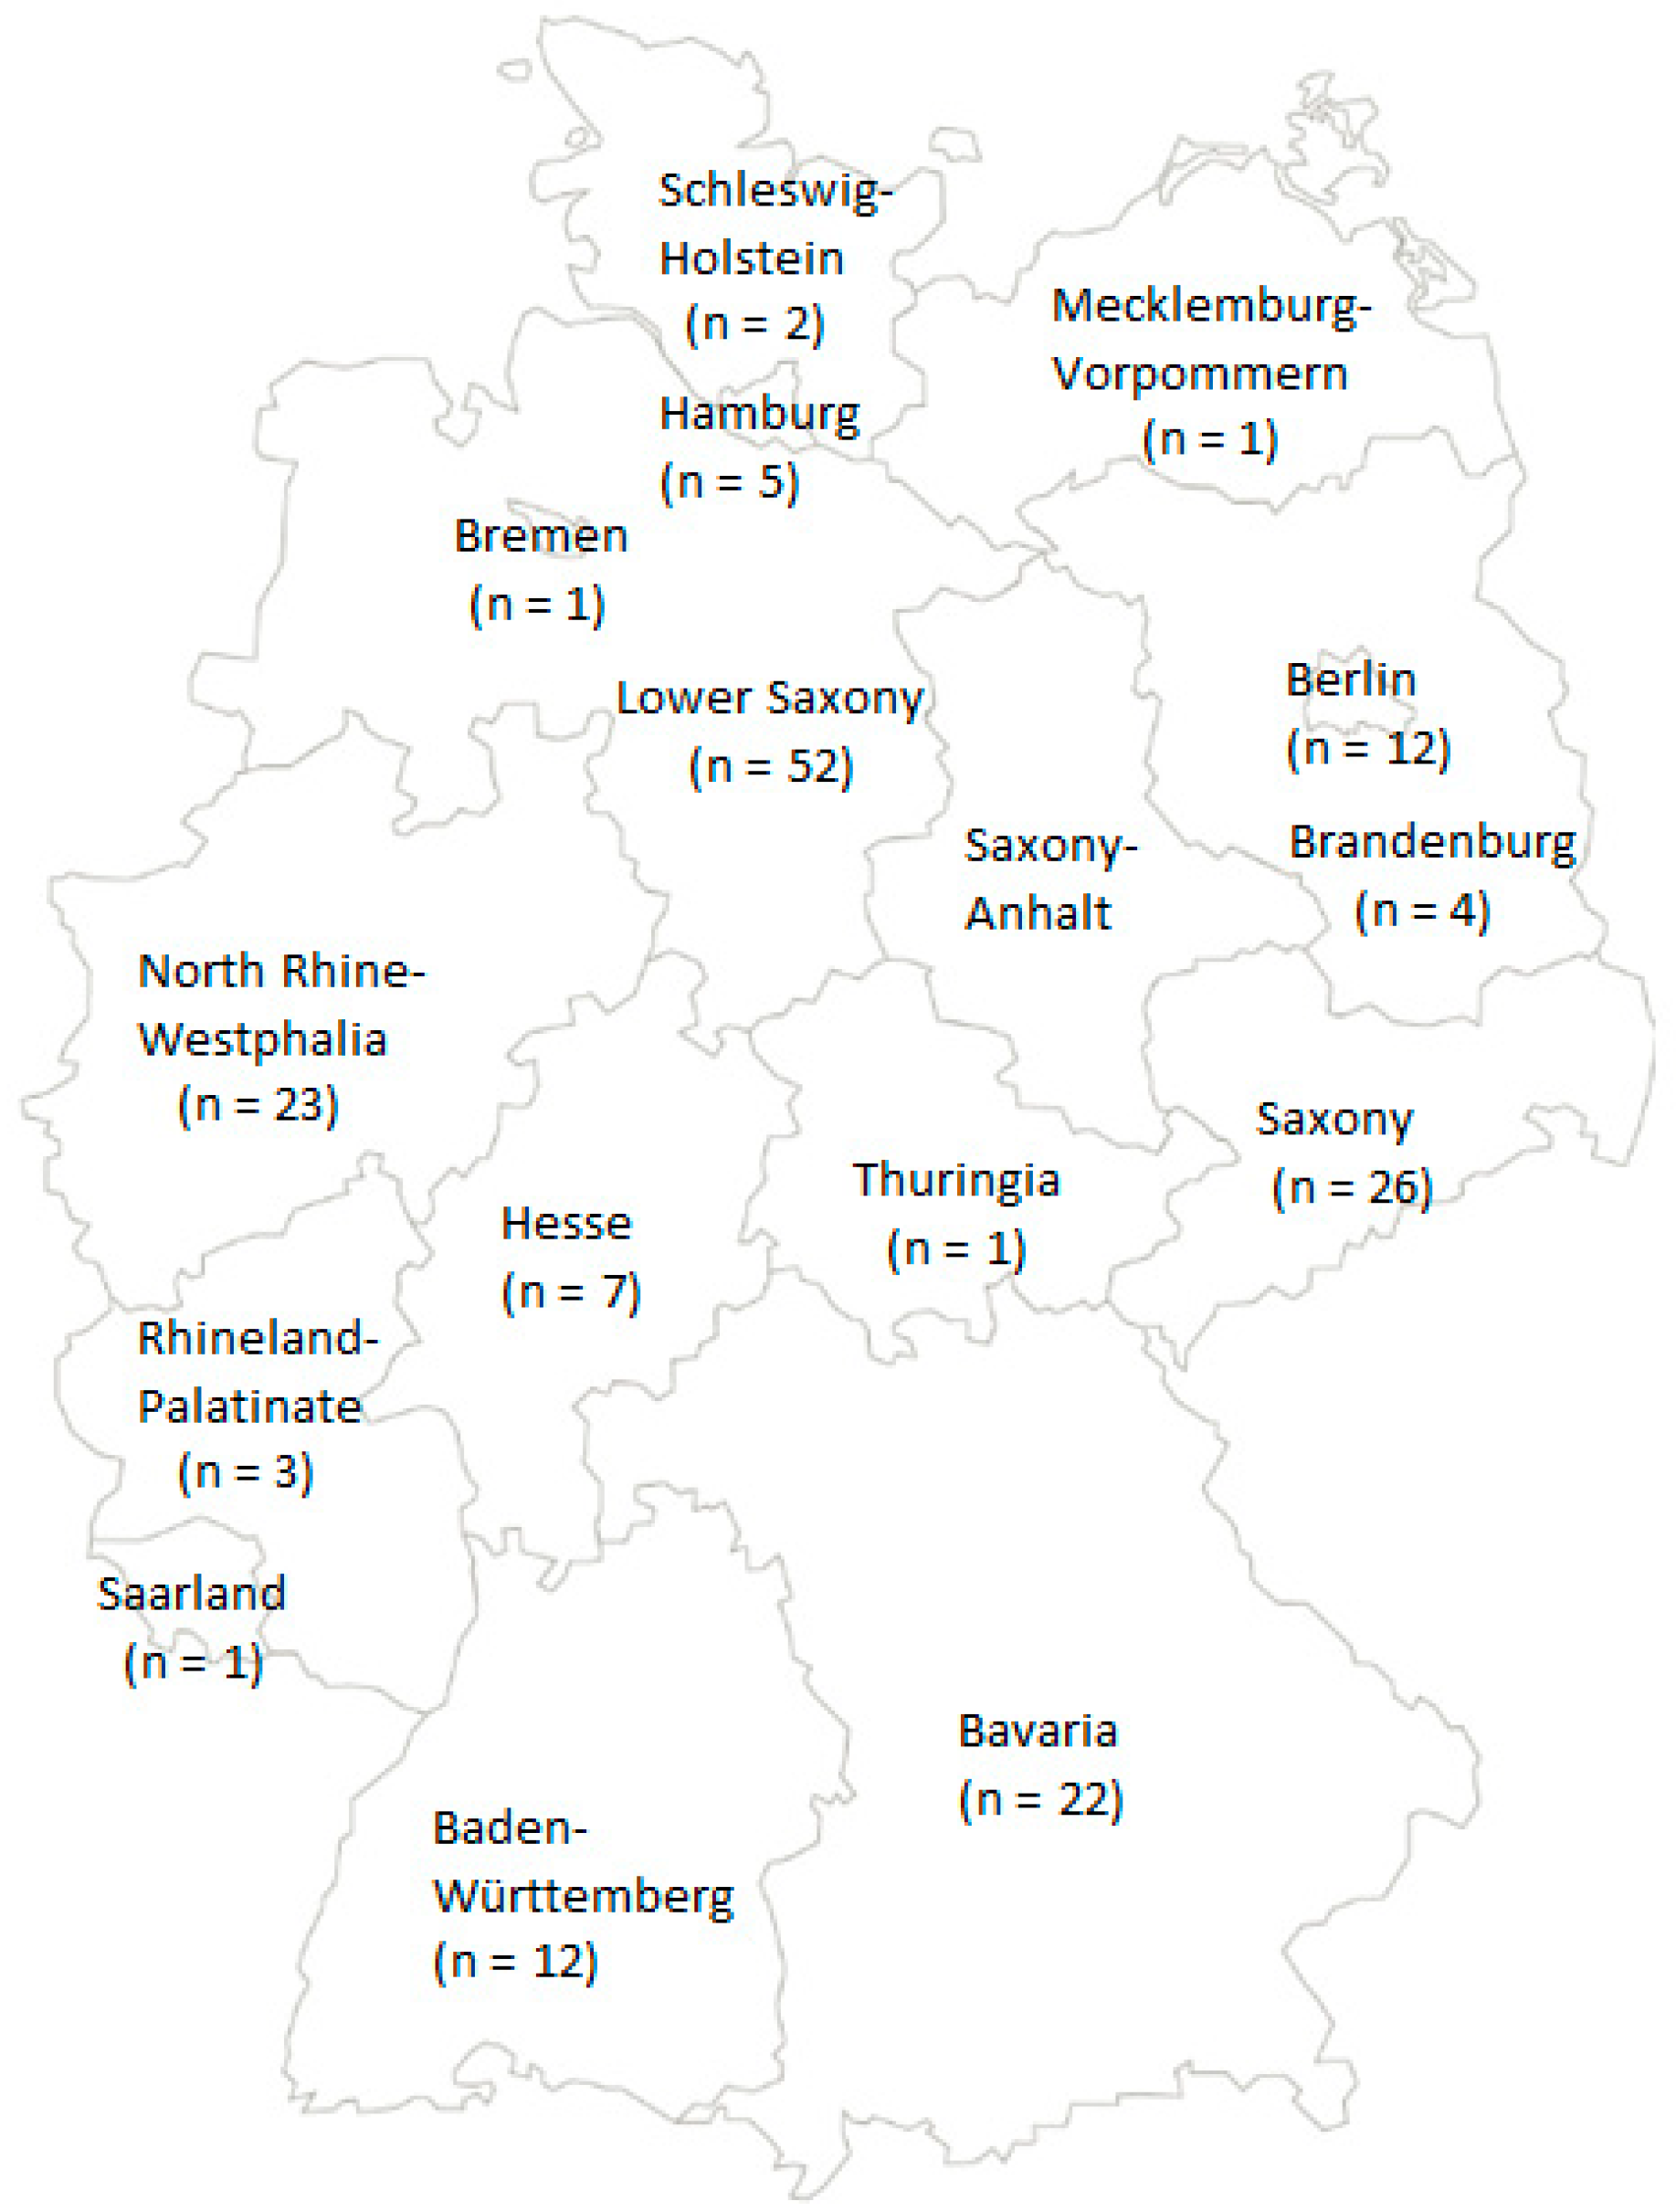
A total number of 529 respondents from all over Germany completed the online survey. Each of the 16 federal states of Germany was represented in the data. The spatial distribution of the survey respondents is displayed in Figure 3. Due to data protection regulations, no microspatial data were collected about the particular cities in which the respondents lived. Since the focus of this publication is adult city-dwellers, only those respondents aged over 18 years and stated to live in a city with more than 100,000 inhabitants were included in this analysis (n = 237). For the analysis of the total sample, reference is made to König and Grippenkoven (2018) [36].
The final sample of adult German city-dwellers was characterized by a mean age of 43.5 years (SD = 16.5 years) and consisted of slightly more men (n = 139, 58.6%) than women (n = 94, 39.7%, rest unknown). The majority of respondents declared working full-time (48.9%). Another 11.0% worked part-time. Exactly 16.0% of the respondents indicated being retired, and 18.1% were still in education. Of the respondents, 8.4% declared being mobility impaired (n = 20). Slightly more than one-third of the respondents stated that they own no car (34.2%). Concerning modal split, 18.6% of the respondents stated using bus transport on five to seven days per week. Private cars were used by more than one-quarter of the respondents (26.2%) for at least five days per week. Of the respondents, 22.8% declared that the distance to the next bus stop from their home is less than 100 m (n = 54). Another 62.4% (n = 148) stated that the next bus stop was within a distance of 100 m to 500 m, and 10.1% (n = 24) had to walk more than 500 m to reach the nearest bus stop.
The majority the respondents declared having heard before about the concept of ridepooling systems (81.0%, n = 192), yet only 35.4% (n = 84) specified living in a city where a ridepooling system operates. Another 37.6% declared that they do not know whether a ridepooling system exists in their city (n = 89). Concerning their own experience with ridepooling systems or demand-responsive transport systems, 19% stated having used a ridepooling system at least once (n = 45). Out of the total sample, 8% (n = 19) have used a ridepooling system several times. The majority of the respondents have never used a ridepooling system (80.6%, n = 191).
2.5. Data Analysis
The Conjoint Analysis was performed based on the part-worth model that is most commonly used for choice-based Conjoint Analysis [32,33]. The overall utility of an alternative is determined by Equation (1).
us = utility of alternative s
bjm = part-worth utility of level m of attribute j
xjms = dummy variable (xjms = 1 if s concerning j is m, otherwise = 0)
As another specification, the logit-choice model was used, as recommended by [33]. Data were analyzed with the help of conditional logistic regression, as described by [33], with the statistical software SPSS [43]. The last level of the attributes was determined as a base category for each attribute, as suggested by [33].
3. Results
3.1. Results for the Total Sample
Model fit was measured using the log-likelihood function which is based on chi-square statistics [33]. The model fit was very good (X2 (14, N = 17,065) = 2454.3, p < 0.001).
Table 2 shows the results of Cox regression. The regression coefficients represent the part-worth utilities of the attribute levels. The last level of the attributes was determined as a base category for each attribute. The alternative-specific constant (ASC) which represents the none-of-these option describes the uniqueness of an alternative that is not captured by other explanatory variables [44]. Comprehensibly, the estimate of the ASC is negative (−1.645); this indicates a negative effect on the utility, but no further interpretations of this coefficient can be made. Fare_2.50€ revealed the highest regression coefficient and, thus, the highest part-worth utility. The p-value displays the significance of the regression coefficients in predicting the model. As shown in Table 2, apart from Time of booking_5 min and Time of booking_10 min, all regression coefficients reached significance.
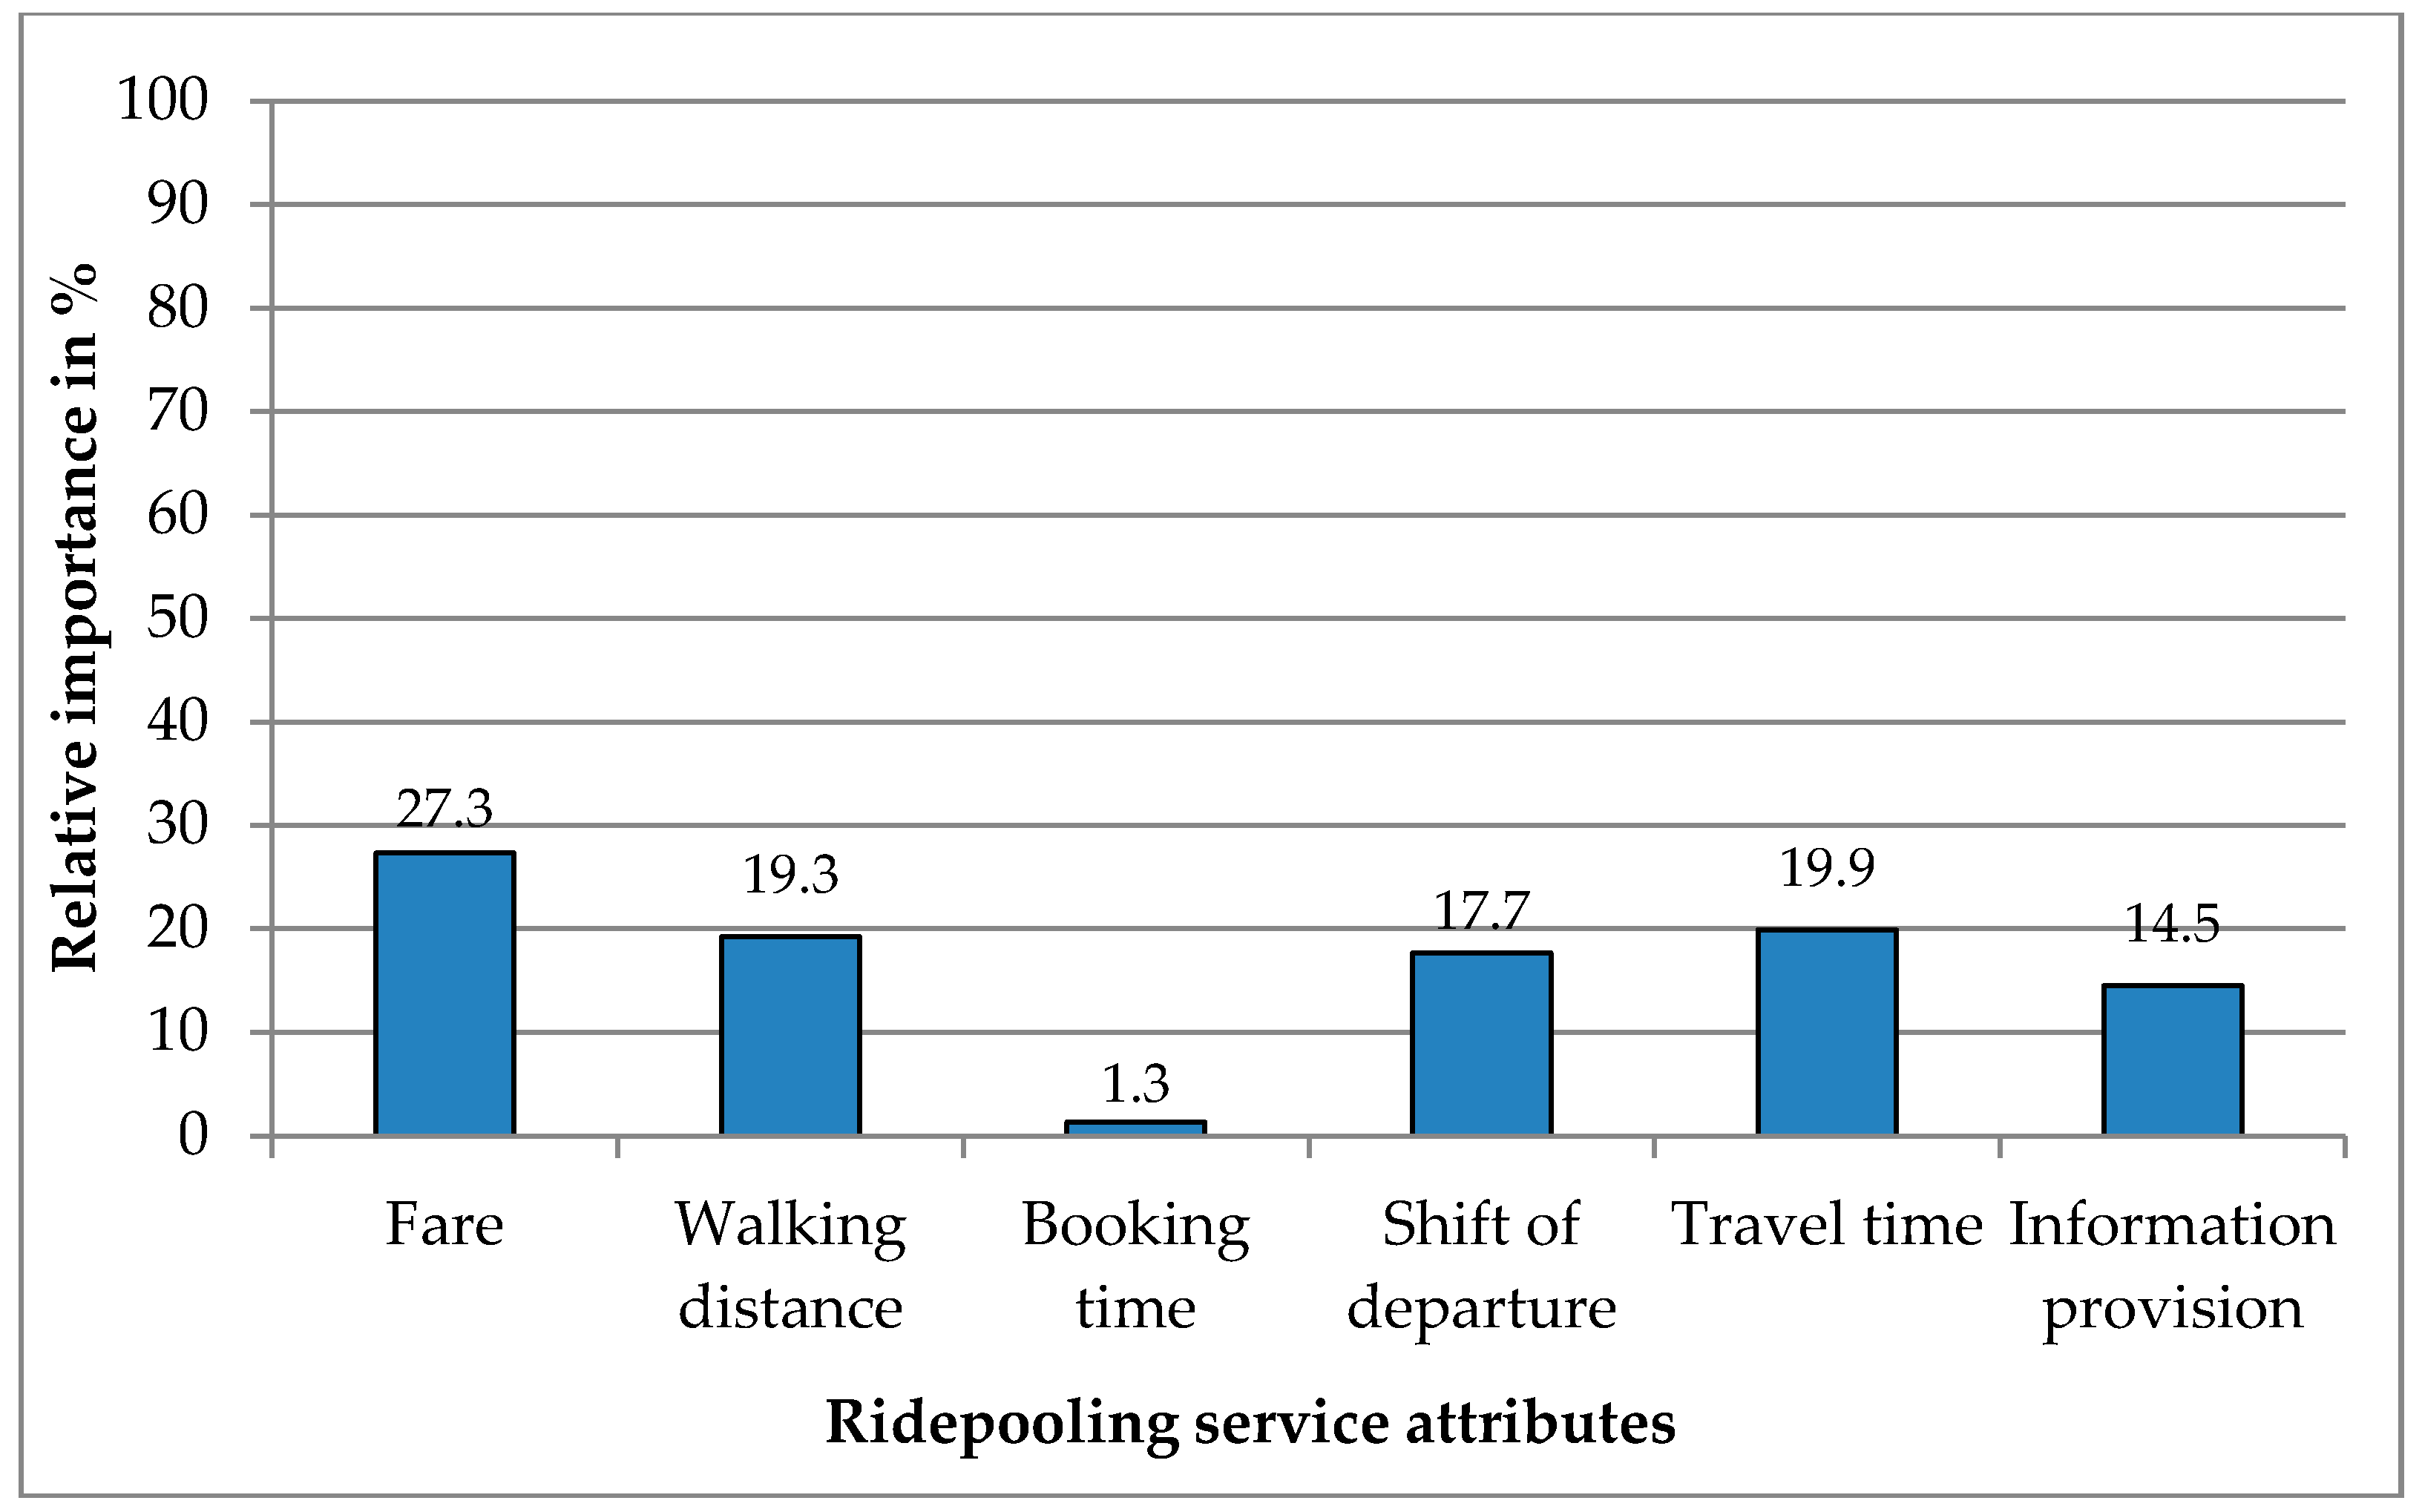
Since differences in utilities particularly affect choices [45], the ranges of part-worth utilities of the attributes were calculated. Furthermore, the relative importance of the attributes, displayed by a high range of part-worths, was assessed by dividing each attribute’s range by the sum of all range values, thus normalizing the sum of the importances to 1 [32,33]. The results of the relative importance of the attributes are displayed in Figure 4. As shown here, fare was revealed to have the highest relative importance on the overall appraisal of the ridepooling service (27.3%). The attribute walking distance (19.3%) was nearly as important to the respondents’ choice as travel time (19.9%). The attribute booking time was revealed to have the lowest relative importance (1.3%).
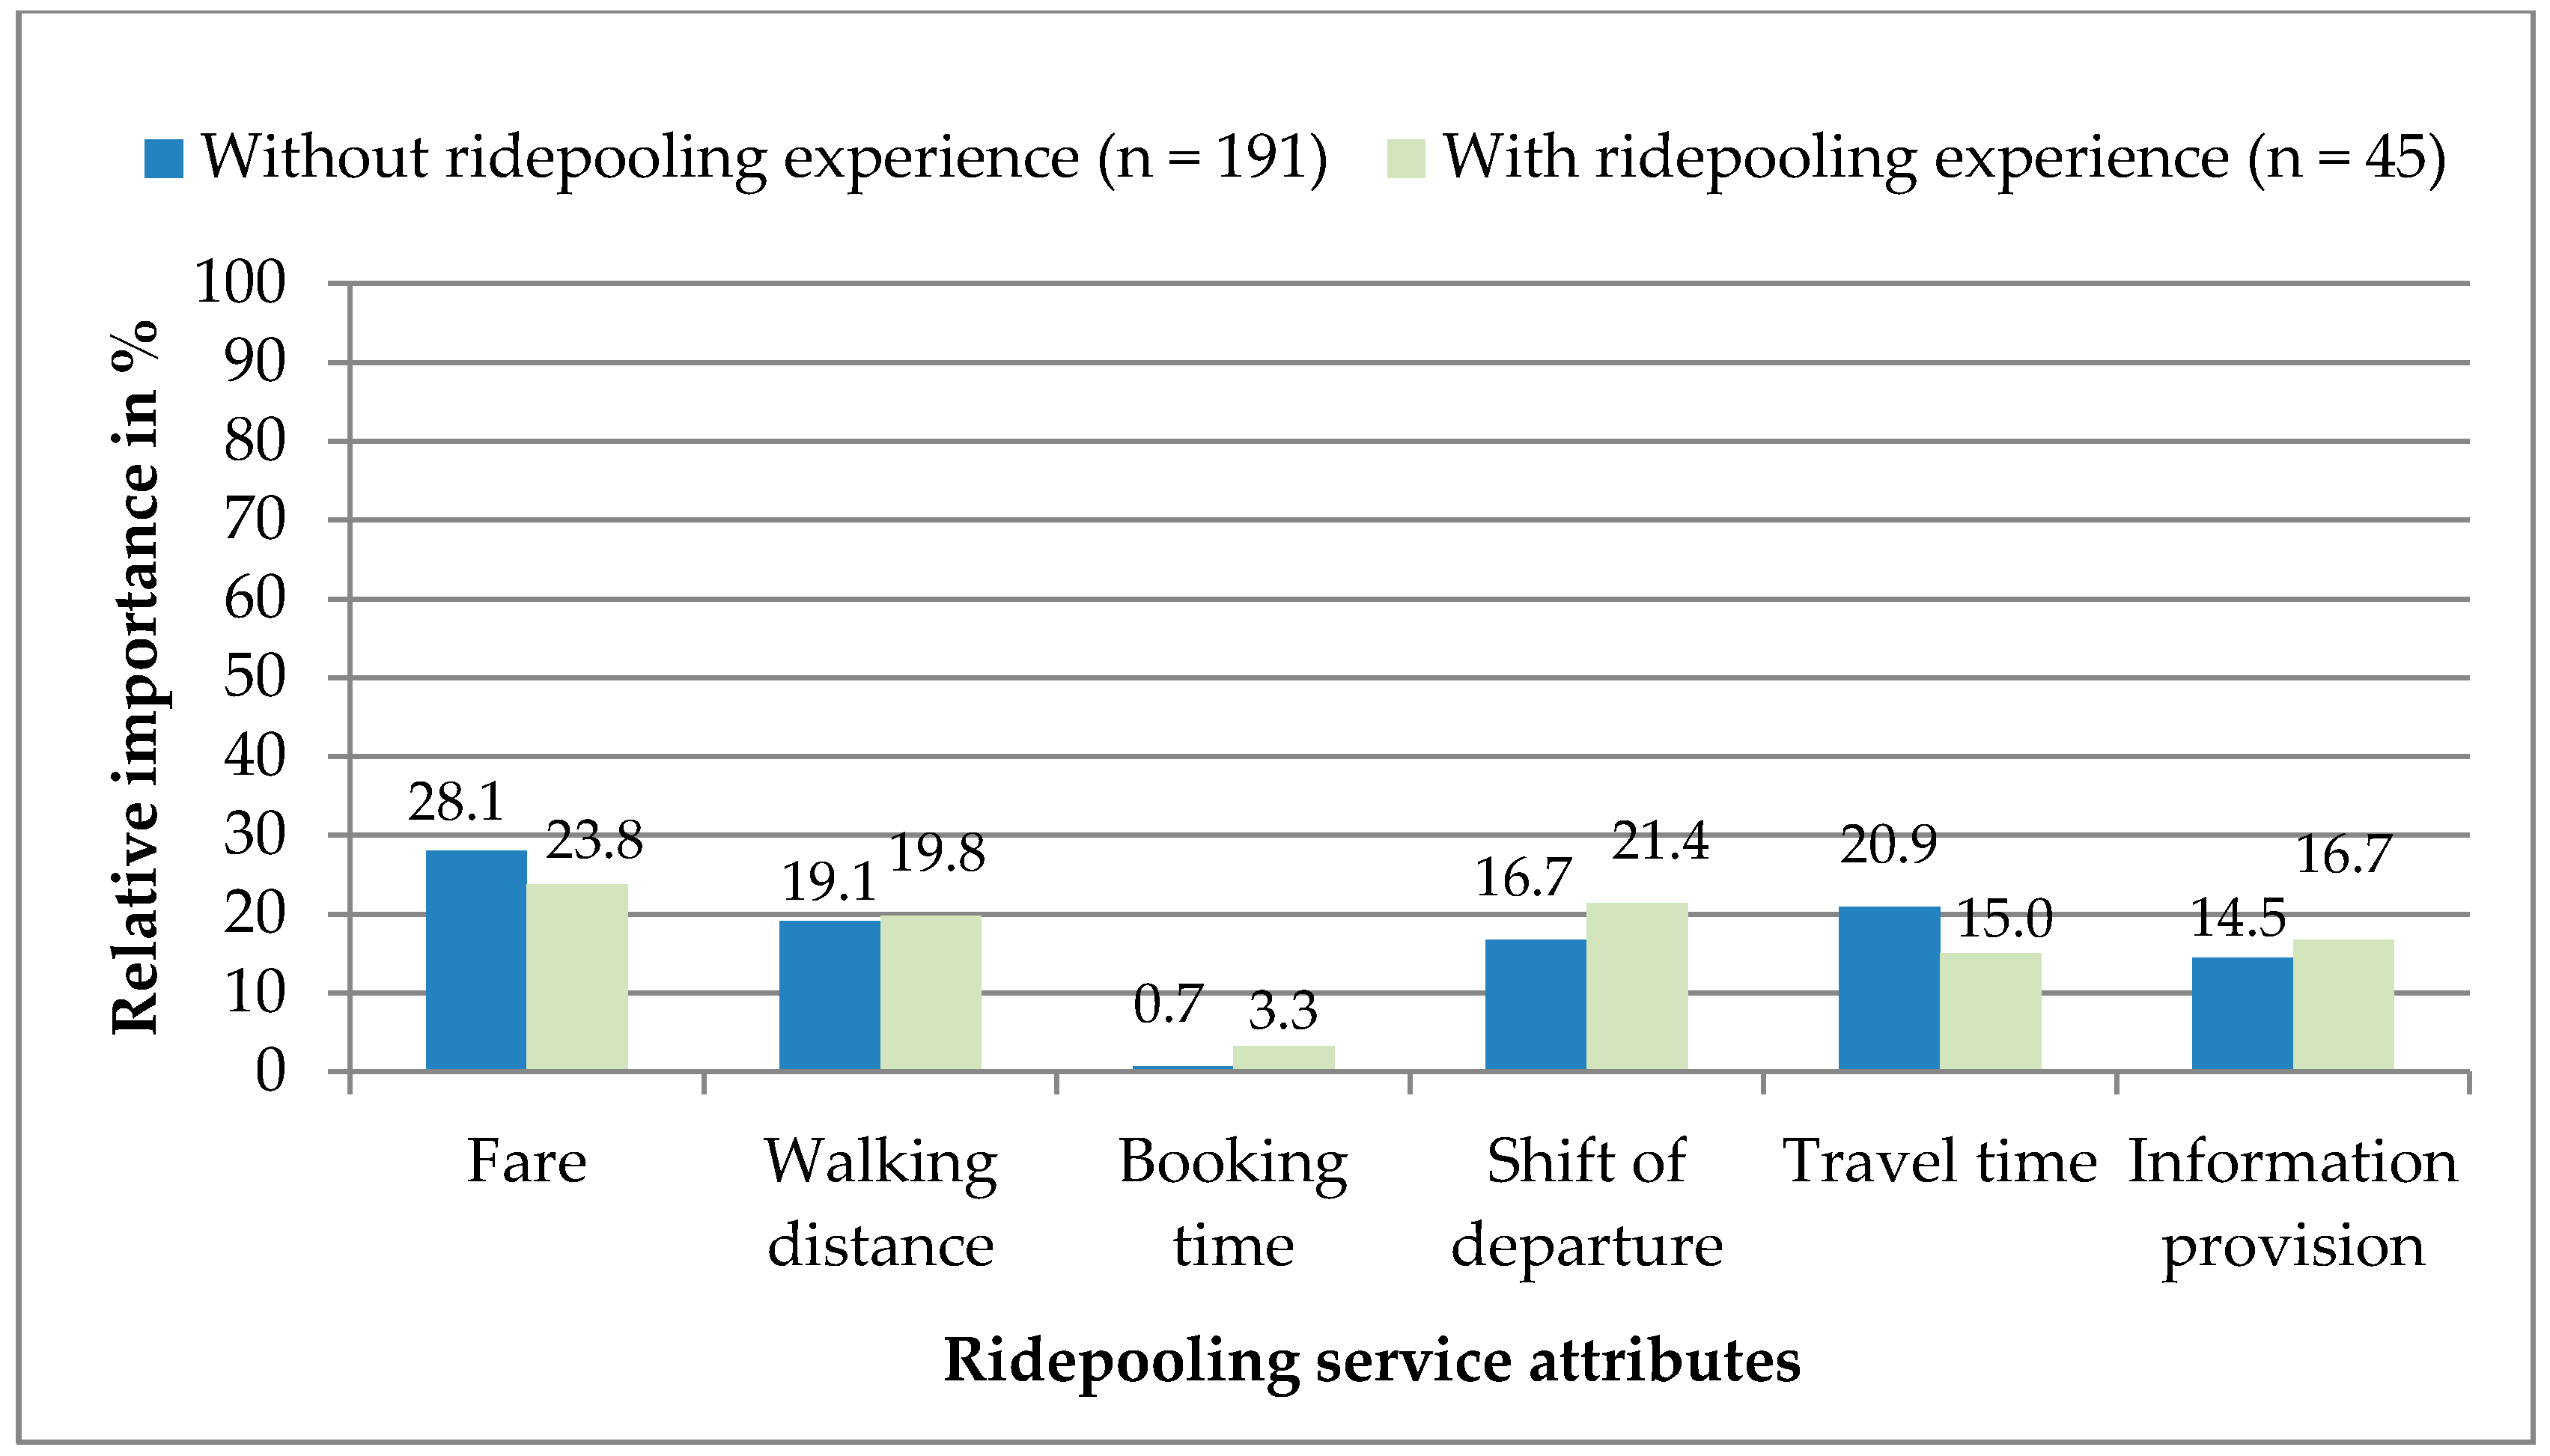
3.2. Results Comparing Previous Ridepooling Experience
The respondents’ assessment of the ridepooling service attributes was compared according to the experience of the respondents in using ridepooling systems. For this purpose, two groups were formed. Respondents that declared having not used a ridepooling system or demand-responsive transport system before were assigned to the group without ridepooling experience (n = 191, 80.6%). Respondents that had used a ridepooling system at least once before were assigned to the group with ridepooling experience (n = 45, 19%). As shown in Figure 5, the relative importance of the service attributes was compared for the two groups. As shown here, the respondents’ assessment of the ridepooling service characteristics varied depending on their previous experience with ridepooling systems. Whereas fare and travel time seem to be more important for respondents without ridepooling experience, respondents with ridepooling experience are more attentive to booking time and shift of departure and value the attribute information provision more than respondents without experience.
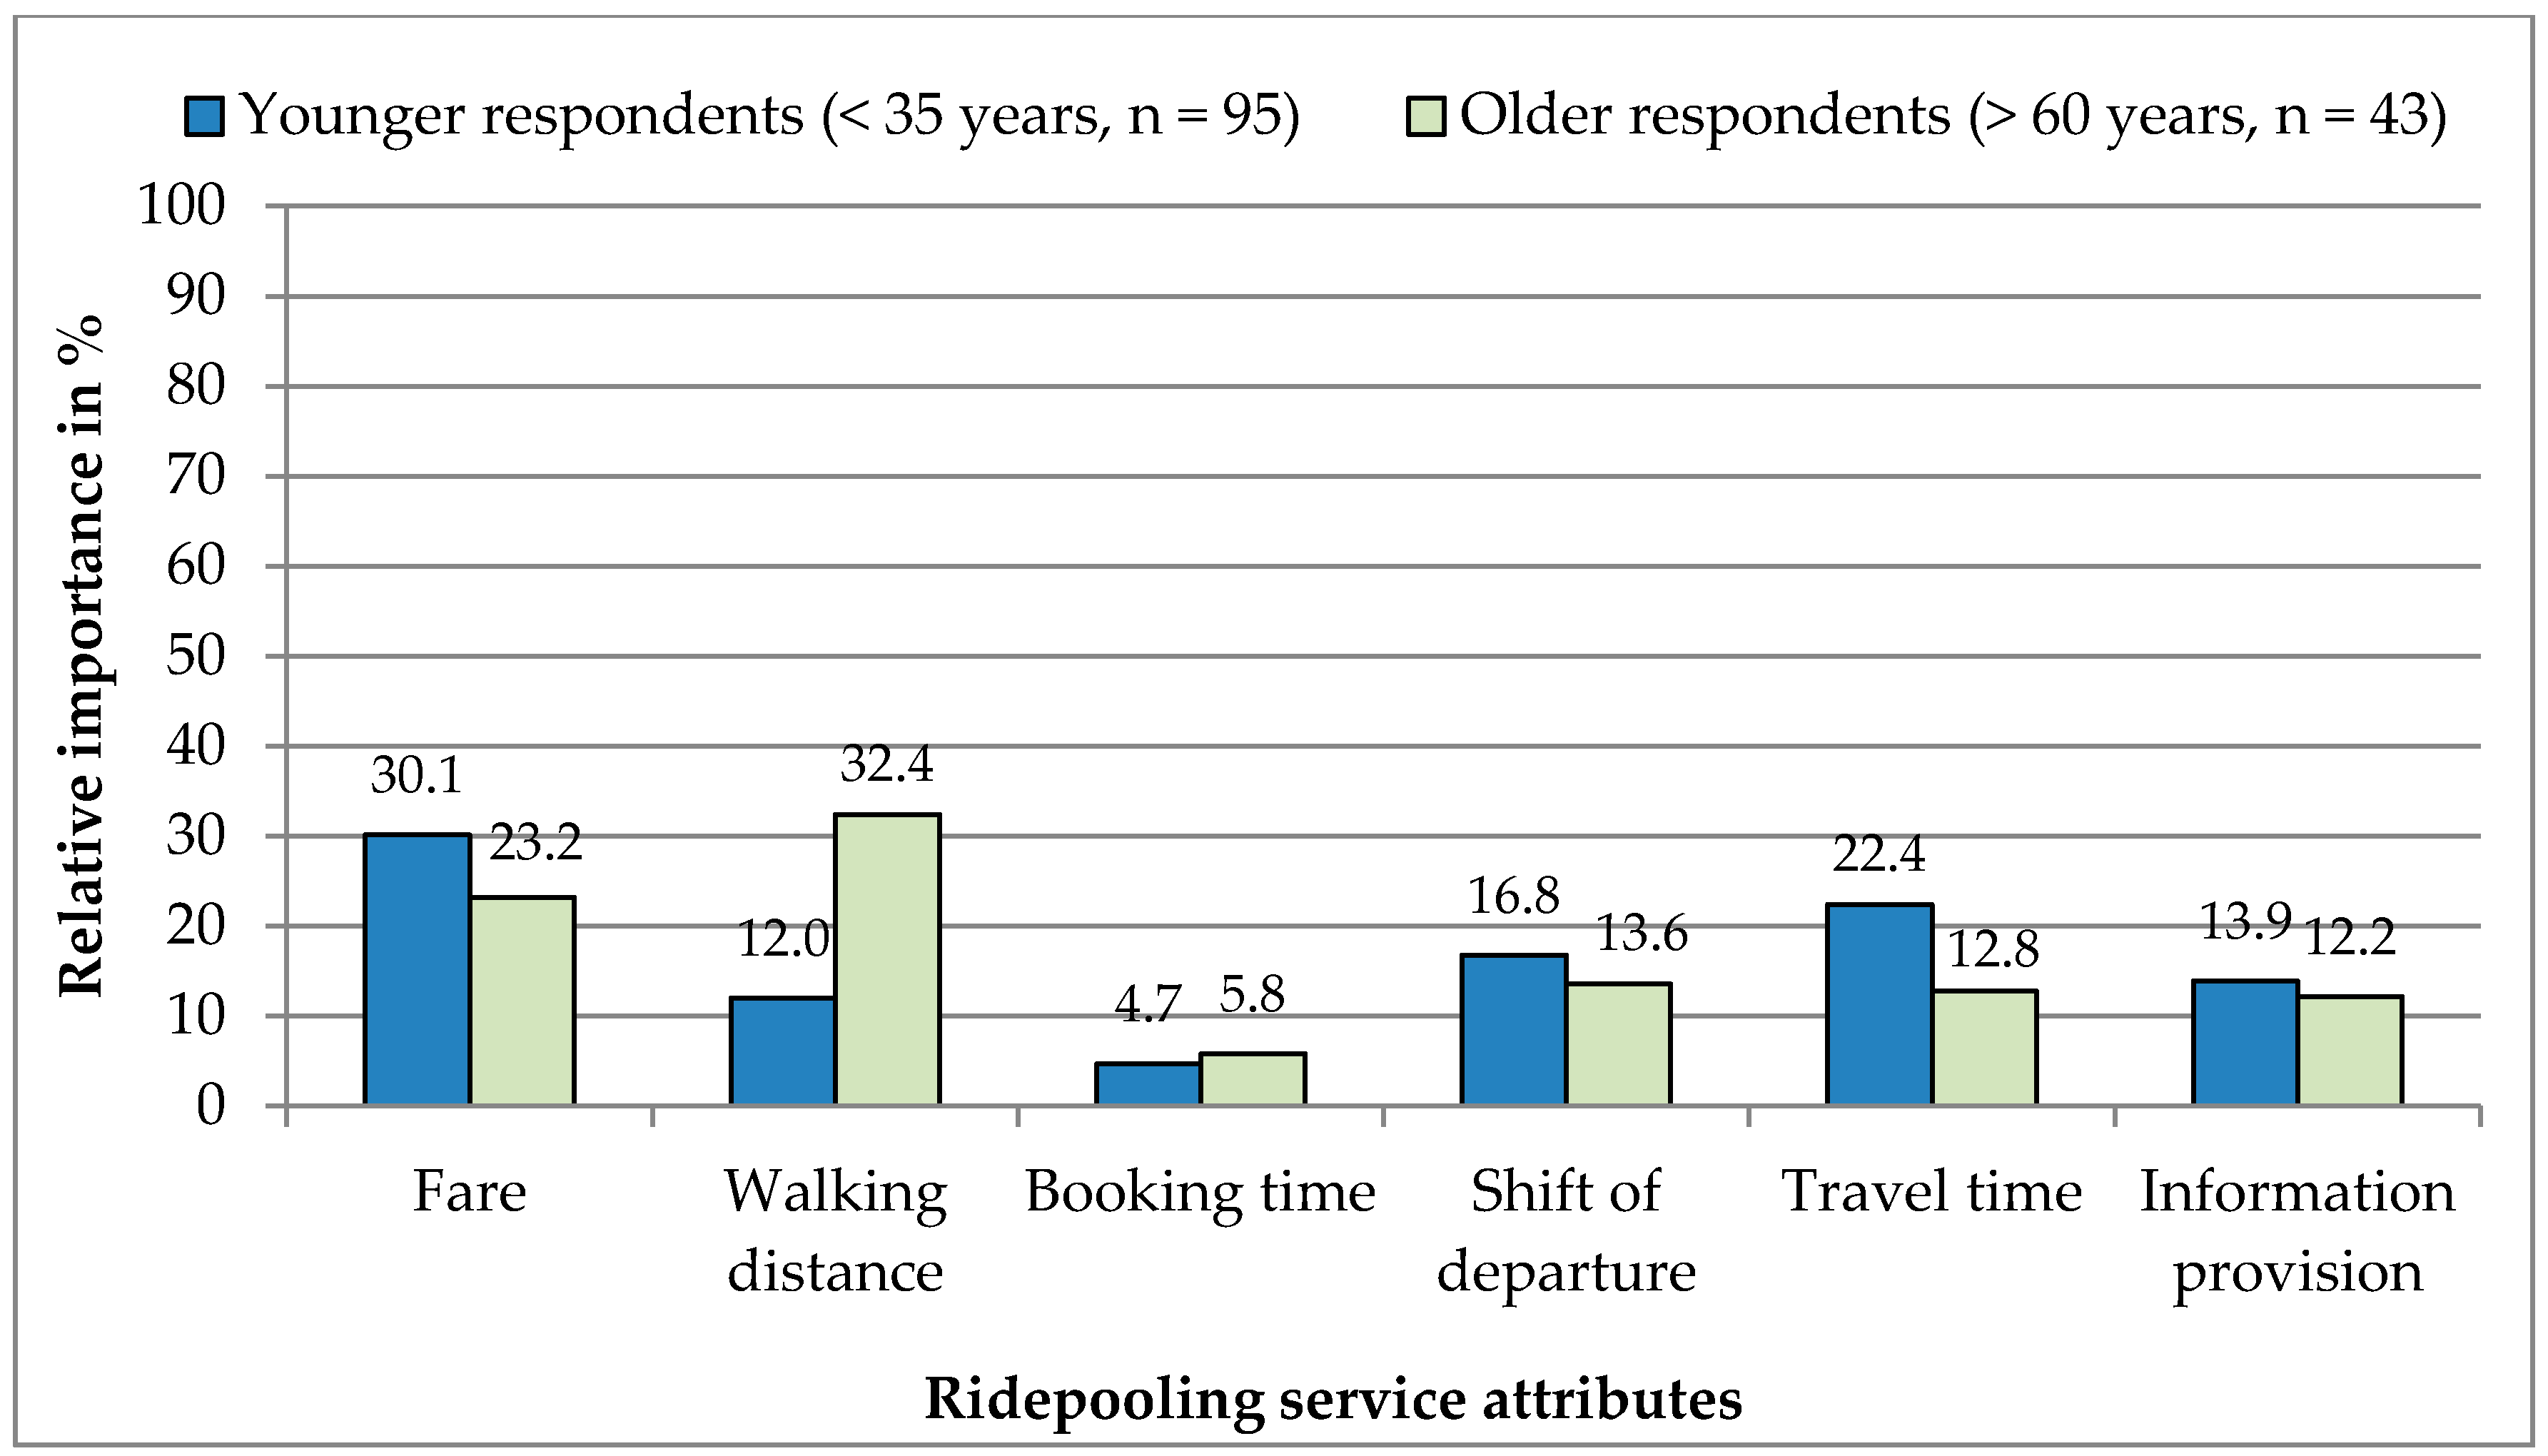
3.3. Results Comparing Age Groups
The utilities of the public ridepooling’s attributes were analyzed with regard to the age of the respondents. For examining the effect of age on the relative importance of the ridepooling service attributes, two extreme groups were defined: younger respondents aged less than 35 years (n = 95) and older respondents aged more than 60 years (n = 43). Figure 6 shows the relative importance of the six attributes for the two age groups. As presented here, the importance of the attributes varies widely between the two extreme age groups. Older respondents ascribe the highest importance to the attribute walking distance (34.9%). In contrast, younger respondents are far more attentive to the attributes fare (30.1%) and travel time (22.4%). Younger respondents (16.8%) are also more reactive to shifts of departure than older respondents (13.6%).
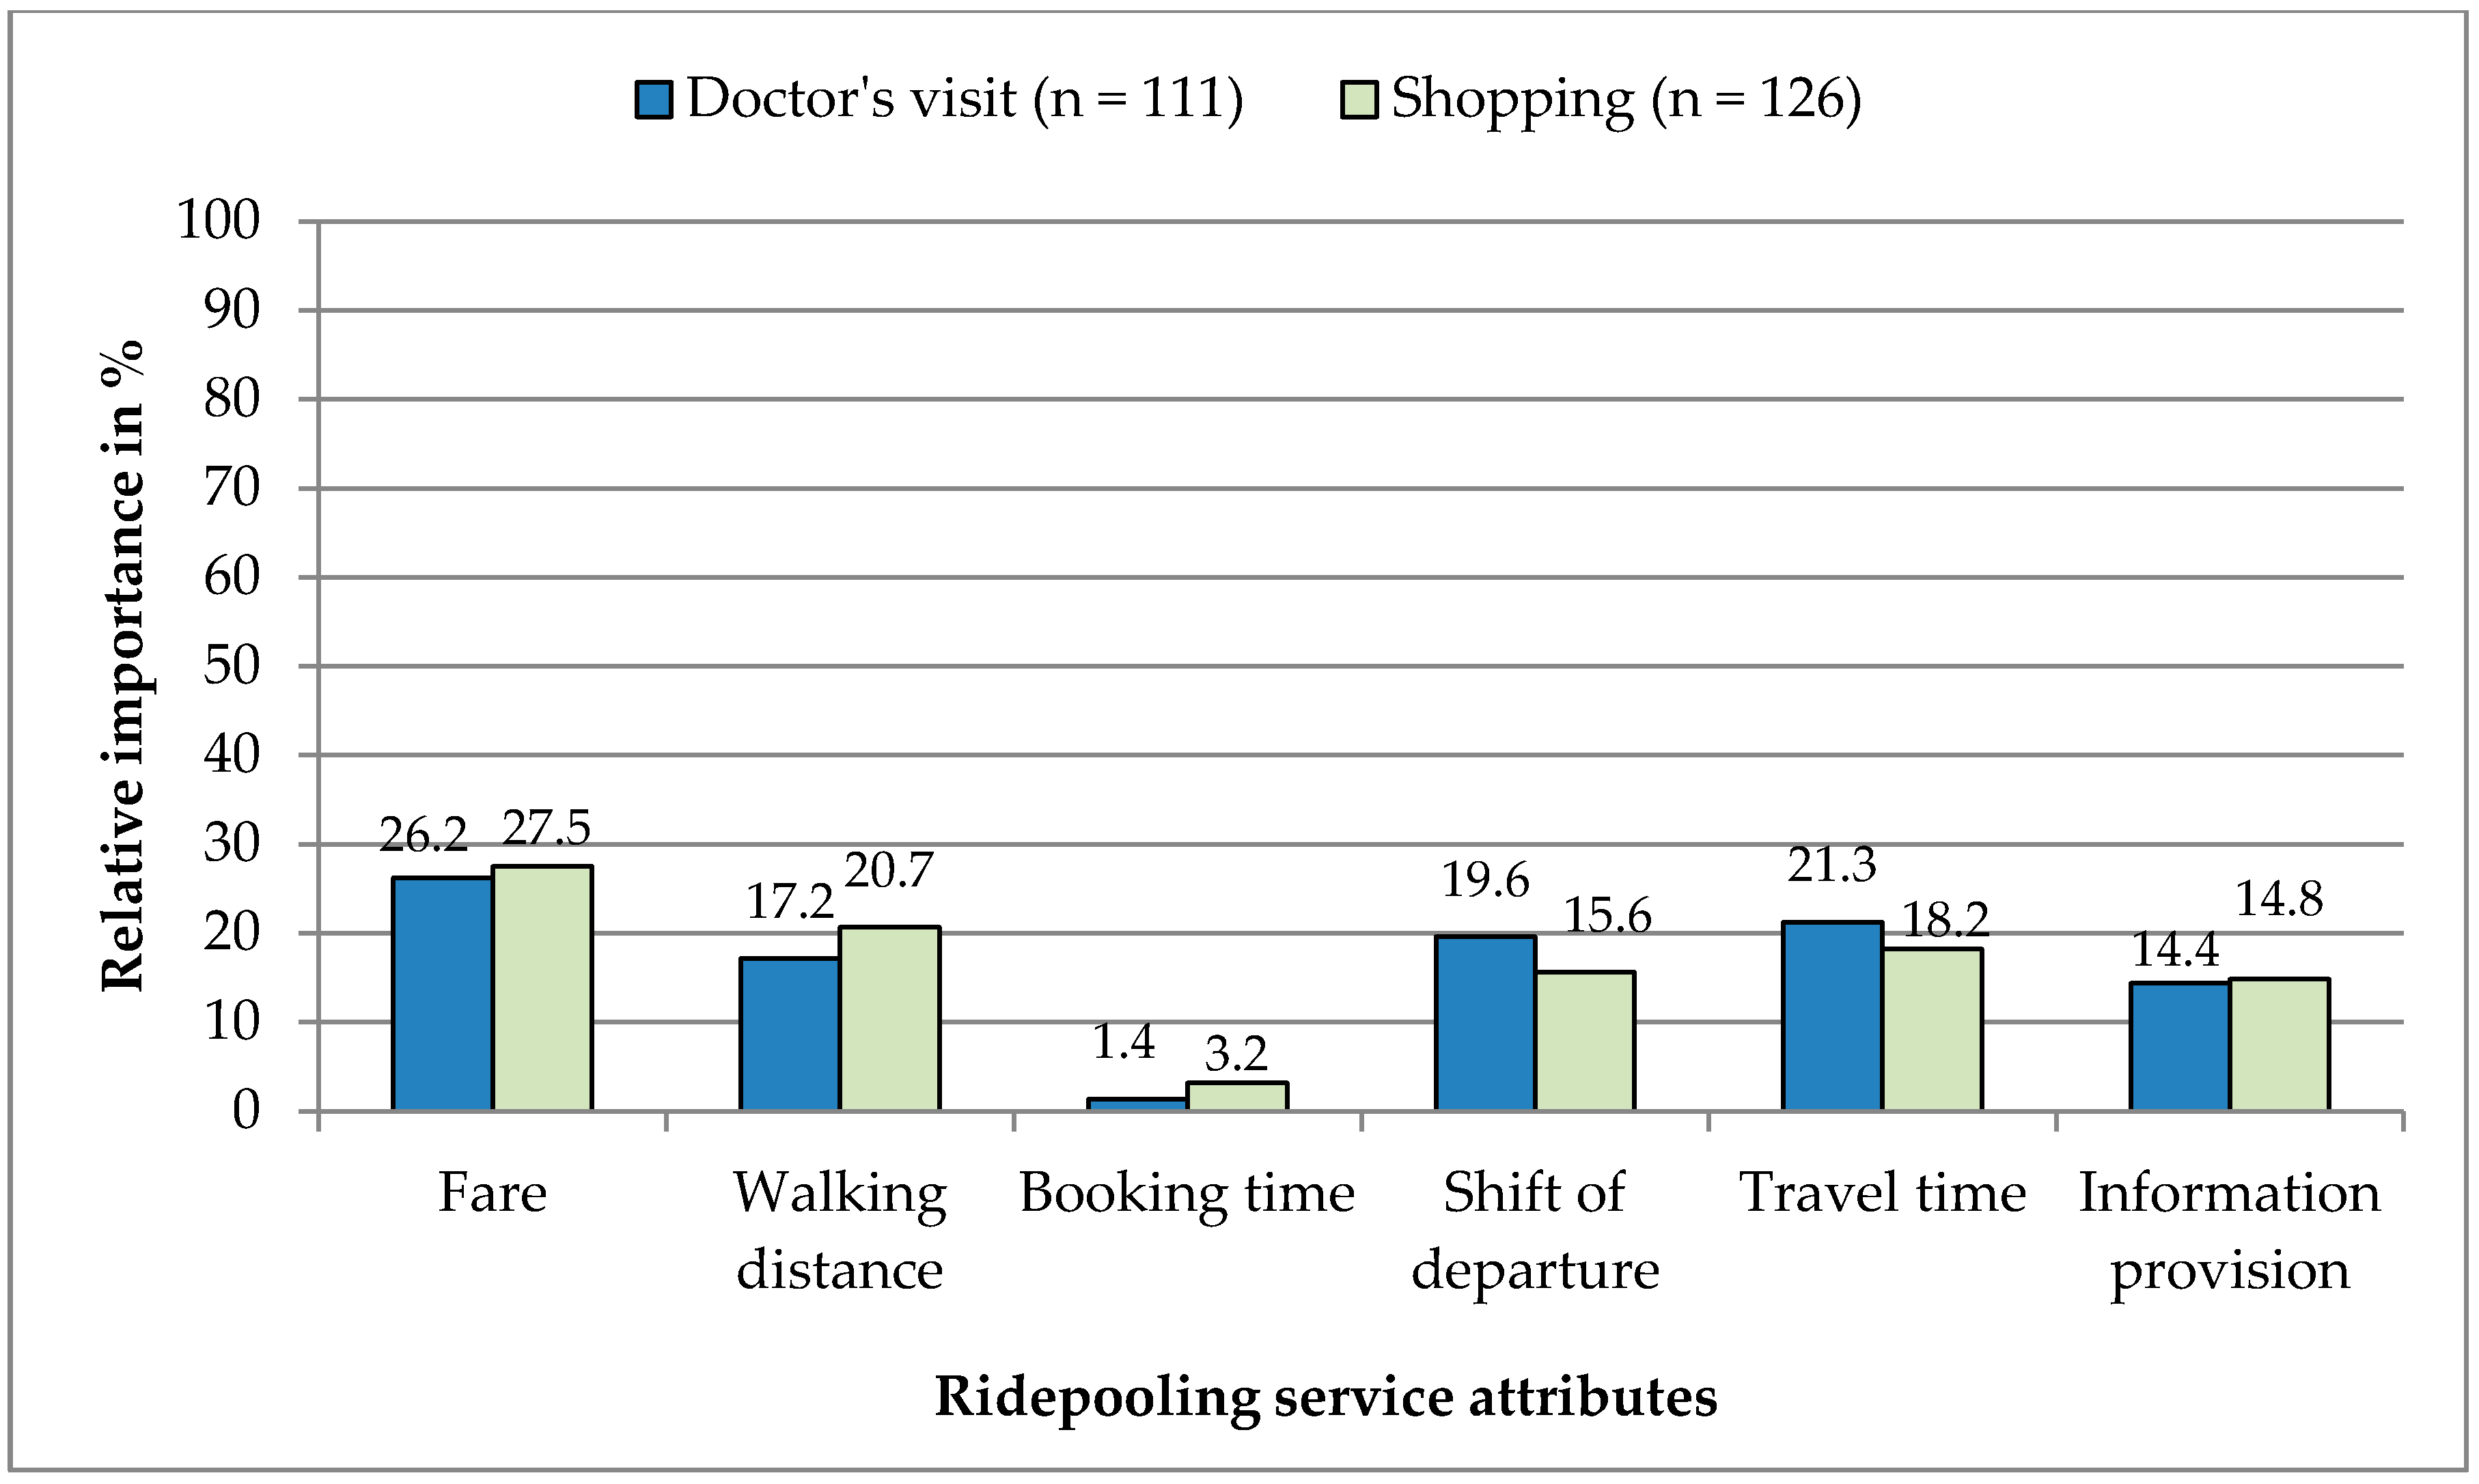
3.4. Results Comparing Trip Purpose
The utility of the ridepooling’s attributes was compared between two trip purposes: doctor’s visit and shopping. As shown in Figure 7, only small differences were revealed between the relative importances of the attributes according to trip purpose. Respondents who were instructed to imagine a doctor’s visit were more sensitive about a shift of departure (19.6%) than respondents who were facing the shopping scenario (15.6%). Respondents were slightly more attentive to fare and walking distance when the trip purpose was shopping.
4. Discussion
4.1. Summary and Interpretation of Results
As stated by the International Transport Forum [10], new shared transport systems should be of superior quality to the current public transport system to facilitate users’ adoption. Yet, it is still an unanswered question as to which service attributes of a ridepooling scheme contribute to its attractiveness. The presented study provided some interesting insights into the relevance of various ridepooling service attributes to travelers’ appraisal of ridepooling systems. First of all, the analysis demonstrated that it is worth going into detail when analyzing travelers’ choice behavior. While fare was the most important service attribute for the overall sample, this was especially true for younger participants. For the group of elderly respondents, walking distance turned out to be the most important attribute, whereas fare was of secondary importance. Thus, the results confirm the findings of previous research on the relevance of short walking distances and nearby bus stops for the elderly [19,46]. Hence, the question of which characteristics of ridepooling concepts are most important to users has a different answer depending on the target group. While younger respondents are more attentive to the fare, older respondents attach greater importance to the walking distance and thus would most likely prefer the door-to-door service that is a little bit more expensive or results in a longer journey. Hence, it could conceivably be hypothesized that older respondents are likely to accept a trade-off of travel time and fare for door-to-door service.
The results revealed that respondents seem to be highly attentive to shifts of departure caused by the previous entry or exit of other passengers. This is especially the case for younger respondents who under shifts of departure reacted very sensitively to the prolongation of travel time. Thus, further research should address the question of what extent of detour caused by the access and egress of other passengers is still acceptable to the travelers. Furthermore, the findings underline the relevance of a comprehensive information provision on the operational concept and the system-inherent service characteristics, like timely flexibility.
The results stressed the importance of the attribute information provision for the respondents’ appraisal of the ridepooling service concept which was previously confirmed in the field of ridesharing [47]. The findings indicate that travelers are very attentive to the provision of information on the ride since ridepooling systems lack fixed schedules and thus increase the information needs of travelers. Further research should address this topic by examining the travelers’ needs regarding comprehensive information provision on ride details like access points, the route, and the entry of fellow passengers. The importance of comprehensive information provision is further pointed out by the finding that more than one-third of the survey respondents declared that they do not know whether a ridepooling system exists in their city. This surprising finding might possibly be traced back to the novelty of ridepooling concepts in Germany and their low visibility. Thus, further research on the level of awareness of the urban population is needed in order to adapt marketing strategies.
Surprisingly, the attribute booking time was of subordinate relevance for the respondents. It seems like the possibility to book a ride on demand, meaning just a few moments before the desired departure time, is not particularly important to the respondents. A possible explanation for the limited importance of the attribute booking time might be that the respondents had difficulties understanding the explanation of the attribute. Since booking time is an unusual characteristic of public transport, the relevance of this attribute might be underestimated by the respondents. Interestingly, the attribute levels of booking time reached statistical significance when considering only the younger respondents who are said to be more experienced in booking mobility services. Accordingly, respondents who stated having used a ridepooling system before are more attentive to the booking time; this provides an indication for the hypothesis that unexperienced respondents in terms of ridepooling systems have difficulties in understanding the concept of booking a ride. Thus, the authors recommend a detailed analysis of the effect of booking time on the acceptance of ridepooling systems since the possibility to book a vehicle on demand is an essential characteristic of ridepooling schemes.
4.2. Limitations and Further Research Needs
In interpretation of the study findings, some restrictions of the study design and methodology should be taken into account. First of all, the study was limited to the analysis of urban residents’ appraisal of ridepooling service characteristics. Thus, all derived assumptions that go beyond this scope must be treated with caution.
It must be noted that the power of Conjoint Analysis depends heavily on the selection of the attributes and levels. Thus, the exclusion of relevant attributes might have impaired the explanatory power of the study. However, it can be assumed that the extensive literature review and the focus group that was carried out before the detailed analysis reduced the risk of missing relevant attributes as well as the risk of making an incorrect selection of attributes.
Furthermore, it should be noted that the scope of the findings is limited to the chosen scenarios. Thus, results are restricted to the particular trip types of 5 km distance concerning a doctor’s visit and a shopping trip in an urban environment. Further research could assess whether the findings are transferable to other trip types, like commuting trips.
Undoubtedly, the representativeness of survey participants must be questioned in earnest. A common limitation of online surveys lies in the self-selection of participants. To name one bias, the sample consisted of a higher share of well-educated people than occurs in the overall German population. For example, 100% of the respondents aged between 20 and 25 years held a qualification for university entrance, so-called Abitur, whereas in the German population, the share is 47.6% [48]. It should be noted that no data were collected about the particular cities the respondents lived in. Yet, the spatial structure of urban development and the existing public transport supply are commonly assumed to affect urban residents’ mobility choices [49,50]. Hence, no statements can be made about the effect of spatial urban structure nor public transport supply on the residents’ appraisal of ridepooling service characteristics. However, it is very likely that those environmental characteristics affected the respondents’ choices even though they were instructed to imagine the same usage scenario. Further research should consider environment-specific factors for contextualizing the findings.
There was no verification as to whether all respondents correctly understood the ridepooling concept and the meaning of its attributes. Even though none of the respondents stated having trouble understanding the ridepooling concept nor the attributes in the text field for further comments at the end of the survey, the actual comprehension rate is not known.
4.3. Recommendations for Policy, Transport Authorities, and City Planning
Based on the results of the Conjoint Analysis, several recommendations with practical relevance for policy as well as for transport and city planning authorities can be derived to enhance public mobility in cities by operating ridepooling systems that meet the requirements of different user groups:
- Walking distance to the pick-up points of the ridepooling service should be as short as possible, especially in city districts with a high average age. If possible, a door-to-door service should be offered. In contrast, in districts with a high share of students or low-income earners, the density of pick-up points could be lower to allow lower fares.
- In order to avoid notable shifts of departure, transport agencies should aim to provide a high availability of vehicles, especially in areas with high demand, like the city center.
- A large shift of departure should be avoided for trip purposes with a fixed appointment like a doctor’s visit or a train departure to ensure connection.
- To guarantee seamless interchanges between ridepooling systems and means of public transport, these connections should be taken into consideration for routing and should be prioritized.
- The fare should be set as low as possible to position public transport as an eco-friendly competitor for motorized individual transport. If possible, the pricing scheme of public ridepooling services should be integrated into the local tariff of public transport to facilitate intermodal trip chains [51].
- It should be possible to use monthly tickets and student tickets for the ridepooling system. In this way, the integration of the ridepooling service into fixed-schedule transport could be facilitated and public transport could be complemented.
- Avoid excessive travel times by limiting the maximum detour to an acceptable, still-to-be-defined level to reach a reasonable fit that describes a state in which the benefits of sharing the ride are greater than the costs of the detour [53].
By taking these recommendations into account, new ridepooling systems could be made more appealing and could thus increase residents’ willingness to use ridepooling systems. The study gives some advice on how to design ridepooling systems in such a way that users are willing to share rides, which is an important objective of transport planning, in order to increase vehicle occupancy rate [5]. Regarding the findings, ridepooling systems should aim to limit the travel time and shift of departure caused by the access and egress of other passengers to compete with nonshared transportation services like taxi cabs or Uber (except UberPool, which aims to pool rides). Increasing the attractiveness of shared mobility concepts is considered to be important as nonshared on-demand transportation services, also called ridehailing, have the potential to cannibalize public transport in cities: there is some evidence that those services negatively impact transit use [4]. On the contrary, new mobility system that are based on sharing rides might complement public transport [9] and could make an important contribution to the improvement of sustainable cities [8,10,11,12,13]. The results suggest that fare might be a powerful measure to encourage travelers to use ridepooling services. A potential strategy for rewarding travelers that share rides might be to offer shared rides that are cheaper than individual rides, as realized at MyTaxiMatch in Hamburg [54]. However, further research is needed to examine the willingness to pay for shared rides and to define the size of discount that is needed to make the shared ride more attractive than the nonshared ride. The authors would further like to encourage research on the analysis of service attributes besides pricing that might contribute to increasing travelers’ willingness to share rides with strangers. Possibly, other incentive strategies like gamification might prove useful in encouraging travelers to use ridesharing schemes. Furthermore, the analysis of attributes that were not included in this study like vehicle cleanliness and the number of other passengers might be an interesting starting point for further research.
5. Conclusions
To conclude, the results of the study provide insights into the subjective relevance of attributes that affect urban travelers’ appraisal of ridepooling systems. The results show that the attributes fare, travel time, and walking distance affect the respondents’ choice behavior the most. However, it is worth going into detail since the relative importance of the attributes differs among the age groups under consideration. The results give guidance for the creation of a user-centered public transport system that meets the requirements of the prospective passengers and thus might contribute to the development of shared passenger transport systems for sustainable public mobility in cities.
Author Contributions
The individual responsibilities and contributions of the authors are listed as follows: Conceptualization, A.K. and J.G.; Methodology, A.K., T.B. and J.G.; Formal Analysis, A.K. and T.B.; Investigation, A.K. and T.B.; Resources, J.G.; Writing—Original Draft Preparation, A.K. and T.B.; Writing—Review & Editing, A.K., T.B. and J.G.; Visualization, A.K.; Supervision, J.G.; Project Administration, A.K.
Funding
This research received no external funding.
Conflicts of Interest
The authors declare no conflict of interest.
References
- Cornet, A.; Mohr, D.; Weig, F.; Zerlin, B.; Hein, A.-P. Mobility of the future. In Opportunities for Automotive OEMs; Research Report; McKinsey & Company: New York, NY, USA, 2012. [Google Scholar]
- Han, Y.; Li, W.; Wei, S.; Zhang, T. Research on Passenger’s Travel Mode Choice Behavior Waiting at Bus Station Based on SEM-Logit Integration Model. Sustainability 2018, 10, 1996. [Google Scholar] [CrossRef]
- Henao, A. Impacts of Ridesourcing -LYFT and UBER- on Transportation including VMT, Mode Replacement, Parking and Travel Behavior. Ph.D. Thesis, University of Colorado, Denver, CO, USA, 2017. [Google Scholar]
- Babar, Y.; Burtch, G. Examining the Impact of Ridehailing Services on Public Transit Use. Available online: https://papers.ssrn.com/sol3/papers.cfm?abstract_id=3042805 (accessed on 18 July 2018).
- Tirachini, A.; Gomez-Lobo, A. Does Ridesourcing Increase or Decrease Vehicle Kilometers Traveled (VKT)? A Simulation Approach for the Case of Santiago, Chile; Working Paper; Econ Uchile Publications: Santiago, Chile, 2017. [Google Scholar]
- Shaheen, S.; Cohen, A. Shared Mobility Policy Briefs: Definitions, Impacts, and Recommendations; UC Berkeley ITS Reports No. UC-ITS-RR-2017-11; ITS Berkeley: Berkeley, CA, USA, 2018. [Google Scholar]
- Via Transportation. Welcome to Via. We Ride Together. Homepage Via Transportation. Available online: https://ridewithvia.com/ (accessed on 29 November 2017).
- Alonso-Mora, J.; Samaranayake, S.; Wallar, A.; Frazzoli, E.; Rus, D. On-demand high-capacity ride-sharing via dynamic trip-vehicle assignment. Proc. Natl. Acad. Sci. USA 2017, 114, 462–467. [Google Scholar] [CrossRef] [PubMed] [Green Version]
- Feigon, S.; Murphy, C. Shared Mobility and the Transformation of Public Transit; TCRP Research Report 188; The National Academy Press: Washington, DC, USA, 2016. [Google Scholar] [CrossRef]
- ITF—International Transport Forum. Shared Mobility. Innovation for Liveable Cities; Corporate Partnership Board Report; OECD: Paris, France, 2016. [Google Scholar]
- Martinez, L.M.; Correia, G.H.A.; Viegas, J.M. An agent-based simulation model to assess the impacts of introducing a shared-taxi system: An application to Lisbon (Portugal). J. Adv. Transp. 2015, 49, 475–495. [Google Scholar] [CrossRef]
- Pakusch, C.; Stevens, G.; Boden, A.; Bossauer, P. Unintended Effects of Autonomous Driving: A Study on Mobility Preferences in the Future. Sustainability 2018, 10, 2404. [Google Scholar] [CrossRef]
- Friedrich, M.; Hartl, M. MEGAFON—Modellergebnisse geteilter autonomer Fahrzeugflotten des oeffentlichen Nahverkehrs; Final Report; University of Stuttgart: Stuttgart, Germany, 2016. [Google Scholar]
- Fagnant, D.J.; Kockelman, K.M. The travel and environmental implications of shared autonomous vehicles, using agent-based model scenarios. Transp. Res. Part C Emerg. Technol. 2014, 40, 1–13. [Google Scholar] [CrossRef]
- Brandies, A.; König, A.; Viergutz, K.; Fraedrich, E.; Gebhardt, L.; Ulmer, F.; Sippel, T.; Dotzauer, M. Transdisziplinäre Mobilitätsforschung unter Verwendung von Reallaboren: Integration von Stakeholderbedürfnissen und -Anforderungen in die Entwicklung von Systemen Bedarfsorientiert und Vollautomatisiert Fahrender Quartiersbusse; Paper presented at 18; Braunschweiger Symposium AAET 2017; Automatisiertes und vernetztes Fahren: Braunschweig, Germany, 2017. [Google Scholar]
- Rogers, E.M. Diffusion of Innovations, 5th ed.; Free Press: New York, NY, USA, 2003; ISBN 0743222091. [Google Scholar]
- Beirão, G.; Cabral, J.A.S. Understanding attitudes towards public transportation and private car: A qualitative study. Transp. Policy 2007, 14, 478–489. [Google Scholar] [CrossRef]
- Bourgeat, P. A revealed/stated preference approach to bus service configuration. Transp. Res. Procedia 2015, 6, 411–423. [Google Scholar] [CrossRef]
- Jianrong, L.; Wei, D.; Bing, Z. Conjoint analysis based transit service quality research. J. Transp. Syst. Eng. Inf. Technol. 2011, 11, 97–102. [Google Scholar] [CrossRef]
- De Oña, J.; De Oña, R.; Eboli, L.; Mazzulla, G. Perceived service quality in bus transit service: A structural equation approach. Transp. Policy 2013, 29, 219–226. [Google Scholar] [CrossRef]
- Hensher, D.A. Stated preference analysis of travel choices: The state of practice. Transportation 1994, 21, 107–133. [Google Scholar] [CrossRef]
- König, A.; Bonus, T.; Grippenkoven, J. Modelling travelers’ appraisal of ridepooling’s service characteristics. Transp. Policy 2018. in review. [Google Scholar]
- Brake, J.; Mulley, C.; Nelson, J.D.; Wright, S. Key lessons learned from recent experience with flexible transport services. Transp. Policy 2007, 14, 458–466. [Google Scholar] [CrossRef]
- Finn, B.; Ferrari, A.; Sassoli, P. Goals, requirements and needs of users. In Demand Responsive Transport Services. Towards the Flexible Mobility Agency; Ambrosino, G., Nelson, J.D., Romanazzo, M., Eds.; Enea: Rome, Italy, 2004; pp. 33–54. ISBN 88-8286-043-4. [Google Scholar]
- KFH Group. Guidebook for Measuring, Assessing, and Improving Performance of Demand-Response Transportation; Transit Cooperative Research Program Reports; Transportation Research Board: Washington, DC, USA, 2008; Volume 124. [Google Scholar]
- Kahrs, C. Erlösorientierte Produktgestaltung von Anrufbussystemen unter Anwendung der Conjoint-Analyse. In Verkehrssystem- und Mobilitätsmanagement im Ländlichen Raum; Kagermeier, A., Ed.; Studien zur Mobilitäts- und Verkehrsforschung: Mannheim, Germany, 2004; pp. 391–404. [Google Scholar]
- Takeuchi, R.; Nakamura, F.; Okura, I.; Hiraishi, H. Feasibility study on demand responsive transport systems. J. East. Asia Soc. Transp. Stud. 2003, 5, 388–397. [Google Scholar]
- König, A.; Grippenkoven, J. The Actual Demand behind Demand-Responsive Transport: Applying the Unified Theory of Acceptance and Use of Technology to Explain Usage Intentions of Demand-Responsive Bus Services. Transp. Geography 2018. in review. [Google Scholar]
- Nelson, J.D.; Phonphitakchai, T. An evaluation of the user characteristics of an open access DRT service. Res. Transp. Econ. 2012, 34, 54–65. [Google Scholar] [CrossRef]
- Specht, M. Raumbezogene Marktanalyse innovativer und geteilter Mobilitätsangebote. Bachelor’s Thesis, Ruhr-Universität Bochum, Bochum, Germany, 2018. [Google Scholar]
- Louviere, J.J.; Hensher, D.A.; Swait, J. Stated Choice Methods: Analysis and Applications in Marketing, Transportation and Environmental Valuation; Cambridge University Press: Cambridge, UK, 2000; ISBN 0521782759. [Google Scholar]
- Hair, J.F.; Black, W.; Babin, B.J.; Anderson, R.A. Conjoint Analysis. In Multivariate Data Analysis, 7th ed.; Pearson: London, UK, 2010; pp. 342–413. ISBN 0138132631. [Google Scholar]
- Backhaus, K.; Erichson, B.; Weiber, R. Auswahlbasierte Conjoint- Analyse. In Fortgeschrittene Multivariate Analysemethoden; Backhaus, K., Erichson, B., Weiber, R., Eds.; Springer Gabler: Berlin/Heidelberg, Germany, 2015; pp. 175–292. ISBN 978-3-662-46087-0. [Google Scholar]
- Cohen, S.H. Perfect Union: CBCA Marries the Best of Conjoint and Discrete Choice Models. Mark. Res. 1997, 9, 12–17. [Google Scholar]
- Bahamonde-Birke, F.J.; Navarro, I.; de Dios Ortúzar, J. If you choose to not decide, you still have made a choice. J. Choice Model. 2017, 22, 13–23. [Google Scholar] [CrossRef]
- Rao, V.R. Choice Based Conjoint Studies: Design and Analysis. In Applied Conjoint Analysis; Rao, V.R., Ed.; Springer: Berlin/Heidelberg, Germany, 2014; pp. 127–183. ISBN 978-3-540-87753-0. [Google Scholar]
- Kløjgaard, M.E.; Bech, M.; Søgaard, R. Designing a stated choice experiment: The value of a qualitative process. J. Choice Model. 2012, 5, 1–18. [Google Scholar] [CrossRef]
- Morrison, M.; Bennett, J.W.; Blamey, R.K. Designing Choice Modelling Surveys Using Focus Groups: Results from the Macquarie Marshes and Gwydir Wetlands Case Studies; Choice Modelling Research Report No. 5; The University of New South Wales: Canberra, Australia, 1997. [Google Scholar]
- Omre, B. Formulating Attributes and Levels in Conjoint Analysis; Sawtooth Software Research Paper Series; Sawtooth Software: Sequim, WA, USA, 2012. [Google Scholar]
- Weiber, R.; Mühlhaus, D. Auswahl von Eigenschaften und Ausprägungen bei der Conjointanalyse. In Conjointanalyse; Baier, D., Brusch, M., Eds.; Springer: Berlin/Heidelberg, Germany, 2009; pp. 43–58. ISBN 978-3-642-00754-5. [Google Scholar]
- Aizaki, H.; Nishimura, K. Design and analysis of choice experiments using R: A brief introduction. Agric. Inf. Res. 2008, 17, 86–94. [Google Scholar] [CrossRef]
- Leiner, D.J. SoSci Survey (Version 2.5.00-i). Computer Software. Available online: https://www.soscisurvey.de (accessed on 24 March 2018).
- IBM Analytics. SPSS Software. Available online: https://www.ibm.com/analytics/de/de/technology/spss/ (accessed on 7 January 2018).
- Guadagni, P.M.; Little, J.D. A logit model of brand choice calibrated on scanner data. Mark. Sci. 1983, 2, 203–238. [Google Scholar] [CrossRef]
- Ben-Akiva, M.E.; Lerman, S.R. Discrete Choice Analysis: Theory and Application to Travel Demand; Series in Transportation Studies; MIT Press: Cambridge, UK, 1985; ISBN 9780262022170. [Google Scholar]
- Tyrinopoulos, Y.; Antoniou, C. Public transit user satisfaction: Variability and policy implications. Transp. Policy 2008, 15, 260–272. [Google Scholar] [CrossRef]
- Wilkowska, W.; Farrokhikhiavi, R.; Ziefle, M.; Vallèe, D. Mobility requirements for the use of carpooling among different user groups. In Proceedings of the 5th AHFE Conference, Krakow, Poland, 19–23 July 2014; pp. 129–140. [Google Scholar]
- Statistisches Bundesamt. Ergebnis 12211-0040. Bevölkerung (ab 15 Jahren): Deutschland, Jahre, Geschlecht. Altersgruppen, Allgemeine Schulausbildung. 2018. Available online: https://www-genesis.destatis.de/genesis/online/logon?sequenz=tabelleErgebnis&selectionname=12211-0040&transponieren=true (accessed on 27 July 2018).
- Tyrinopoulos, Y.; Antoniou, C. Factors affecting modal choice in urban mobility. Eur. Transp. Res. Rev. 2013, 5, 27–39. [Google Scholar] [CrossRef]
- De Jong, G.; Van de Riet, O. The driving factors of passenger transport. Eur. J. Transp. Infrastruct. Res. 2008, 8, 227–250. [Google Scholar]
- König, A.; Grippenkoven, J. From public mobility on demand to autonomous public mobility on demand -Learning from dial-a-ride services in Germany. In Logistik und Supply Chain Management; University of Bamberg Press: Bamberg, Germany, 2017; pp. 295–305. ISBN 978-3-86309-489-8. [Google Scholar]
- König, A.; Wegener, J.; Pelz, A.; Grippenkoven, J. Serious Games: A playful approach to reduce usage barriers of innovative public transport systems. In Proceedings of the 47th European Transport Conference, Barcelona, Spain, 24–26 May 2017; Available online: https://aetransport.org/en-gb/past-etc-papers/conference-papers-2017 (accessed on 18 July 2018).
- Geisberger, R.; Luxen, D.; Sanders, P.; Neubauer, S.; Volker, L. Fast detour computation for ride sharing. In Proceedings of the 10th Workshop on Algorithmic Approaches for Transportation Modeling, Optimization, and Systems (ATMOS’10), Liverpool, UK, 9 September 2010; pp. 88–99. [Google Scholar]
- Betzholz, D. Fremde Menschen Können sich Taxifahrten Künftig Teilen. Available online: https://www.welt.de/regionales/hamburg/article171206896/Fremde-Menschen-koennen-sich-Taxifahrten-kuenftig-teilen.html (accessed on 18 March 2018).
Figure 1.
Example of a choice set (translated from German).

Figure 2.
Graphical explanation of the levels of the attribute travel time, translated from German.

Figure 3.
Spatial distribution of the survey respondents in the states of Germany (n = 175, rest unknown).
Figure 3.
Spatial distribution of the survey respondents in the states of Germany (n = 175, rest unknown).

Figure 4.
Relative importance of public ridepooling service attributes for urban dwellers (N = 237).
Figure 4.
Relative importance of public ridepooling service attributes for urban dwellers (N = 237).

Figure 5.
Relative importance of ridepooling service attributes compared for respondents with and without ridepooling experience.
Figure 5.
Relative importance of ridepooling service attributes compared for respondents with and without ridepooling experience.

Figure 6.
Relative importance of ridepooling service attributes compared for younger and older participants.
Figure 6.
Relative importance of ridepooling service attributes compared for younger and older participants.

Figure 7.
Relative importance of ridepooling service attributes according to trip purpose.


Table 1.
Attributes and contributing levels.
| Attributes | Levels | |||
|---|---|---|---|---|
| Level 1 | Level 2 | Level 3 | Level 4 | |
| Time of booking | 5 min | 10 min | 30 min | |
| Walking distance | 0 m | 300 m | 500 m | |
| Shift of departure time | +0 min | +10 min | +20 min | |
| Travel time | 10 min | 20 min | 30 min | |
| Information provision | None | Little | Much | |
| Fare | 2.50€ | 3.00€ | 3.50€ | 4.00€ |
Table 2.
Results of Cox regression.
| Attribute Level | Regression Coefficient | Standard Error | p-Value |
|---|---|---|---|
| Fare_2.50€ | 1.581 | 0.068 | <0.001 ** |
| Fare_3.00€ | 0.979 | 0.072 | <0.001 ** |
| Fare_3.50€ | 0.651 | 0.071 | <0.001 ** |
| Walking distance_0 m | 1.114 | 0.060 | <0.001 ** |
| Walking distance_300 m | 0.700 | 0.062 | <0.001 ** |
| Time of booking_5 min | 0.069 | 0.066 | 0.294 |
| Time of booking_10 min | 0.078 | 0.056 | 0.164 |
| Shift of departure_+0 min | 1.022 | 0.057 | <0.001 ** |
| Shift of departure _+10 min | 0.078 | 0.068 | <0.001 ** |
| Travel time_10 min | 1.151 | 0.067 | <0.001 ** |
| Travel time_20 min | 0.604 | 0.056 | <0.001 ** |
| Information_none | −0.925 | 0.063 | <0.001 ** |
| Information_little | −0.402 | 0.057 | <0.001 ** |
| None-of-these (ASC) | −1.645 | 0.099 | <0.001 ** |
Note. ** p < 0.01.
© 2018 by the authors. Licensee MDPI, Basel, Switzerland. This article is an open access article distributed under the terms and conditions of the Creative Commons Attribution (CC BY) license (http://creativecommons.org/licenses/by/4.0/).
Share and Cite
MDPI and ACS Style
König, A.; Bonus, T.; Grippenkoven, J. Analyzing Urban Residents’ Appraisal of Ridepooling Service Attributes with Conjoint Analysis. Sustainability 2018, 10, 3711. https://doi.org/10.3390/su10103711
AMA Style
König A, Bonus T, Grippenkoven J. Analyzing Urban Residents’ Appraisal of Ridepooling Service Attributes with Conjoint Analysis. Sustainability. 2018; 10(10):3711. https://doi.org/10.3390/su10103711
Chicago/Turabian StyleKönig, Alexandra, Tabea Bonus, and Jan Grippenkoven. 2018. "Analyzing Urban Residents’ Appraisal of Ridepooling Service Attributes with Conjoint Analysis" Sustainability 10, no. 10: 3711. https://doi.org/10.3390/su10103711
Note that from the first issue of 2016, this journal uses article numbers instead of page numbers. See further details here.